
Effect of Quadrature Control Mode on ZRO Drift of MEMS Gyroscope and Online Compensation Method


Abstract
:1. Introduction
2. Gyroscope Dynamic Model with Structural Error
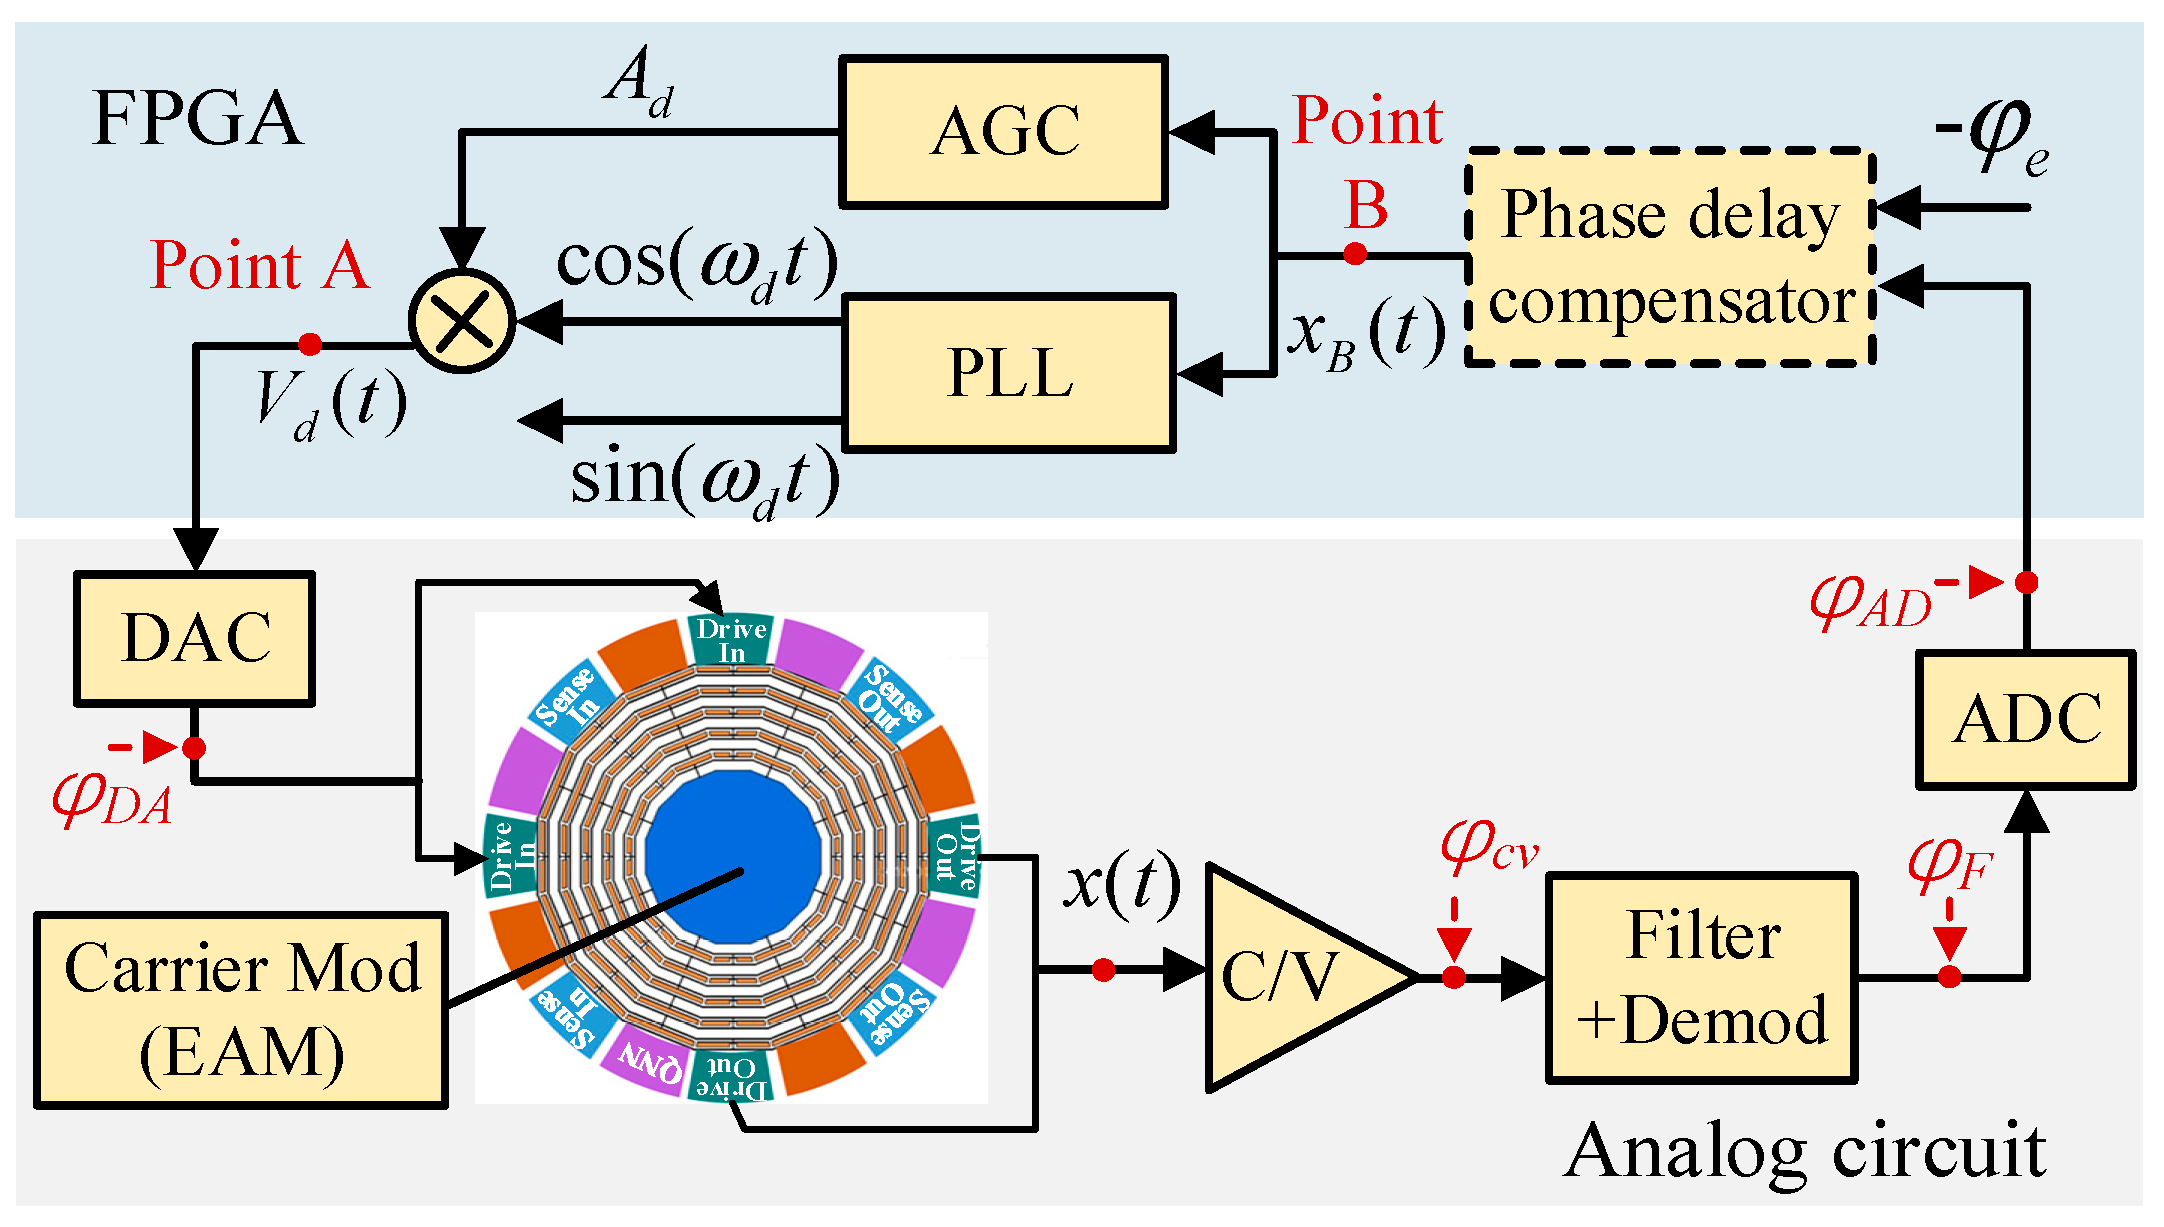
3. Closed-Loop Control of Drive Mode
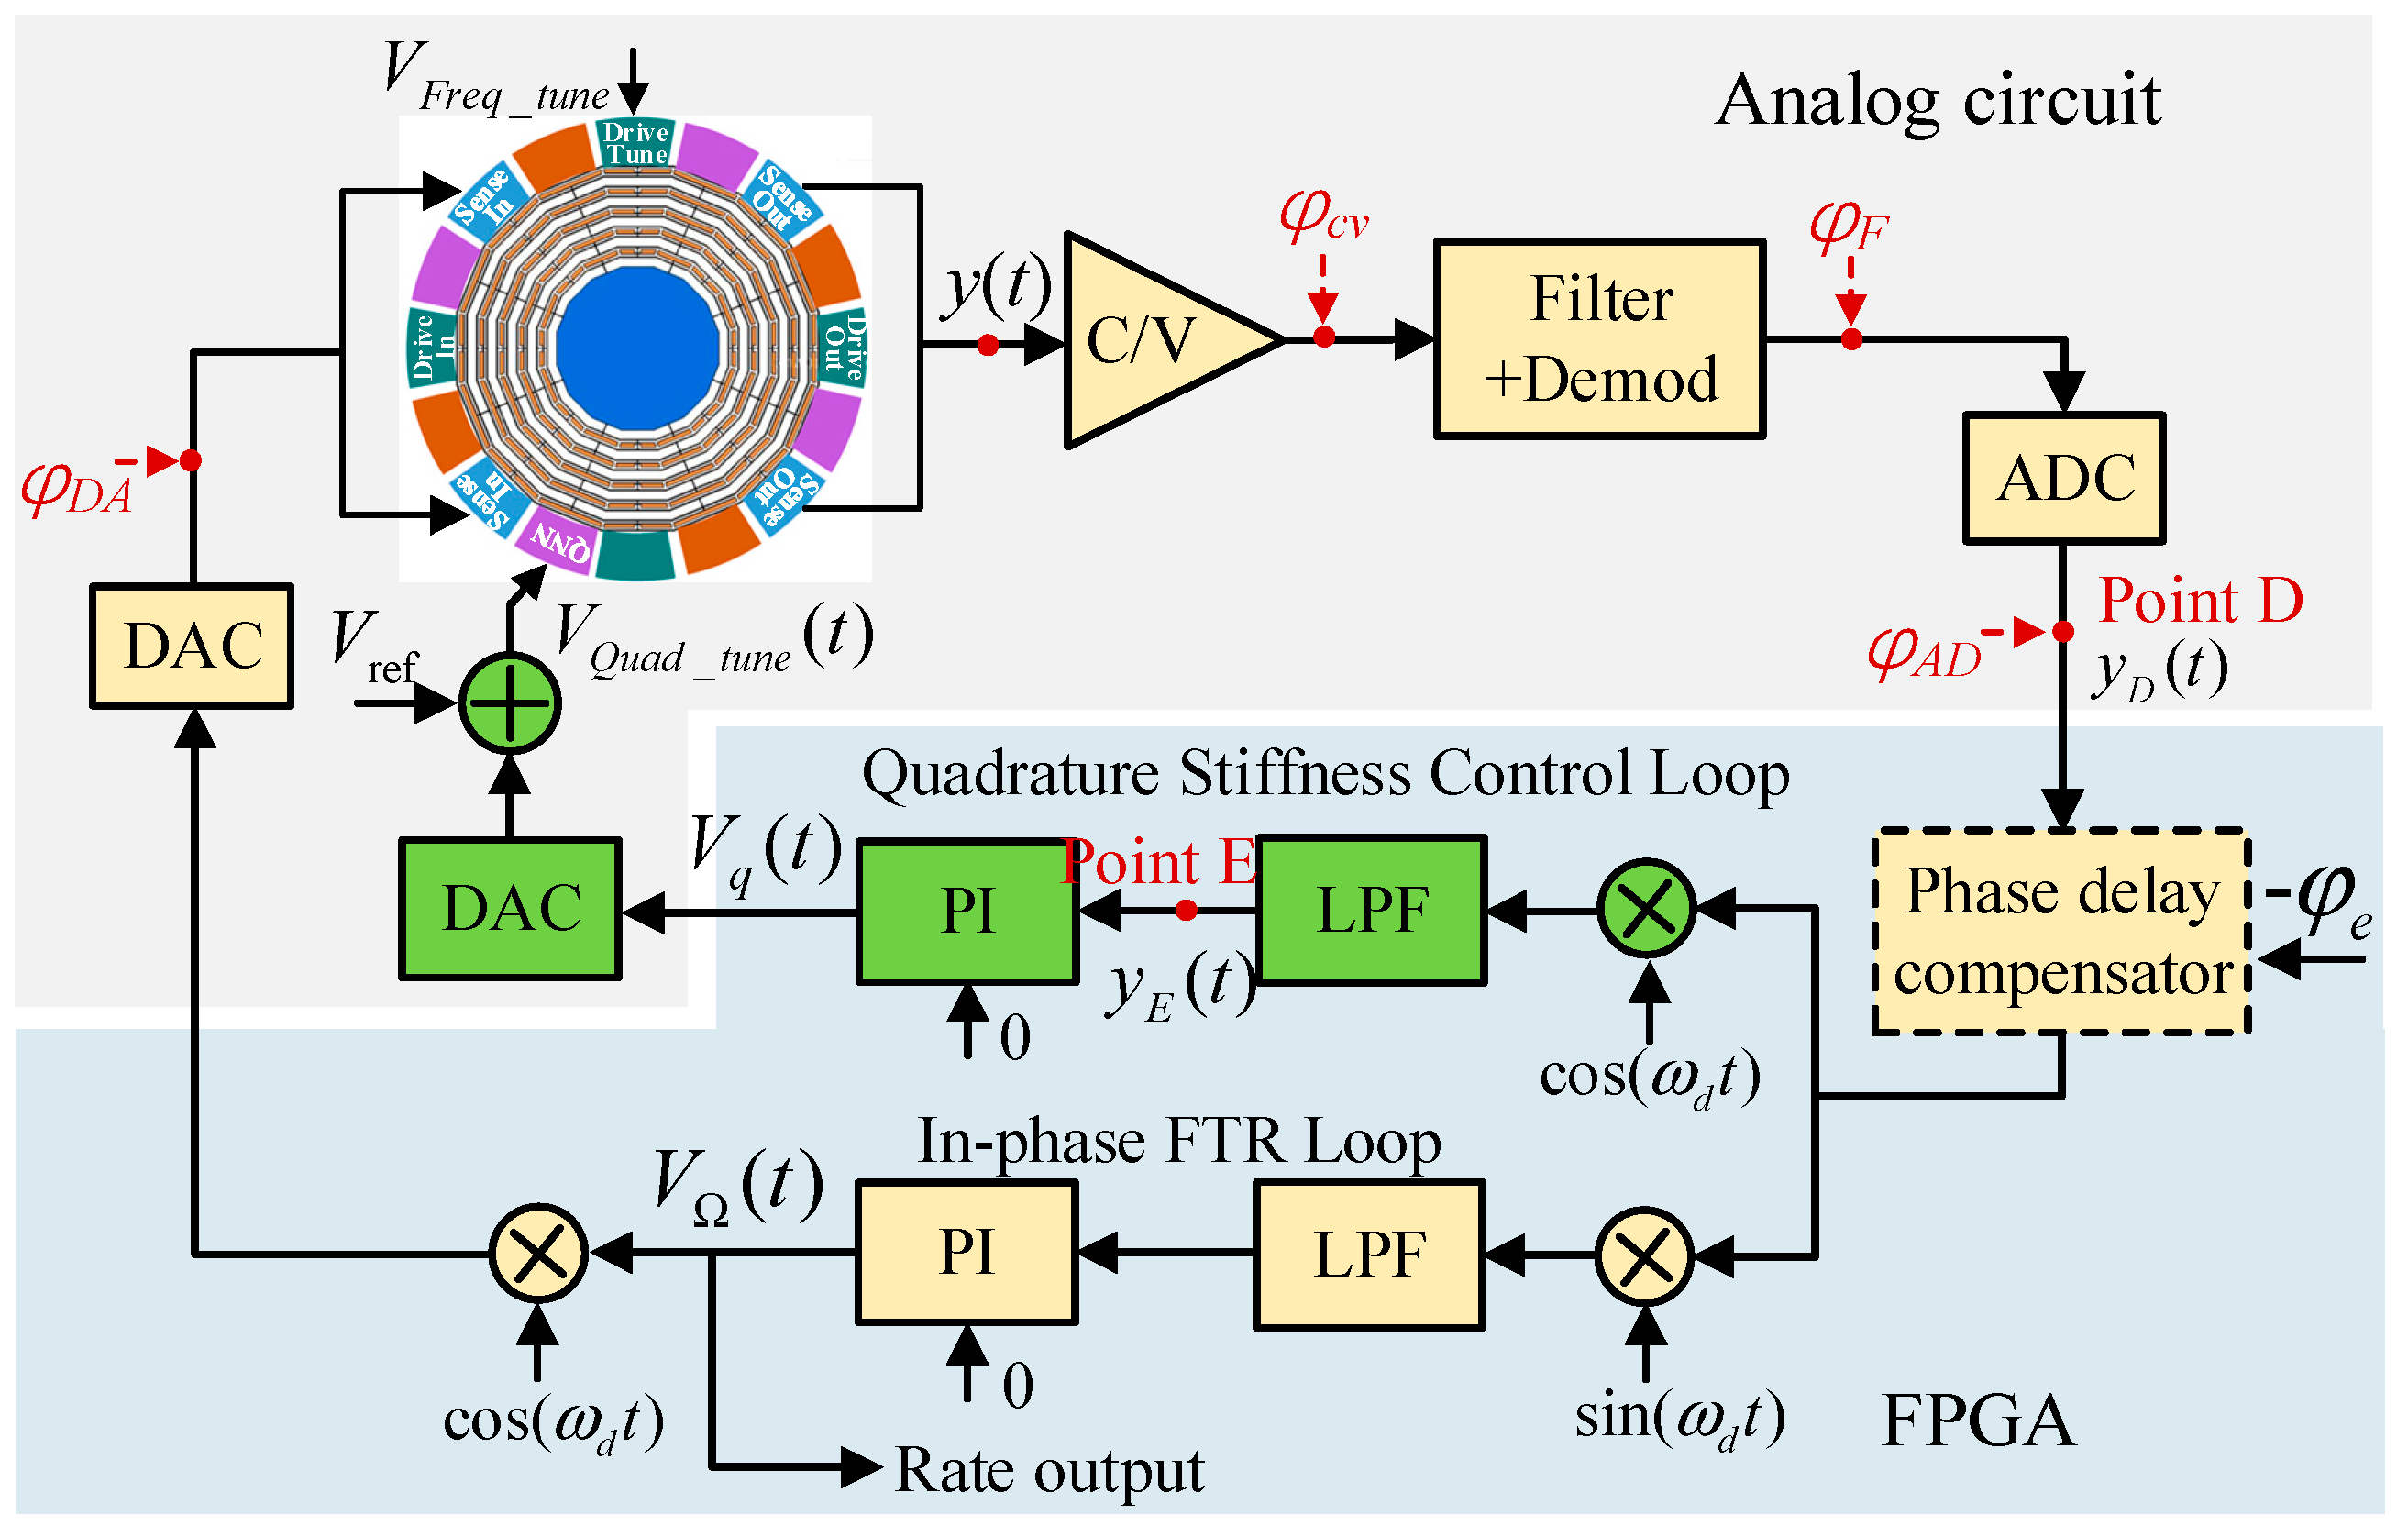
4. Closed-Loop Control of the Sense Mode
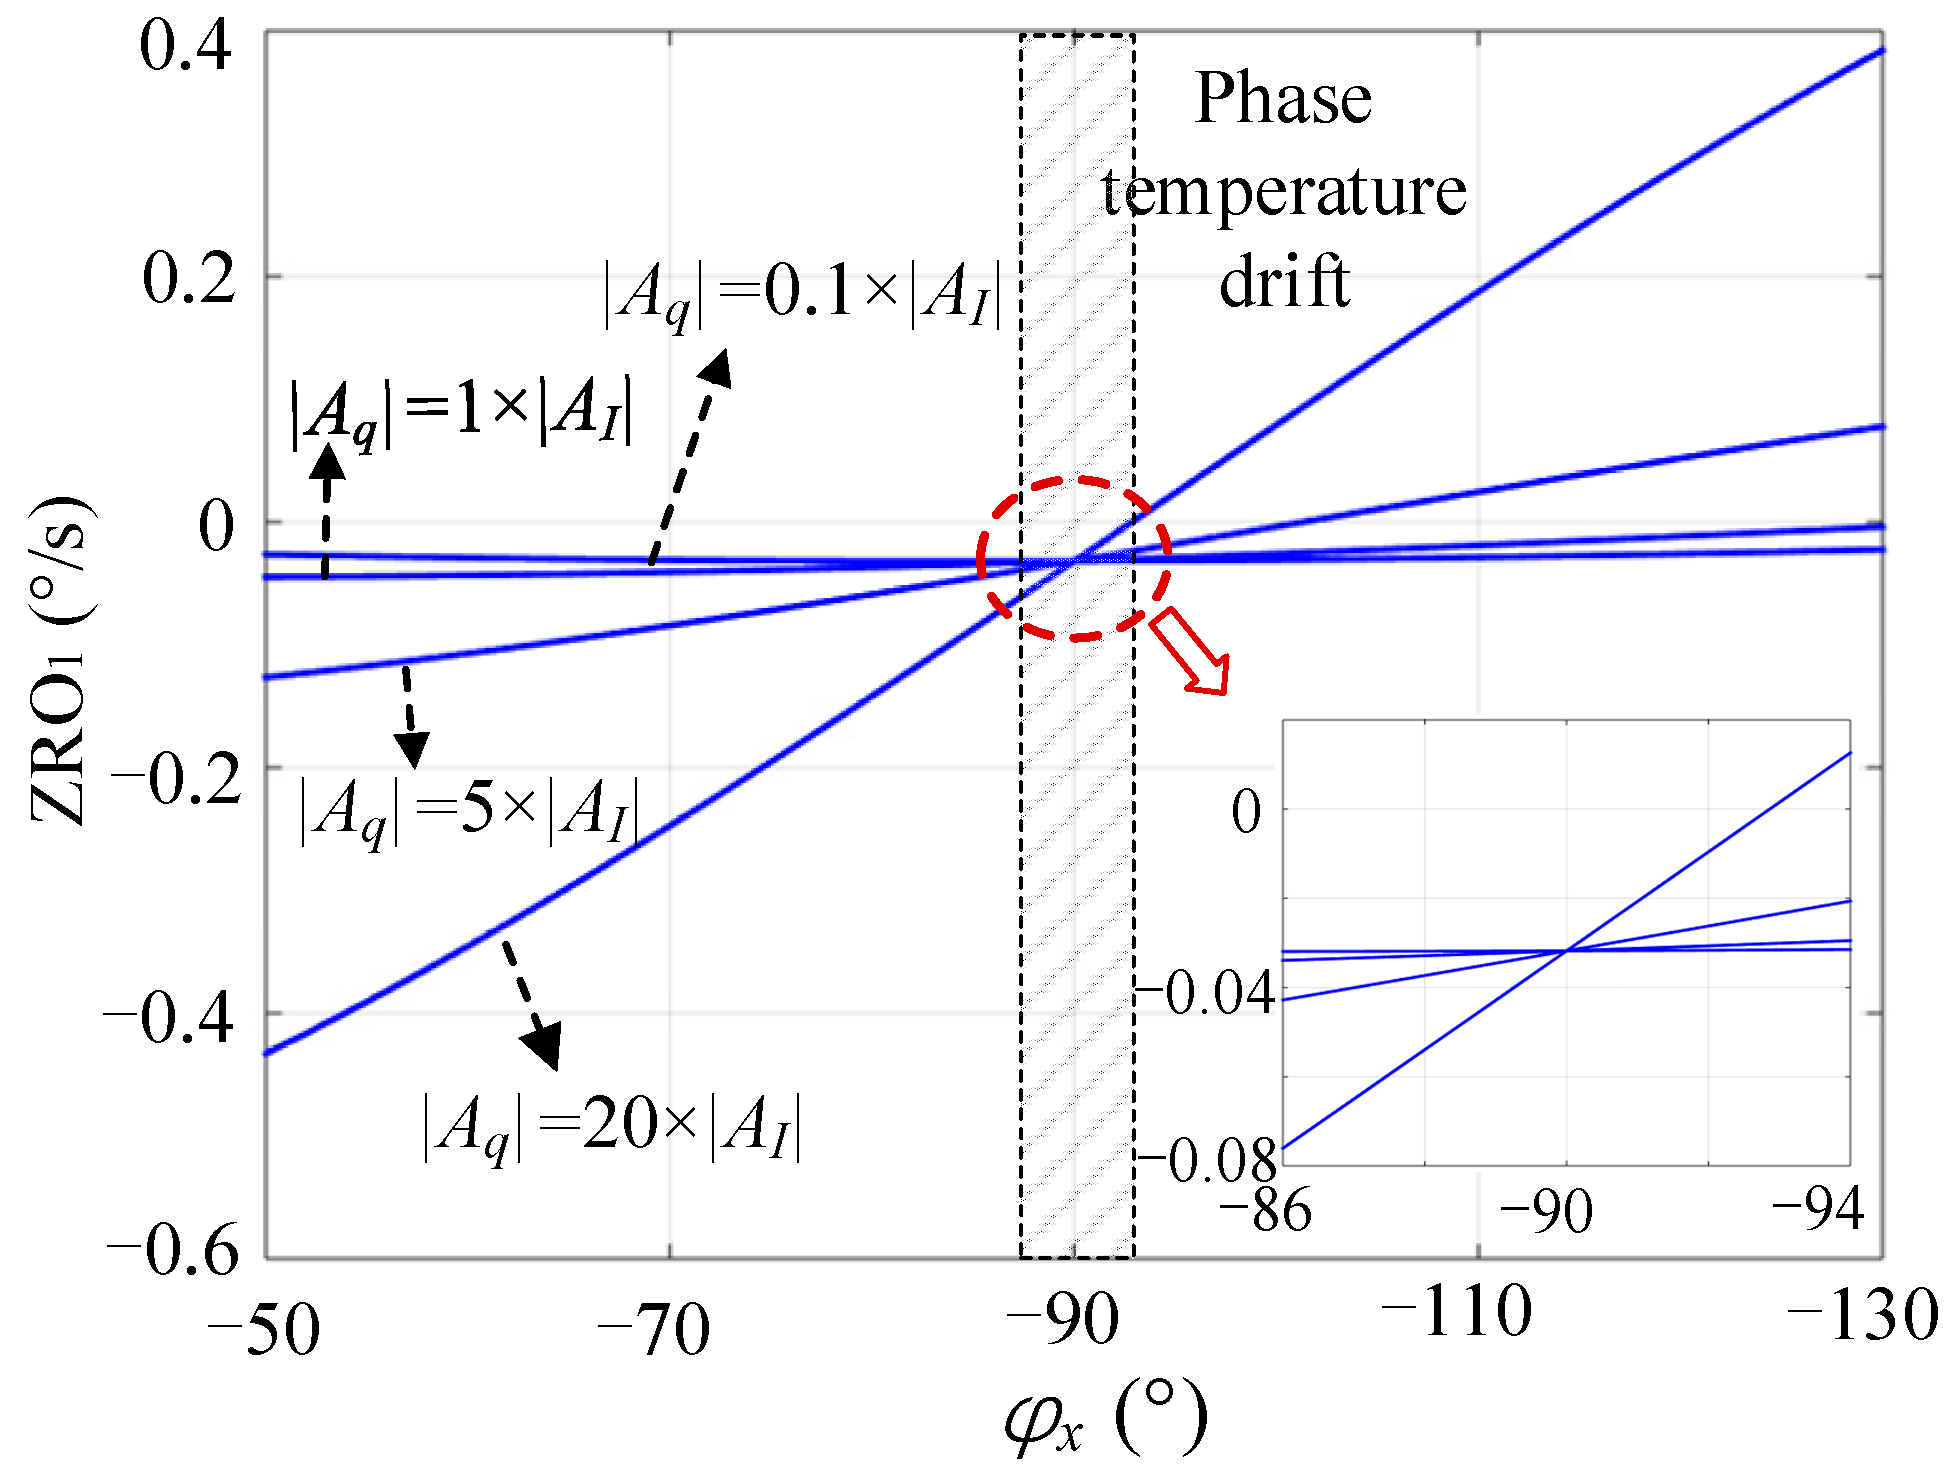
4.1. Quadrature FTR Control (Mode I)
4.2. Quadrature Stiffness Control (Mode II)
4.3. Comparative Analysis
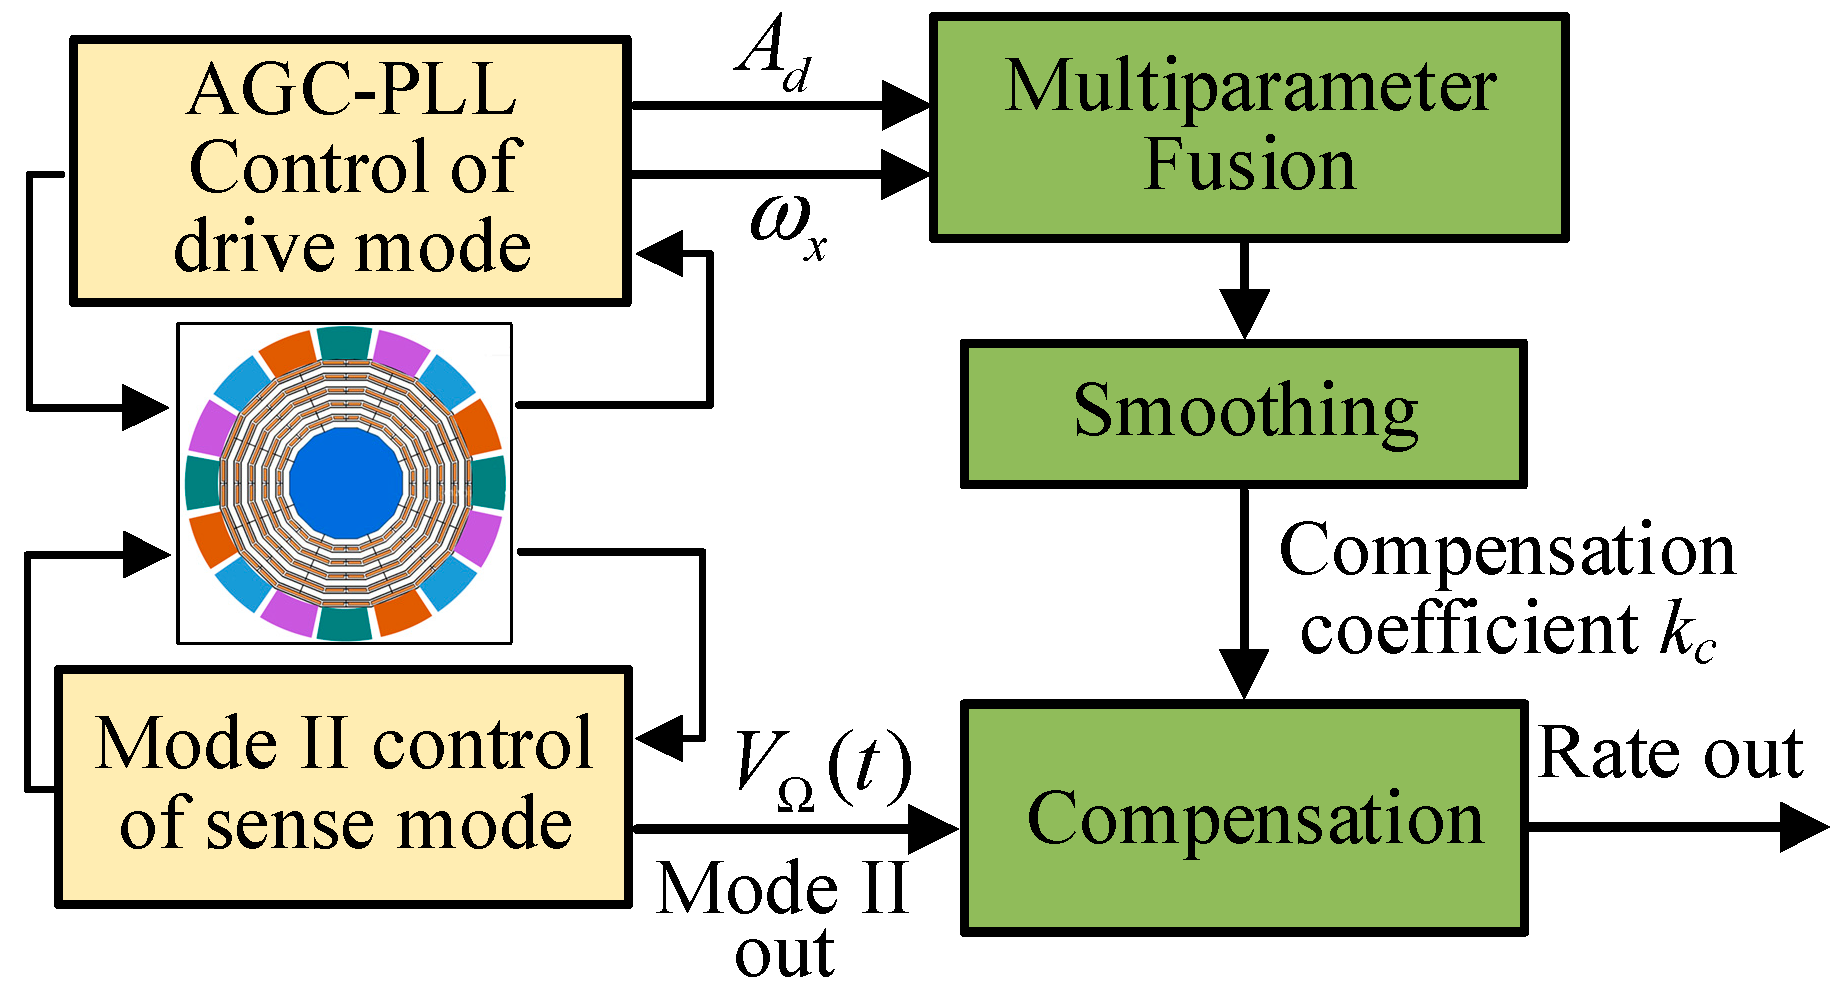
5. Online Compensation for ZRO Drift under Mode II
6. Experimental Results
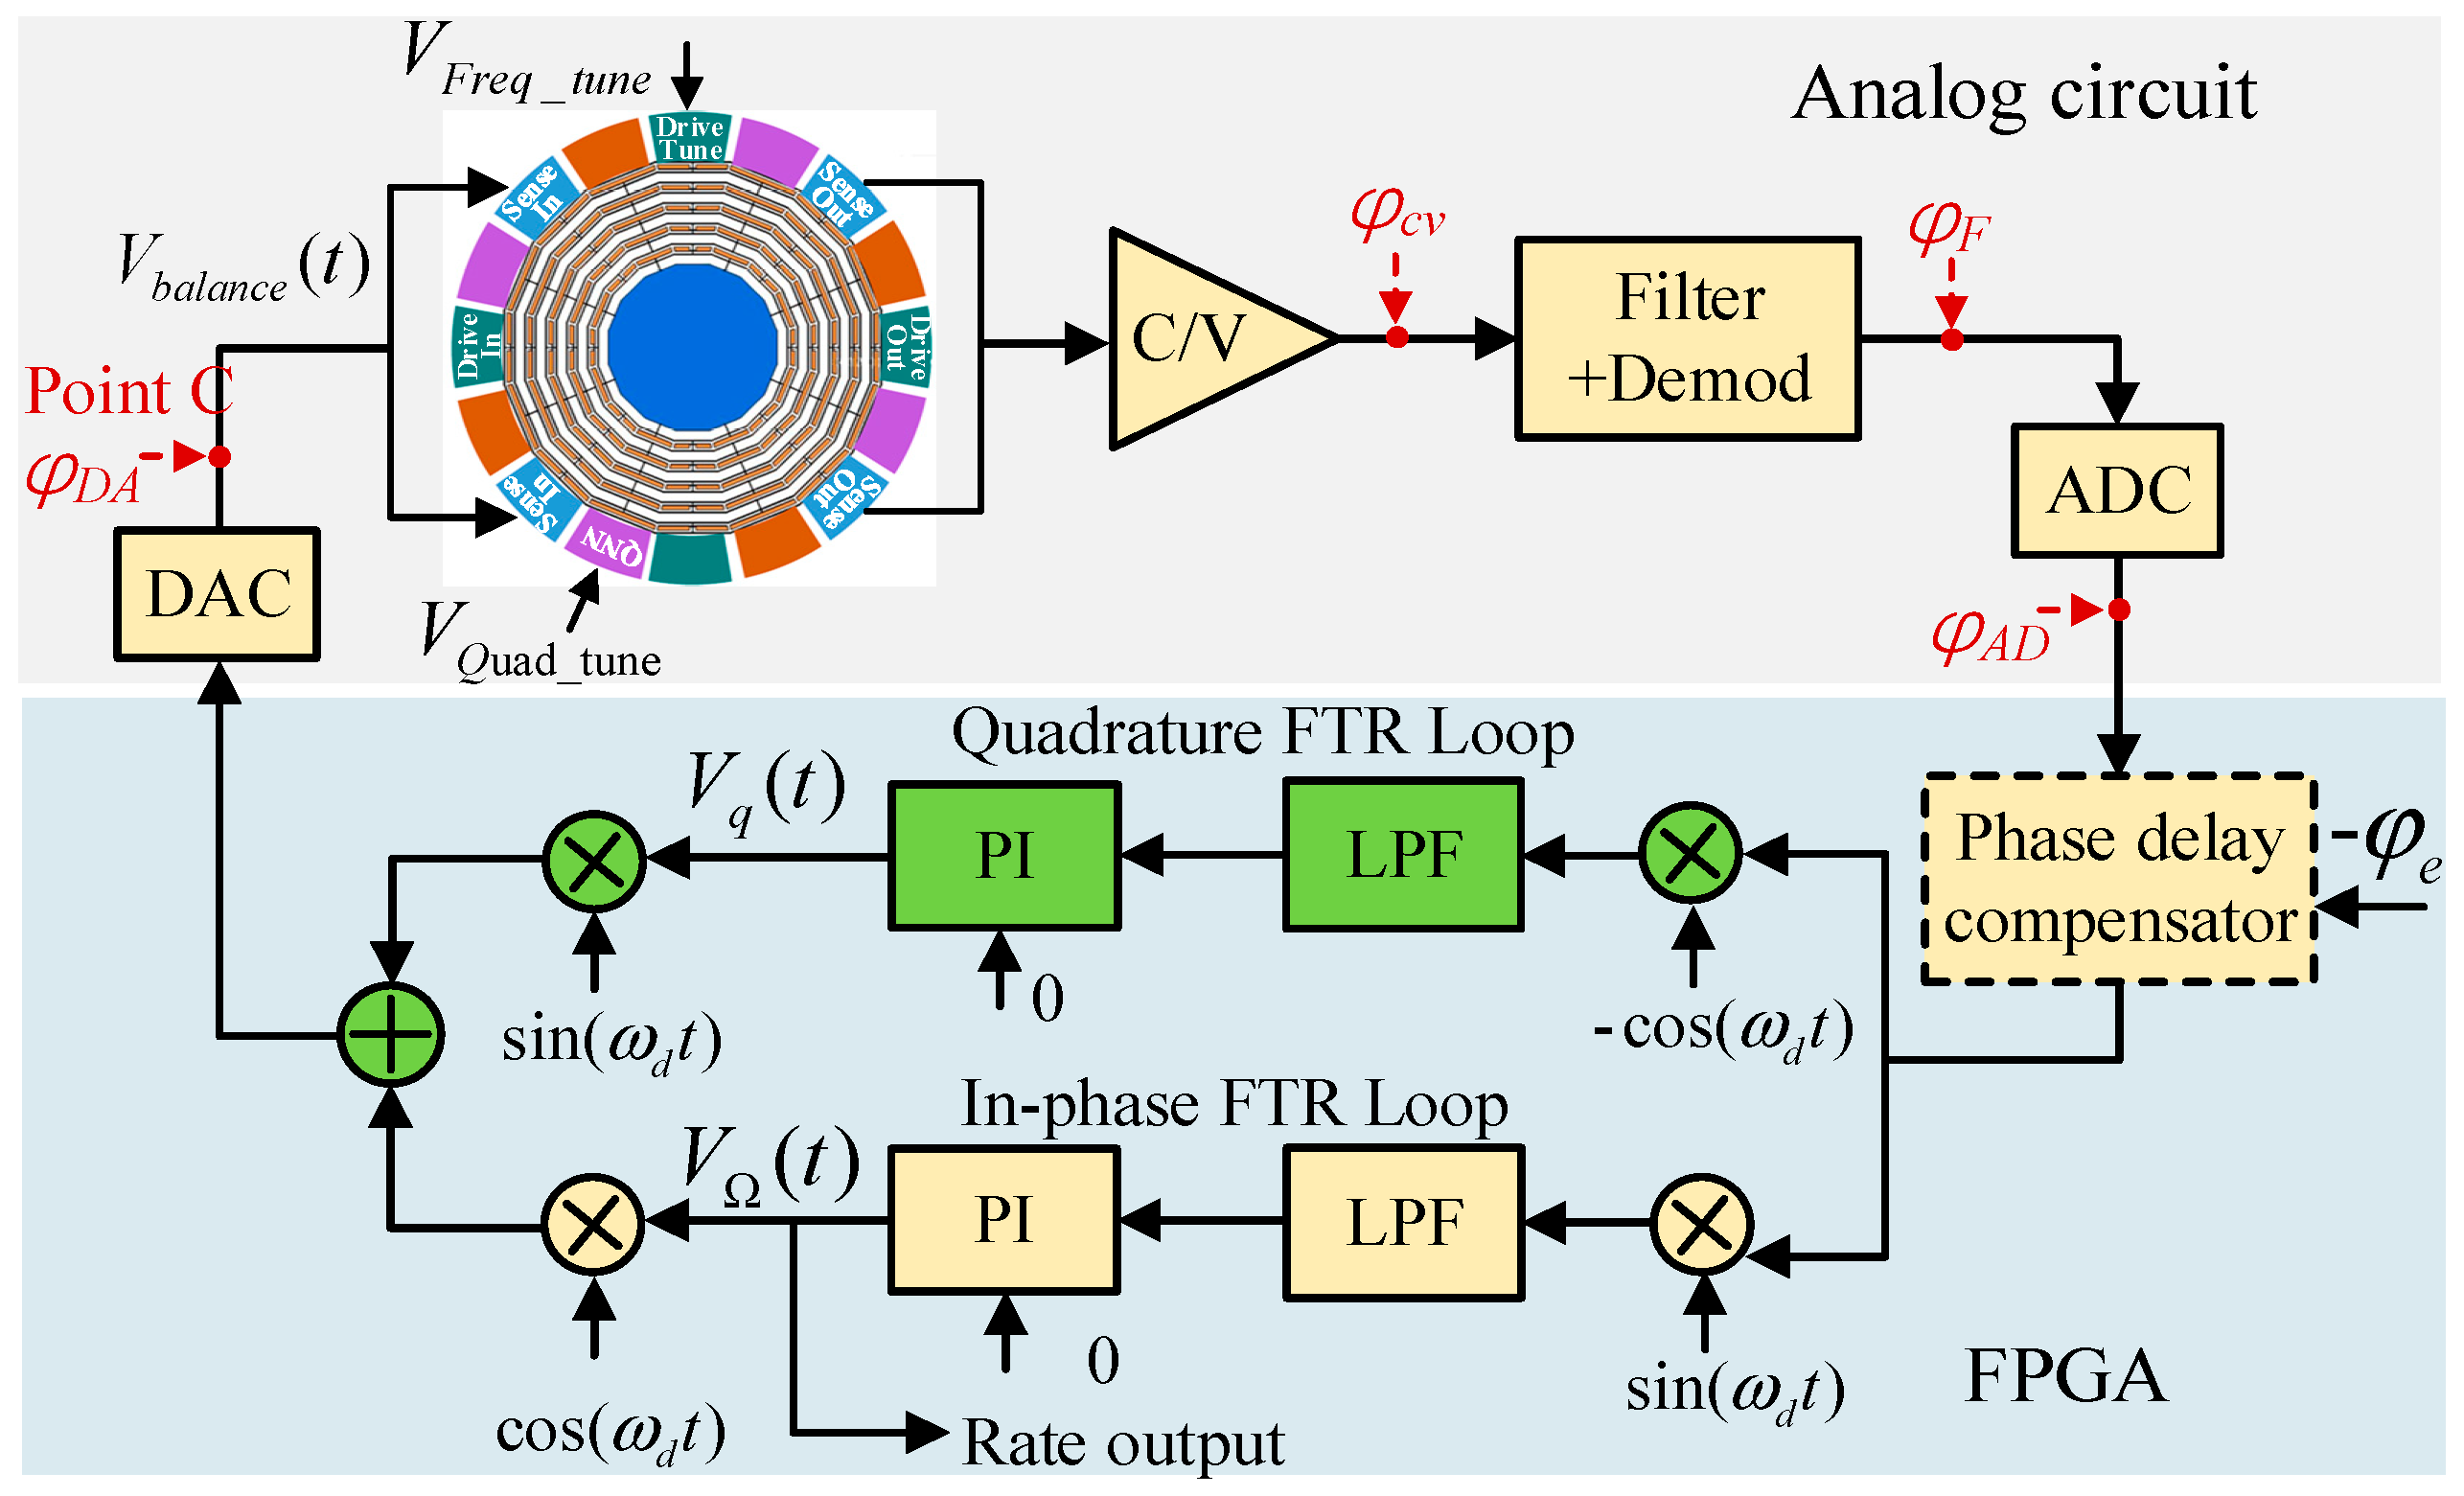
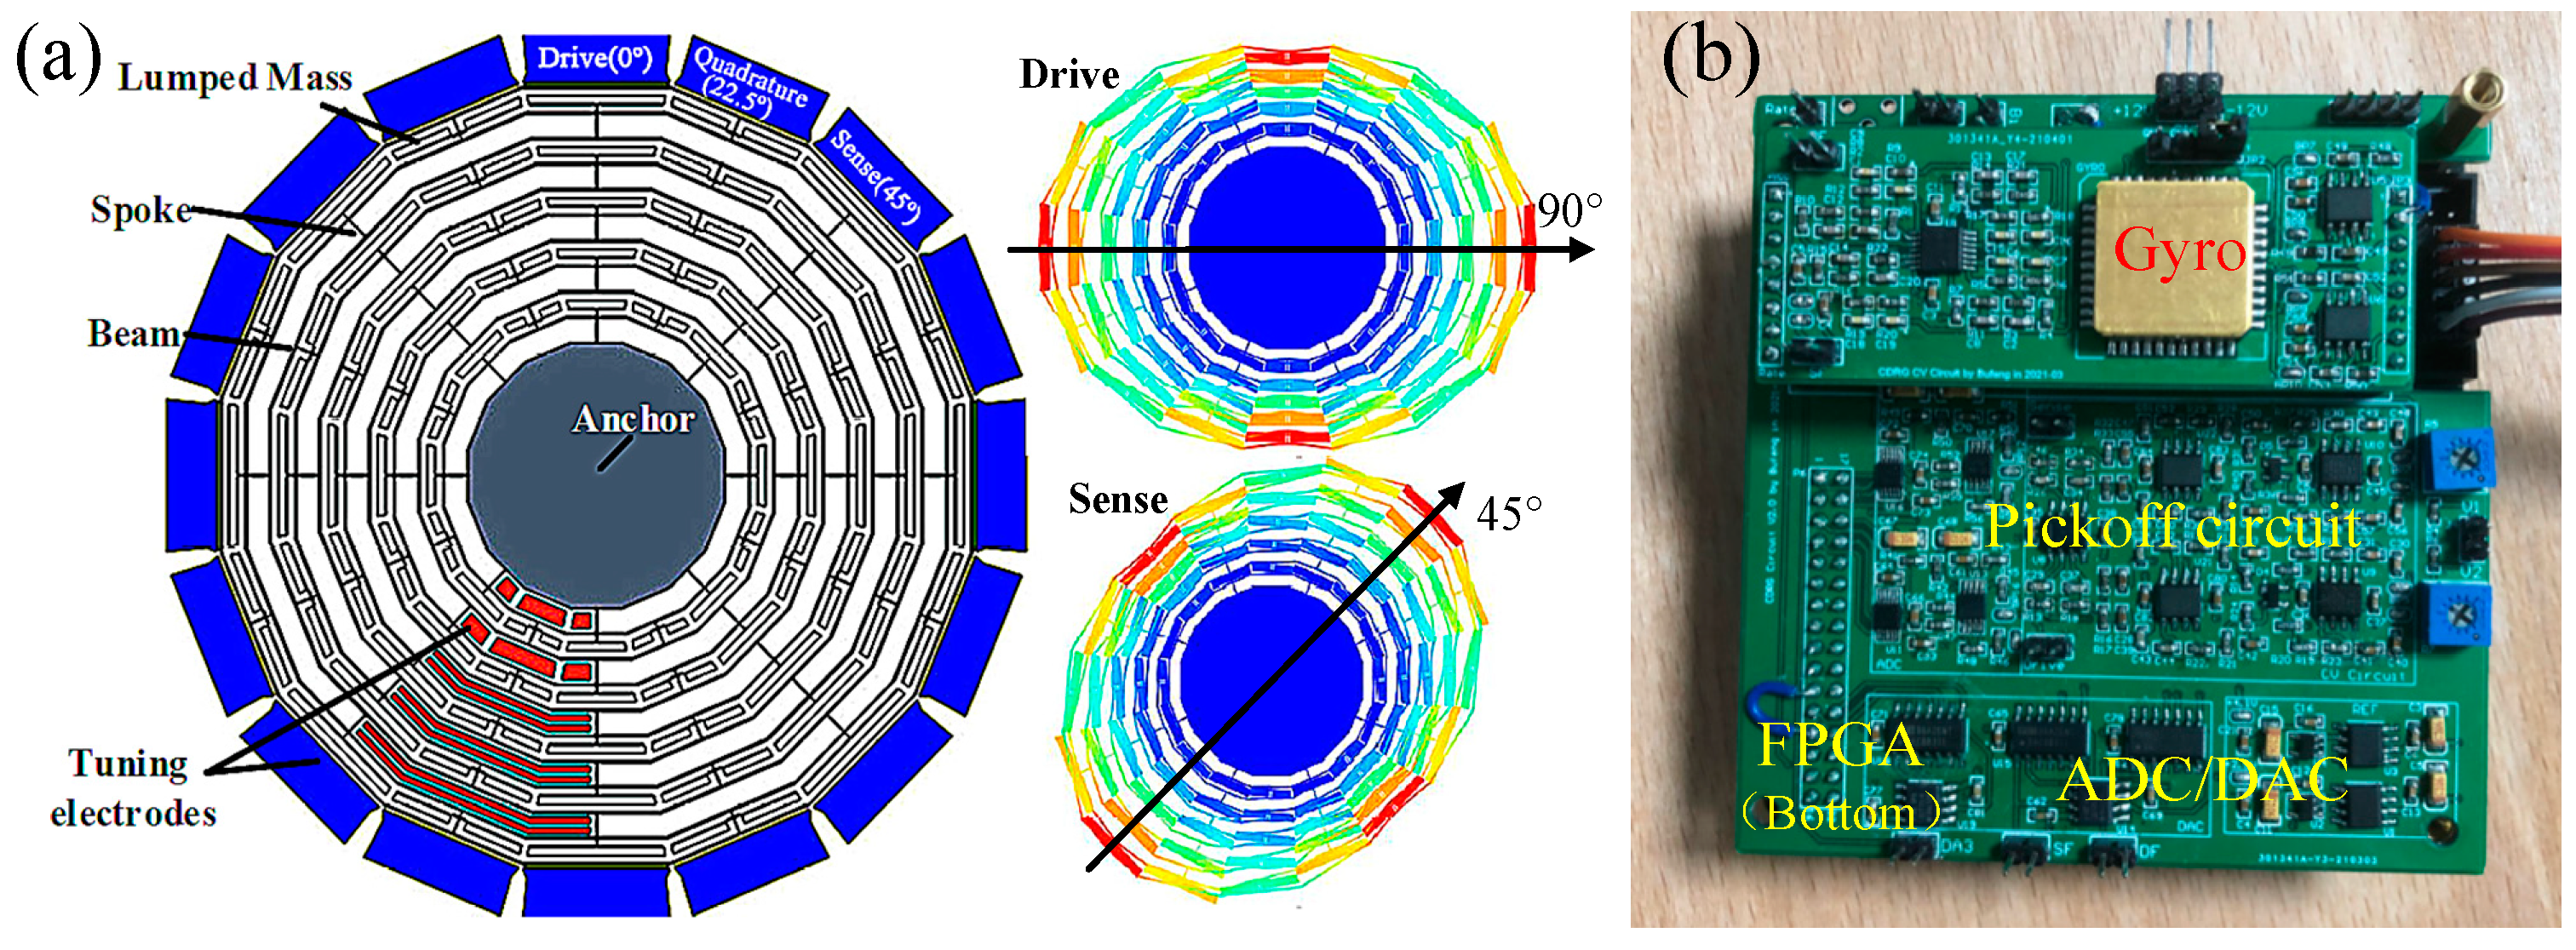
6.1. Gyroscope and Control Circuit
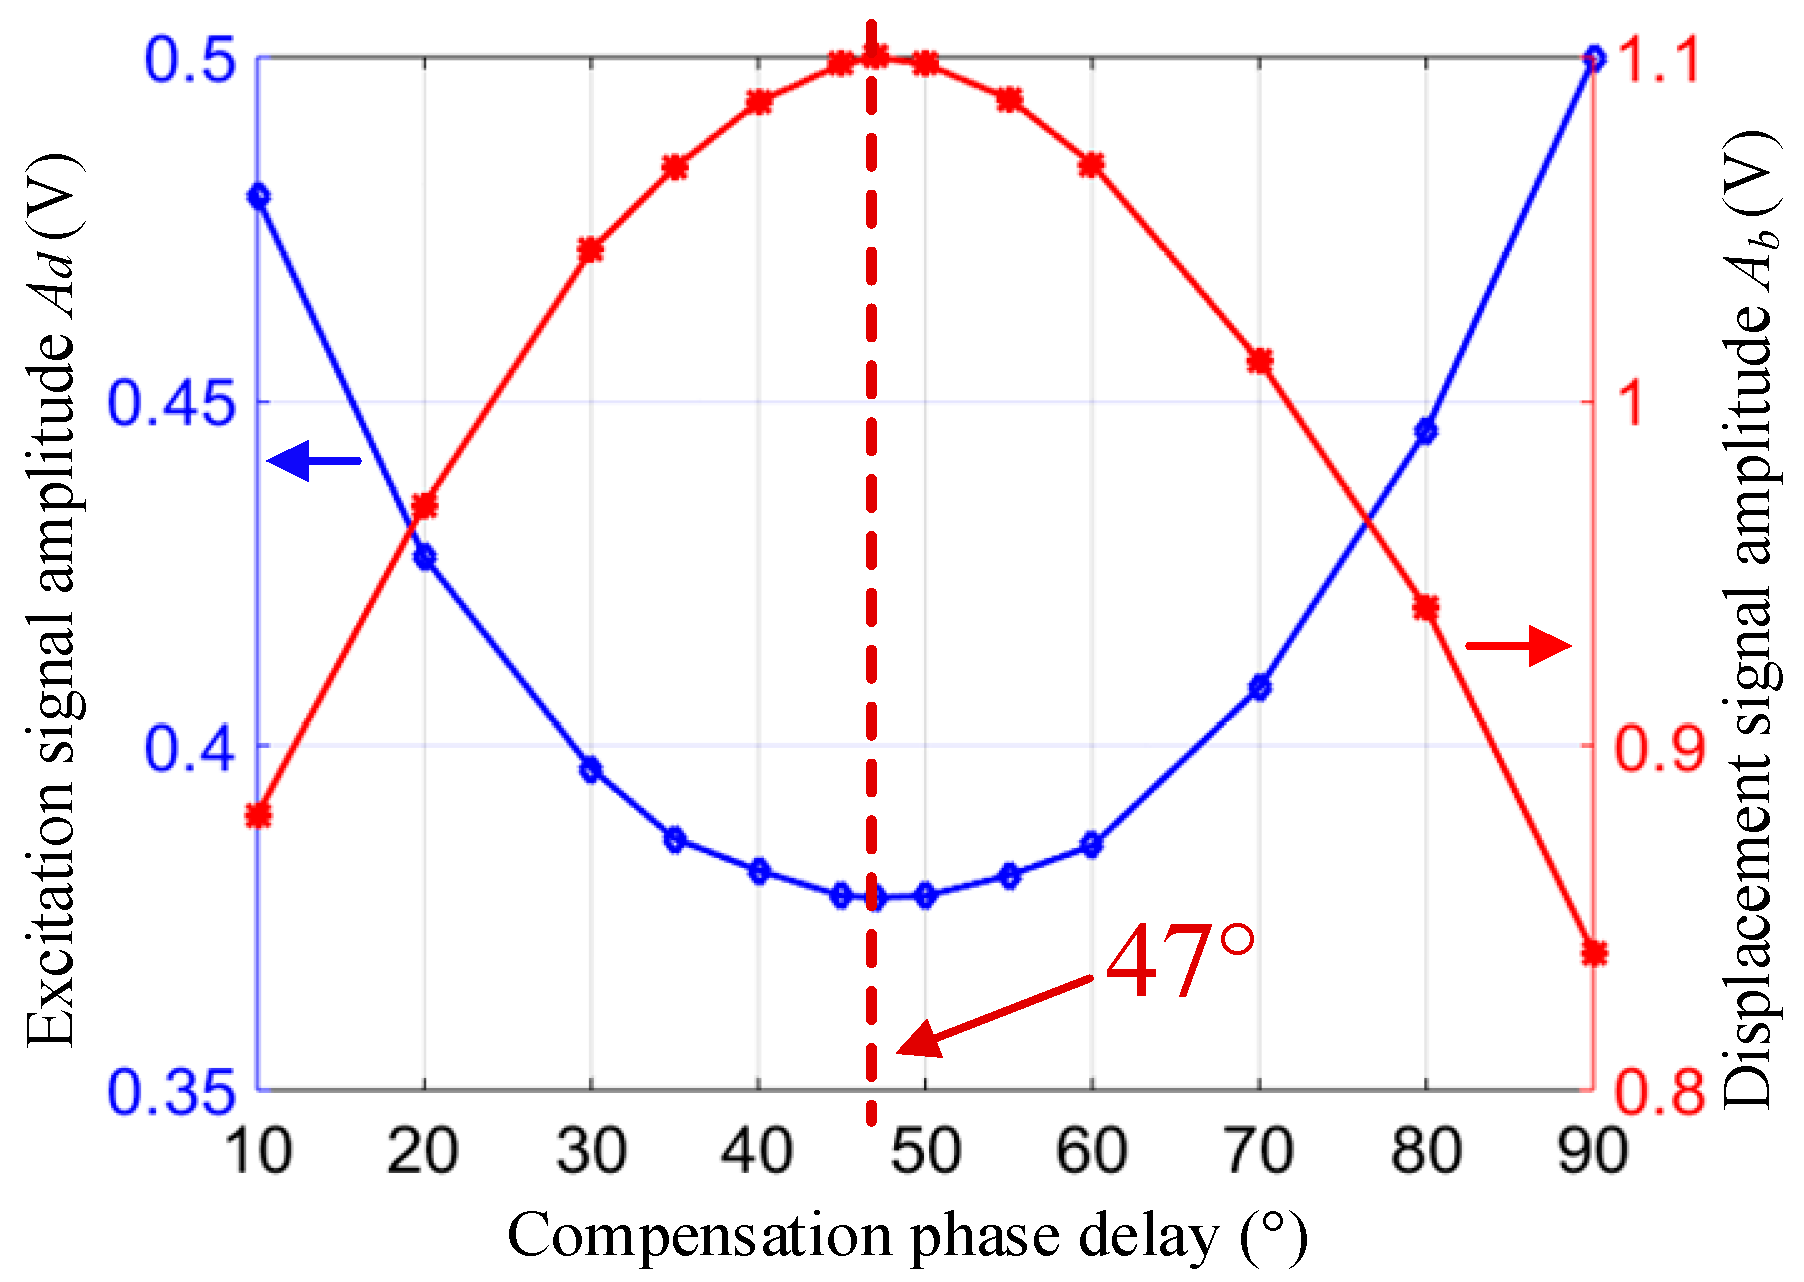
6.2. Measurement of Circuit Phase Delay
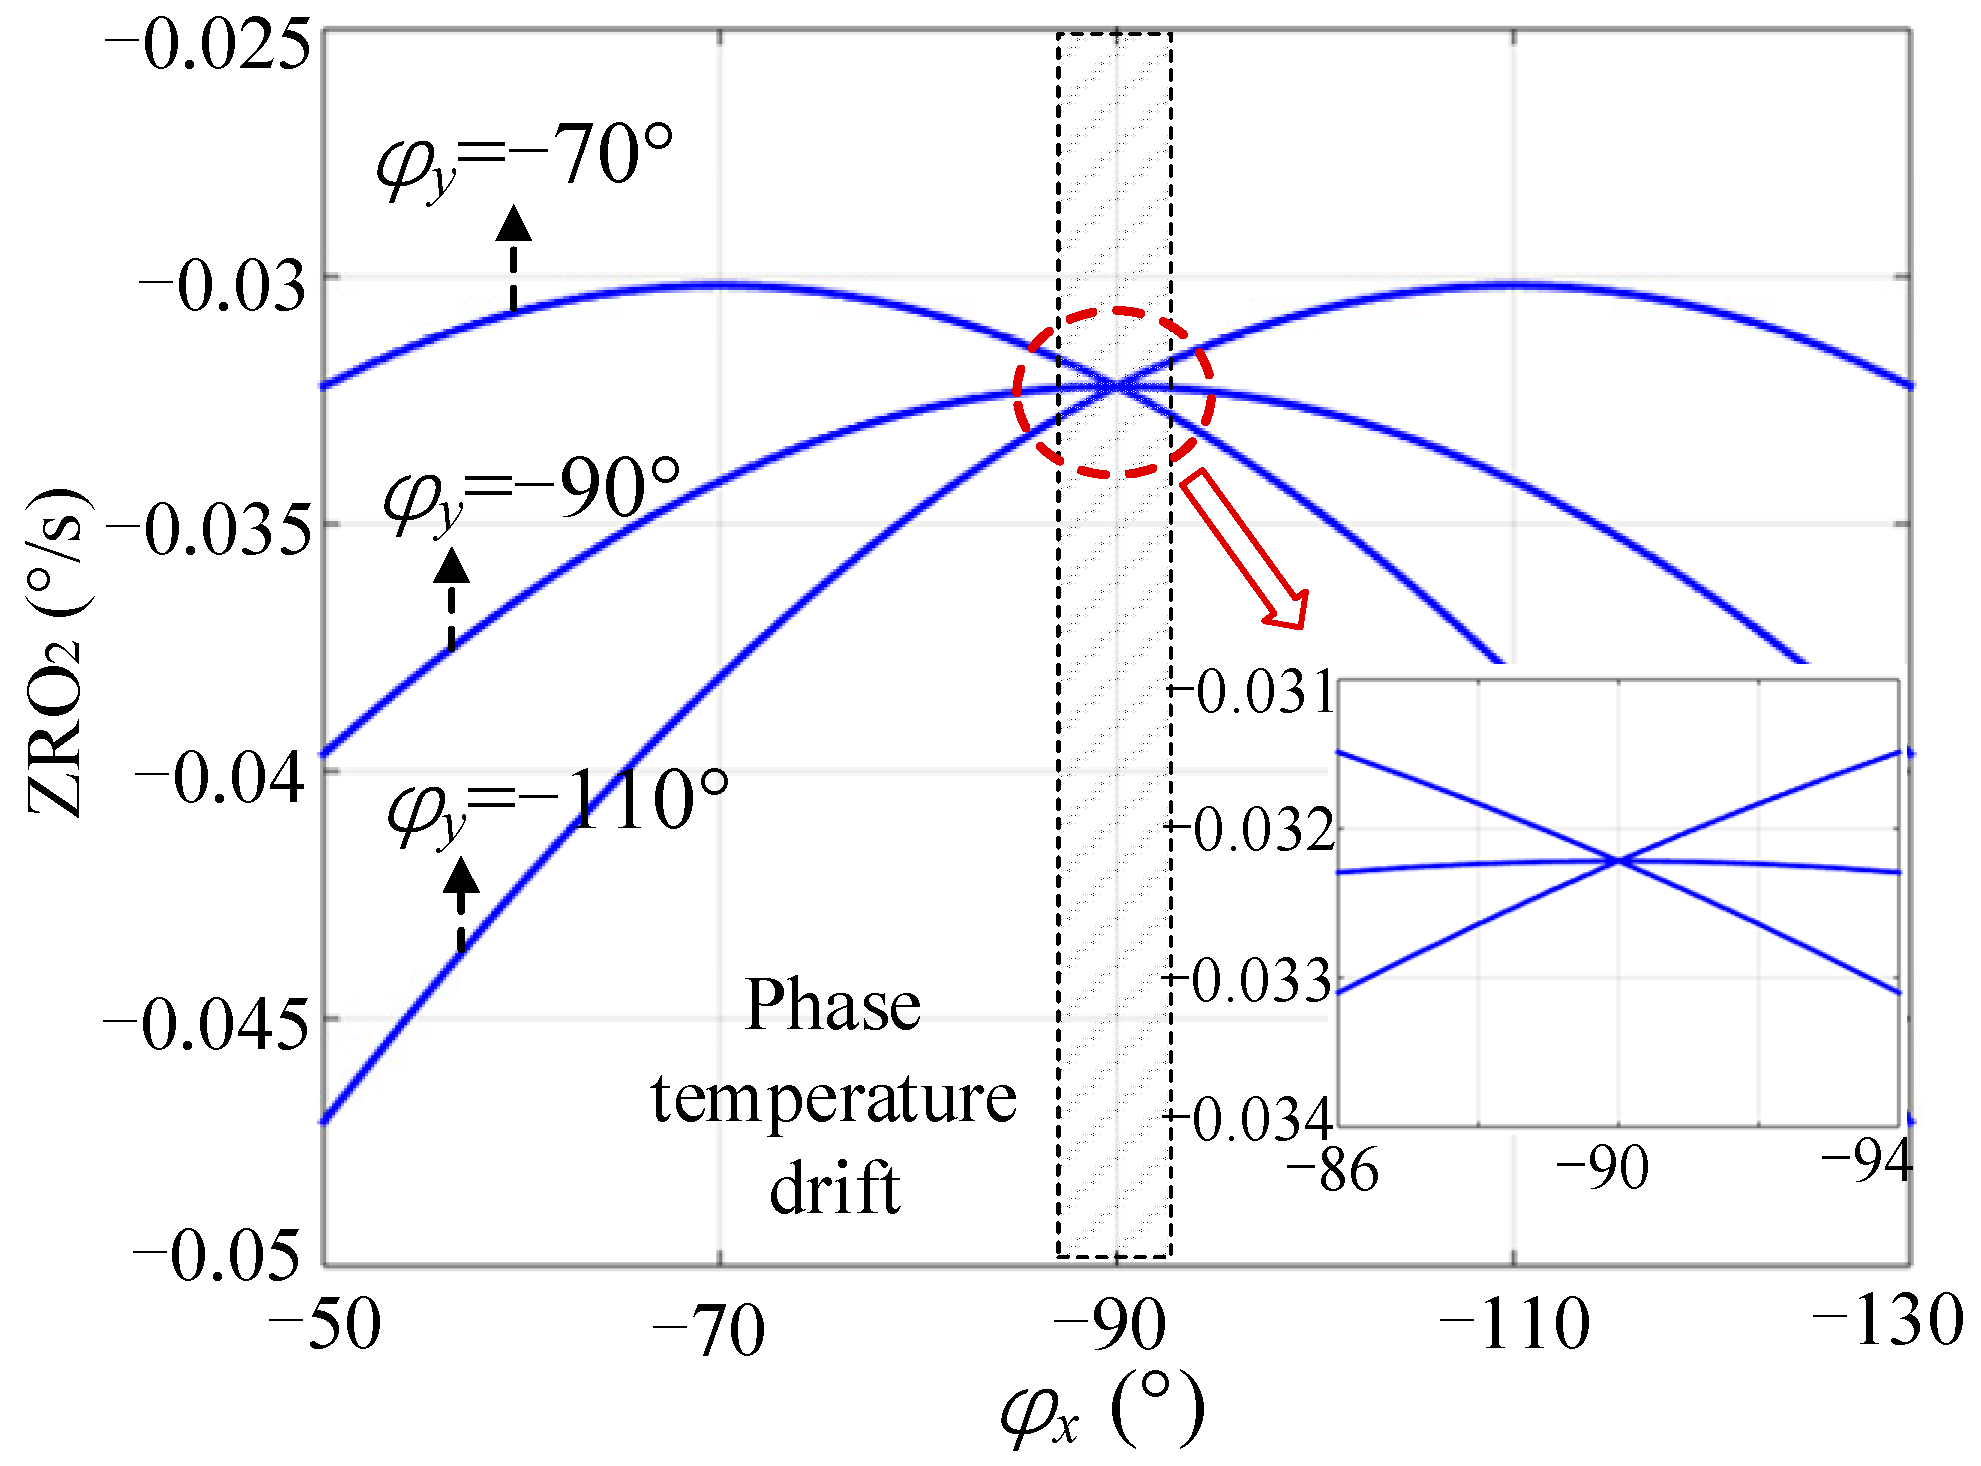
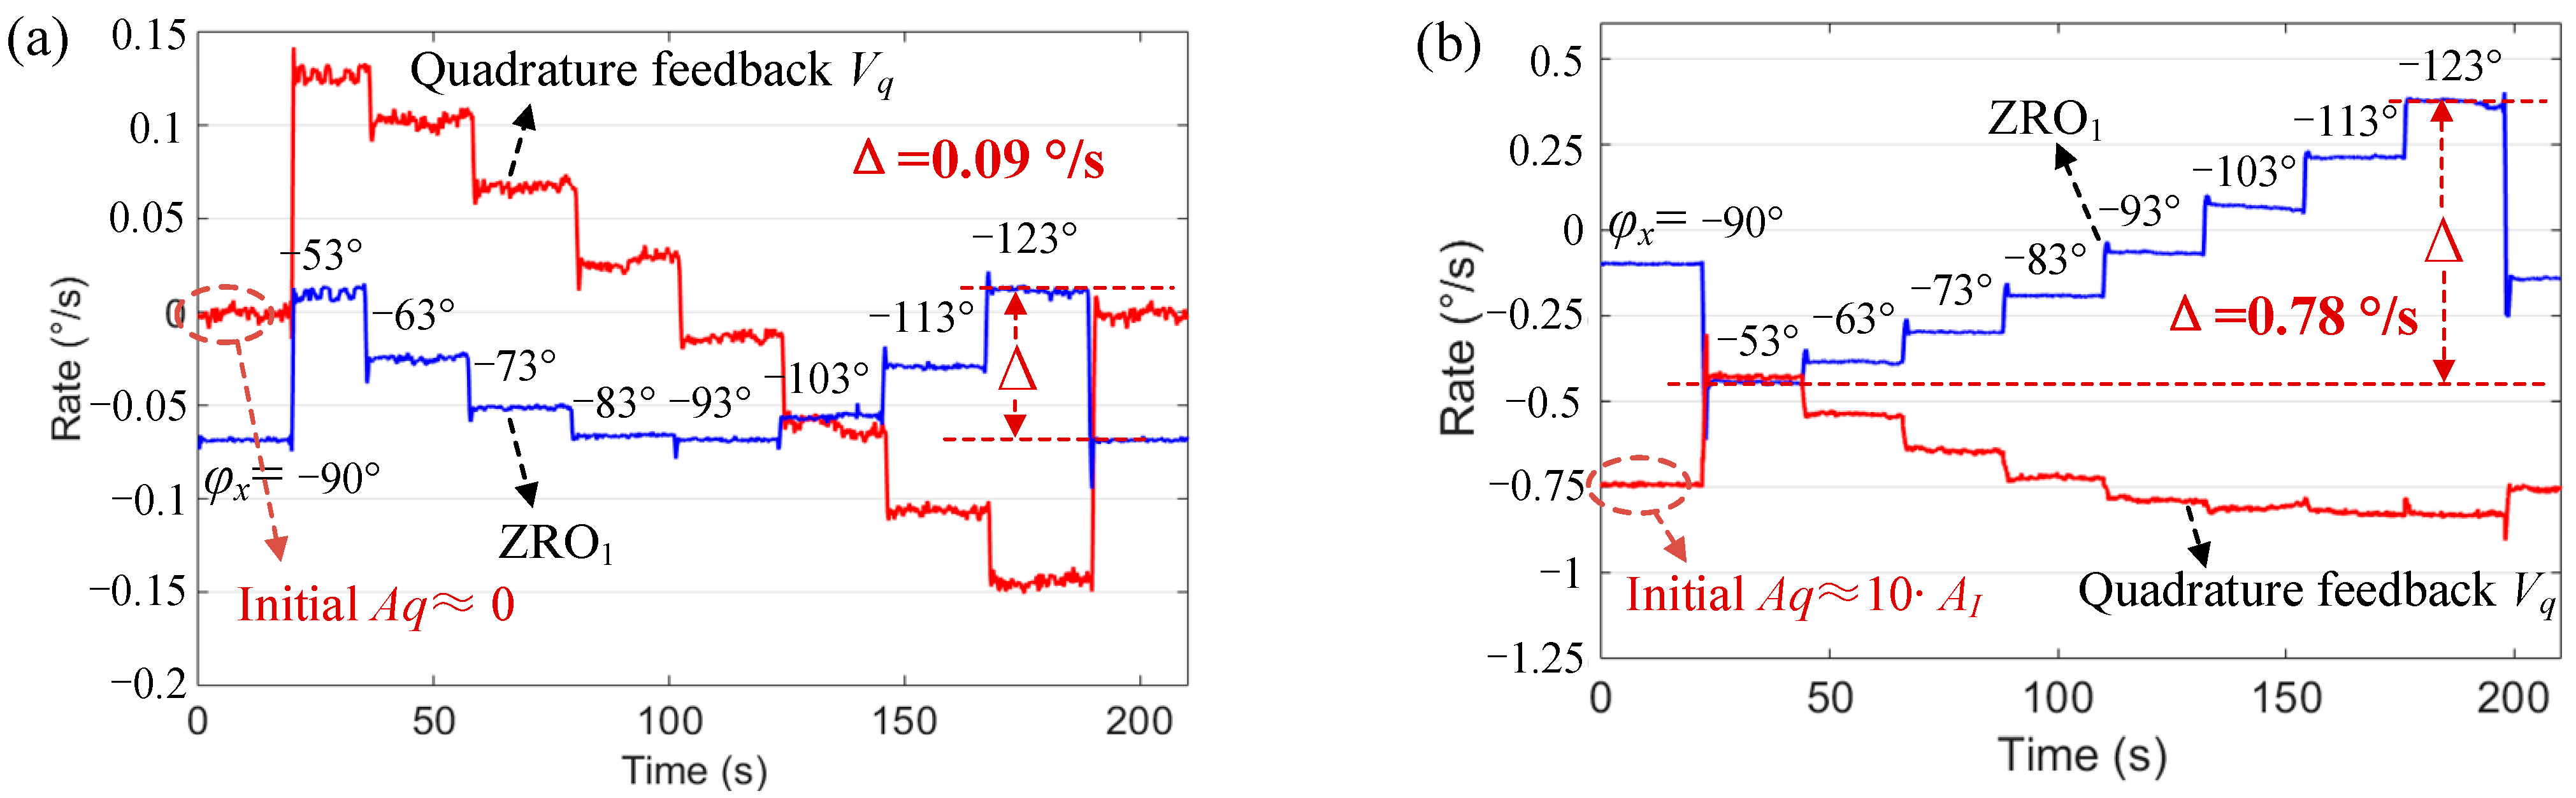
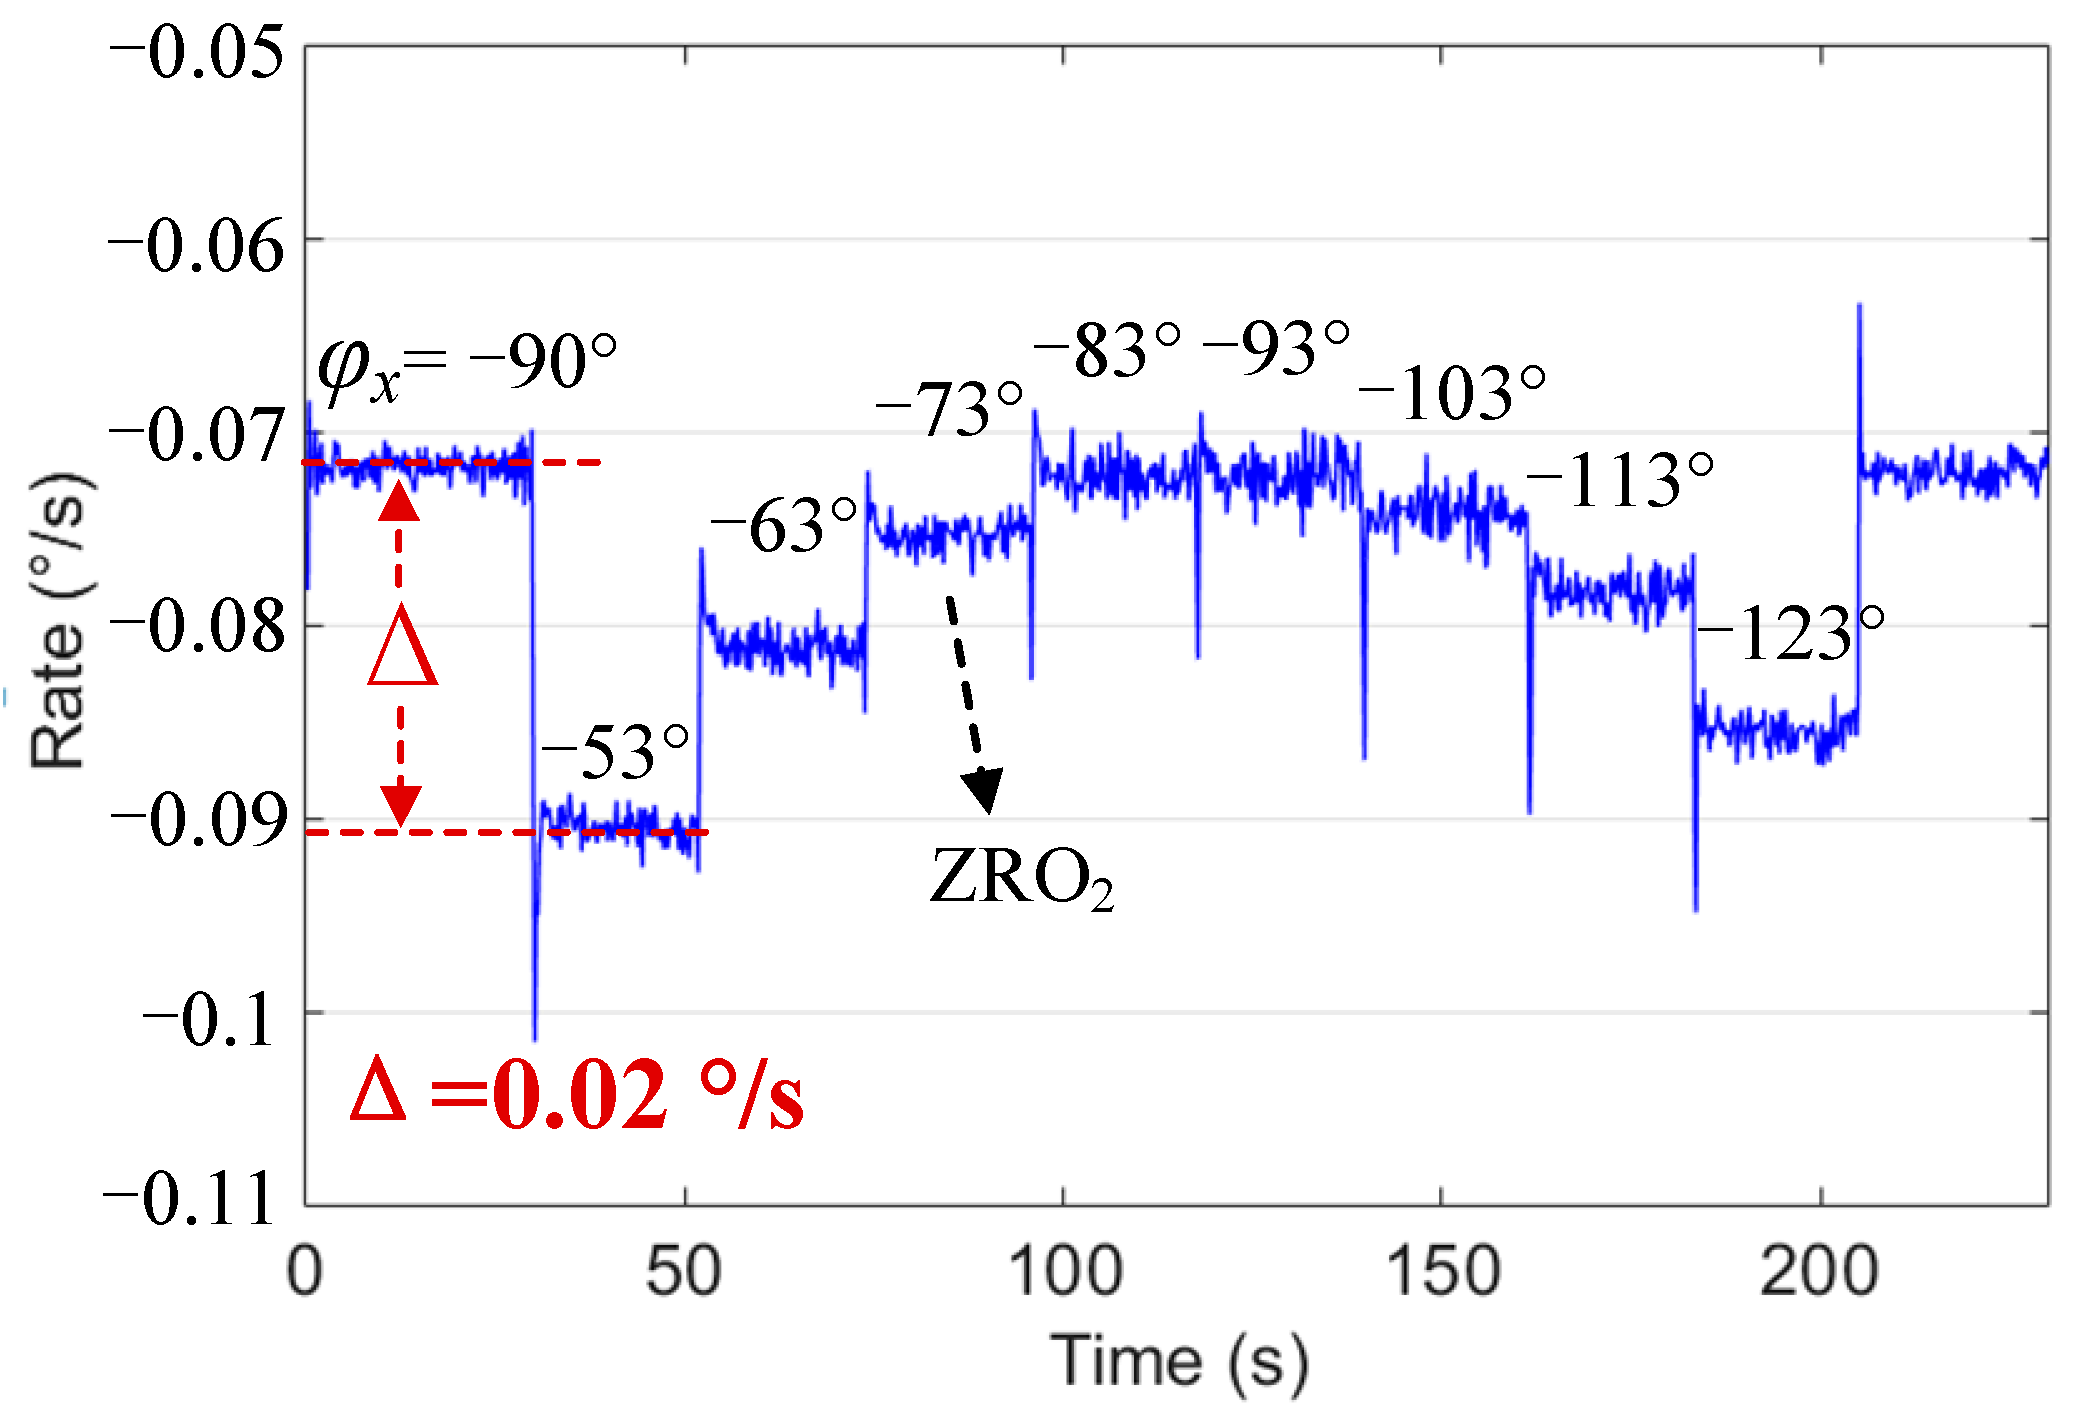
6.3. Comparison of Influence on ZRO
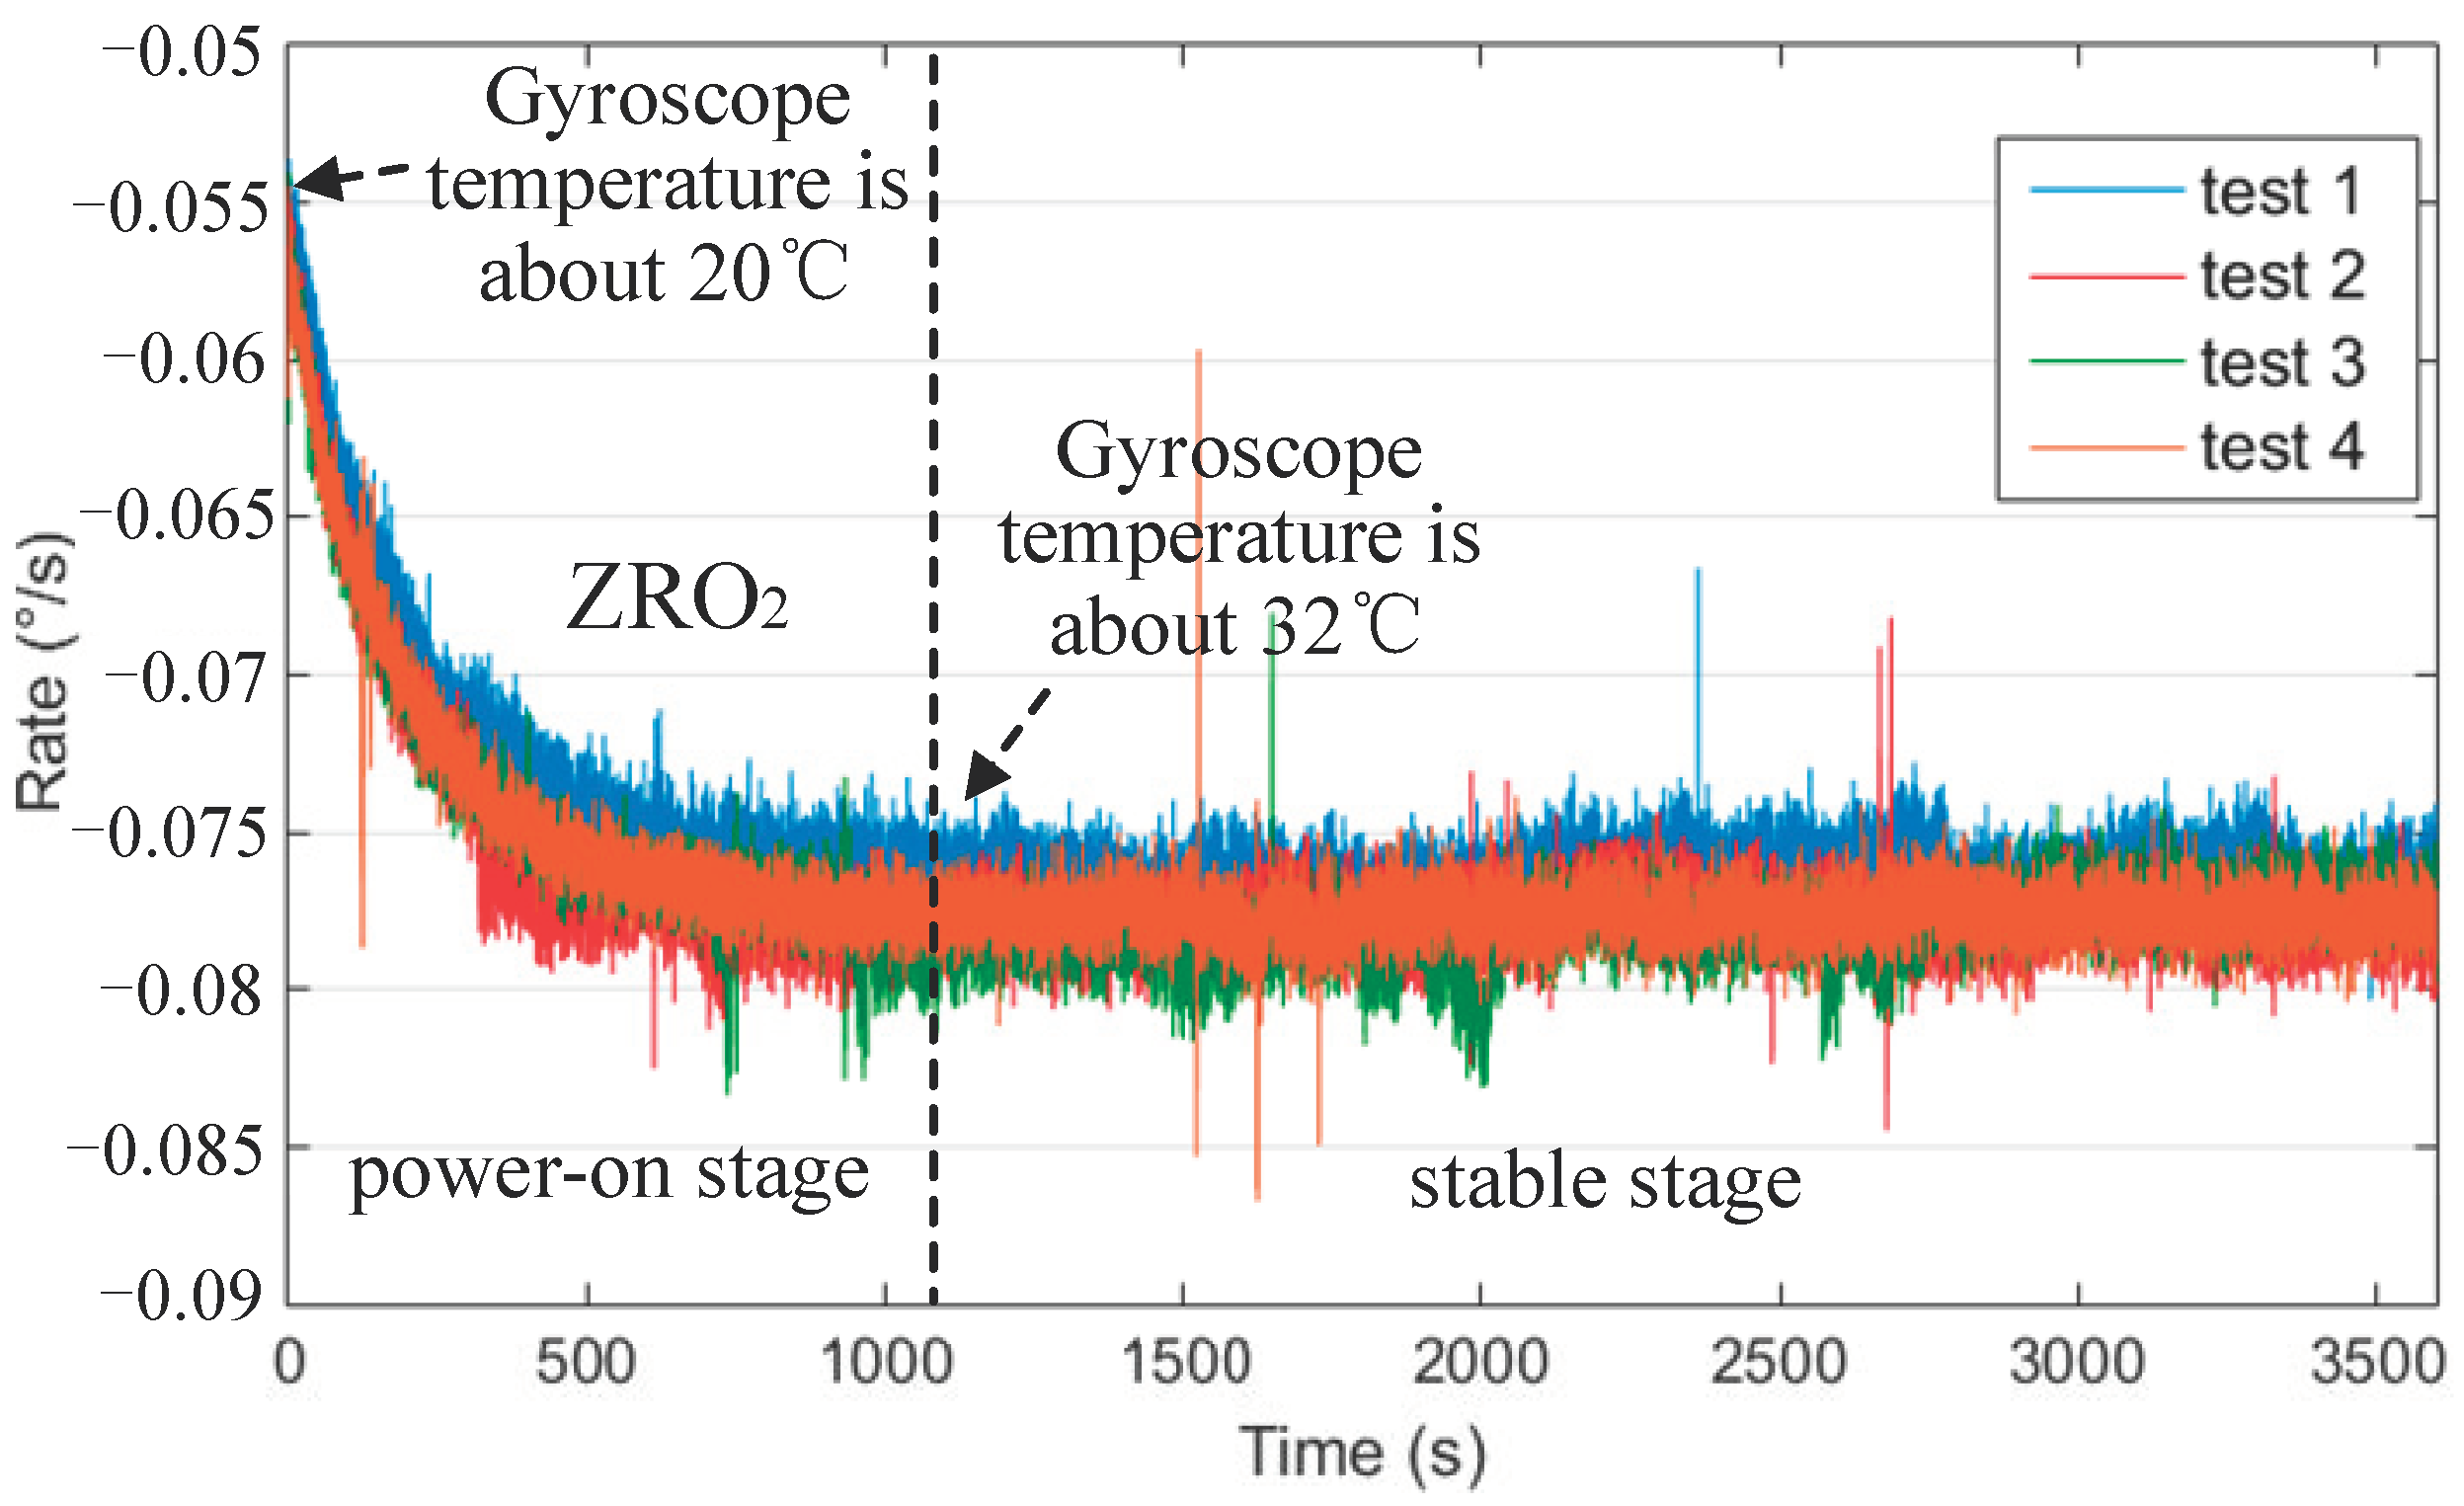
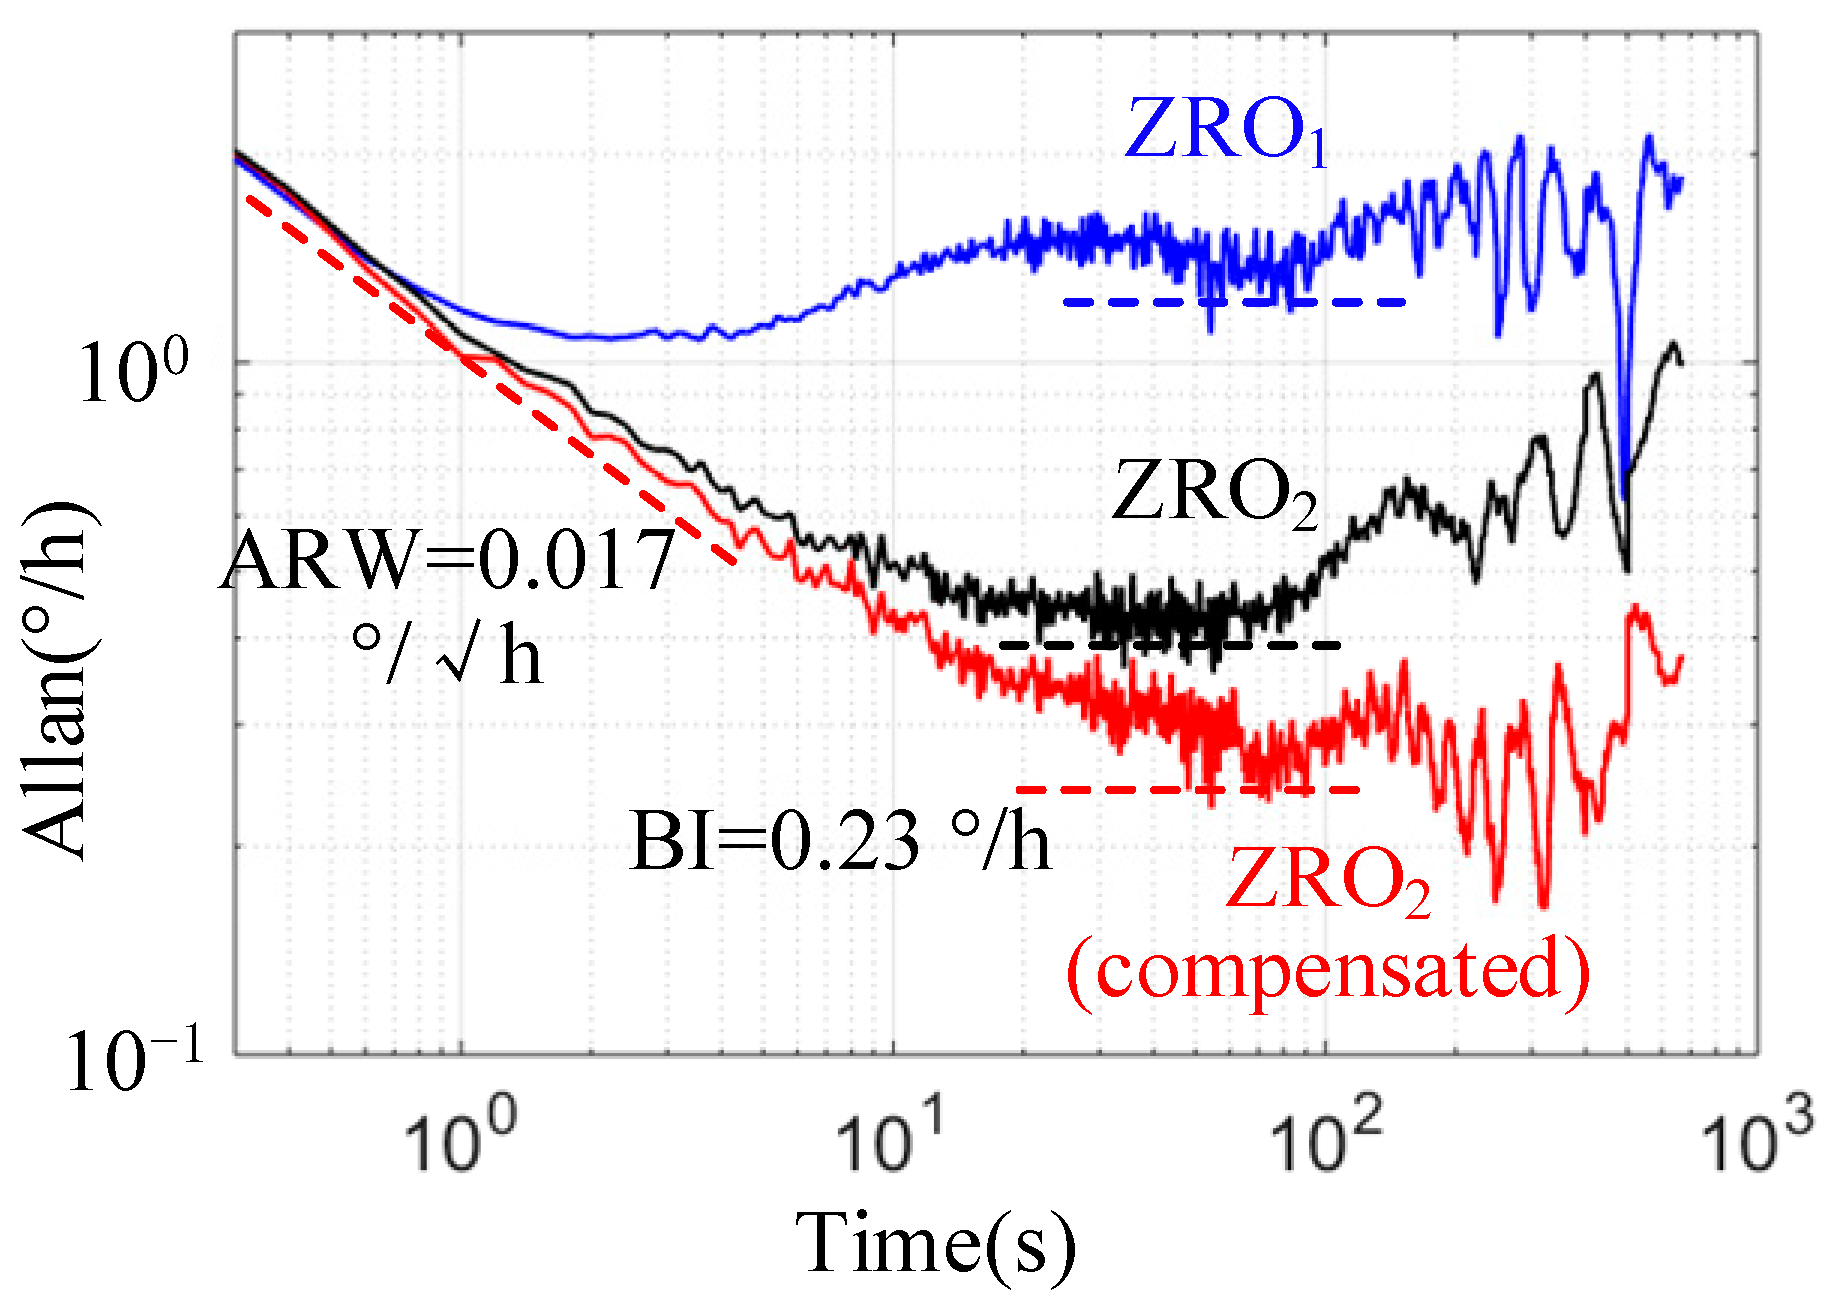
6.4. Comparison of Bias Stability
7. Conclusions
Author Contributions
Funding
Institutional Review Board Statement
Informed Consent Statement
Conflicts of Interest
References
- Guo, Z.; Cheng, F.; Li, B.; Le, C.; Chao, L.; Ke, S. Research development of silicon MEMS gyroscopes: A review. Microsyst. Technol. 2015, 21, 2053–2066. [Google Scholar]
- Cao, H.; Li, H.; Shao, X.; Liu, Z.; Kou, Z.; Shan, Y.; Shi, Y.; Shen, C.; Liu, J. Sensing mode coupling analysis for dual-mass MEMS gyroscope and bandwidth expansion within wide-temperature range. Mech. Syst. Signal Process. 2018, 98, 448–464. [Google Scholar] [CrossRef]
- Jia, J.; Ding, X.; Qin, Z.; Ruan, Z.; Li, W.; Liu, X.; Li, H. Overview and analysis of MEMS Coriolis vibratory ring gyroscope. Measurement 2021, 182, 109704. [Google Scholar] [CrossRef]
- Hiller, T.; Kuhlmann, B.; Buhmann, A.; Roth, H. Noise contributions in a closed-loop MEMS gyroscope for automotive applications. In Proceedings of the 2017 IEEE International Symposium on Inertial Sensors and Systems, Kauai, HI, USA, 28–30 March 2017. [Google Scholar]
- Ding, H.; Liu, X.; Cui, J.S.; Chi, X. A High-Resolution Silicon-on-Glass Z Axis Gyroscope Operating at Atmospheric Pressure. IEEE Sens. J. 2010, 10, 1066–1074. [Google Scholar] [CrossRef]
- He, C.; Zhao, Q.; Liu, Y.; Yang, Z.; Yan, G. Closed loop control design for the sense mode of micromachined vibratory gyroscopes. Sci. China Technol. Sci. 2013, 56, 1112–1118. [Google Scholar] [CrossRef]
- Trusov, A.A.; Prikhodko, I.P.; Rozelle, D.M.; Meyer, A.D.; Shkel, A.M. 1 PPM precision self-calibration of scale factor in MEMS Coriolis vibratory gyroscopes. In Proceedings of the 17th International Conference on Solid-State Sensors, Actuators and Microsystems, Barcelona, Spain, 16–20 June 2013. [Google Scholar]
- Eminoglu, B.; Kline, M.H.; Izyumin, I.; Yeh, Y.-C.; Boser, B.E. Ratio-metric readout technique for MEMS gyroscopes with force feedback. In Proceedings of the IEEE/ION Position, Location & Navigation Symposium-Plans, Monterey, CA, USA, 5–8 May 2014. [Google Scholar]
- Tatar, E.; Mukherjee, T.; Fedder, G.K. Stress Effects and Compensation of Bias Drift in a MEMS Vibratory-Rate Gyroscope. J. Microelectromech. Syst. 2017, 26, 569–579. [Google Scholar] [CrossRef]
- Lin, Y.; Zheng, X.; Liu, S.; Ma, W.; Jin, Z. Temperature-dependence improvement for a MEMS gyroscope using triangular-electrode based capacitive detection method. IET Micro Nano Lett. 2017, 12, 828–833. [Google Scholar] [CrossRef]
- Hu, Z.; Gallacher, B. A mode-matched force-rebalance control for a MEMS vibratory gyroscope. Sens. Actuators A Phys. 2018, 273, 1–11. [Google Scholar] [CrossRef] [Green Version]
- Goto, K.; Harada, S.; Hata, Y.; Ito, K.; Wado, H.; Cho, J.Y.; Najafi, K. High Q-Factor Mode-Matched Silicon Gyroscope with a Ladder Structure. In Proceedings of the 2020 IEEE International Symposium on Inertial Sensors and Systems (INERTIAL), Hiroshima, Japan, 23–26 March 2020. [Google Scholar]
- Yesil, F.; Alper, S.E.; Akin, T. An automatic mode matching system for a high Q-factor MEMS gyroscope using a decoupled perturbation signal. In Proceedings of the 18th International Solid-State Sensors, Actuators and Microsystems Conference, Anchorage, AK, USA, 21–25 June 2015. [Google Scholar]
- Fan, Q.; Lin, C.; Liu, M.; Su, Y.; Zhao, W.; Zheng, D. High Performance MEMS Disk Gyroscope with Force to Rebalance Operation Mode. In Proceedings of the IEEE SENSORS Conference, New Delhi, India, 28–31 October 2018; pp. 416–418. [Google Scholar]
- Xu, Y.; Li, Q.; Wang, P.; Zhang, Y.; Zhou, X.; Yu, L.; Wu, X.; Xiao, D. 0.015 Degree-Per-Hour Honeycomb Disk Resonator Gyroscope. IEEE Sens. J. 2020, 21, 7326–7338. [Google Scholar] [CrossRef]
- Wu, H.; Zheng, X.; Wang, X.; Shen, Y.; Ma, Z.; Jin, Z. A 0.09/h Bias-Instability MEMS Gyroscope Working With a Fixed Resonance Frequency. IEEE Sens. J. 2021, 21, 23787–23798. [Google Scholar] [CrossRef]
- Cho, J.Y.; Woo, J.K.; He, G.; Yang, D.; Boyd, C.; Singh, S.; Darvishian, A.; Shiari, B.; Najafi, K. 1.5-Million Q-Factor Vacuum-Packaged Birdbath Resonator Gyroscope (BRG). In Proceedings of the IEEE International Conference on Micro Electro Mechanical Systems (MEMS), Seoul, Korea, 27–31 January 2019; pp. 210–213. [Google Scholar]
- Bu, F.; Guo, S.; Cheng, M.; Zheng, F.; Xu, D.; Zhao, H. Effect of circuit phase delay on bias stability of MEMS gyroscope under force rebalance detection and self-compensation method. J. Micromech. Microeng. 2019, 29, 095002. [Google Scholar] [CrossRef]
- Bu, F.; Wang, X.; Fan, B.; Guo, S.; Xu, D.; Xu, X.; Zhao, H. Noise model considering electrical feed-through under force rebalance closed-loop detection of MEMS gyroscope. J. Micromech. Microeng. 2020, 30, 055007. [Google Scholar] [CrossRef]
- Bu, F.; Fan, B.; Xu, D.; Guo, S.; Zhao, H. Bandwidth and noise analysis of high-Q MEMS gyroscope under force rebalance closed-loop control. J. Micromech. Microeng. 2021, 31, 065002. [Google Scholar] [CrossRef]
- Fan, B.; Guo, S.; Cheng, M.; Yu, L.; Zhou, M.; Hu, W.; Zheng, F.; Bu, F.; Xu, D. Frequency Symmetry Comparison of Cobweb-Like Disk Resonator Gyroscope With Ring-Like Disk Resonator Gyroscope. IEEE Electron Device Lett. 2019, 40, 1515–1518. [Google Scholar] [CrossRef]
- Fan, B.; Guo, S.; Cheng, M.; Yu, L.; Zhou, M.; Hu, W.; Chen, Z.; Xu, D. A Novel High-Symmetry Cobweb-Like Disk Resonator Gyroscope. IEEE Sens. J. 2019, 19, 10289–10297. [Google Scholar] [CrossRef]
- Liu, Y.; Dorian, C.A. Electronic Bias Compensation for a Gyroscope. Patent EP2615416B1, 8 January 2013. [Google Scholar]
- IEEE Standard 1431-2004; IEEE Standard Specification Format Guide and Test Procedure for Coriolis Vibratory Gyros. IEEE: Piscataway, NJ, USA, 2004.
- Sonmezoglu, S.; Alper, S.E.; Akin, T. An Automatically Mode-Matched MEMS Gyroscope with Wide and Tunable Bandwidth. J. Microelectromech. Syst. 2014, 23, 284–297. [Google Scholar] [CrossRef]
- Xu, P.; Wei, Z.; Guo, Z.; Jia, L.; Han, G.; Si, C.; Ning, J.; Yang, F. A Real-Time Circuit Phase Delay Correction System for MEMS Vibratory Gyroscopes. Micromachines 2021, 12, 506. [Google Scholar] [CrossRef]


| Parameters | ||
|---|---|---|
| = 1°, = 1° | 1.04 × 10⁻¹¹ | 1.15 × 10⁻⁸ |
| = 0.1°, = 1° | 1.04 × 10⁻¹¹ | 1.24 × 10⁻⁹ |
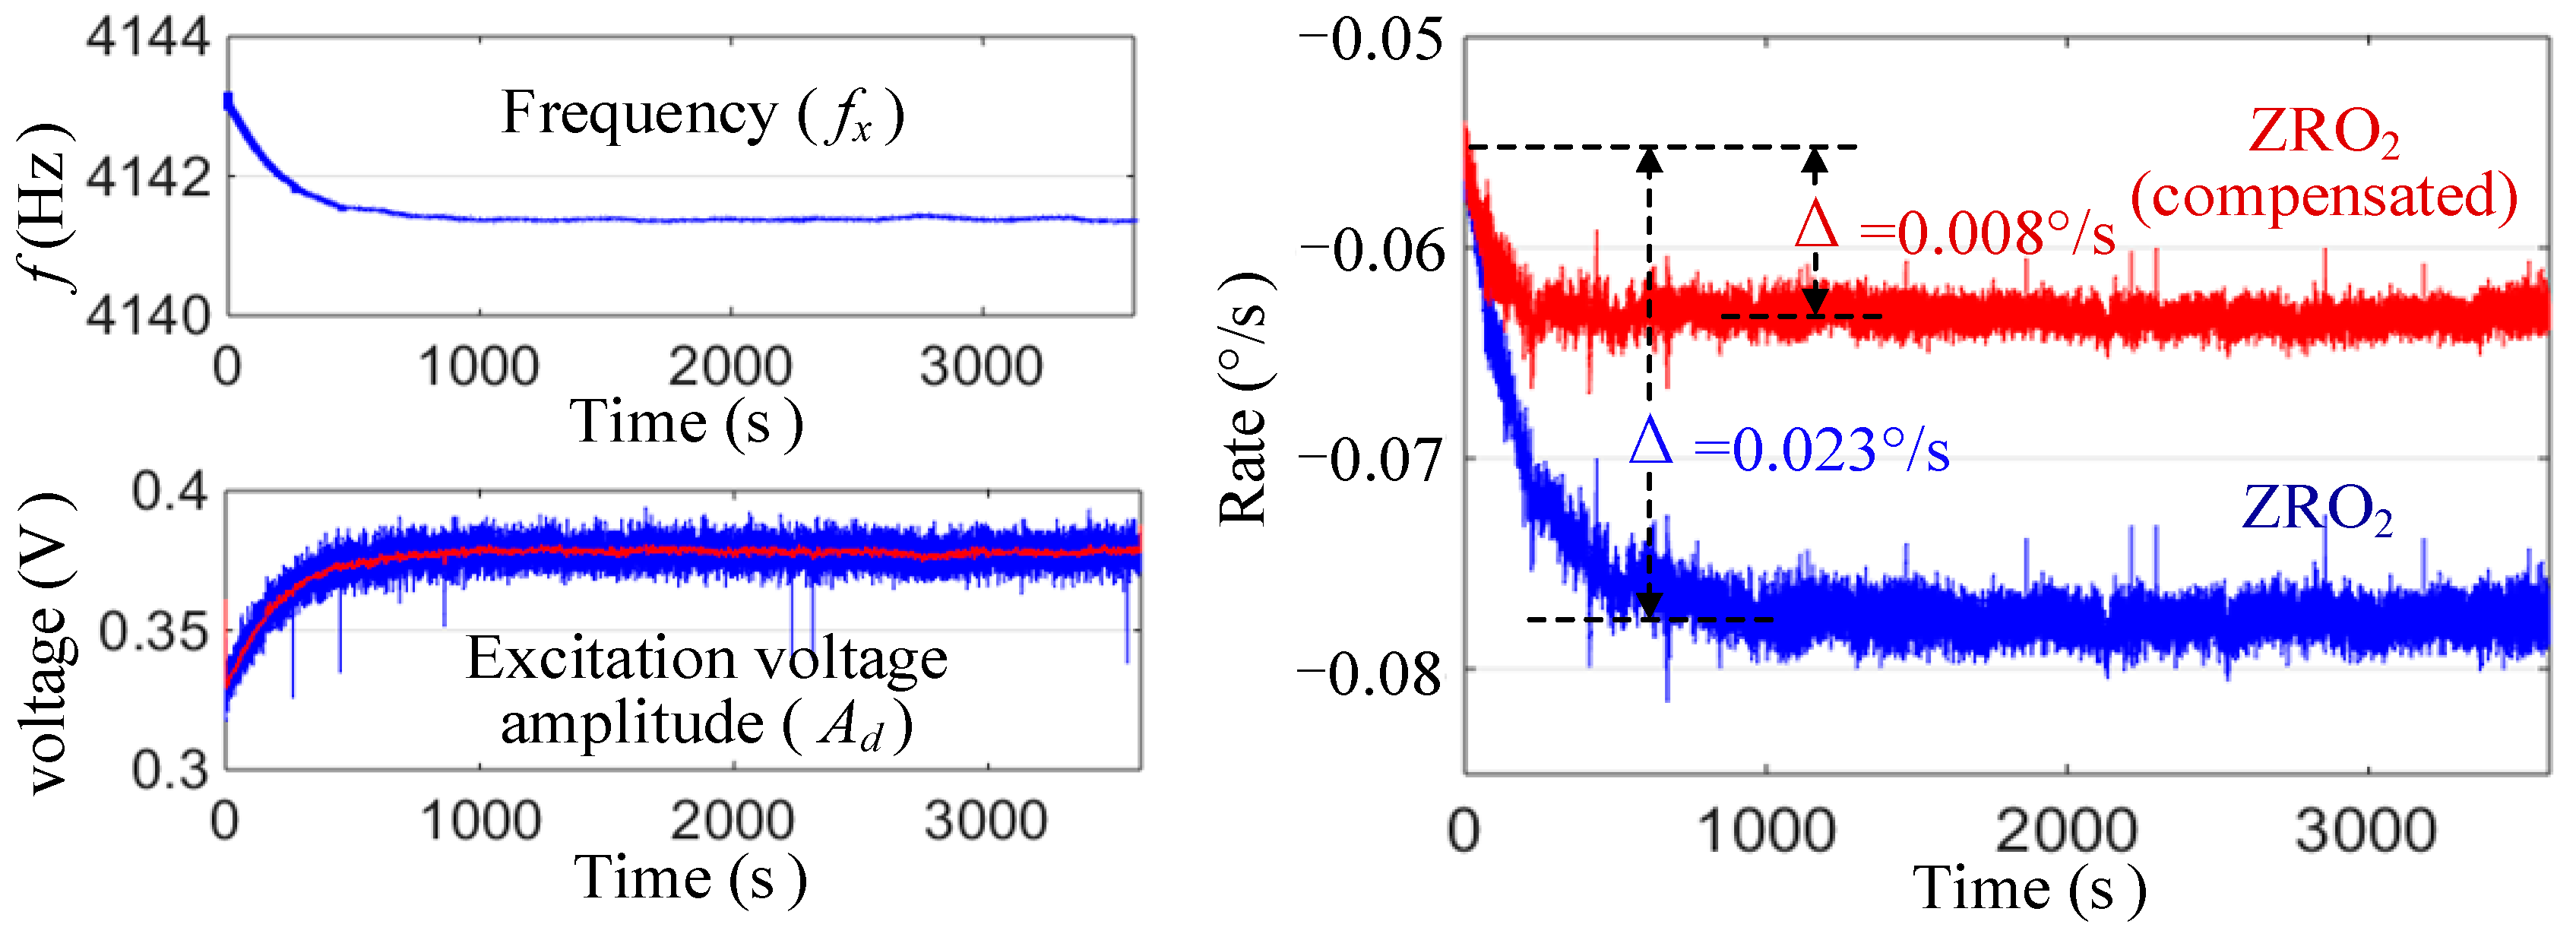
| Parameters | Initial Value during Power-On Stage (about 20 °C) | Value during Stable Stage (about 32 °C) | Variation (Δ) | Rate of Change |
|---|---|---|---|---|
| 4142.9 Hz | 4141.6 Hz | 1.3 Hz | 0.031% | |
| 0.33 V | 0.38 V | 0.05 V | −15.15% | |
| −88.5° | −89.8° | 1.3° | −0.032% () | |
| 373.2 k | 341.3 k | 31.9 k | 8.55% | |
| * | 1.112 × 10⁻³ | 1.071 × 10⁻³ | 0.041 × 10⁻³ | 3.68% |
| - | - | - | - |
| Parameters | Values |
|---|---|
| Proof mass () | 1 mg |
| vibration displacement () * | 2 μm |
| Drive-mood resonant frequency () | 4141.7 Hz |
| Sense-mood resonant frequency () | 4140.6 Hz |
| Drive-mood Q-factor () | 341.3 k |
| Sense-mood Q-factor () | 351.5 k |
| Scale Factor (SF) | 147 mV/(°/s) |
| Carrier signal | 6Vpk@1 MHz |
| Bias Instability (°/h) | ARW (°/√h) | Bias Average (°/s) | Bias Repeatability (°/h) | Bias Drift (°/s) | |
|---|---|---|---|---|---|
| ZRO1 (initial ≈ 0) | 1.28 | 0.020 | −0.073 | 17.01 | 0.037 |
| ZRO2 | 0.36 | 0.019 | −0.077 | 3.44 | 0.023 |
| ZRO2 (compensated) | 0.23 | 0.017 | −0.063 | 3.15 | 0.008 |
Publisher’s Note: MDPI stays neutral with regard to jurisdictional claims in published maps and institutional affiliations. |
© 2022 by the authors. Licensee MDPI, Basel, Switzerland. This article is an open access article distributed under the terms and conditions of the Creative Commons Attribution (CC BY) license (https://creativecommons.org/licenses/by/4.0/).
Share and Cite
Bu, F.; Guo, S.; Fan, B.; Wang, Y. Effect of Quadrature Control Mode on ZRO Drift of MEMS Gyroscope and Online Compensation Method. Micromachines 2022, 13, 419. https://doi.org/10.3390/mi13030419
Bu F, Guo S, Fan B, Wang Y. Effect of Quadrature Control Mode on ZRO Drift of MEMS Gyroscope and Online Compensation Method. Micromachines. 2022; 13(3):419. https://doi.org/10.3390/mi13030419
Chicago/Turabian StyleBu, Feng, Shuwen Guo, Bo Fan, and Yiwang Wang. 2022. "Effect of Quadrature Control Mode on ZRO Drift of MEMS Gyroscope and Online Compensation Method" Micromachines 13, no. 3: 419. https://doi.org/10.3390/mi13030419
APA StyleBu, F., Guo, S., Fan, B., & Wang, Y. (2022). Effect of Quadrature Control Mode on ZRO Drift of MEMS Gyroscope and Online Compensation Method. Micromachines, 13(3), 419. https://doi.org/10.3390/mi13030419