
Quality Prediction and Control in Wire Arc Additive Manufacturing via Novel Machine Learning Framework


Abstract
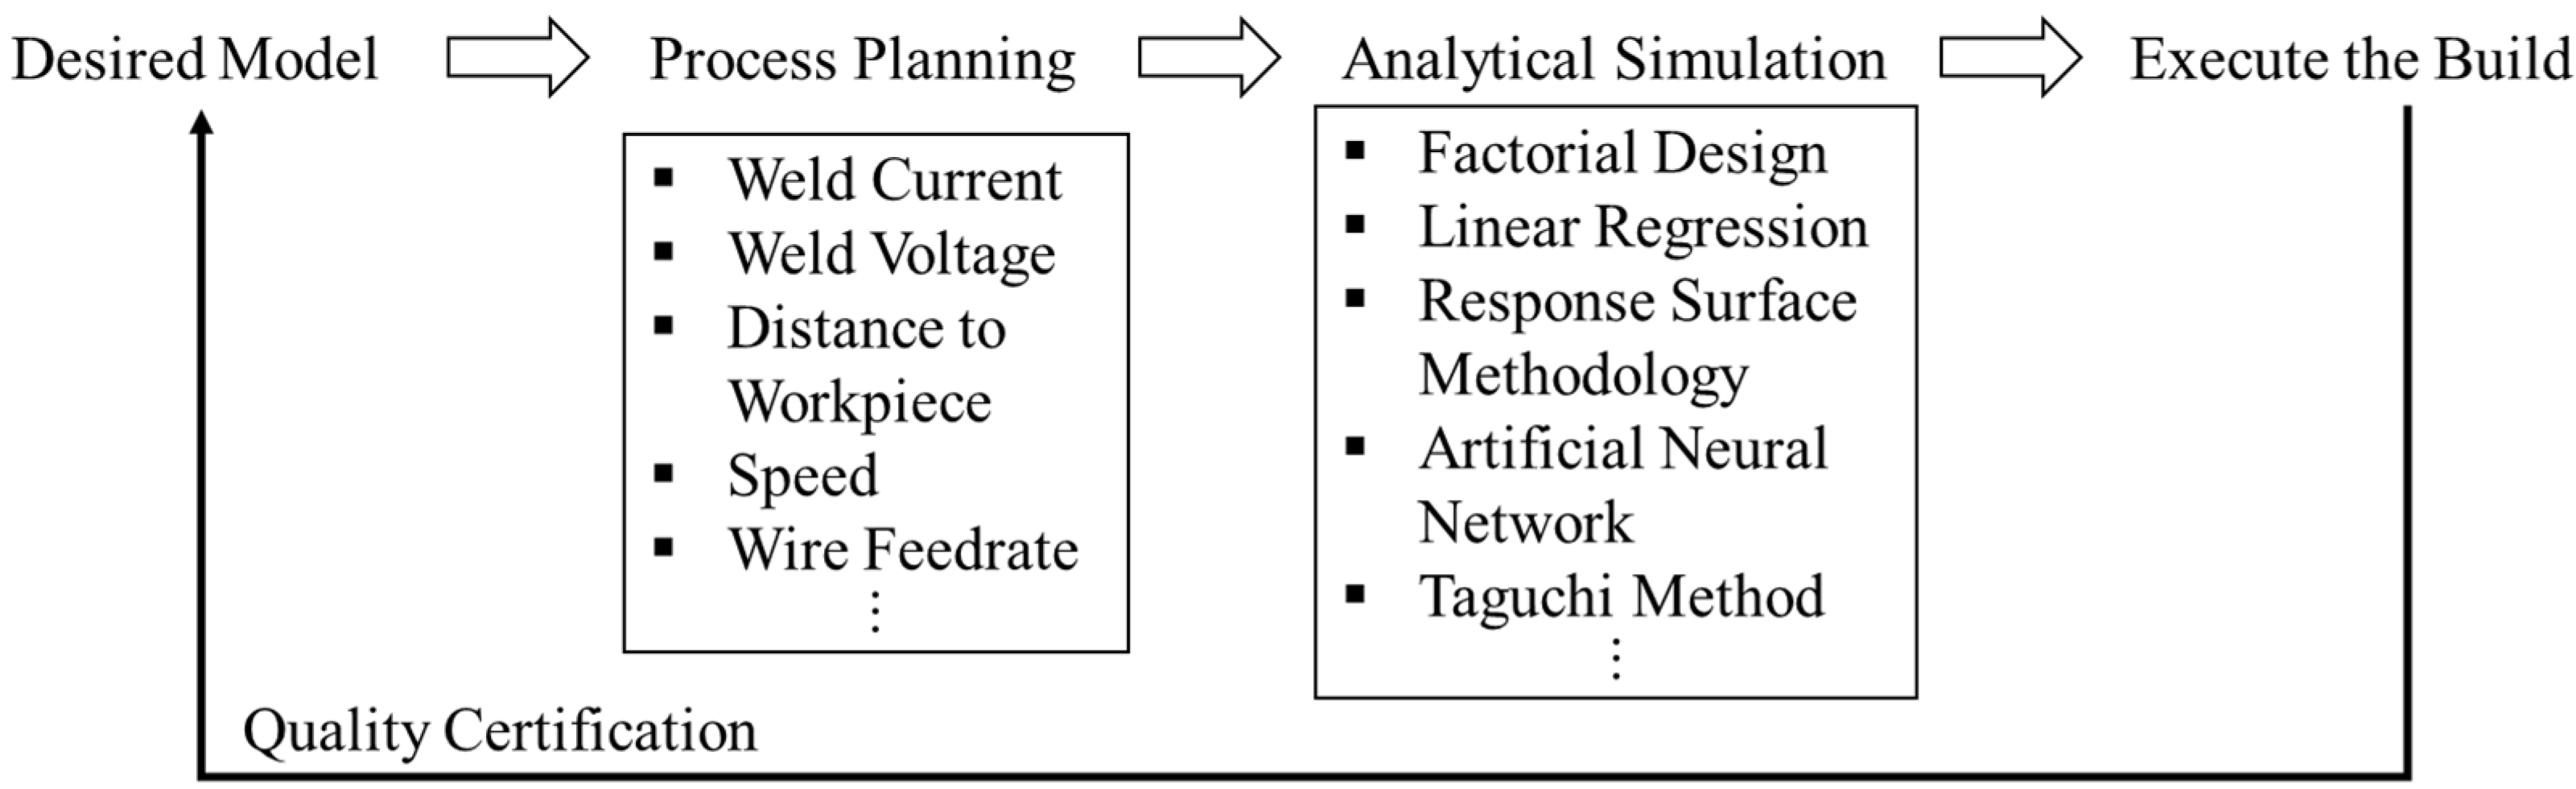
:1. Introduction
- A surrogate model contains one response but with multiple process variables. It is difficult to reversely infer and indicate the domain of the process variable based on single/multiple response data (e.g., (: process variables, : process response).
- A surrogate model primarily focuses on the possibility of the response deviation and cannot provide a numerical level of such deviation.
- Machine learning models, such as k-nearest neighbors (KNN), naïve Bayes mainly focus on predicting the categorical response. Therefore, the quantitative analysis of the desired bead shape is not achievable.
- Other machine learning models, such as response surface methodology (RSM), dominantly use a second-degree polynomial model to indicate the input-output relationship. Still, the reverse indication of the input from the desired output cannot be obtained.
- Develop a quantitative process-quality machine learning framework of influential process parameters towards deposition quality for stainless steel on the WAAM process.
- Classify the correlated process parameters and construct a qualitative model towards the deposition shape level from the correlated parameters.
- Printable zone development is based on quantitative models in the network that control the deposition shape at a certain level.
- A predictive model for controlling the deposited bead shape (width, height, and penetration depth) based on sets of input process parameters.
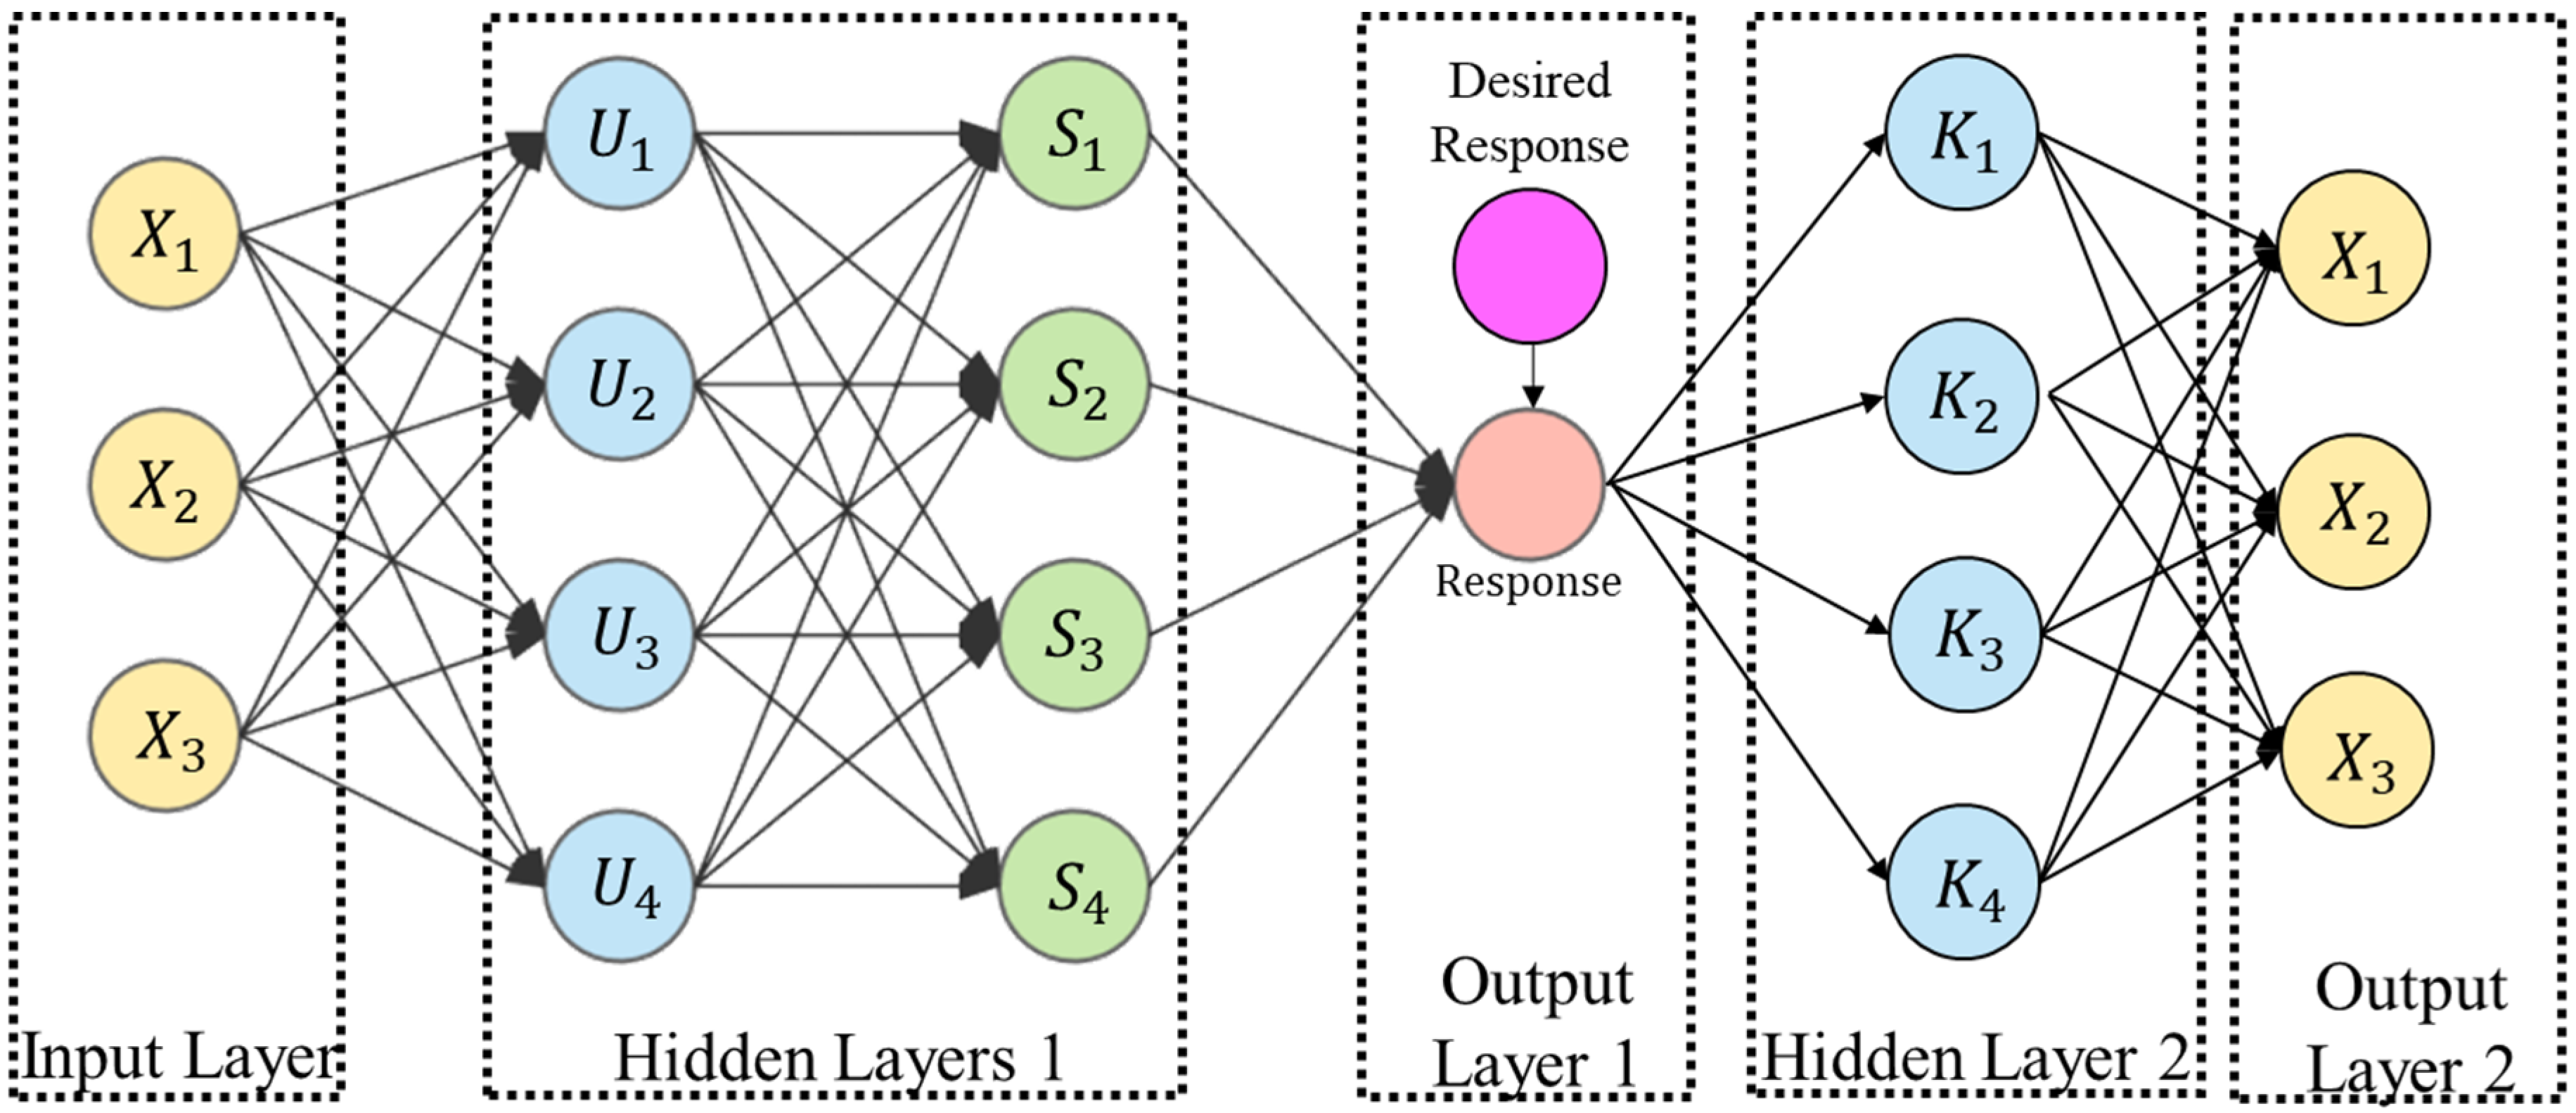
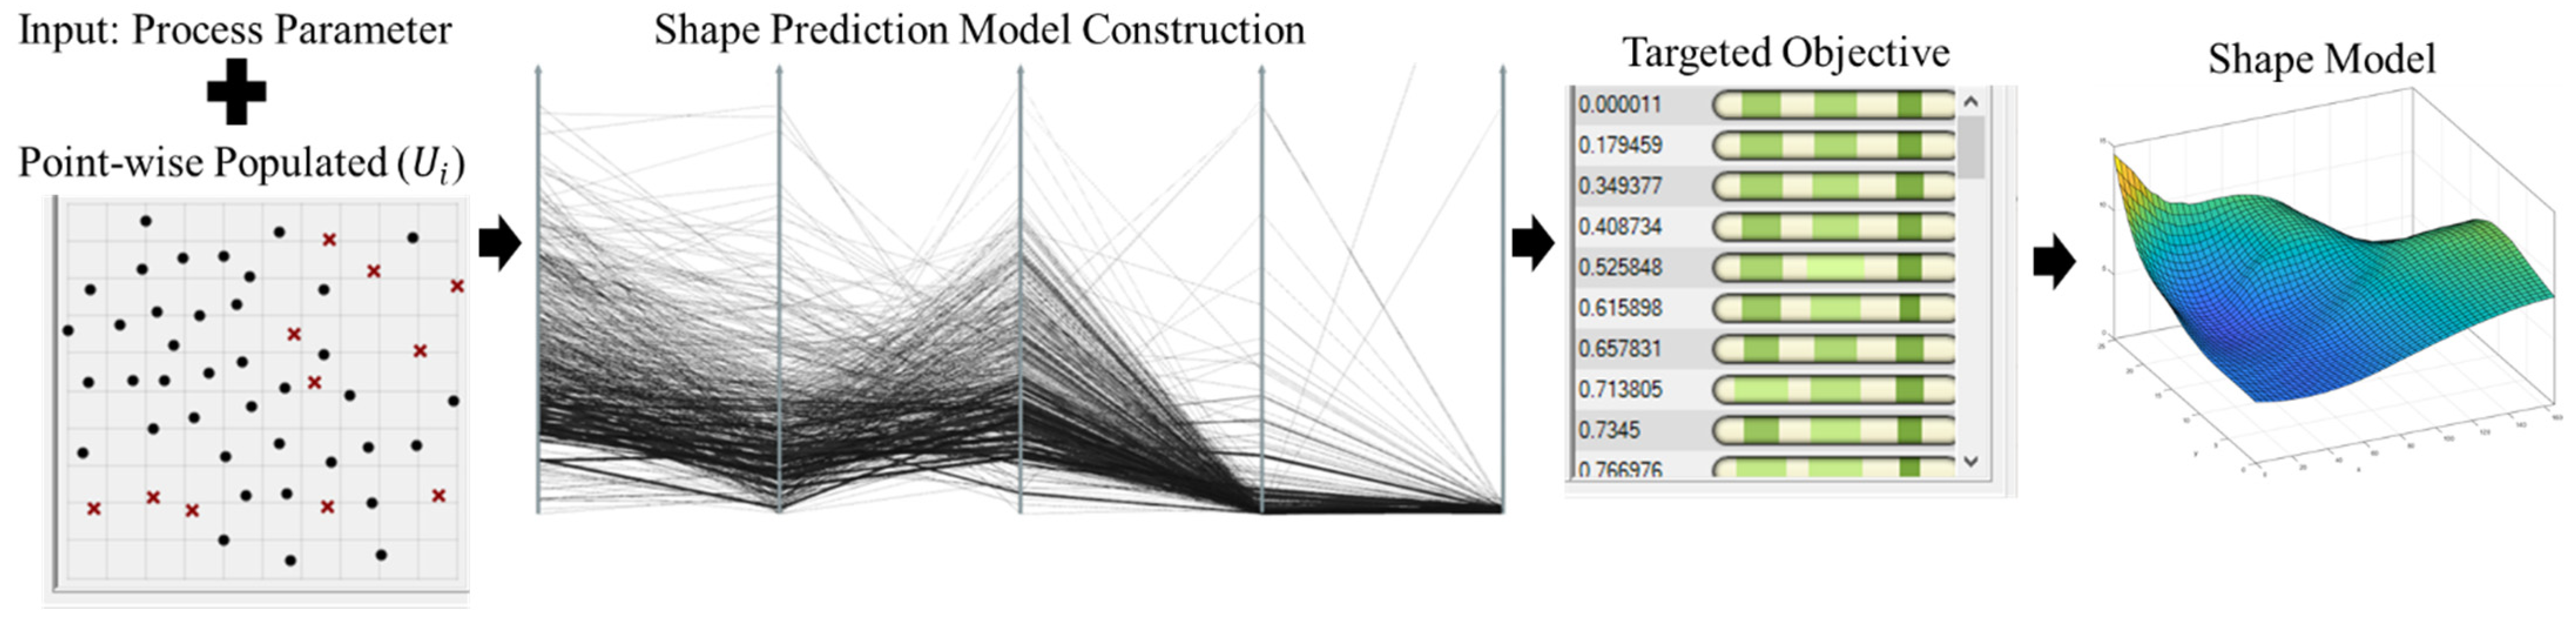
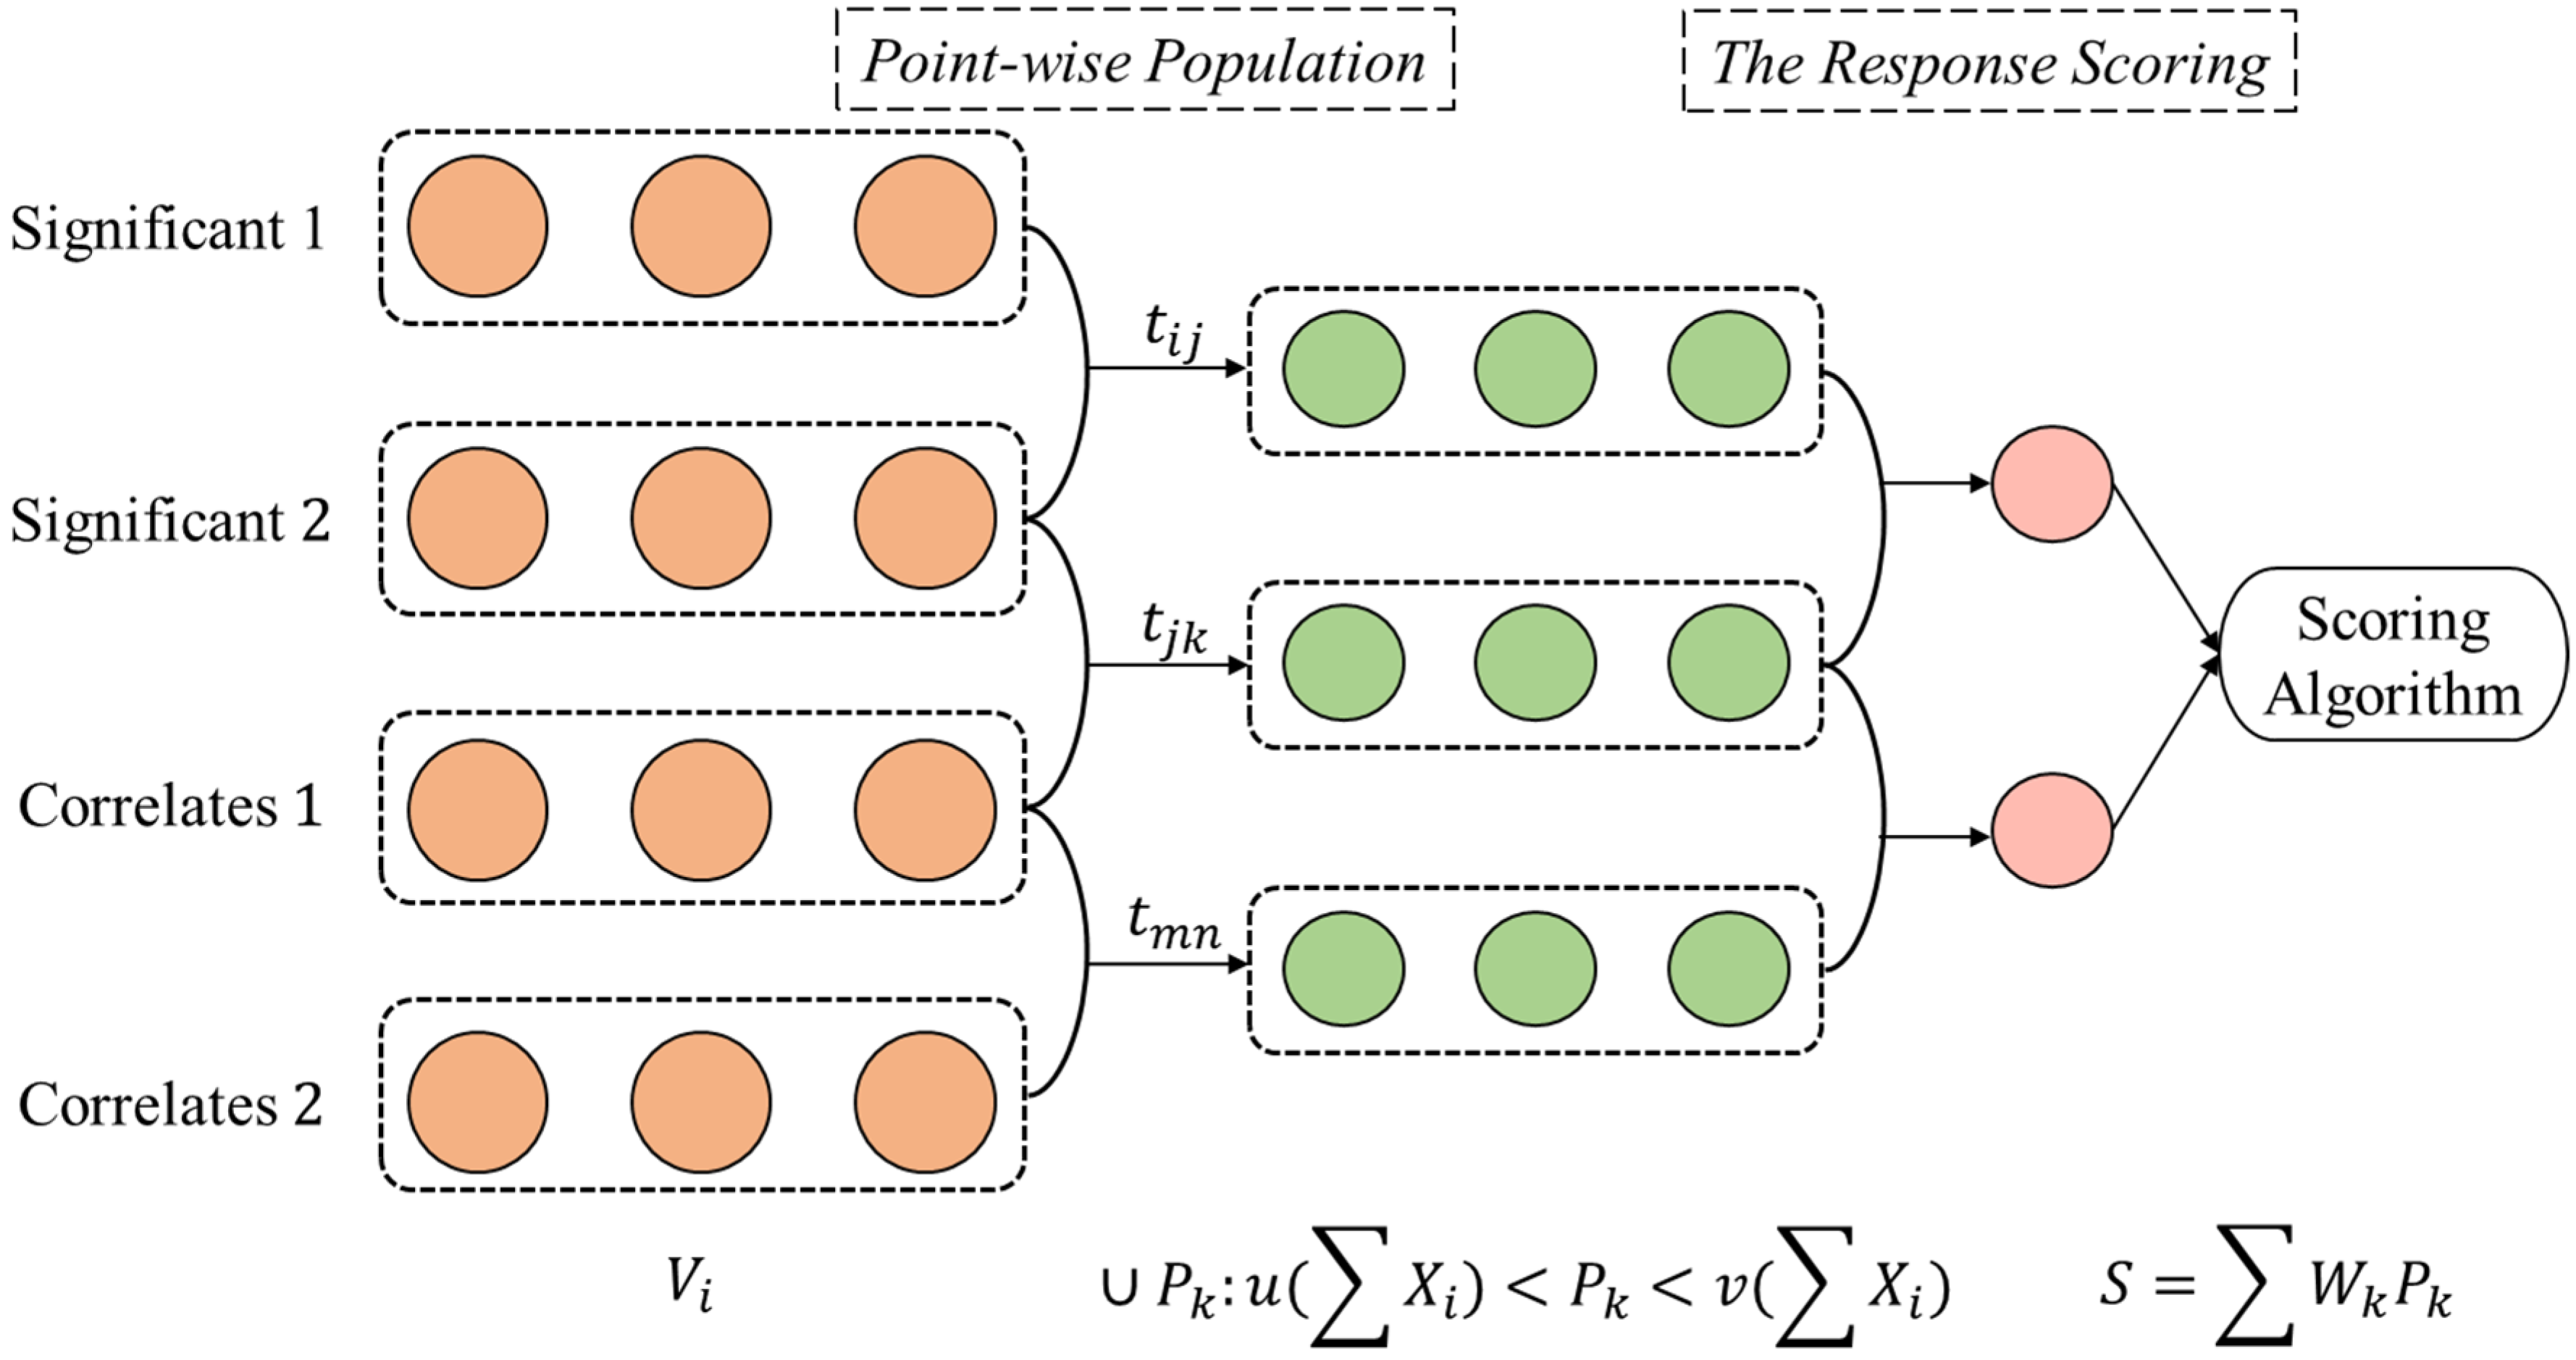
2. Methodology
| Algorithm: Machine learning framework for decomposed vectorized data. |
| Algorithm: Machine Learning Framework Construction |
| Input: Decomposed Variables {} from {}: |
| Output: Point-wise Populated (), and Scored Response {S} |
| 1. Initialize , {} |
| 2. : |
| 3. ) |
| 4. |
| 5. |
| 6. Weight function = |
7.  Update {} and {} Update {} and {} |
| 8. Return , S |
- Objectives:
- Randomized: {, ,…, }
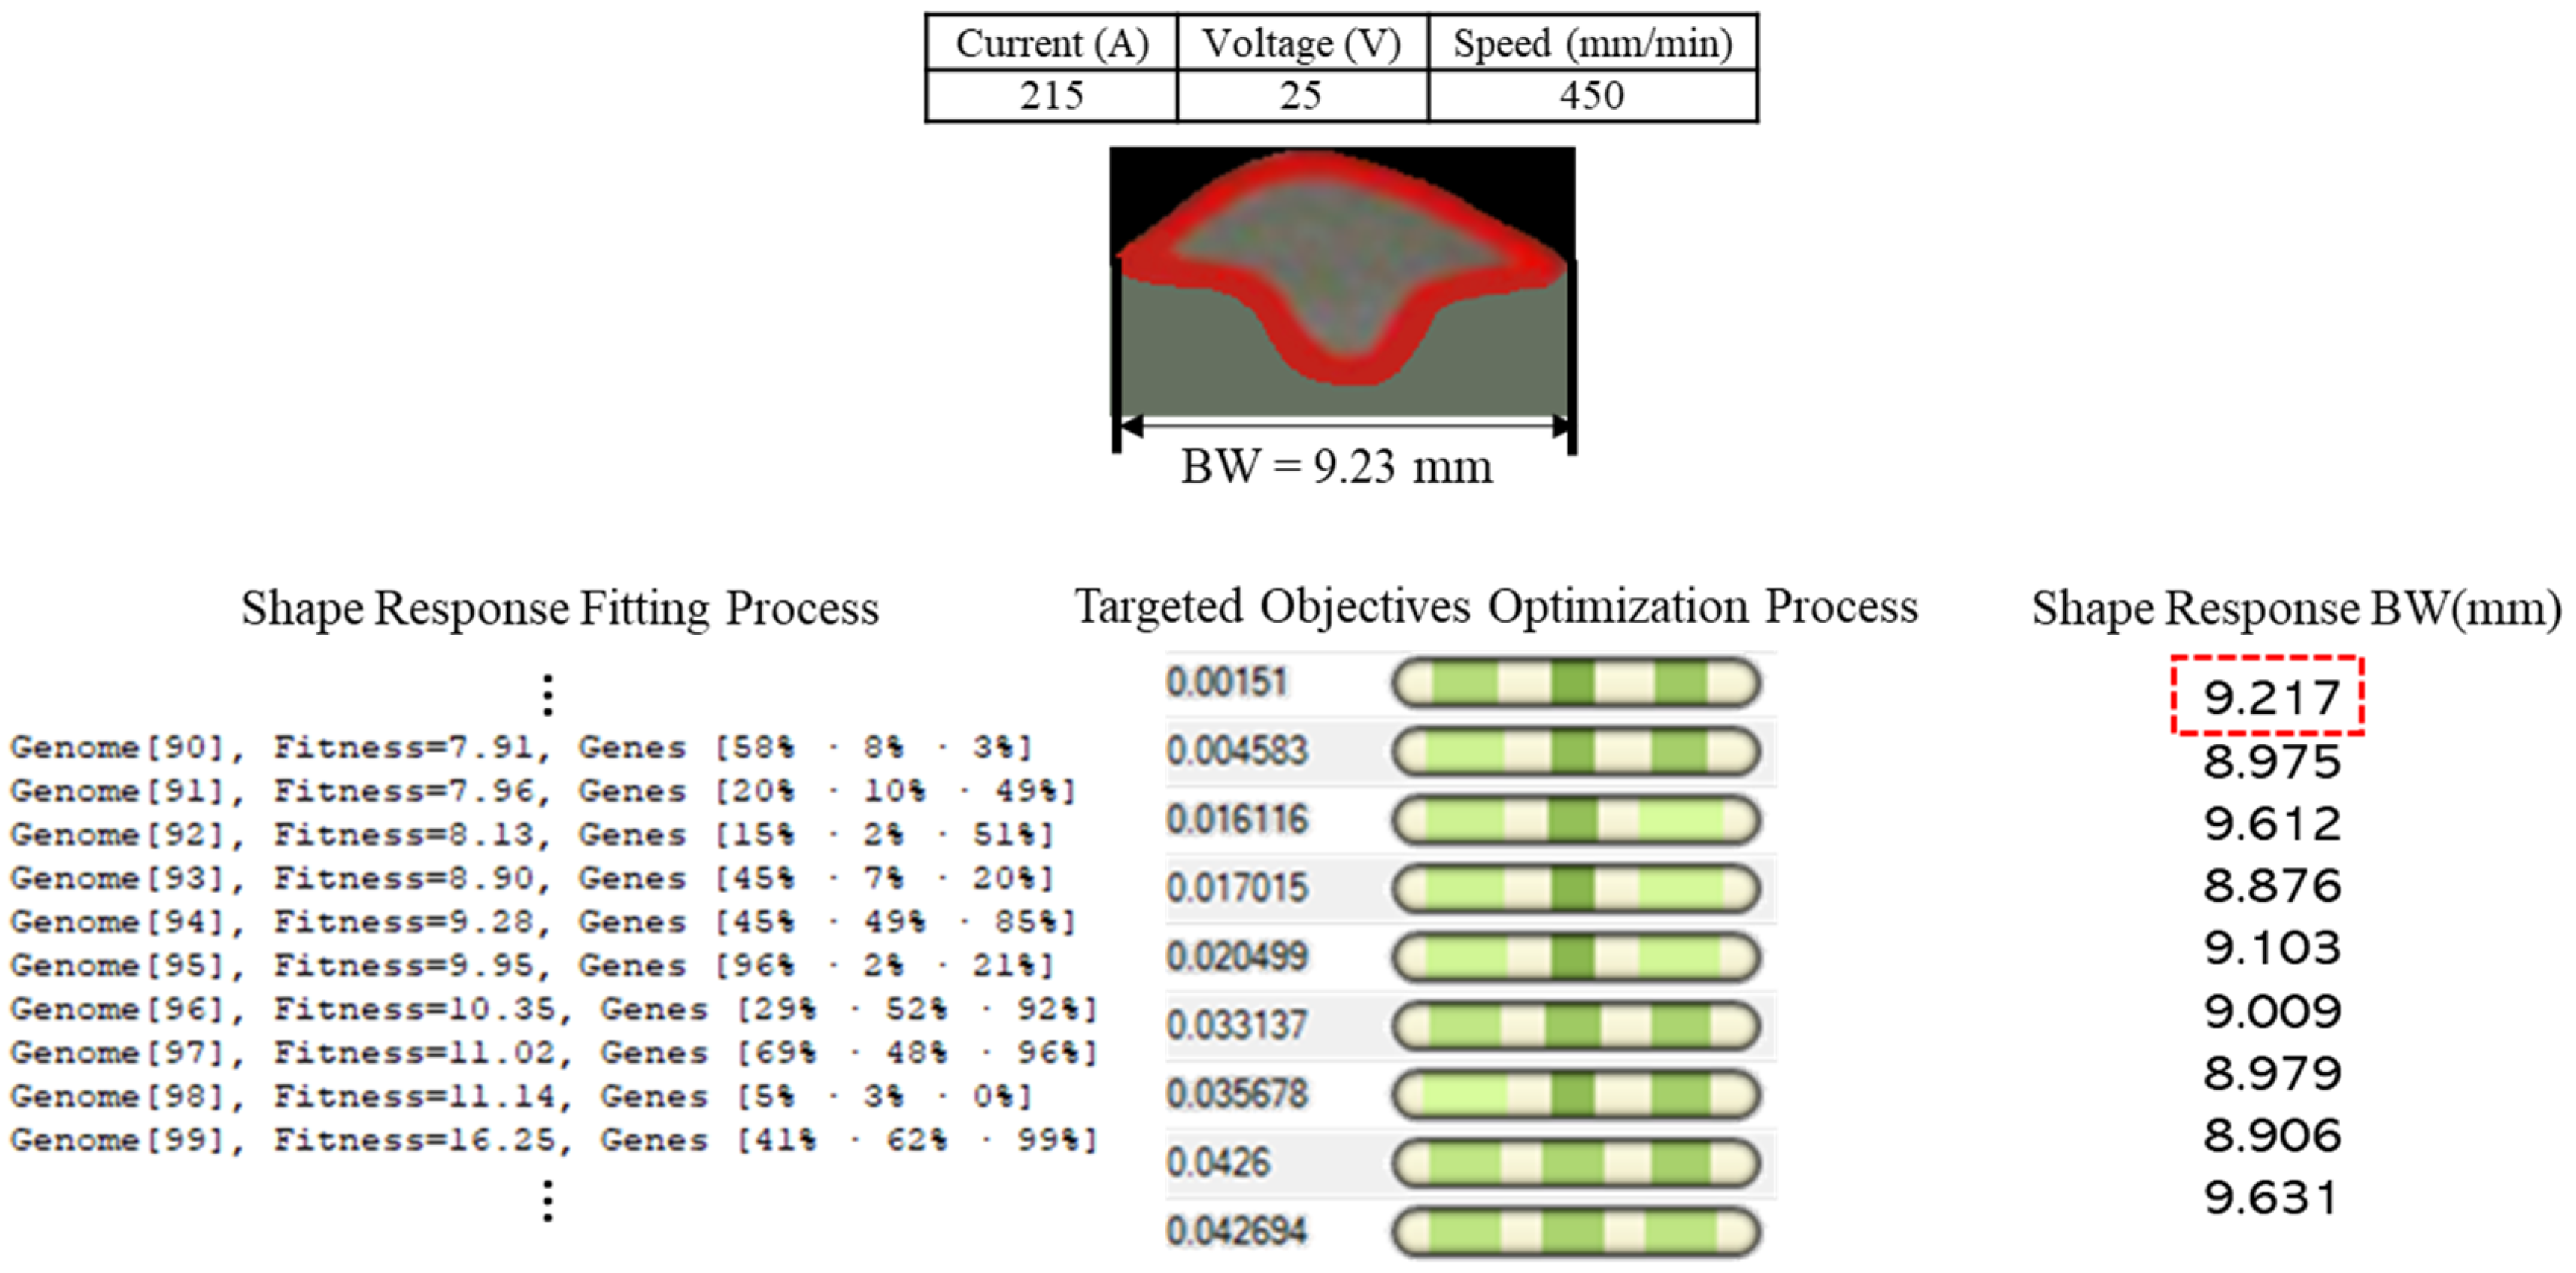
 Solution: Shape Response =
 - Objectives: , : targeted response
- Randomized: {}
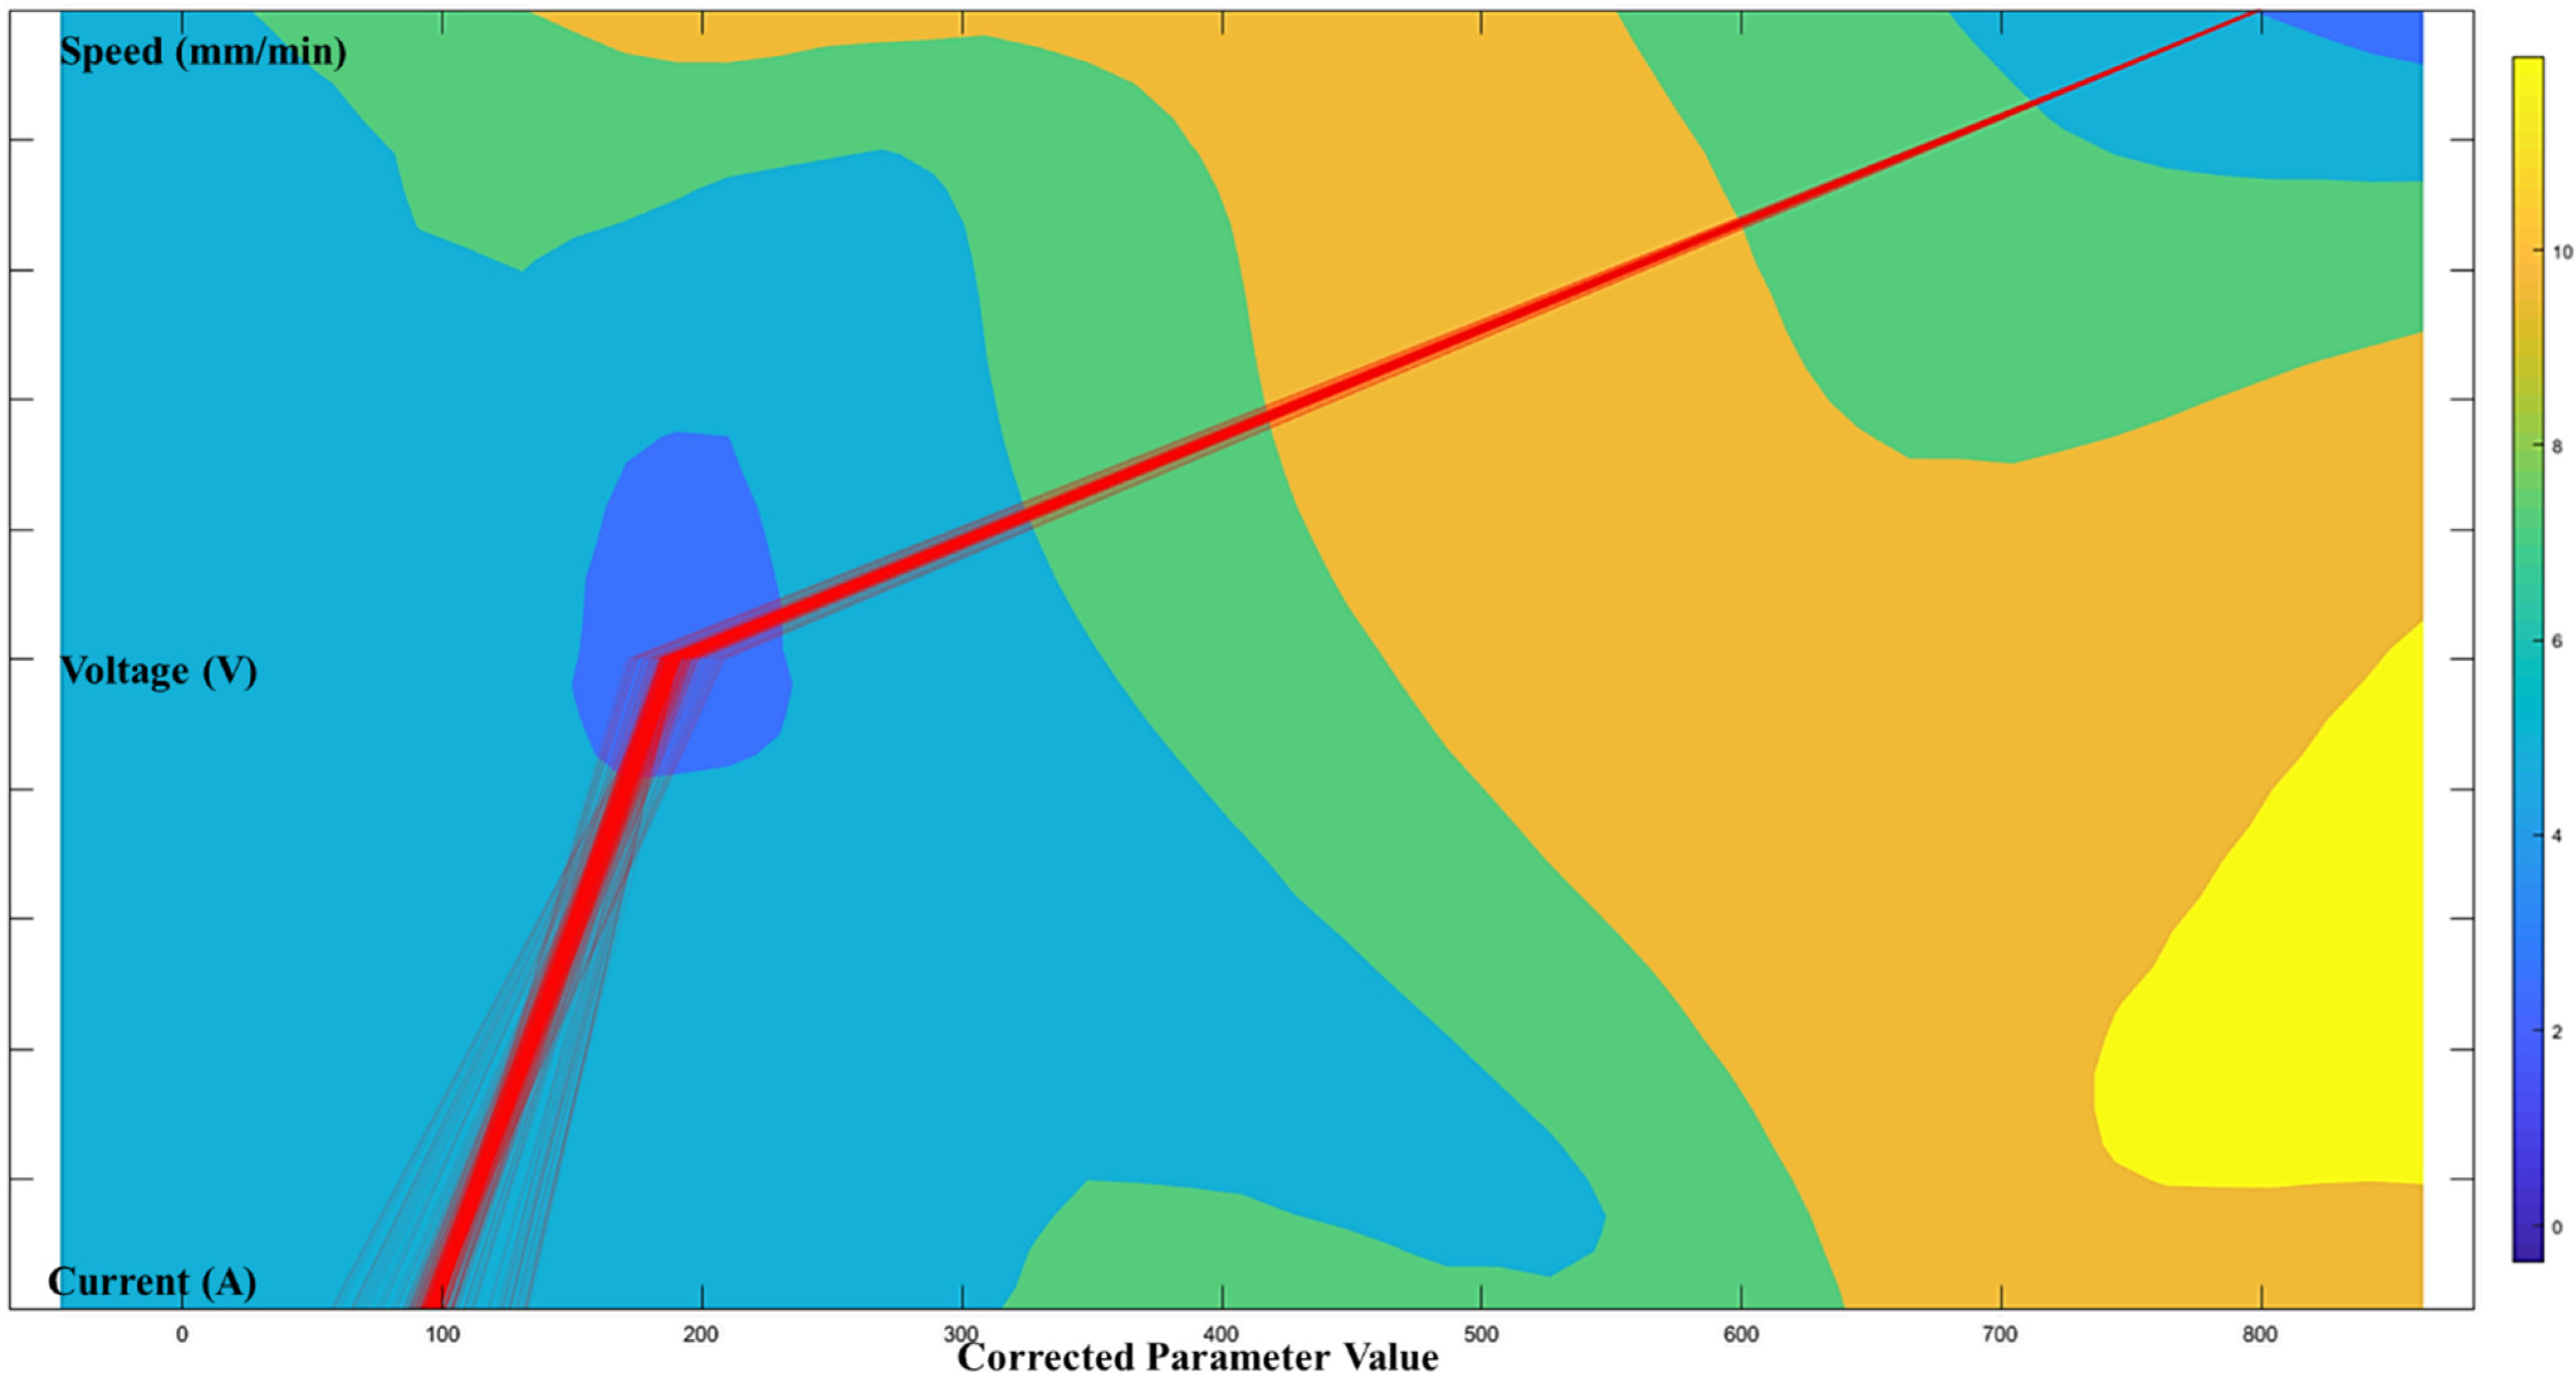
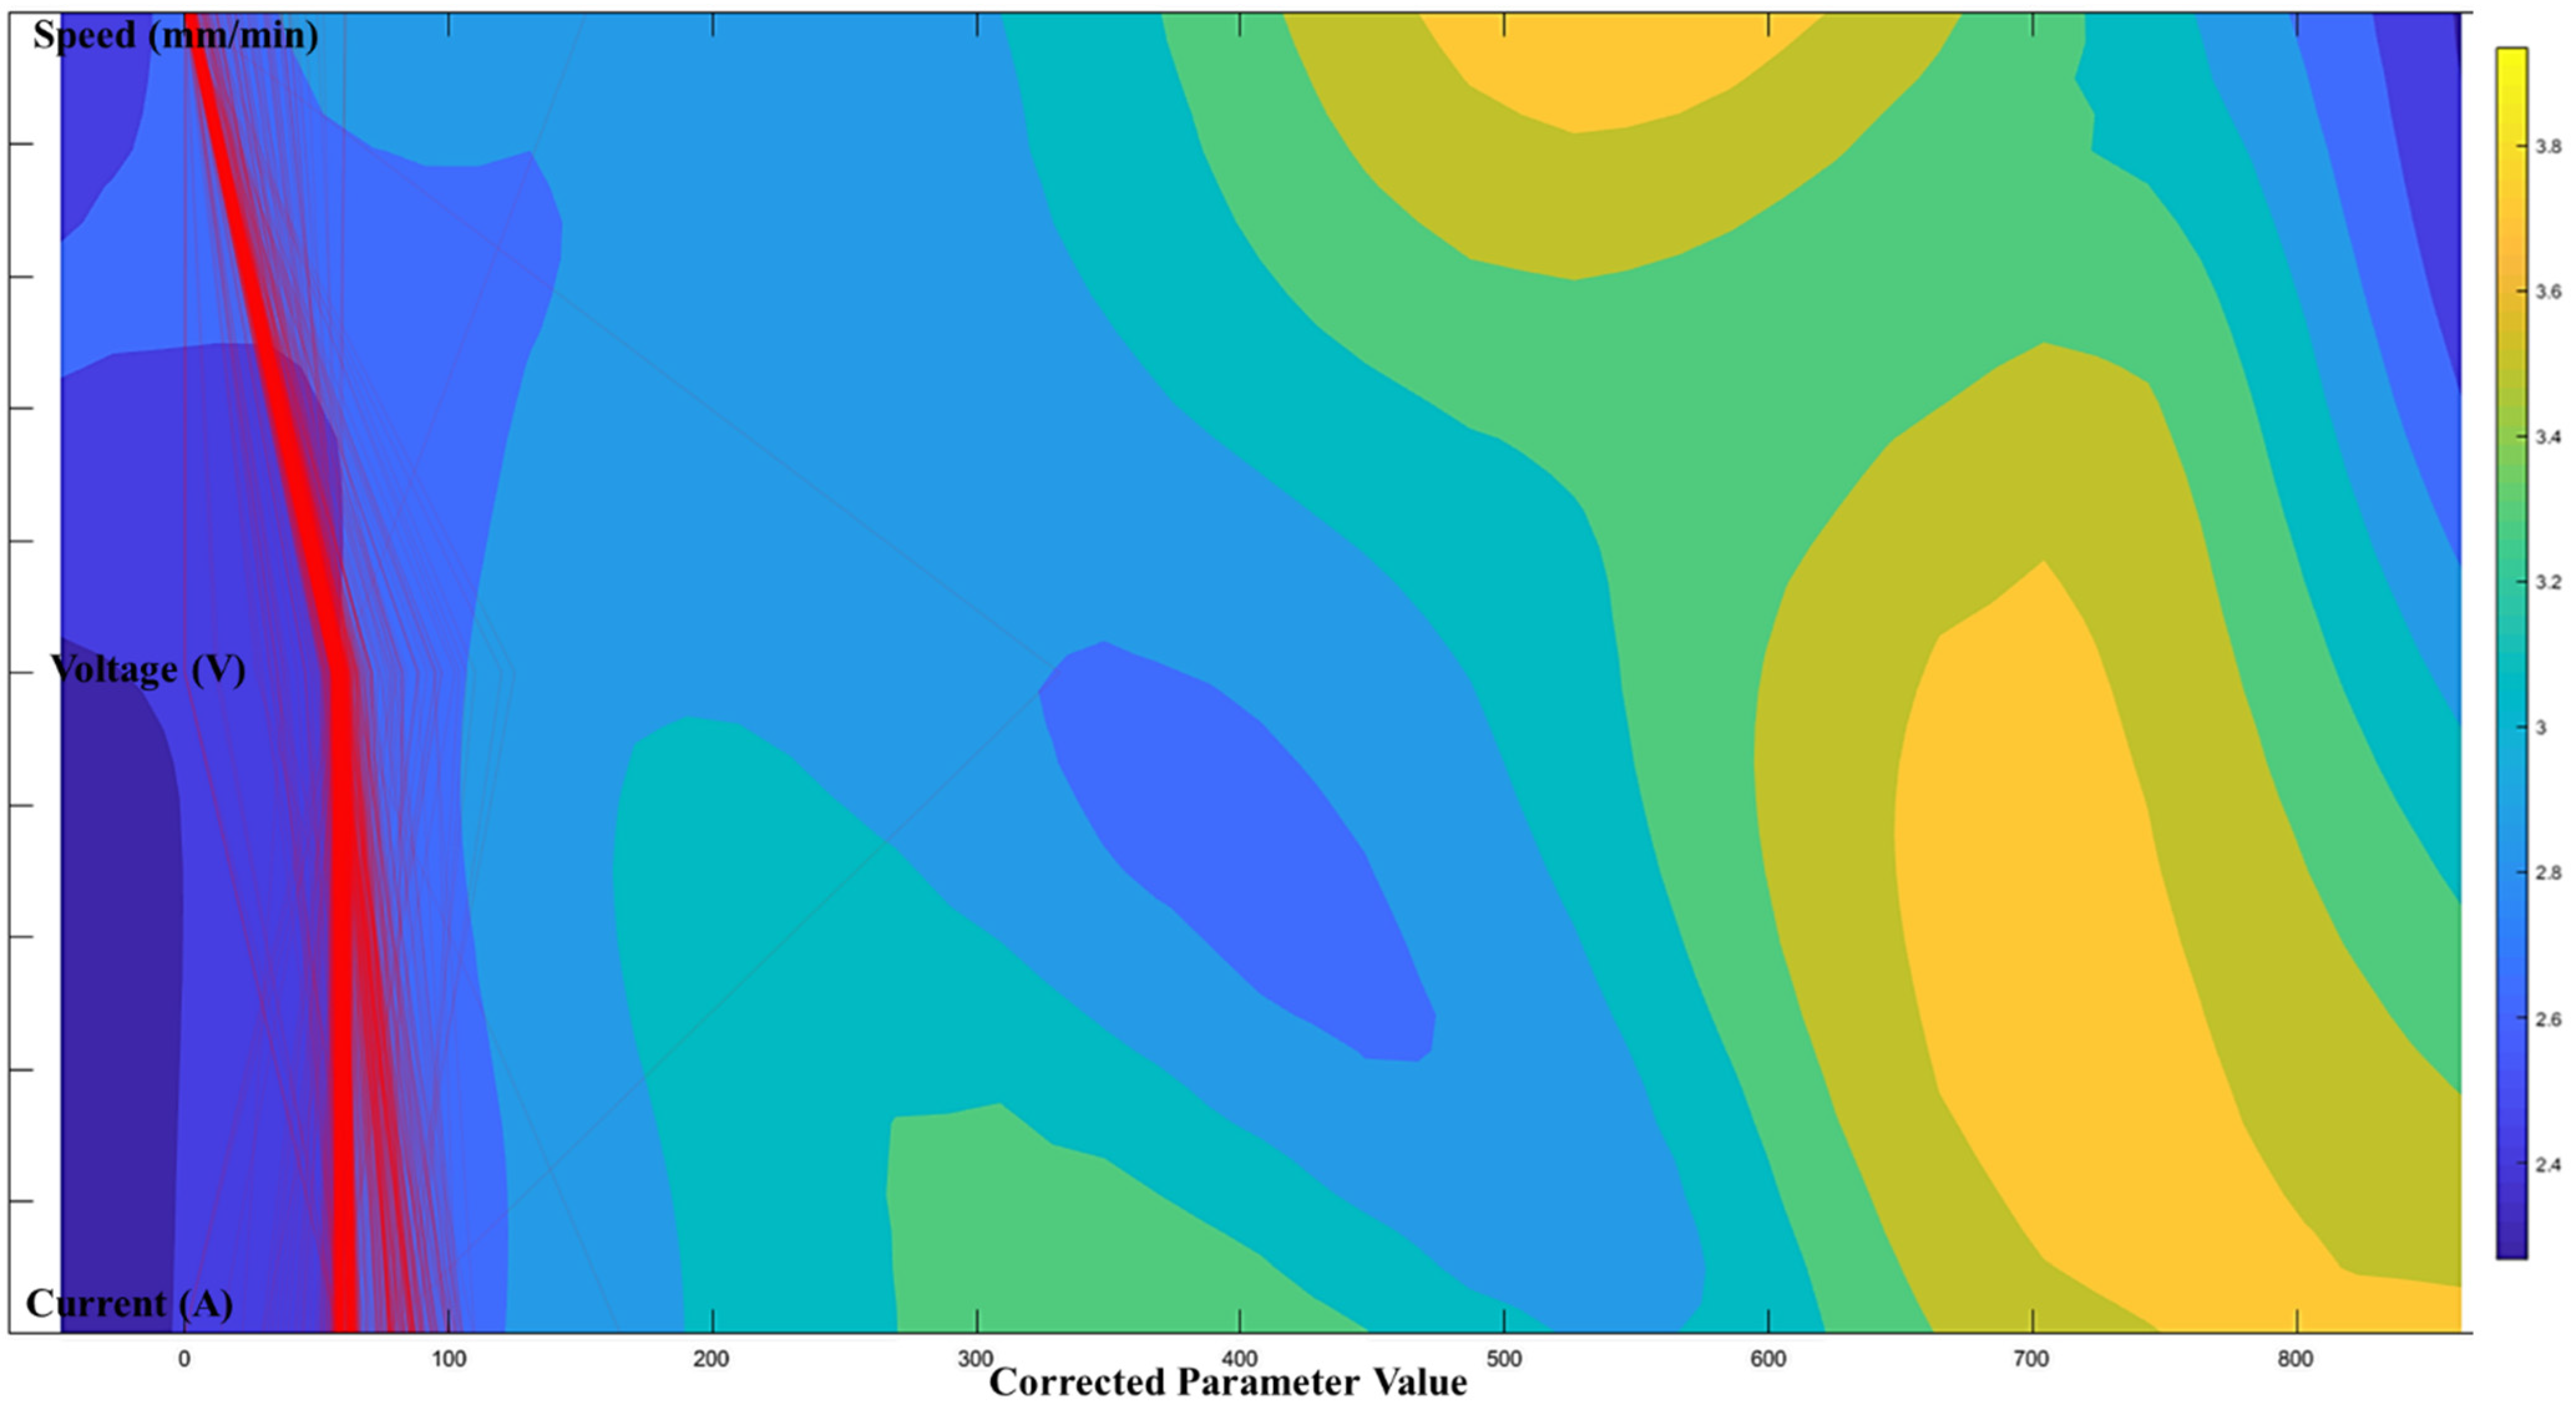
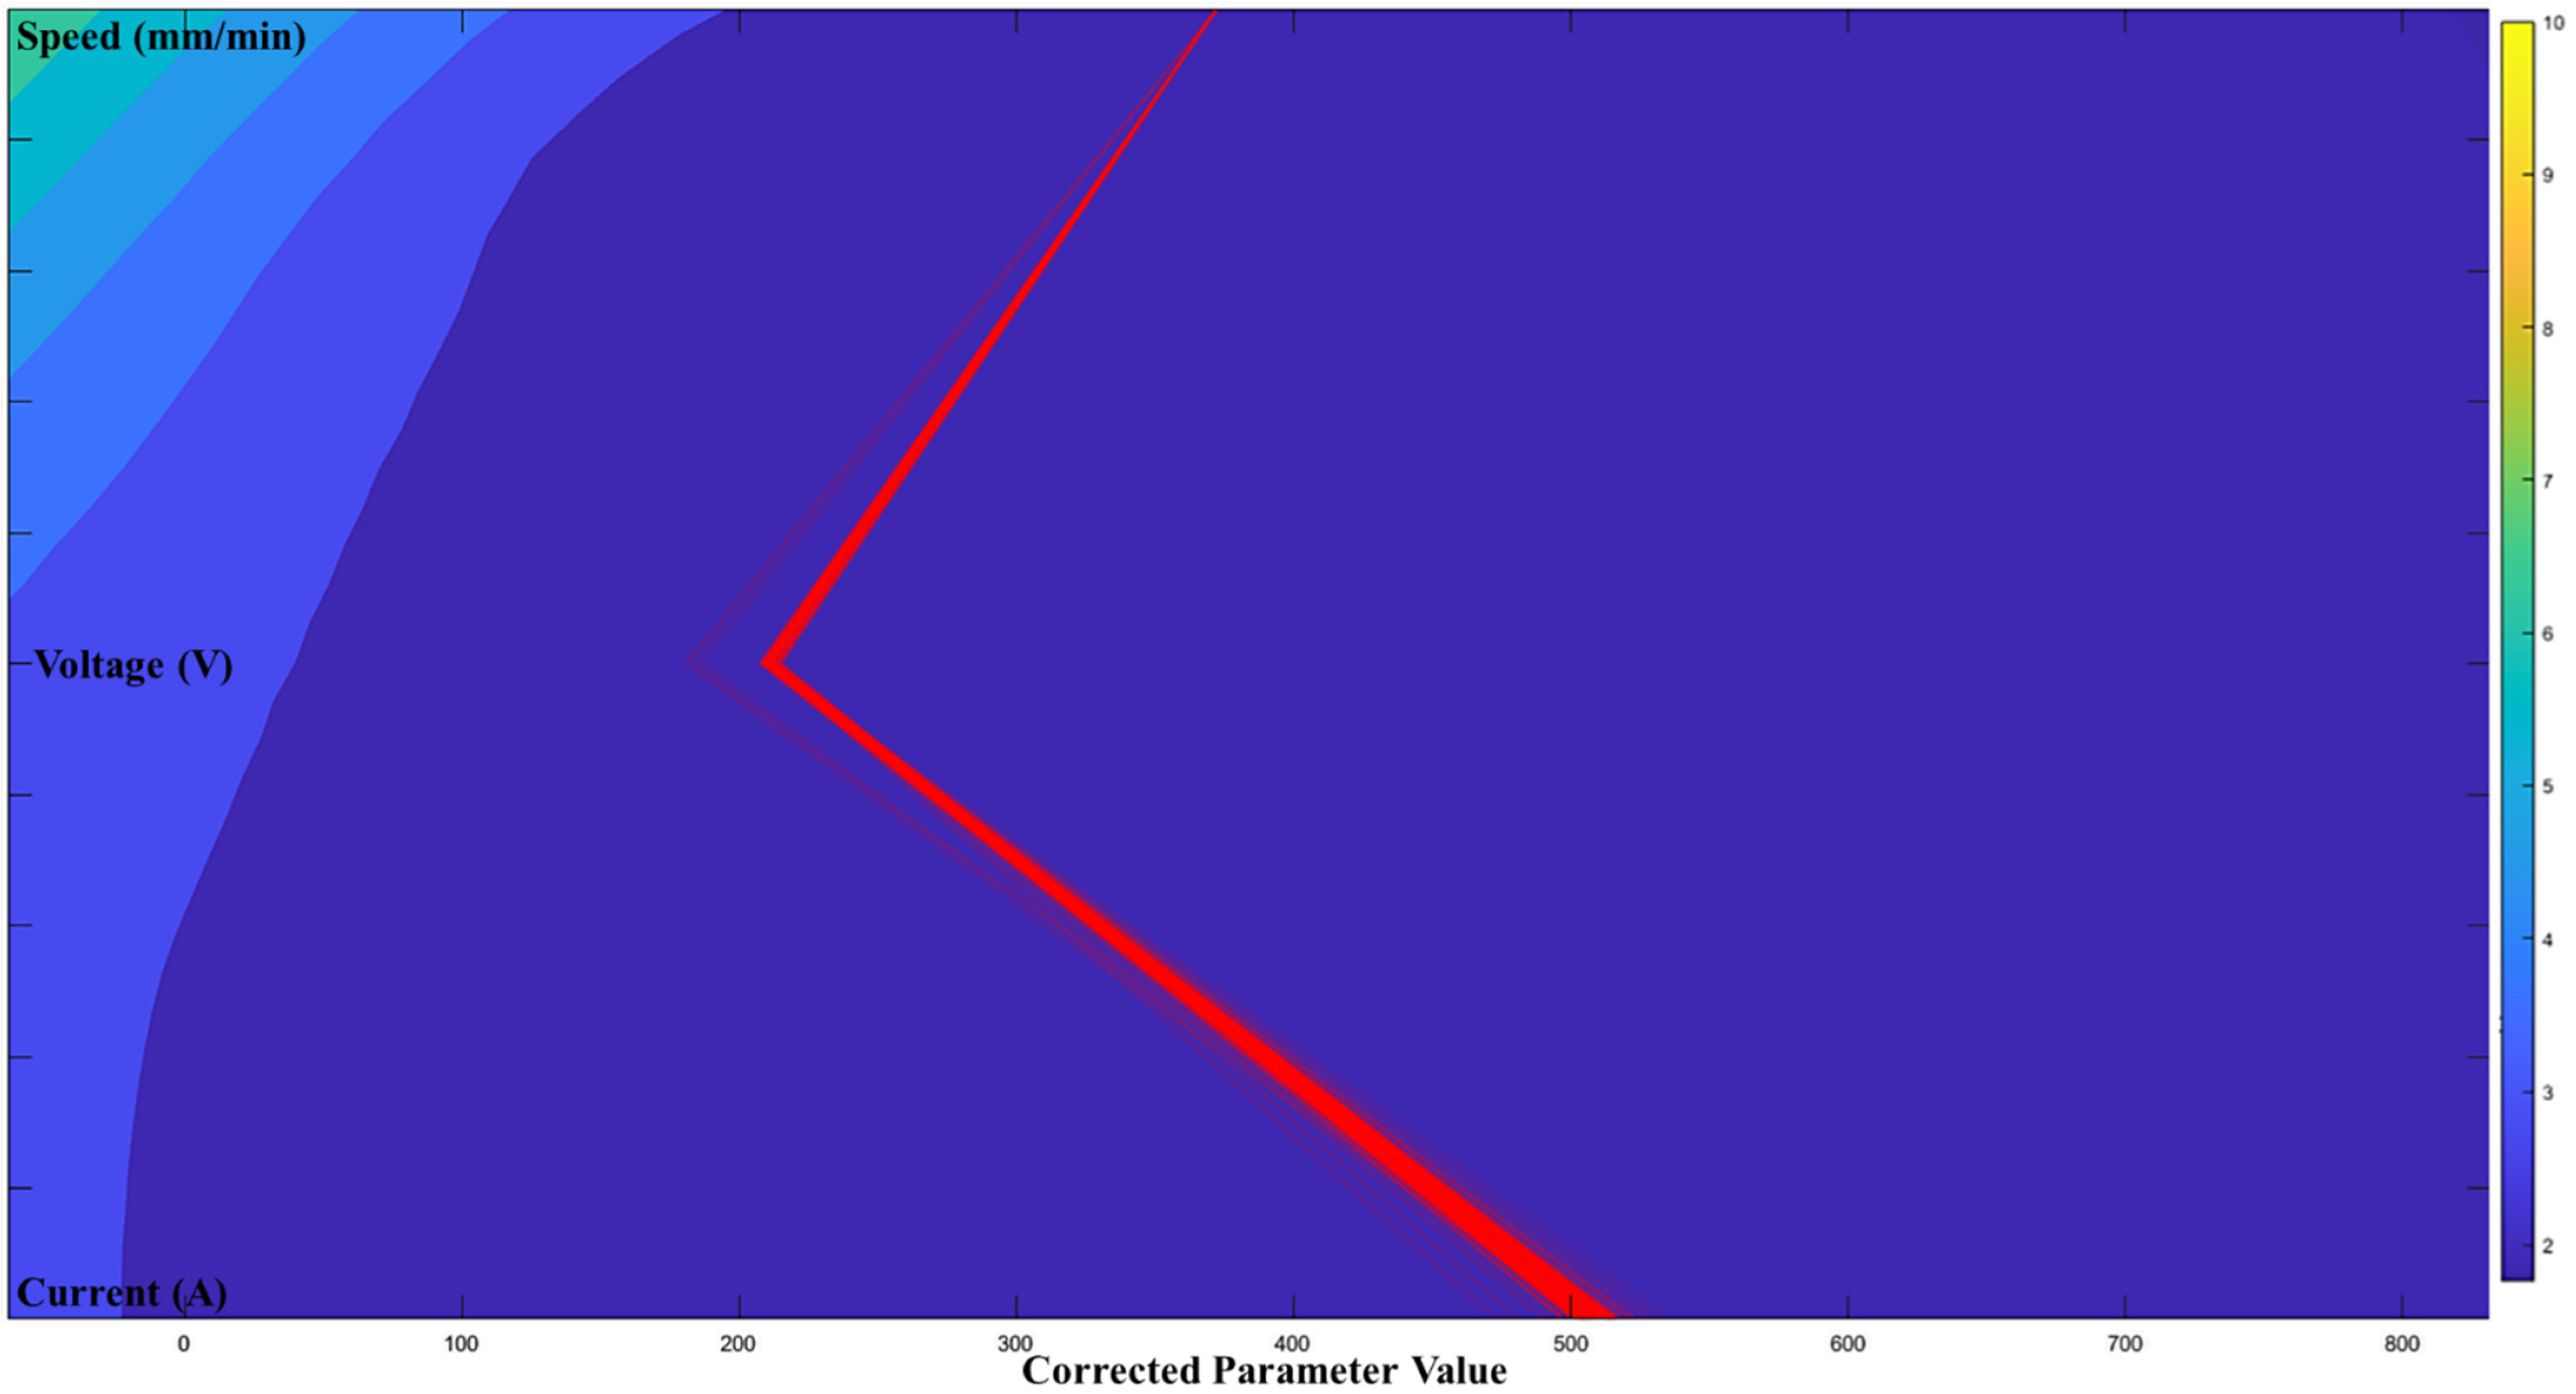
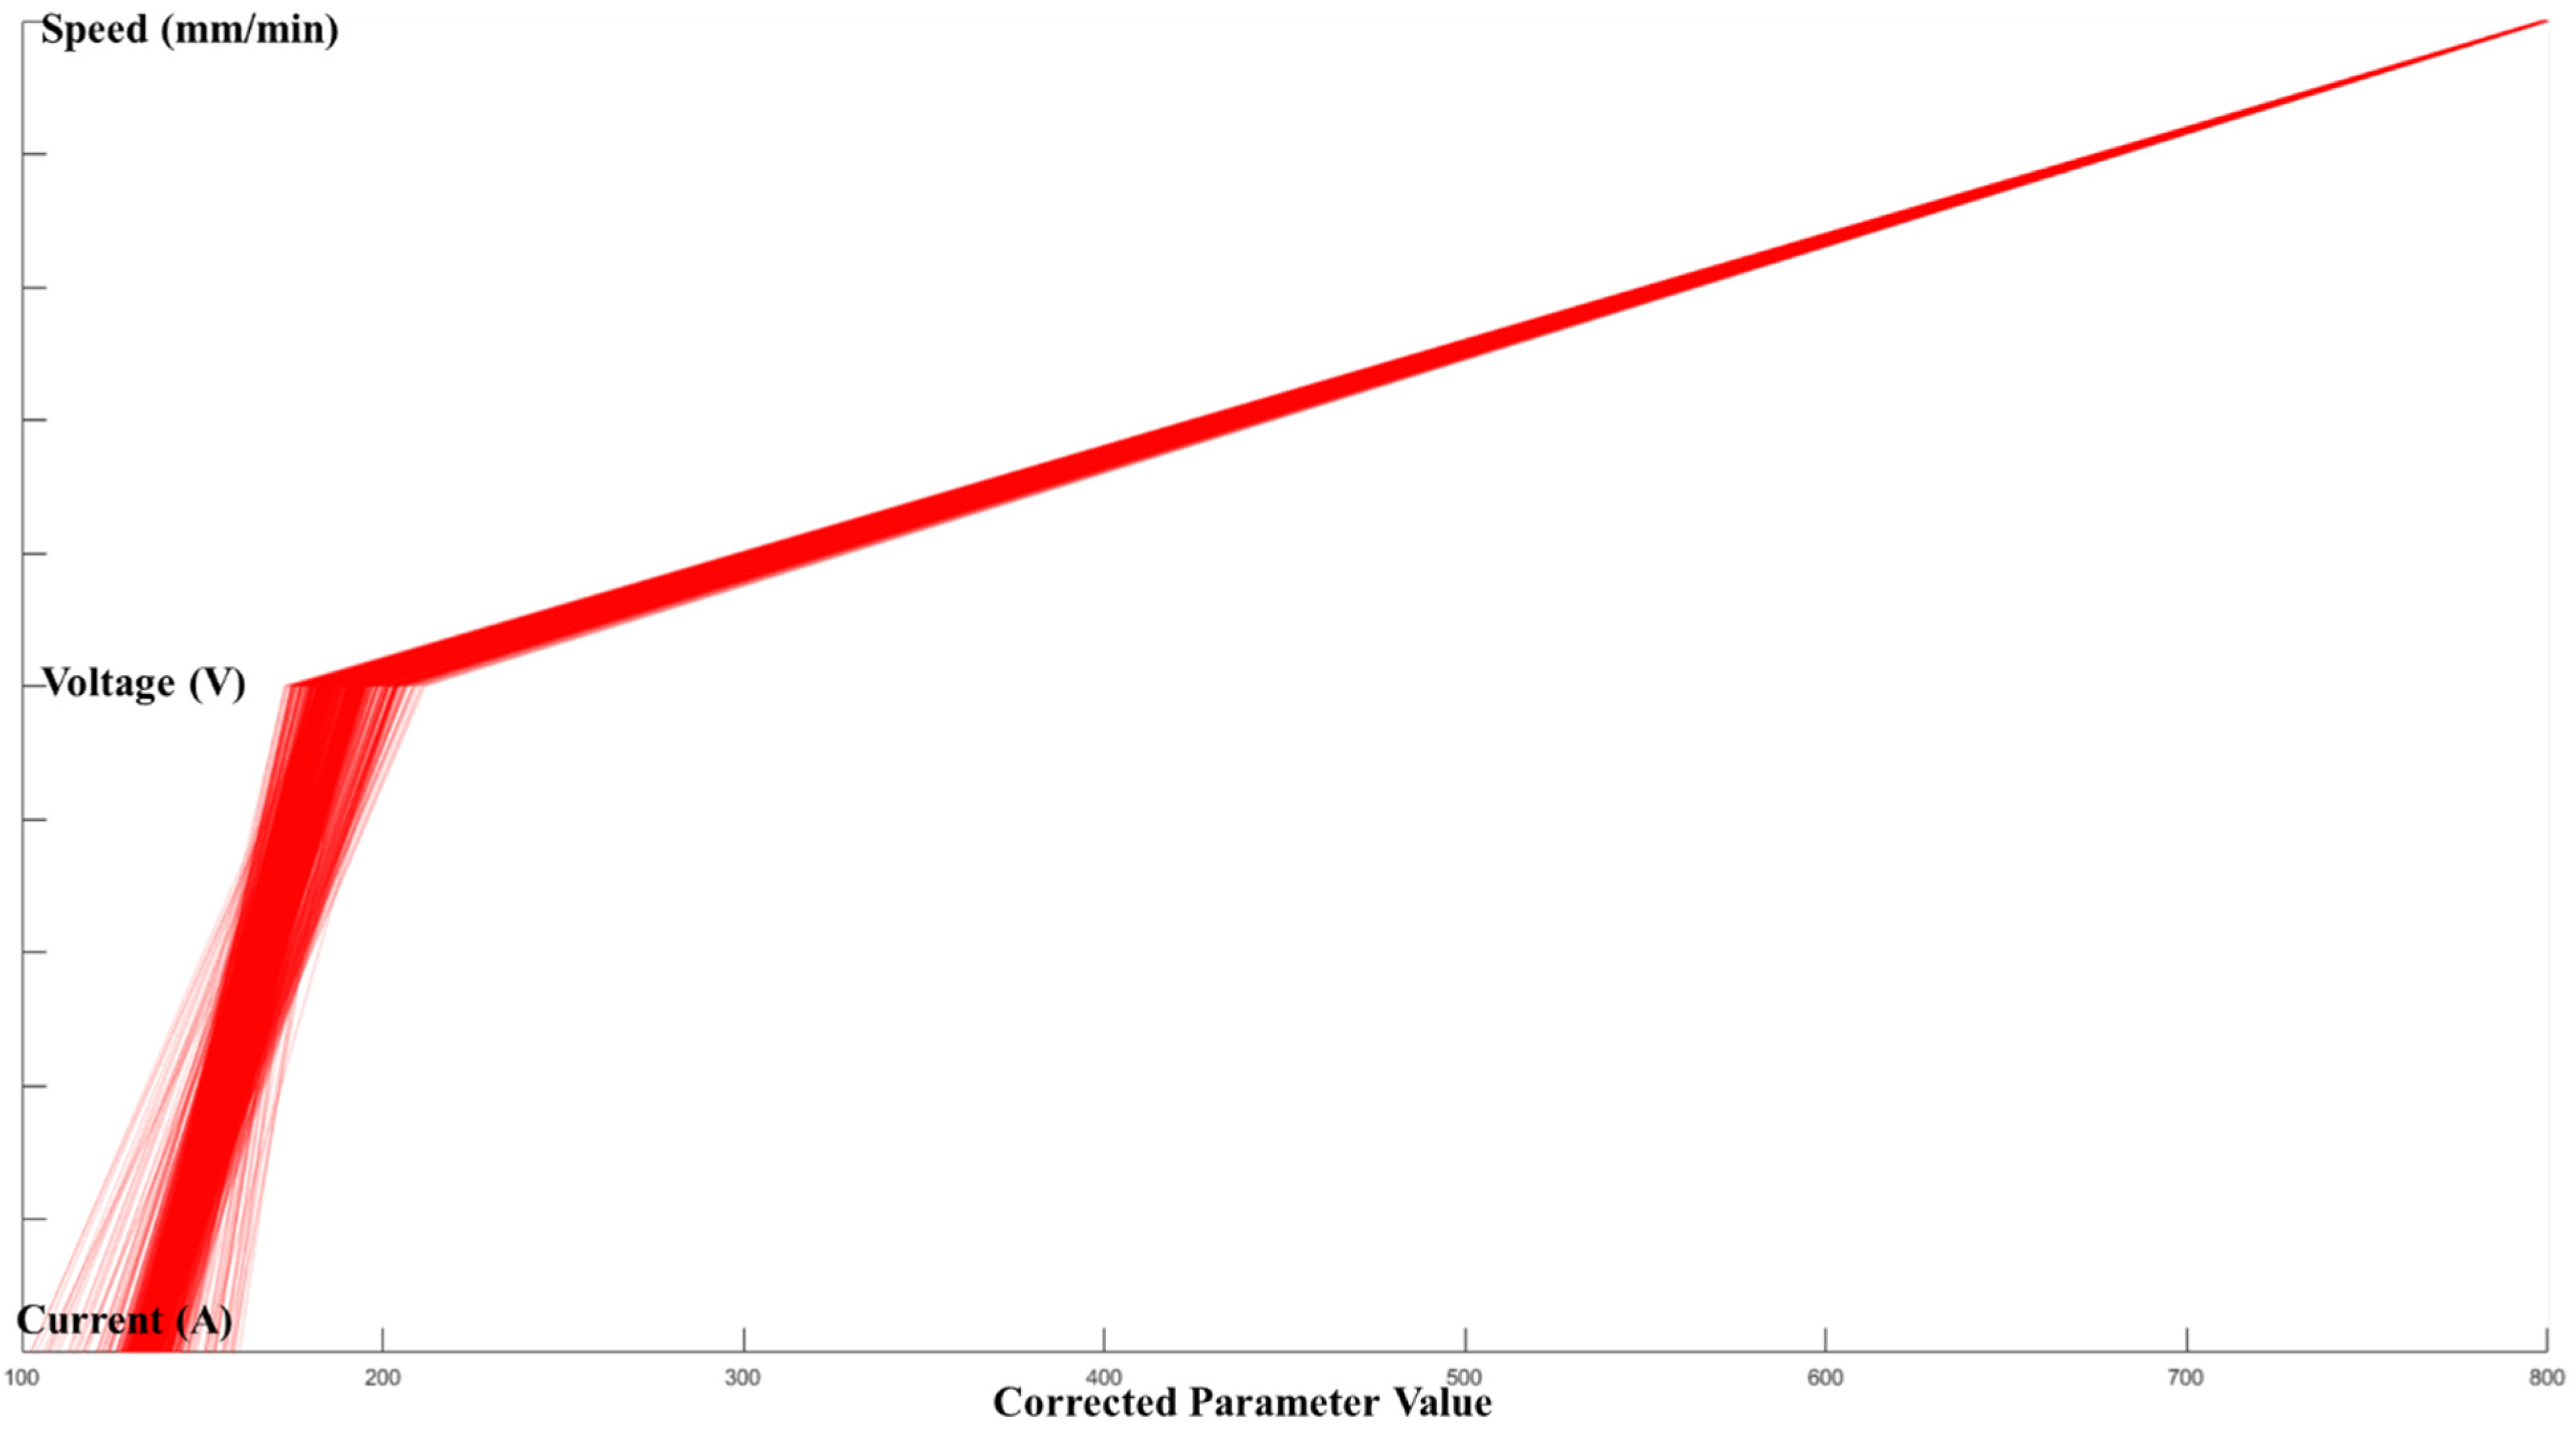
Solution: Printable Zone {} = .3. Result and Discussion
4. Conclusion and Future Recommendations
- Prediction models are eased to be adapted based on the increasing amount of collected data.
- Prediction provides a quantitative analysis of the process-quality relation.
- The reversely computed printable zone provides a numerical control to the WAAM system.
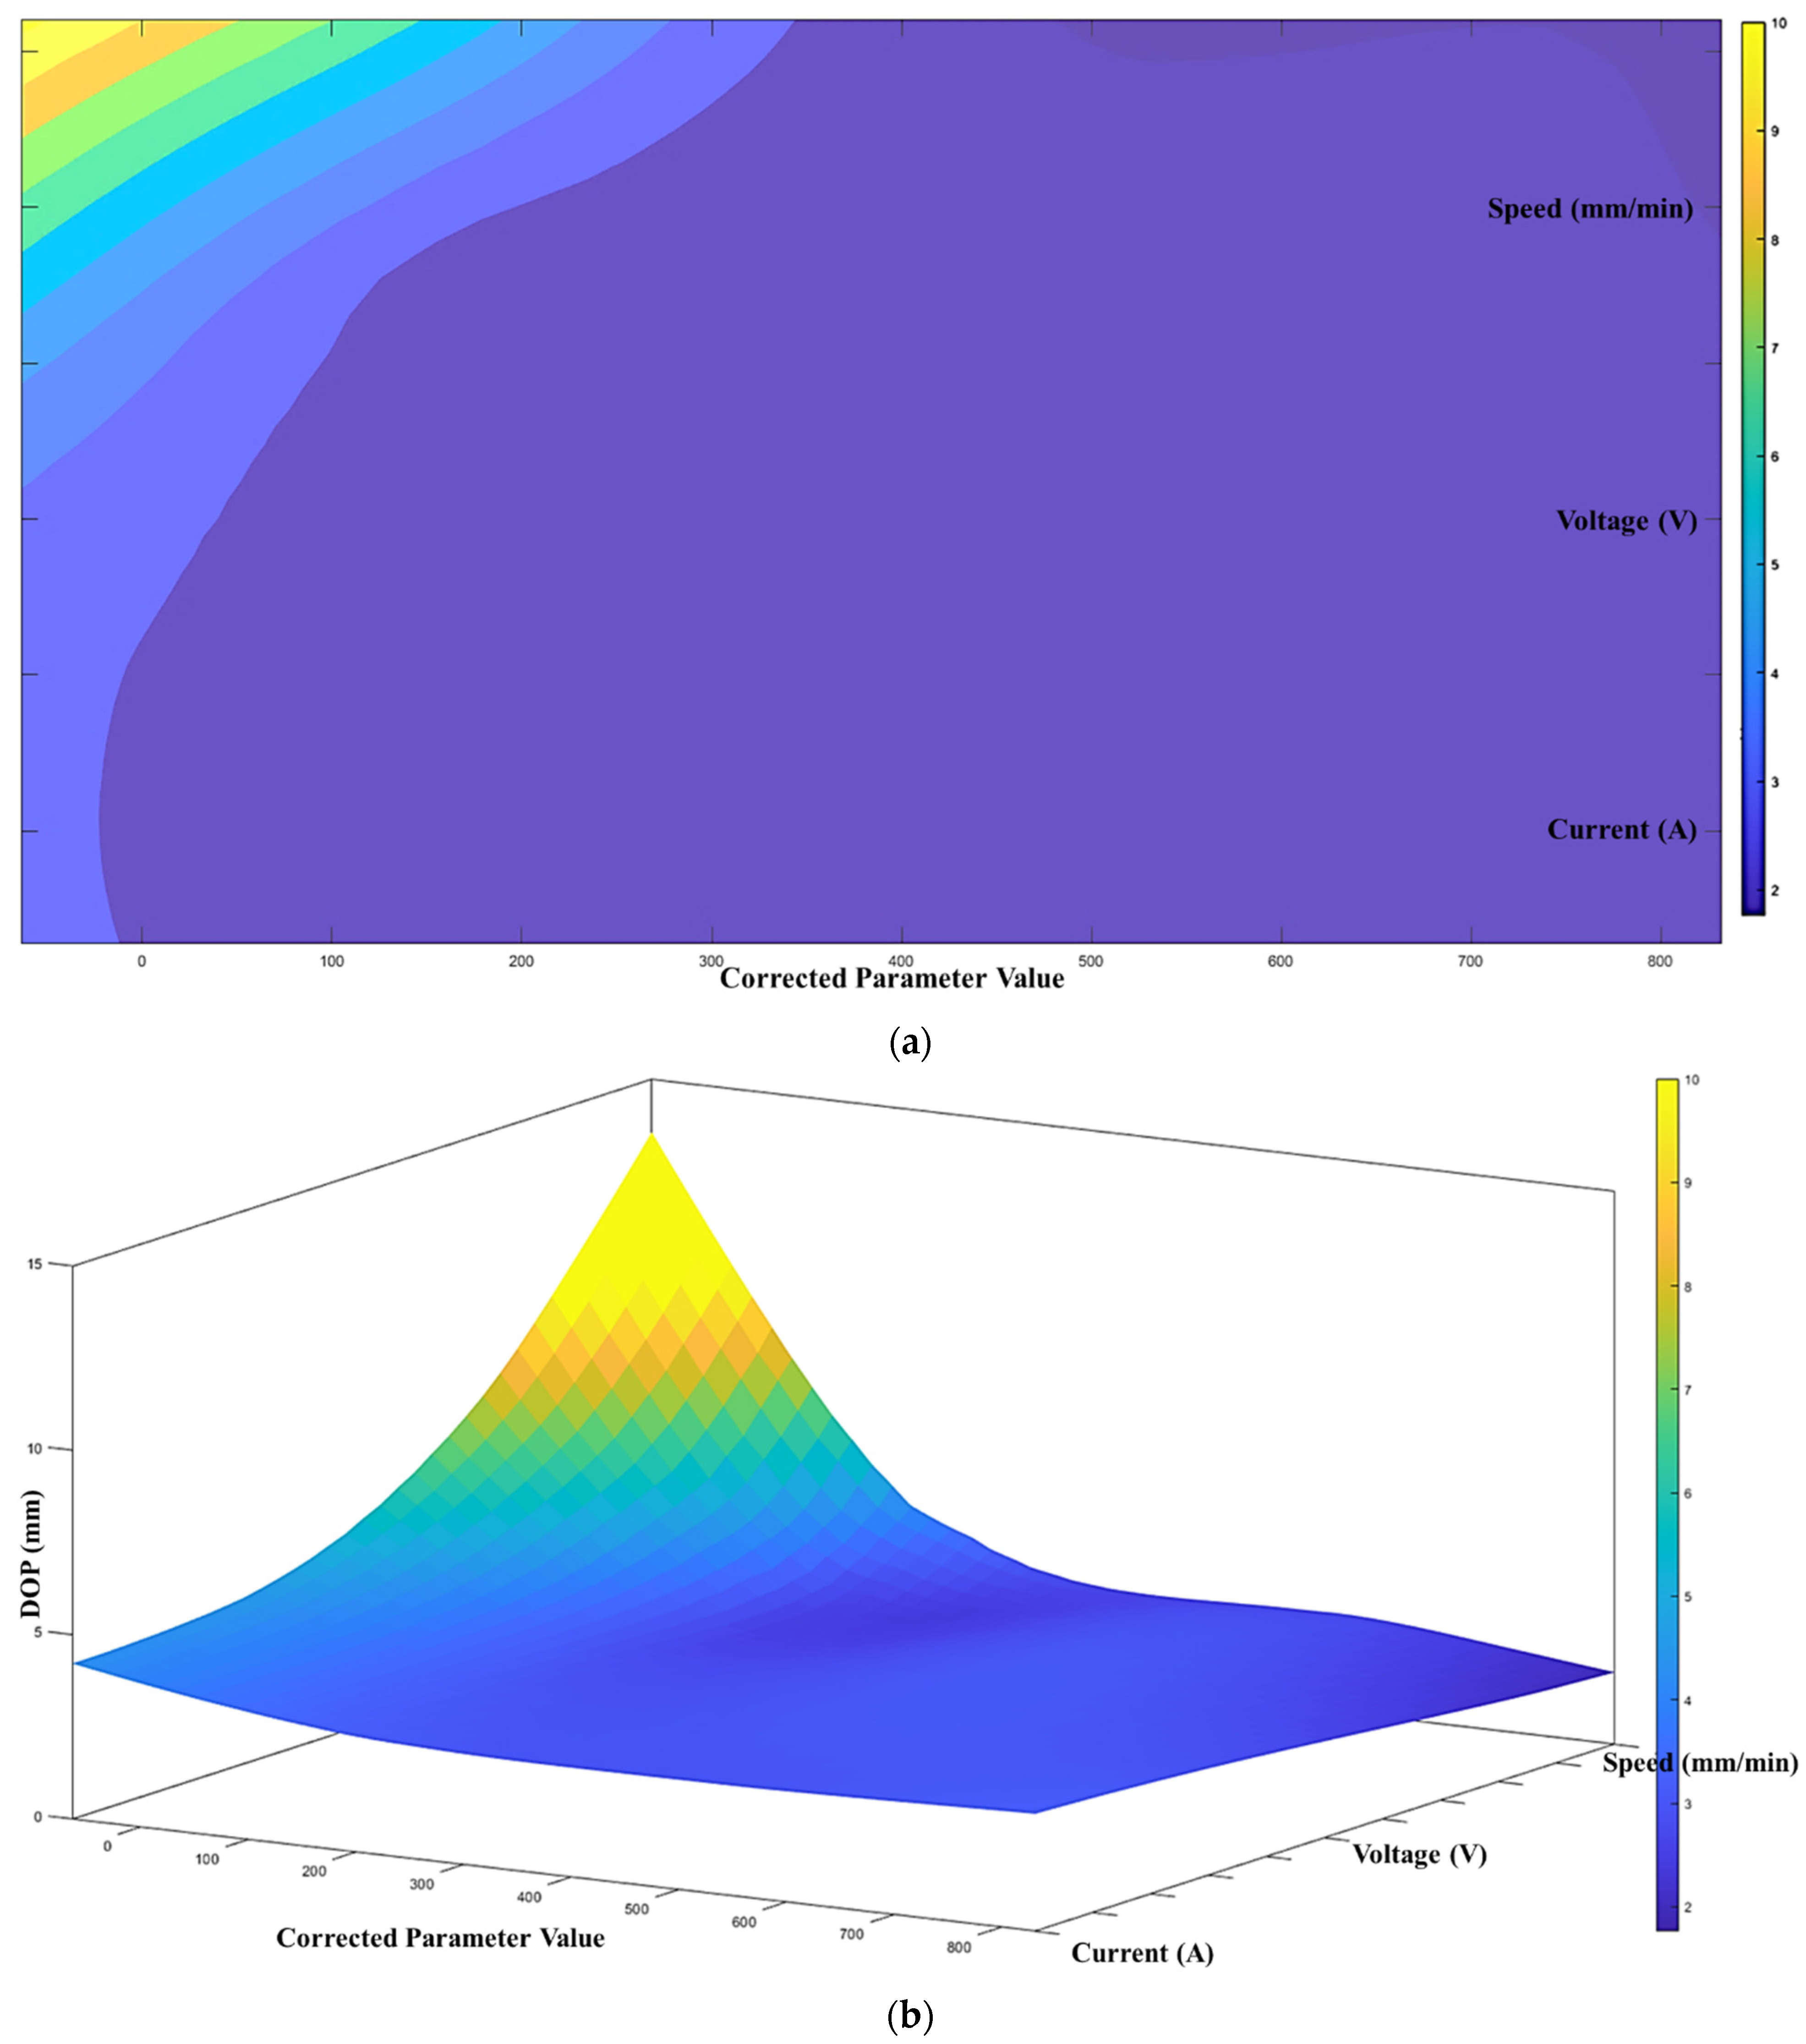
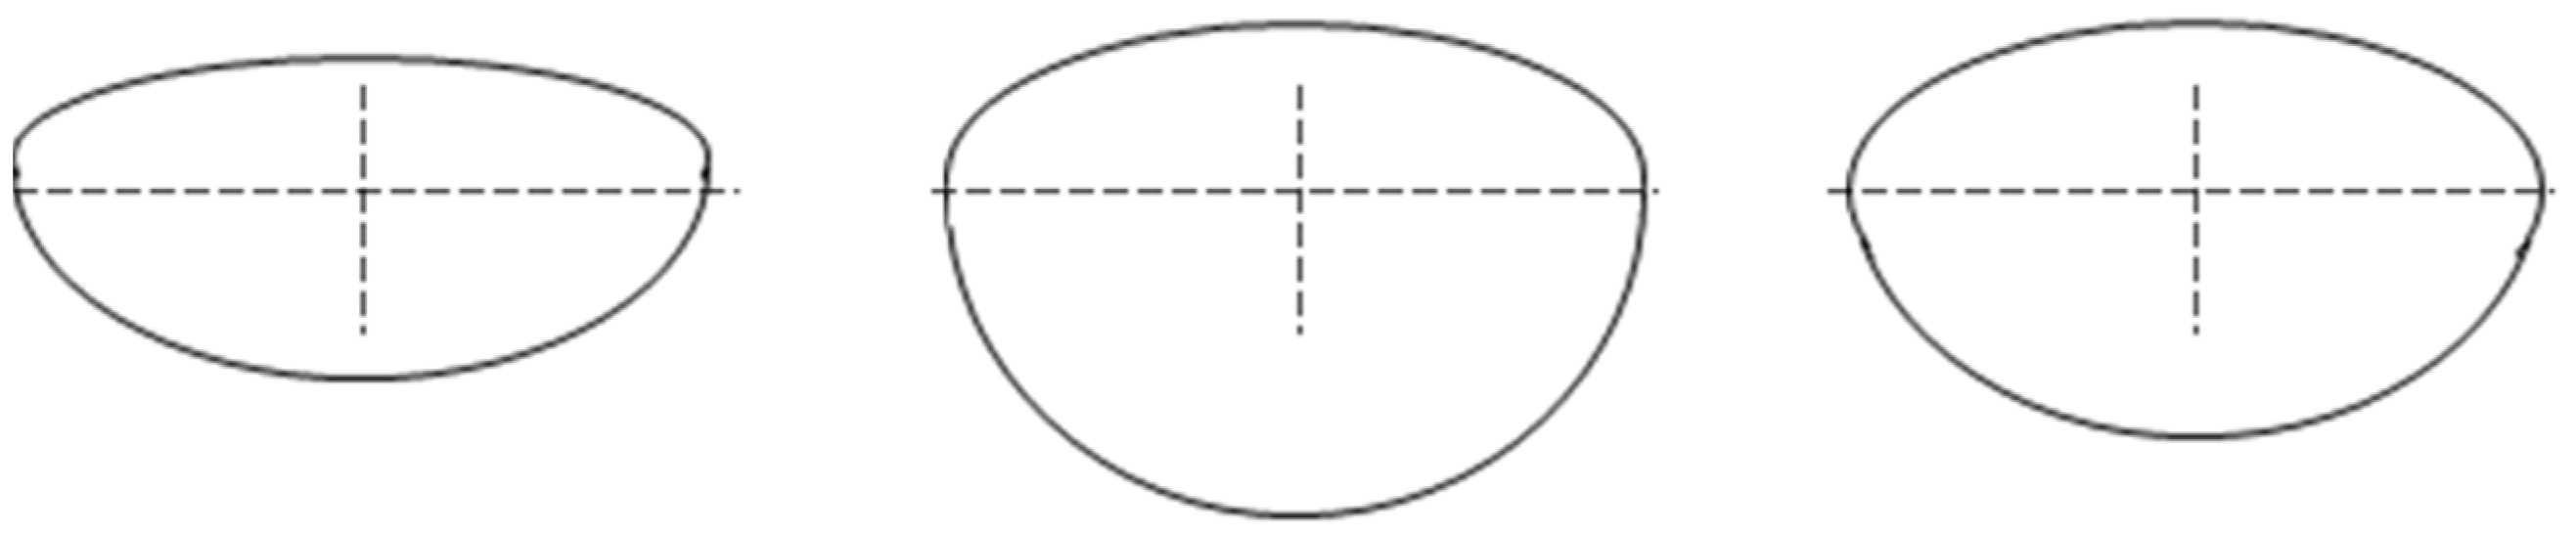
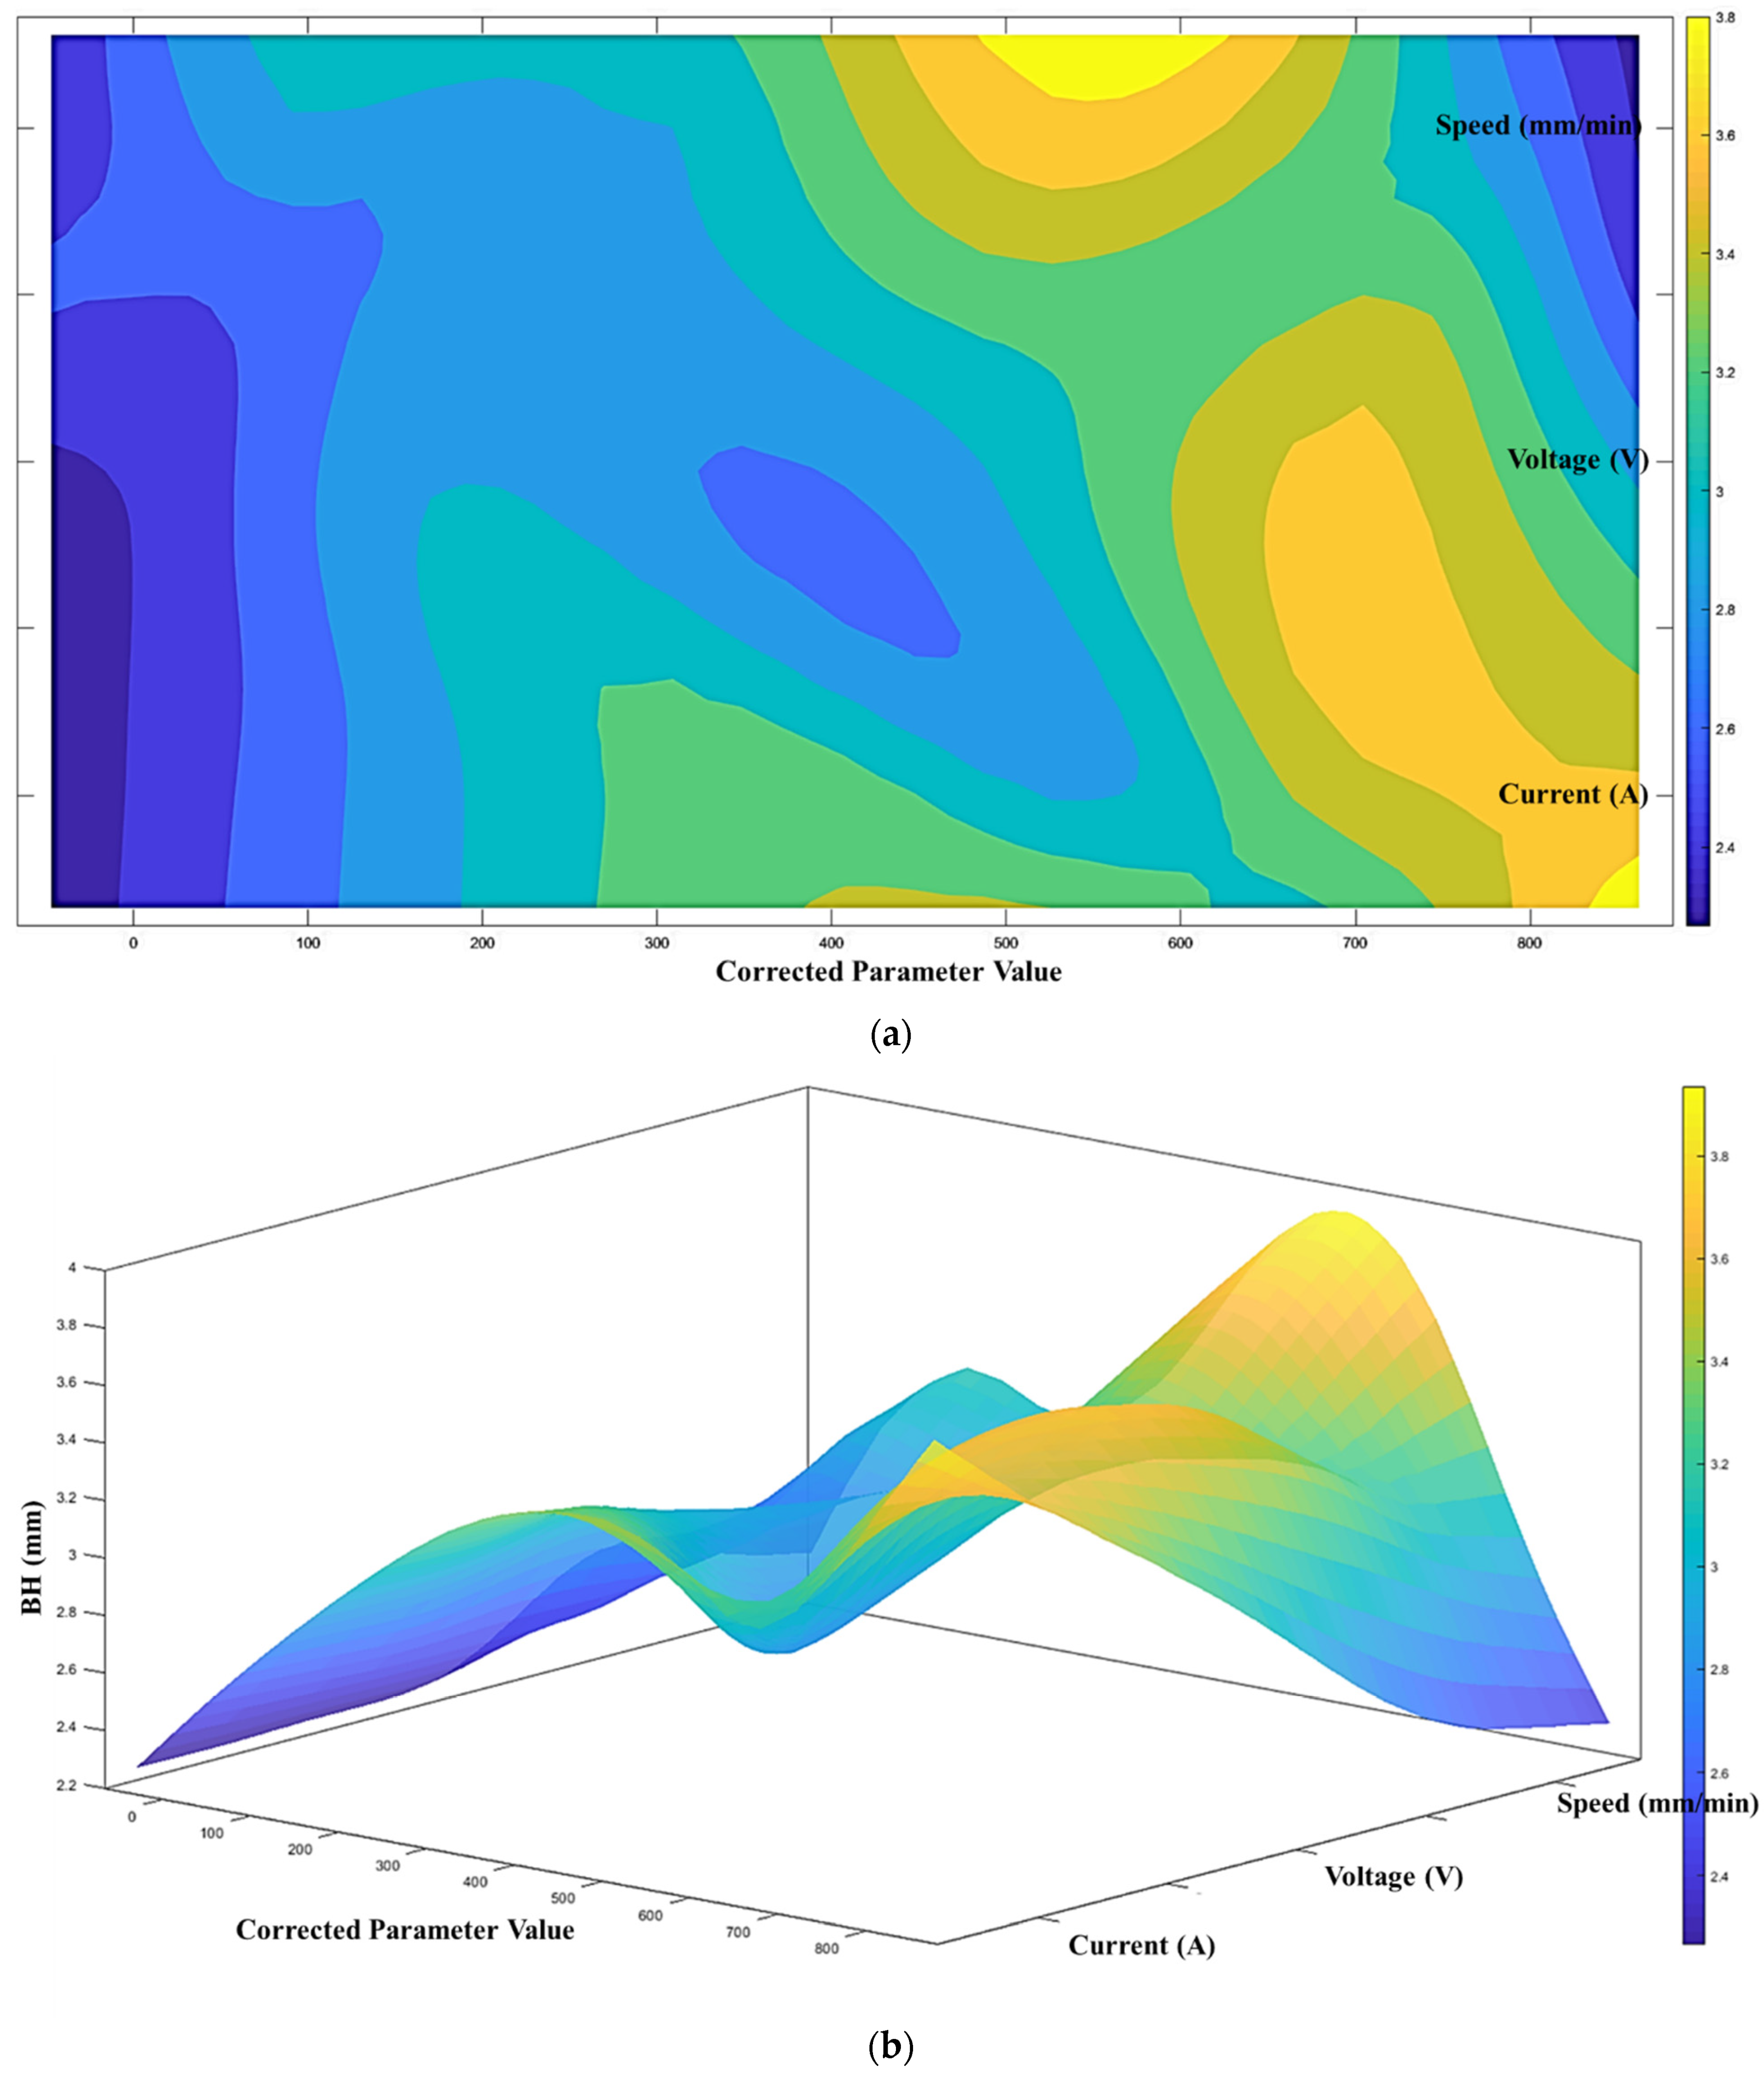
- An increase in the current would result in a wider bead width and height.
- An increase in the voltage would result in a wider bead width, and the bead height would first increase then decrease.
- An increase in the speed would first result in a wider bead width and then reduce the width, and it shows similar changes for the bead height. In contrast, the depth of penetration would decrease with the increase in the speed.
- Wider bead width will lead to a smaller bead height and a larger depth of penetration.
Author Contributions
Funding
Conflicts of Interest
References
- Wang, D.; Chi, C.; Wang, W.; Li, Y.; Wang, M.; Chen, X.; Chen, Z.; Cheng, X.; Xie, Y. The effects of fabrication atmosphere condition on the microstructural and mechanical properties of laser direct manufactured stainless steel 17–4 PH. J. Mater. Sci. Technol. 2019, 35, 1315–1322. [Google Scholar] [CrossRef]
- Wu, B.; Pan, Z.; Ding, D.; Cuiuri, D.; Li, H.; Xu, J.; Norrish, J. A review of the wire arc additive manufacturing of metals: Properties, defects and quality improvement. J. Manuf. Process. 2018, 35, 127–139. [Google Scholar] [CrossRef]
- Rafieazad, M.; Ghaffari, M.; Nemani, A.V.; Nasiri, A. Microstructural evolution and mechanical properties of a low-carbon low-alloy steel produced by wire arc additive manufacturing. Int. J. Adv. Manuf. Technol. 2019, 105, 2121–2134. [Google Scholar] [CrossRef]
- Haden, C.; Zeng, G.; Carter, F.; Ruhl, C.; Krick, B.; Harlow, D. Wire and arc additive manufactured steel: Tensile and wear properties. Addit. Manuf. 2017, 16, 115–123. [Google Scholar] [CrossRef]
- Xiao, X.; Joshi, S. Process planning for five-axis support free additive manufacturing. Addit. Manuf. 2020, 36, 101569. [Google Scholar] [CrossRef]
- Xiao, X.; Xiao, H. Autonomous robotic feature-based freeform fabrication approach. Materials 2022, 15, 247. [Google Scholar] [CrossRef] [PubMed]
- Li, M.; Lu, T.; Dai, J.; Jia, X.; Gu, X.; Dai, T. Microstructure and mechanical properties of 308L stainless steel fabricated by laminar plasma additive manufacturing. Mater. Sci. Eng. A 2020, 770, 138523. [Google Scholar] [CrossRef]
- Tahaei, A.; Vazquez, F.G.; Merlin, M.; Arizmendi-Morquecho, A.; Valdes, F.A.R.; Garagnani, G.L. Metallurgical characterization of a weld bead coating applied by the PTA process on the D2 tool steel. Soldag. Inspeção 2016, 21, 209–219. [Google Scholar] [CrossRef]
- Yildiz, A.S.; Davut, K.; Koç, B.; Yilmaz, O. Wire arc additive manufacturing of high-strength low alloy steels: Study of process parameters and their influence on the bead geometry and mechanical characteristics. Int. J. Adv. Manuf. Technol. 2020, 108, 3391–3404. [Google Scholar] [CrossRef]
- Zhao, Y.; Jia, Y.; Chen, S.; Shi, J.; Li, F. Process Planning Strategy for Wire-Arc Additive Manufacturing: Thermal Behavior Considerations. Additive Manufacturing; Elsevier: Amsterdam, The Netherlands, 2019; Available online: www.sciencedirect.com/science/article/pii/S2214860419315842 (accessed on 1 January 2022).
- Müller, J.; Grabowski, M.; Müller, C.; Hensel, J.; Unglaub, J.; Thiele, K.; Kloft, H.; Dilger, K. Design and parameter identification of wire and arc additively manufactured (WAAM) Steel bars for use in construction. Metals 2019, 9, 725. [Google Scholar] [CrossRef] [Green Version]
- Kodati, T.; Tokala, S.K.V.; Reddy, Y.P.; Narayana, K.L. Optimization of Mechanical Properties of Wire Arc Additive Manufacturing Specimens Using Grey-Based Taguchi Method. Biblio Med, Koneru Lakshmaiah Education Foundation. Available online: www.bibliomed.org/mnsfulltext/197/197-1591179563.pdf?1623687065 (accessed on 13 May 2020).
- Jin, W.; Zhang, C.; Jin, S.; Tian, Y.; Wellmann, D.; Liu, W. Wire arc additive manufacturing of stainless steels: A review. Appl. Sci. 2020, 10, 1563. [Google Scholar] [CrossRef] [Green Version]
- Zhang, C.; Gao, M.; Zeng, X. Workpiece vibration augmented wire arc additive manufacturing of high strength aluminum alloy. J. Mater. Process. Technol. 2019, 271, 85–92. Available online: www.sciencedirect.com/science/article/pii/S0924013619301141 (accessed on 1 January 2022). [CrossRef]
- Hackenhaar, W.; Mazzaferro, J.A.; Montevecchi, F.; Campatelli, G. An experimental-numerical study of active cooling in wire arc additive manufacturing. J. Manuf. Process. 2020, 52, 58–65. Available online: www.sciencedirect.com/science/article/pii/S1526612520300608 (accessed on 1 January 2022). [CrossRef]
- Reisgen, U.; Sharma, R.; Mann, S.; Oster, L. Increasing the manufacturing efficiency of WAAM by advanced cooling strategies. In Welding in the World; Springer: Berlin/Heidelberg, Germany, 2020; Available online: link.springer.com/article/10.1007/s40194-020-00930-2 (accessed on 1 January 2022).
- Karunakaran, K.P.; Suryakumar, S.; Pushpa, V.; Akula, S. Low cost integration of additive and subtractive processes for hybrid layered manufacturing. Robot. Comput.-Integr. Manuf. 2010, 26, 490–499. Available online: www.sciencedirect.com/science/article/pii/S0736584510000189 (accessed on 1 January 2022). [CrossRef]
- Xiao, X.; Roh, B.-M.; Zhu, F. Strength enhancement in fused filament fabrication via the isotropy toolpath. Appl. Sci. 2021, 11, 6100. [Google Scholar] [CrossRef]
- Xiao, X.; Joshi, S. Automatic toolpath generation for heterogeneous objects manufactured by directed energy depo-sition additive manufacturing process. J. Manuf. Sci. Eng. 2018, 140, 071005. [Google Scholar] [CrossRef]
- Arya, H.; Singh, K.; Saxena, R.K. Effect of Welding Parameters on Penetration and Bead Width for Variable Plate Thickness in Submerged Arc Welding. In Proceedings of the 17th International Conference on Robotics and Mechanical Engineering (ICRME), Paris, France, 26 August 2015; pp. 27–28. [Google Scholar]
- Roh, B.M.; Kumara, S.R.; Witherell, P.; Simpson, T.W. Ontology-based process map for metal additive manufacturing. J. Mater. Eng. Perform. 2021, 30, 8784–8797. [Google Scholar] [CrossRef]
- Jafari, D.; Vaneker, T.H.; Gibson, I. Wire and arc additive manufacturing: Opportunities and challenges to control the quality and accuracy of manufactured parts. Mater. Des. 2021, 202, 109471. [Google Scholar] [CrossRef]
- Mahmood, M.; Visan, A.; Ristoscu, C.; Mihailescu, I. Artificial neural network algorithms for 3D printing. Materials 2021, 14, 163. [Google Scholar] [CrossRef] [PubMed]
- Venkata Subramanian, V. WAAM Martensitic Stainless Steel: Process Optimization & Resulting Weld Geometrical Characterization; Delft University of Technology: Delft, The Netherlands, 2017. [Google Scholar]


| Analytical Process Parameters | Research Output |
|---|---|
| Wire feed speed (WFS), travel speed (TS), the ratio between WFS and TS [9] |
|
| Heat input [11] |
|
| Deposition direction, nozzle tip distance, and gas pressure [12] |
|
| Path planning trajectory [13] |
|
| Vibration [14] |
|
| Air cooling, idle time [15,16] |
|
| Term | Coef | SE Coef | T-Value | p-Value | VIF |
|---|---|---|---|---|---|
| Constant | 4.050 | 0.488 | 8.30 | 0.000 | |
| I (Amps) | 0.00840 | 0.00274 | 3.06 | 0.003 | 1.28 |
| U (Volts) | 0.03083 | 0.00475 | 6.49 | 0.000 | 1.21 |
| Speed (mm/min) | −0.0780 | 0.00409 | −1.91 | 0.042 | 1.41 |
| Term | Coef | SE Coef | T-Value | p-Value | VIF |
|---|---|---|---|---|---|
| Constant | 3.566 | 0.172 | 20.78 | 0.000 | |
| I (A) | −0.002465 | 0.000965 | −2.55 | 0.014 | 1.28 |
| U (V) | 0.00506 | 0.00167 | 3.03 | 0.004 | 1.21 |
| Speed (mm/min) | −0.00654 | 0.00144 | −4.55 | 0.000 | 1.41 |
| Bead Width Model | Bead Height Model | Depth of Penetration Model | |
|---|---|---|---|
| Proposed Model | 0.997 | 0.993 | 0.9853 |
| Regression | 0.9237 | 0.7181 | 0.8643 |
| Tradition ANN | 0.464 | 0.857 | 0.80 |
| Sample No. | Current (A) | Voltage (V) | Speed (mm/min) | BW (mm) | BH (mm) | DOP (mm) |
|---|---|---|---|---|---|---|
| 1 Measured | 215 | 25 | 450 | 9.23 | 3.12 | 5.71 |
| 1 Predicted | 9.217 | 3.108 | 5.721 | |||
| 2 Measured | 215 | 27 | 450 | 9.3 | 3.41 | 2.54 |
| 2 Predicted | 9.218 | 3.451 | 2.551 | |||
| 3 Measured | 250 | 26 | 600 | 8.56 | 3.3 | 2.45 |
| 3 Predicted | 8.528 | 3.158 | 2.51 |
Publisher’s Note: MDPI stays neutral with regard to jurisdictional claims in published maps and institutional affiliations. |
© 2022 by the authors. Licensee MDPI, Basel, Switzerland. This article is an open access article distributed under the terms and conditions of the Creative Commons Attribution (CC BY) license (https://creativecommons.org/licenses/by/4.0/).
Share and Cite
Xiao, X.; Waddell, C.; Hamilton, C.; Xiao, H. Quality Prediction and Control in Wire Arc Additive Manufacturing via Novel Machine Learning Framework. Micromachines 2022, 13, 137. https://doi.org/10.3390/mi13010137
Xiao X, Waddell C, Hamilton C, Xiao H. Quality Prediction and Control in Wire Arc Additive Manufacturing via Novel Machine Learning Framework. Micromachines. 2022; 13(1):137. https://doi.org/10.3390/mi13010137
Chicago/Turabian StyleXiao, Xinyi, Clarke Waddell, Carter Hamilton, and Hanbin Xiao. 2022. "Quality Prediction and Control in Wire Arc Additive Manufacturing via Novel Machine Learning Framework" Micromachines 13, no. 1: 137. https://doi.org/10.3390/mi13010137
APA StyleXiao, X., Waddell, C., Hamilton, C., & Xiao, H. (2022). Quality Prediction and Control in Wire Arc Additive Manufacturing via Novel Machine Learning Framework. Micromachines, 13(1), 137. https://doi.org/10.3390/mi13010137