Communication

Conduction Band Edge Energy Profile Probed by Hall Offset Voltage in InGaZnO Thin Films

School of Electrical and Electronics Engineering, Chung-Ang University, Seoul 06974, Korea
*
Author to whom correspondence should be addressed.
Micromachines 2020, 11(9), 822; https://doi.org/10.3390/mi11090822
Submission received: 31 July 2020 / Revised: 23 August 2020 / Accepted: 29 August 2020 / Published: 30 August 2020
(This article belongs to the Special Issue Thin Film Transistors with Oxide Semiconductors)

Abstract

:
We measured and analyzed the Hall offset voltages in InGaZnO thin-film transistors. The Hall offset voltages were found to decrease monotonously as the electron densities increased. We attributed the magnitude of the offset voltage to the misalignment in the longitudinal distance between the probing points and the electron density to Fermi energy of the two-dimensional electron system, which was verified by the coincidence of the Hall voltage with the perpendicular magnetic field in the tilted magnetic field. From these results, we deduced the combined conduction band edge energy profiles from the Hall offset voltages with the electron density variations for three samples with different threshold voltages. The extracted combined conduction band edge varied by a few tens of meV over a longitudinal distance of a few tenths of µm. This result is in good agreement with the value obtained from the analysis of percolation conduction.

1. Introduction

Oxide semiconductors are used in various applications, including flat-panel displays [1,2], optical sensors [3,4], and solar cells [5,6], owing to their excellent electrical and optical properties. Among them, the amorphous-InGaZnO (a-IGZO) thin-film transistors (TFTs) have attracted considerable attention for applications in flat-panel displays thanks to their high electrical performances [7,8,9,10,11,12] and manufacturability over a large area [13]. For this particular material, the conduction band minimum was originated from the isotropic s-orbitals of the cations, resulting in a small effective mass and high electron mobility for superior electrical properties, even in amorphous phase. In addition, its lack of crystallinity helps rapid improvements in the bending performances of the a-IGZO TFTs [14,15], which are expected to pave the way to potential applications in flexible electronics on plastic substrates. Field-effect mobility as high as 160 cm2/Vs was reported by reducing defects with a strong capping layer at the back interface [12]. However, the current conduction mechanisms in a-IGZO TFTs have to be understood in depth to further improve their electrical characteristics for future applications in faster and larger displays. For this purpose, the fundamental carrier-transport properties of a-IGZO thin films were extensively studied by Hall measurement [16] and electrical transport measurements [17,18], which were interpreted as trap-limited conduction in low-gate voltage operations and percolation conduction at high-gate voltages. Furthermore, the electronic band structures of a-IGZO were deduced. In these transport studies, two of the key parameters were the carrier density and the mobility, which are generally measured as functions of various parameters in the measurements. Therefore, Hall measurements from which these two parameters can be determined simultaneously, are of pivotal importance in semiconductor transport studies. However, it is very challenging to perform Hall measurements on low mobility [19].
The Hall offset voltage, i.e., the output voltage signal perpendicular to the current direction in the absence of magnetic induction, should be zero in perfectly aligned Hall probing points. However, non-zero Hall offset voltages [20] are common in real devices, especially devices with van der Pauw geometry where the probe misalignments are quite frequent. In such cases, if the measured Hall data are not carefully analyzed, the devices will be characterized incorrectly.
In this study, we carefully analyzed the Hall offset voltages in Hall bar-patterned a-IGZO TFT samples in magnetic fields with both negative and positive polarity. The Hall offset voltages were measured with an AC Hall setup to obtain noise-reduced results. Despite the Hall bar geometry, which was chosen to avoid the complexities arising from the misalignments of the Hall probes, Hall offset voltages were still present in our measurements. We interpreted the measured Hall offset voltage as the unintentional misalignment distance and the electron density as the Fermi energy level. We constructed combined conduction band edge energy profiles for three samples with different threshold voltages by measuring the Hall offset voltages as a function of the two-dimensional electron density. The extracted conduction band edge energy variation of a few tens of meV was in good agreement with the extracted average potential barrier height from percolation conduction model [16].

2. Experimental Procedure

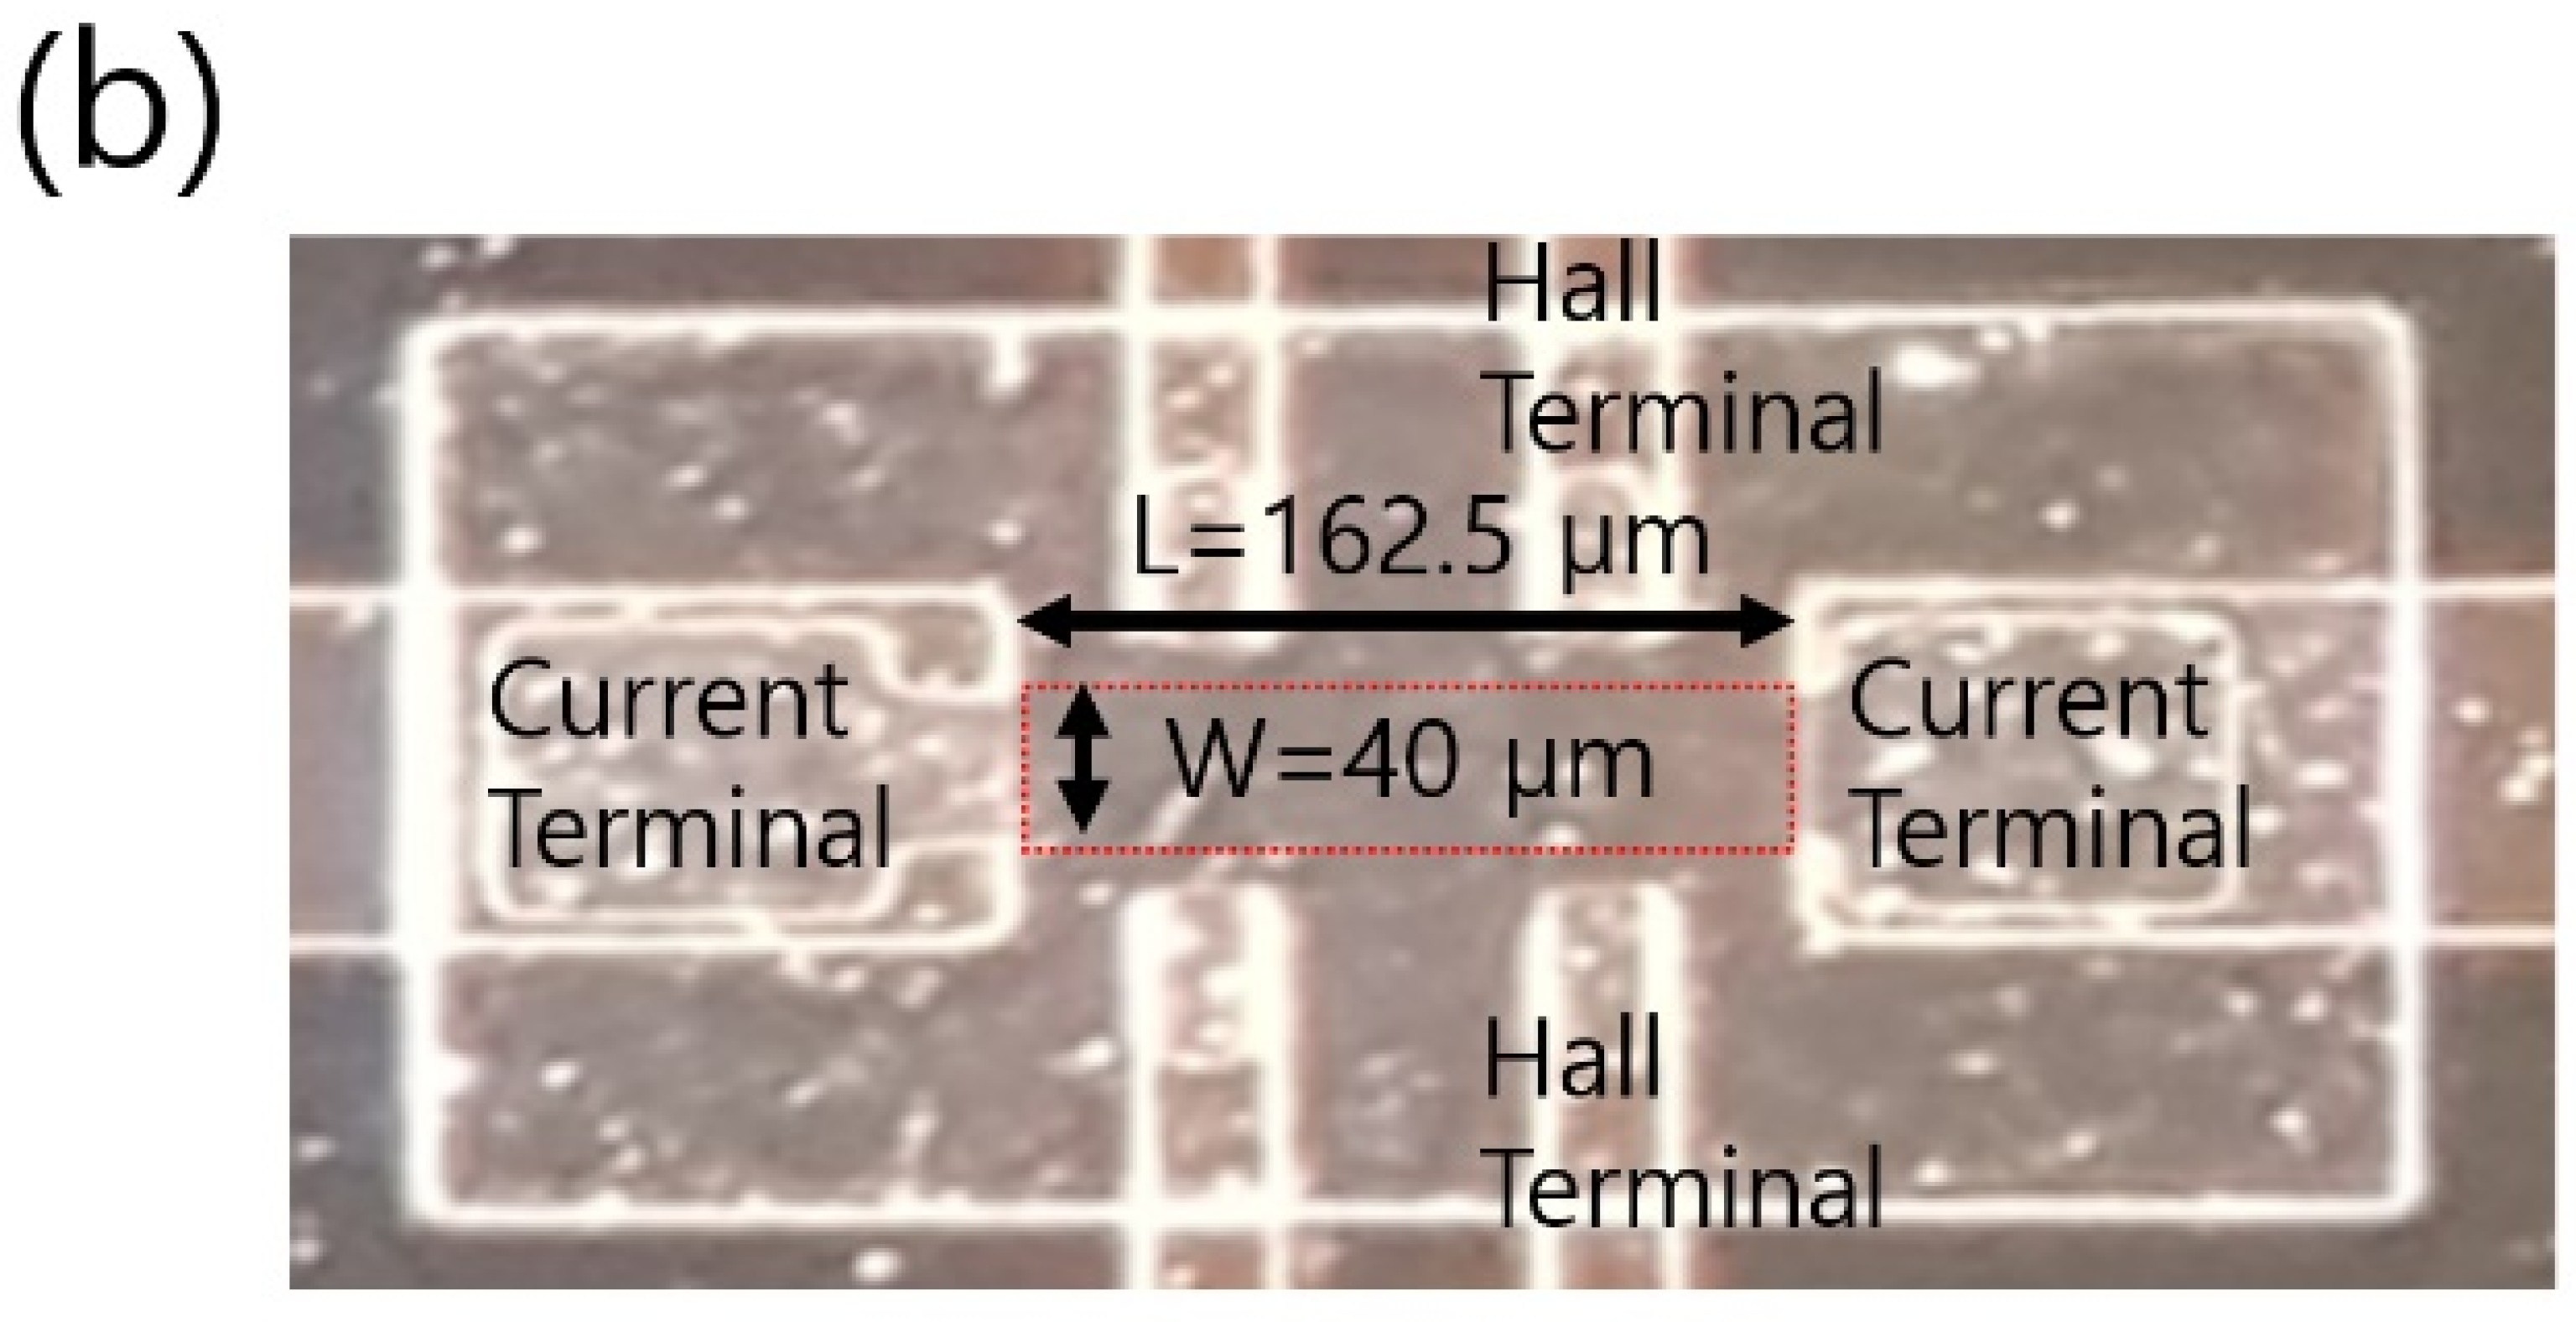
Figure 1a shows a schematic of the fabricated a-IGZO TFT Hall bar device without the top SU-8 passivation layer, which is generally used to reduce the instability associated with oxygen adsorption [21,22]. The n-type a-IGZO TFTs were fabricated on top of a 100-nm-thick thermal SiO2 layer grown on a heavily doped p-type Si substrate used as a gate electrode in the measurements. A 50-nm-thick a-IGZO channel layer was deposited on the cleaned SiO2 layer by RF magnetron sputtering at room temperature. Hall bar patterning was performed through a liftoff process and, subsequently, thermal annealing was performed at 450 °C for 30 min in air. A nonmagnetic 70-nm-thick Ti layer and a 30-nm-thick Au layer were deposited using e-beam evaporation and were patterned by liftoff to serve as the electrodes of the a-IGZO TFTs. Finally, a 2-μm-thick SU-8 layer was formed as a passivation layer using a spin-coating process. Figure 1b shows an optical image of the fabricated a-IGZO TFT with the passivation layer. Two current terminals were placed horizontally and two pairs of Hall and longitudinal voltage terminals were placed vertically. The vertical Hall terminals were lithographically aligned to prevent unintentional misalignment and the center spacing between the two horizontal longitudinal terminals was 87.5 μm. The electrode terminals were labelled by numbers from 1 to 6. The channel width (W) of the device was 40 μm and the length (L) was 162.5 μm.

3. Results and Discussion

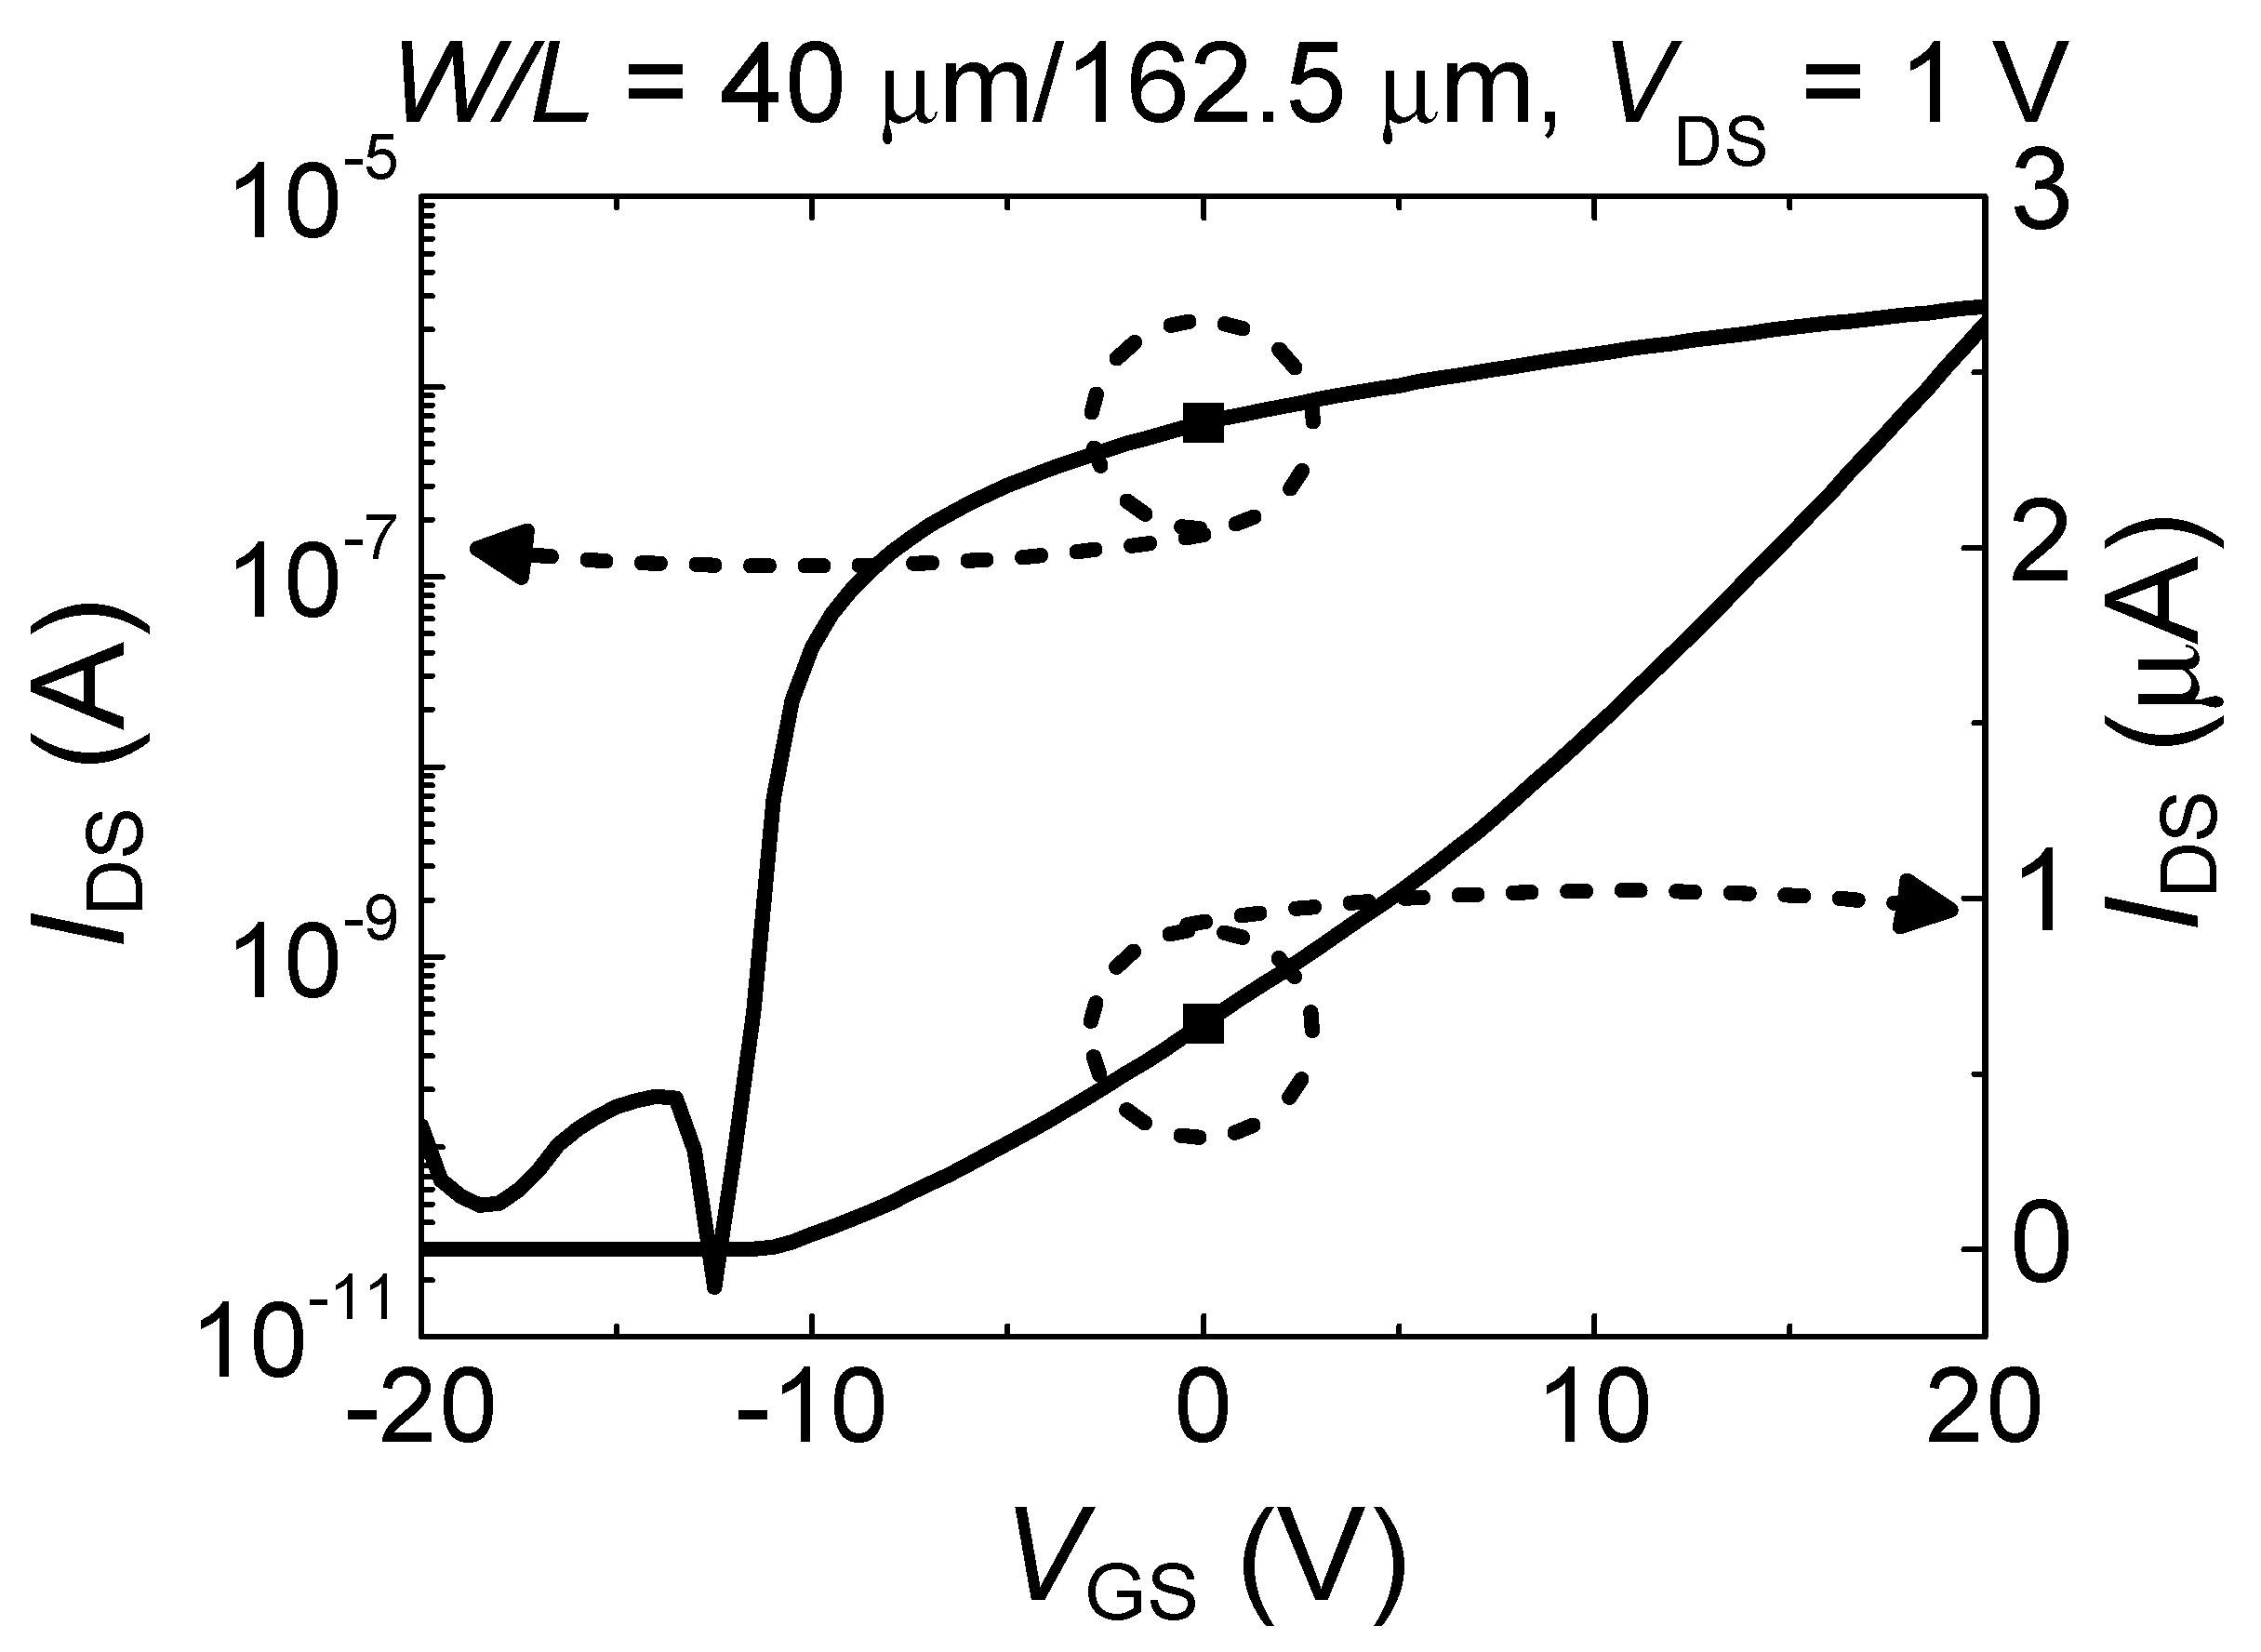
Figure 2 shows the drain current IDS as a function of the gate-source voltage VGS, i.e., the transfer curve, measured in our device. The IDS is reported in logarithmic scale to clearly show the on/off characteristics, and the VGS is in linear scale to deduce the threshold voltage. Here, we used two current terminals as source/drain terminals (1 and 6) and the p+ Si substrate as a gate terminal. The transfer curve was measured at drain-source voltage (VDS) of 1 V while sweeping VGS from −20 to 20 V to fully show the on/off characteristics. The values of field-effect mobility (μFE), the on/off current ratio, threshold voltage (VTH), and subthreshold swing were measured to be 14.56 cm2/Vs, 1.76 × 10⁵, −8.69 V, and 0.42 V/decade, respectively. The value of μFE was calculated from the maximum transconductance in the linear regime (VDS = 1 V), and that of VTH was extracted by extrapolating a straight line in IDS-VGS plot on the VGS axis. These values (extracted from the transfer curve) are in good agreement with those reported in the literature [23].
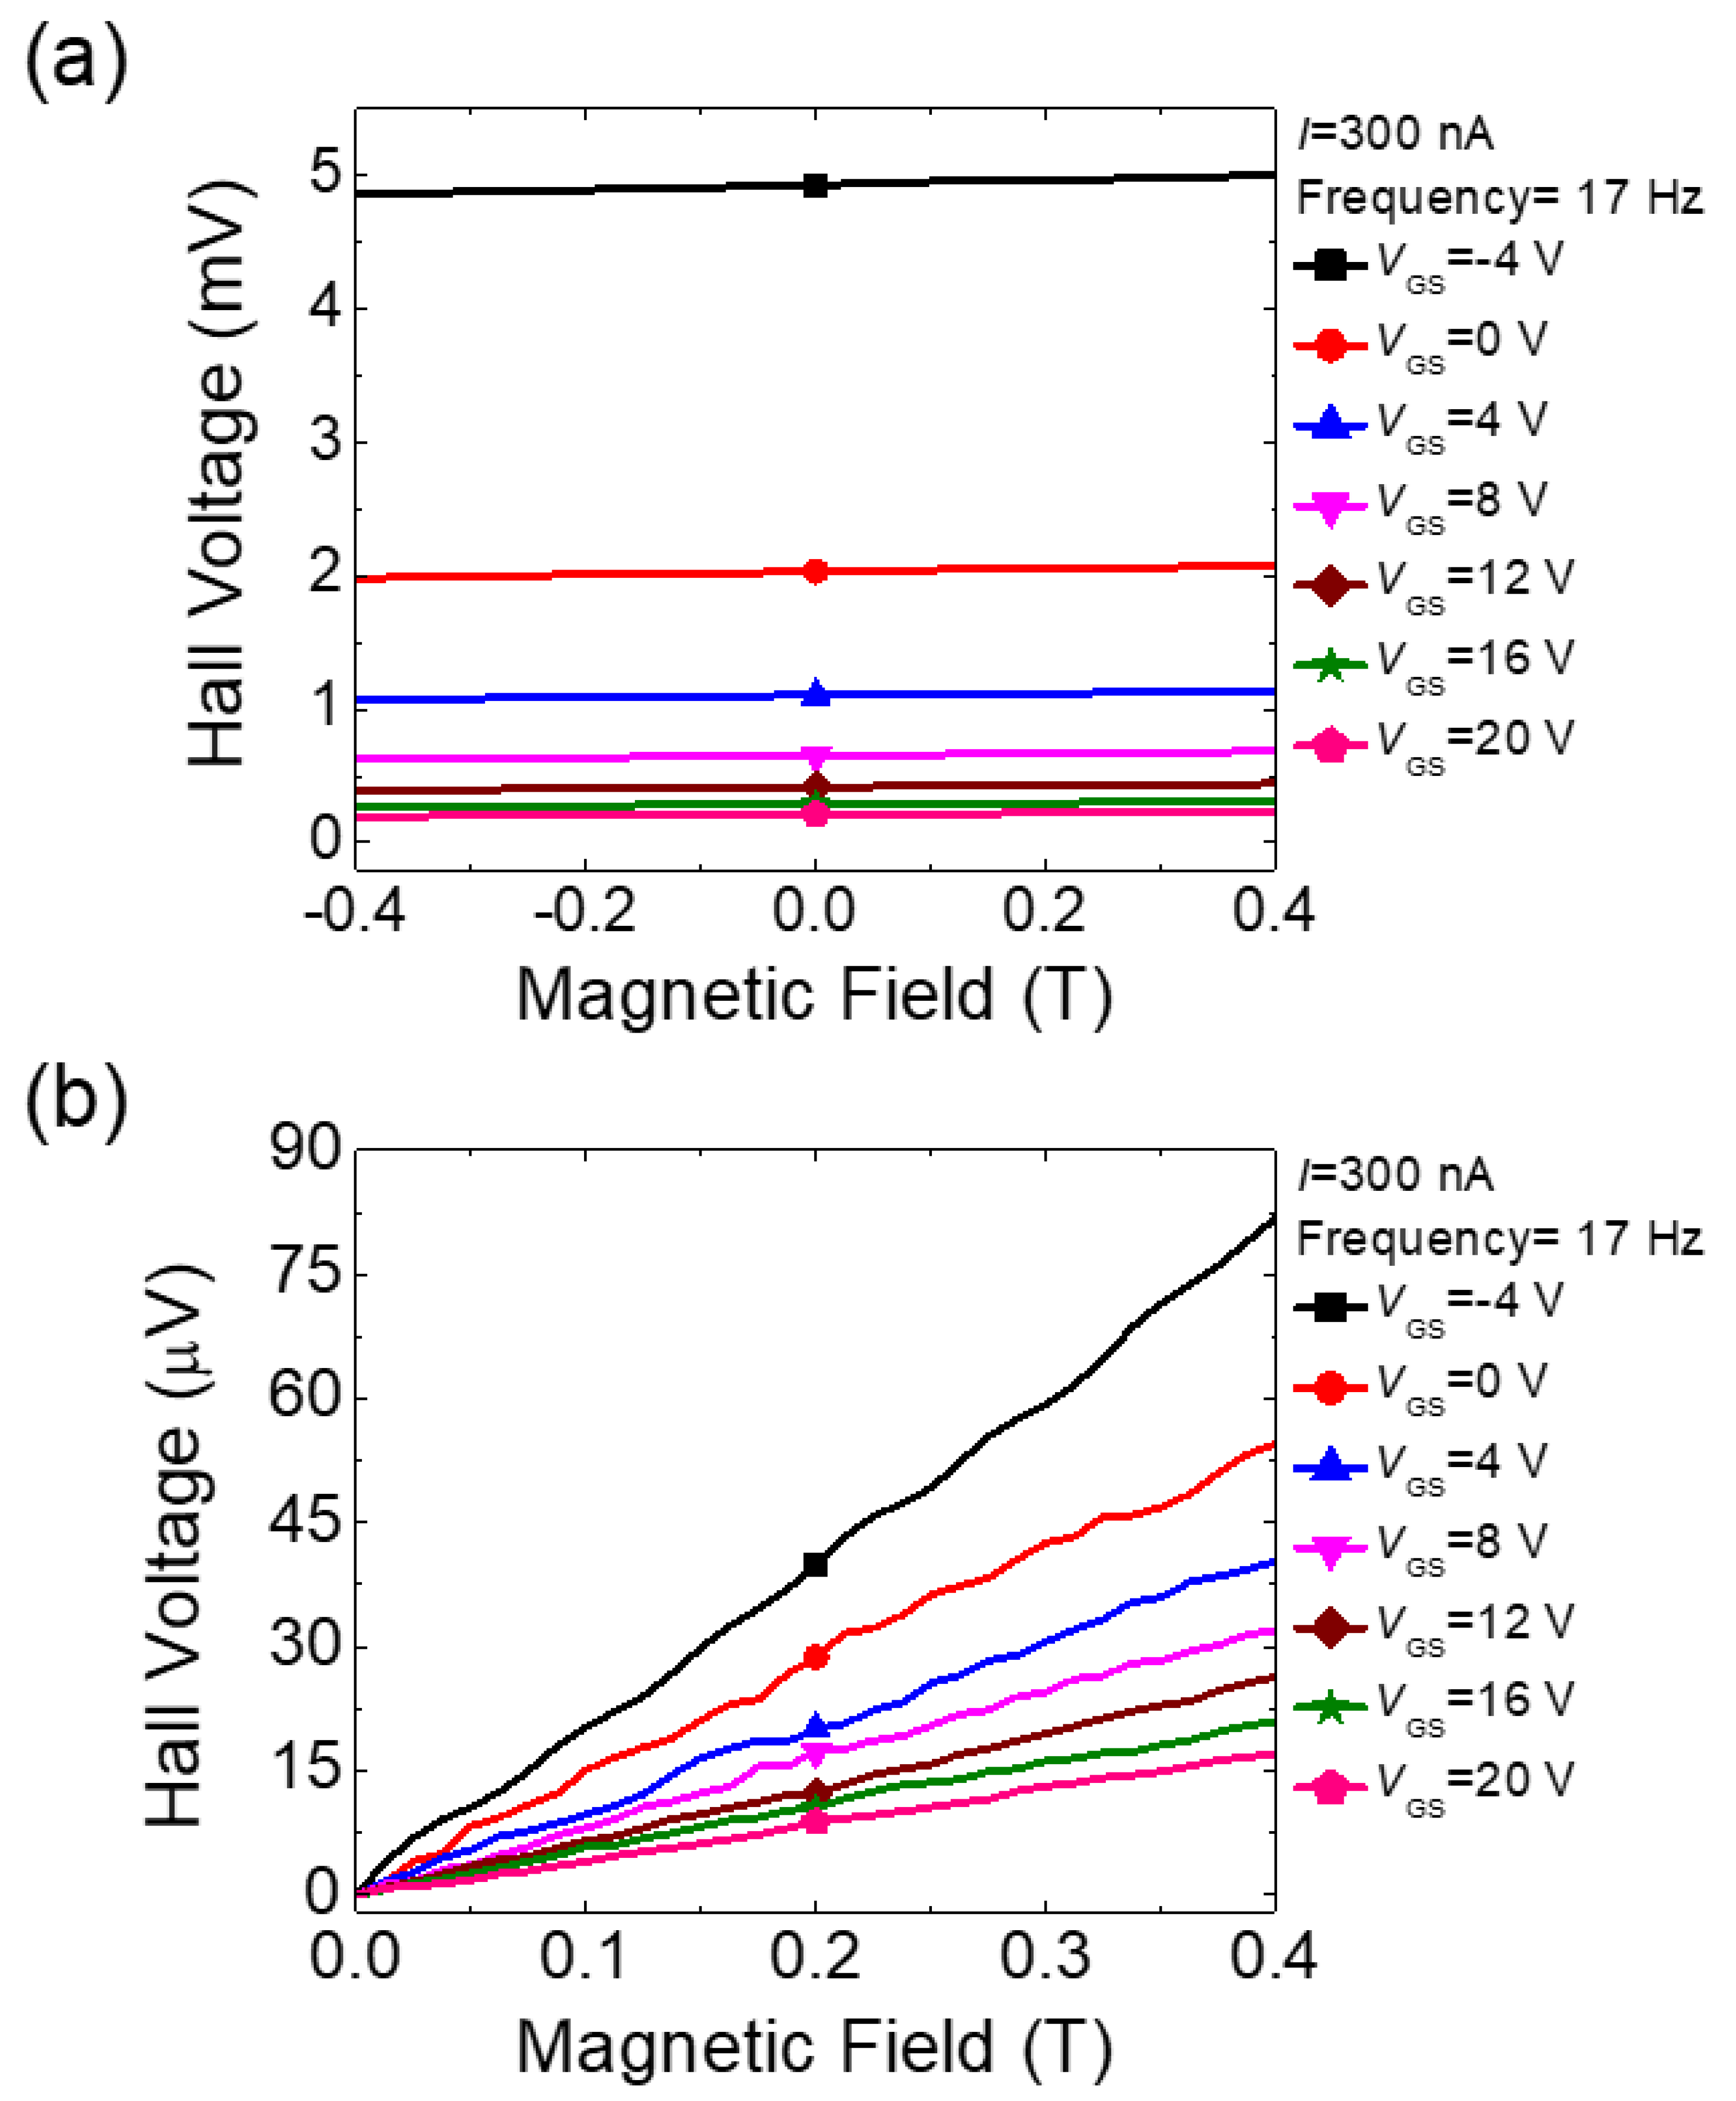
Figure 3a depicts the plots of the Hall voltages with VGS ranging from −4 to 20 V in the a-IGZO Hall device as a function of the applied bipolar magnetic field. We adopted a low-frequency ac Hall measurement to achieve the reasonably high signal-to-noise ratio for later analysis. A 17-Hz sinusoidal ac current (I) of 300 nA was applied between the current terminals (1 and 6). The magnetic field (B) from −0.4 to 0.4 Tesla was applied perpendicularly to the Hall device, and the Hall voltage (VH) was measured between the Hall probe terminals (2 and 3) while sweeping B. From the figure, it can be seen that the measured Hall voltages between the two intentionally aligned Hall probes linearly increased as B increased from −0.4 T to +0.4 T, following classical Hall theory. However, non-zero offset values were observed at B = 0 T, which is contrary to the classical Hall theory [24]. In addition, the offset voltage decreased monotonously with the gate voltage VGS. The offset was attributed mainly to the unintentional misalignment of the two Hall voltage probes [25,26,27]. This decrease will be analyzed later after extracting the two key parameters of the sample, the electron density and the mobility. To extract electron densities from the measured Hall voltages, the offsets need to be corrected with the measurements obtained when reversing the direction of current flow and magnetic field [28]. The current direction reversal was automatically taken care of in the ac Hall measurements. For the magnetic field reversal measurements, bipolar magnetic field sweeps were performed, and the results are illustrated in Figure 3a. The measured Hall voltages shown in Figure 3a are corrected by taking the half of the value obtained by subtracting the Hall voltage at negative B from the one at positive B. The results are shown in Figure 3b. It is worth noting that the Hall offset voltage was in the range of mV and the offset-corrected Hall voltage was in the range of tens of μV. The Hall voltage was approximately two orders of magnitude smaller than the Hall offset voltage. Thus, achieving a reasonably high signal-to-voltage ratio is critical in these measurements. The offset-corrected Hall voltages increased linearly with the magnetic field, indicating that there existed a single channel in the device [29]. The electron density in the device can be calculated from the slope of the Hall voltage vs. magnetic field curve, and the mobility can be calculated from the measured resistance between two longitudinal voltage probes (3 and 5).
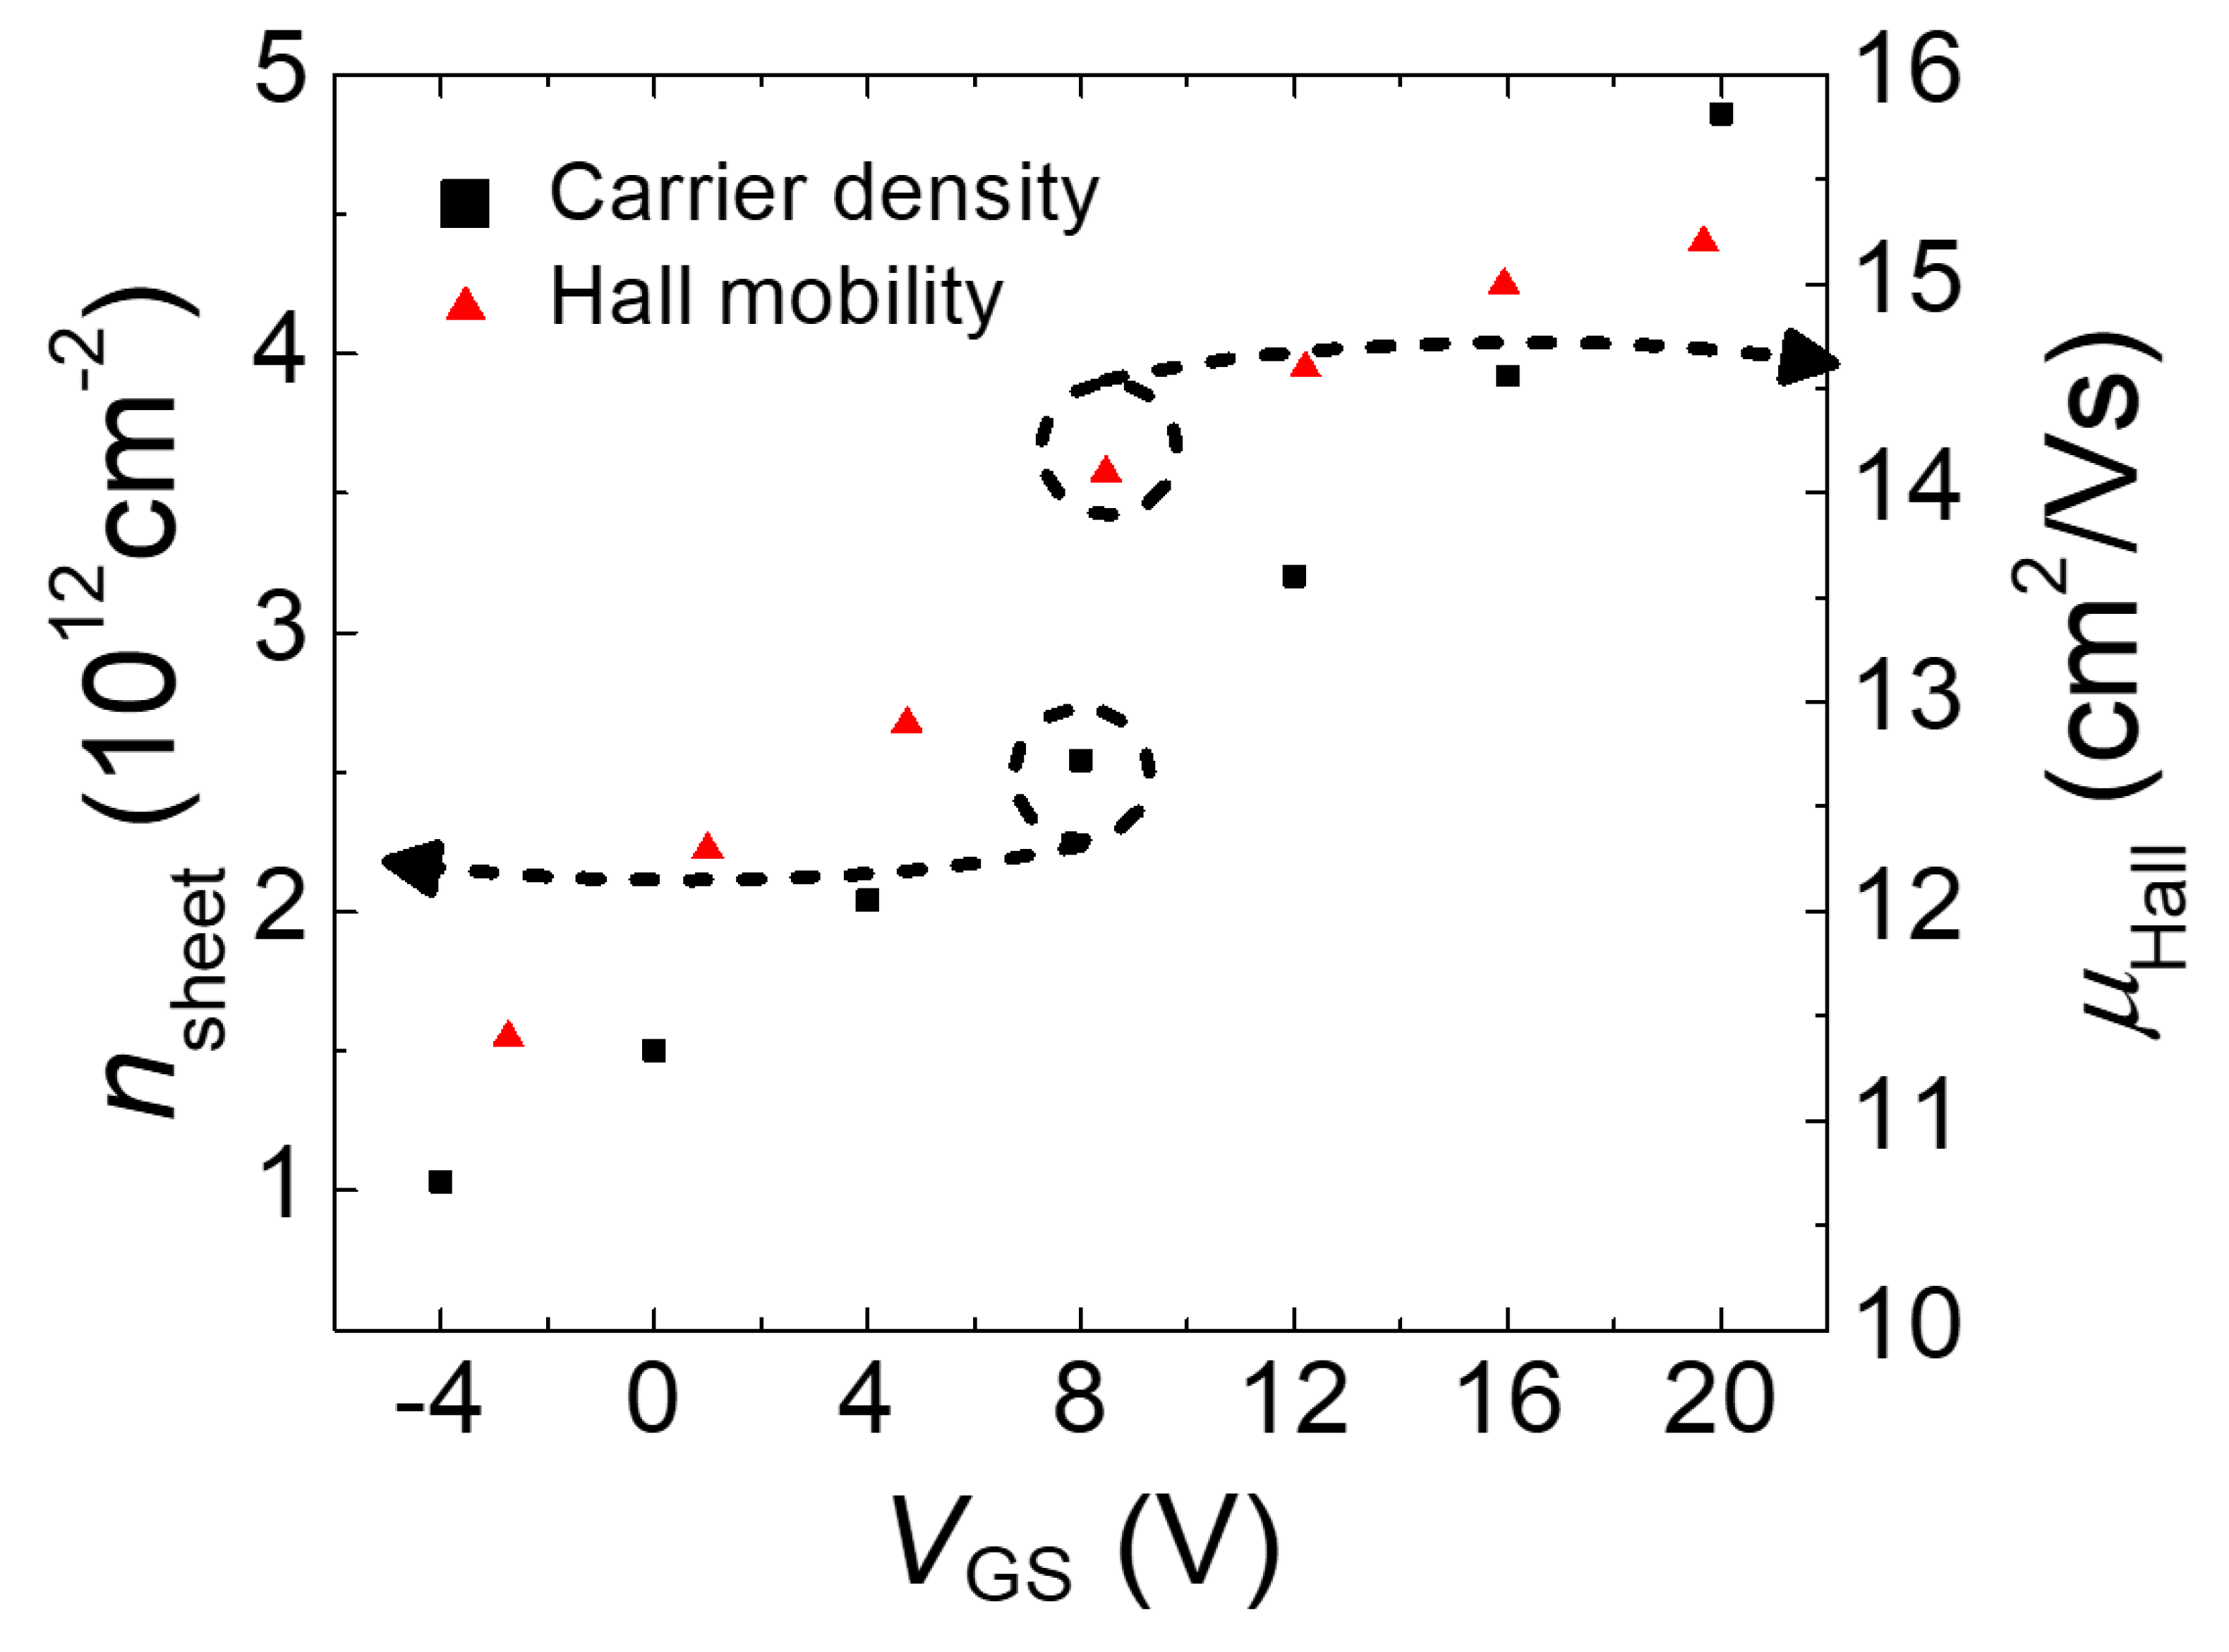
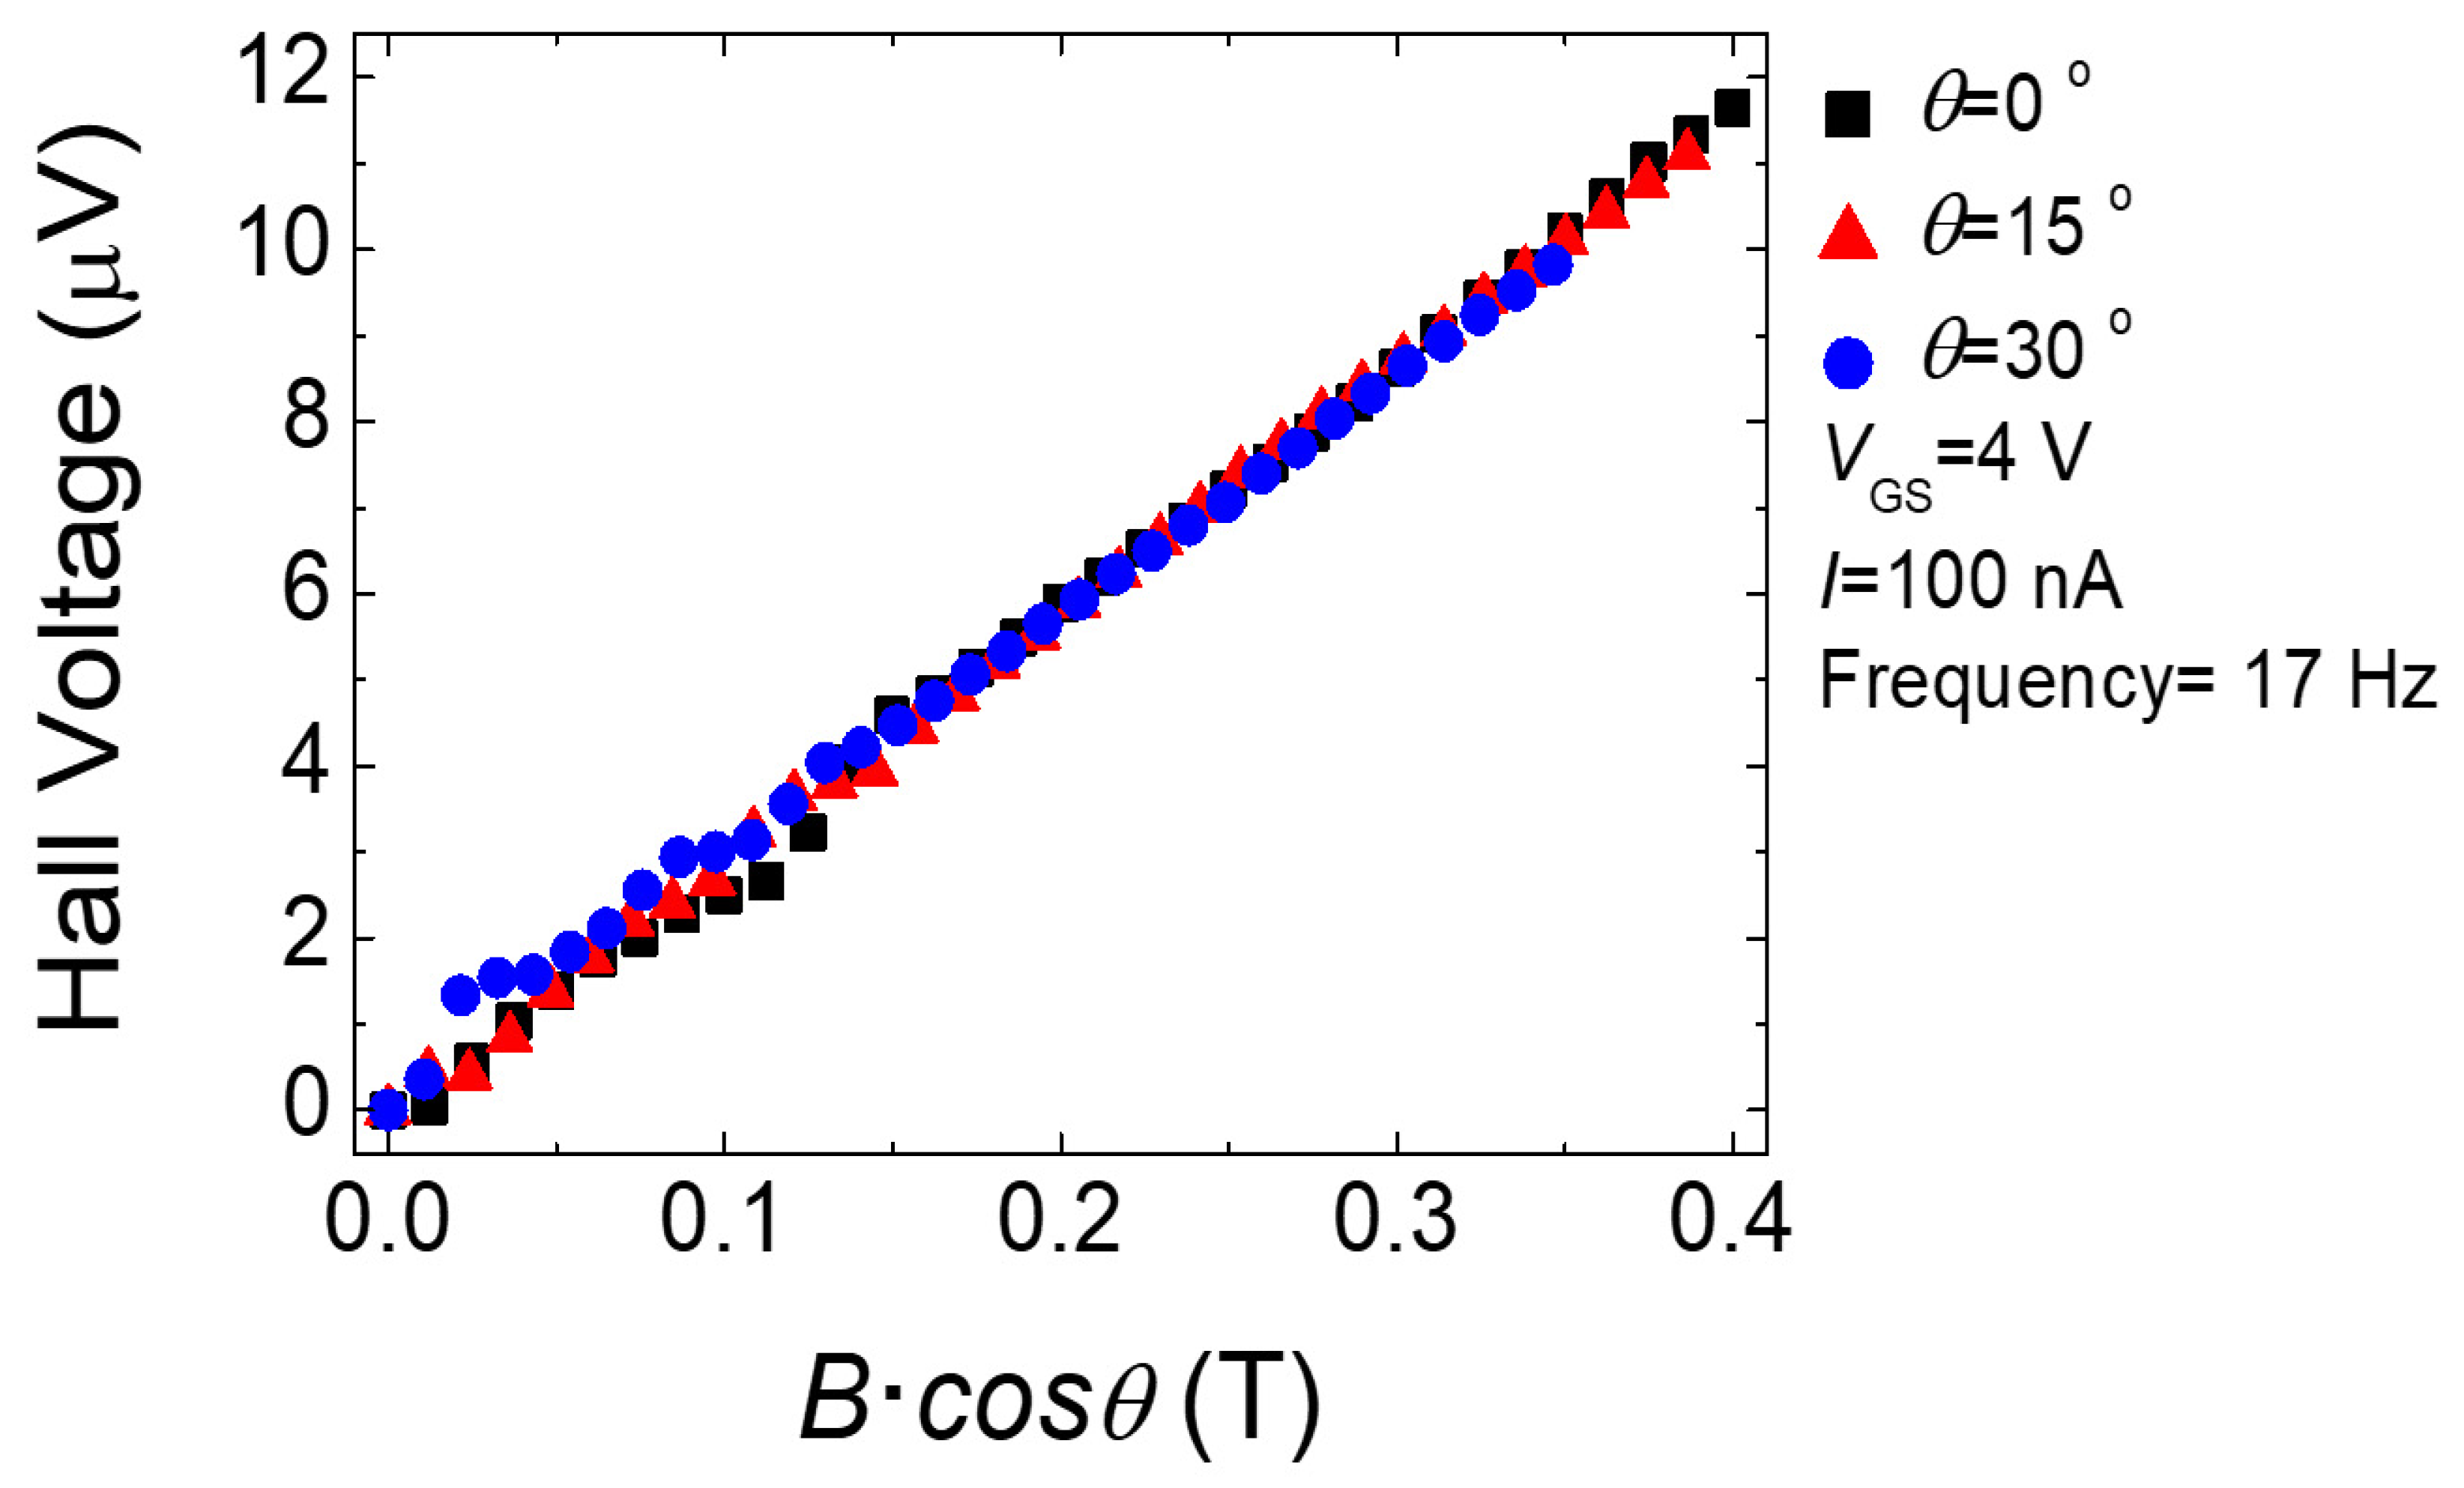
Figure 4 shows a plot of the electron density (nsheet) and Hall mobility (μHall) as a function of the gate voltage VGS. It can be seen that the areal electron density increased linearly as VGS increased, indicating a capacitively induced channel. The monotonous increase in μHall as a function of the electron density is a typical behavior observed in a-IGZO TFT [17]. To verify the dimensionality of the electrons, tilted magnetic field measurements at tilting angles of 0°, 15°, and 30° were performed at VGS = 4 V, at which reasonably high Hall voltages were expected. A smaller current I = 100 nA was used to minimize perturbations. Figure 5 shows the results of the offset-corrected Hall voltages at the perpendicularly applied magnetic fields. The coincidence of the Hall voltages with respect to the perpendicular B’s confirms that the electrons were confined in two dimensions [30].
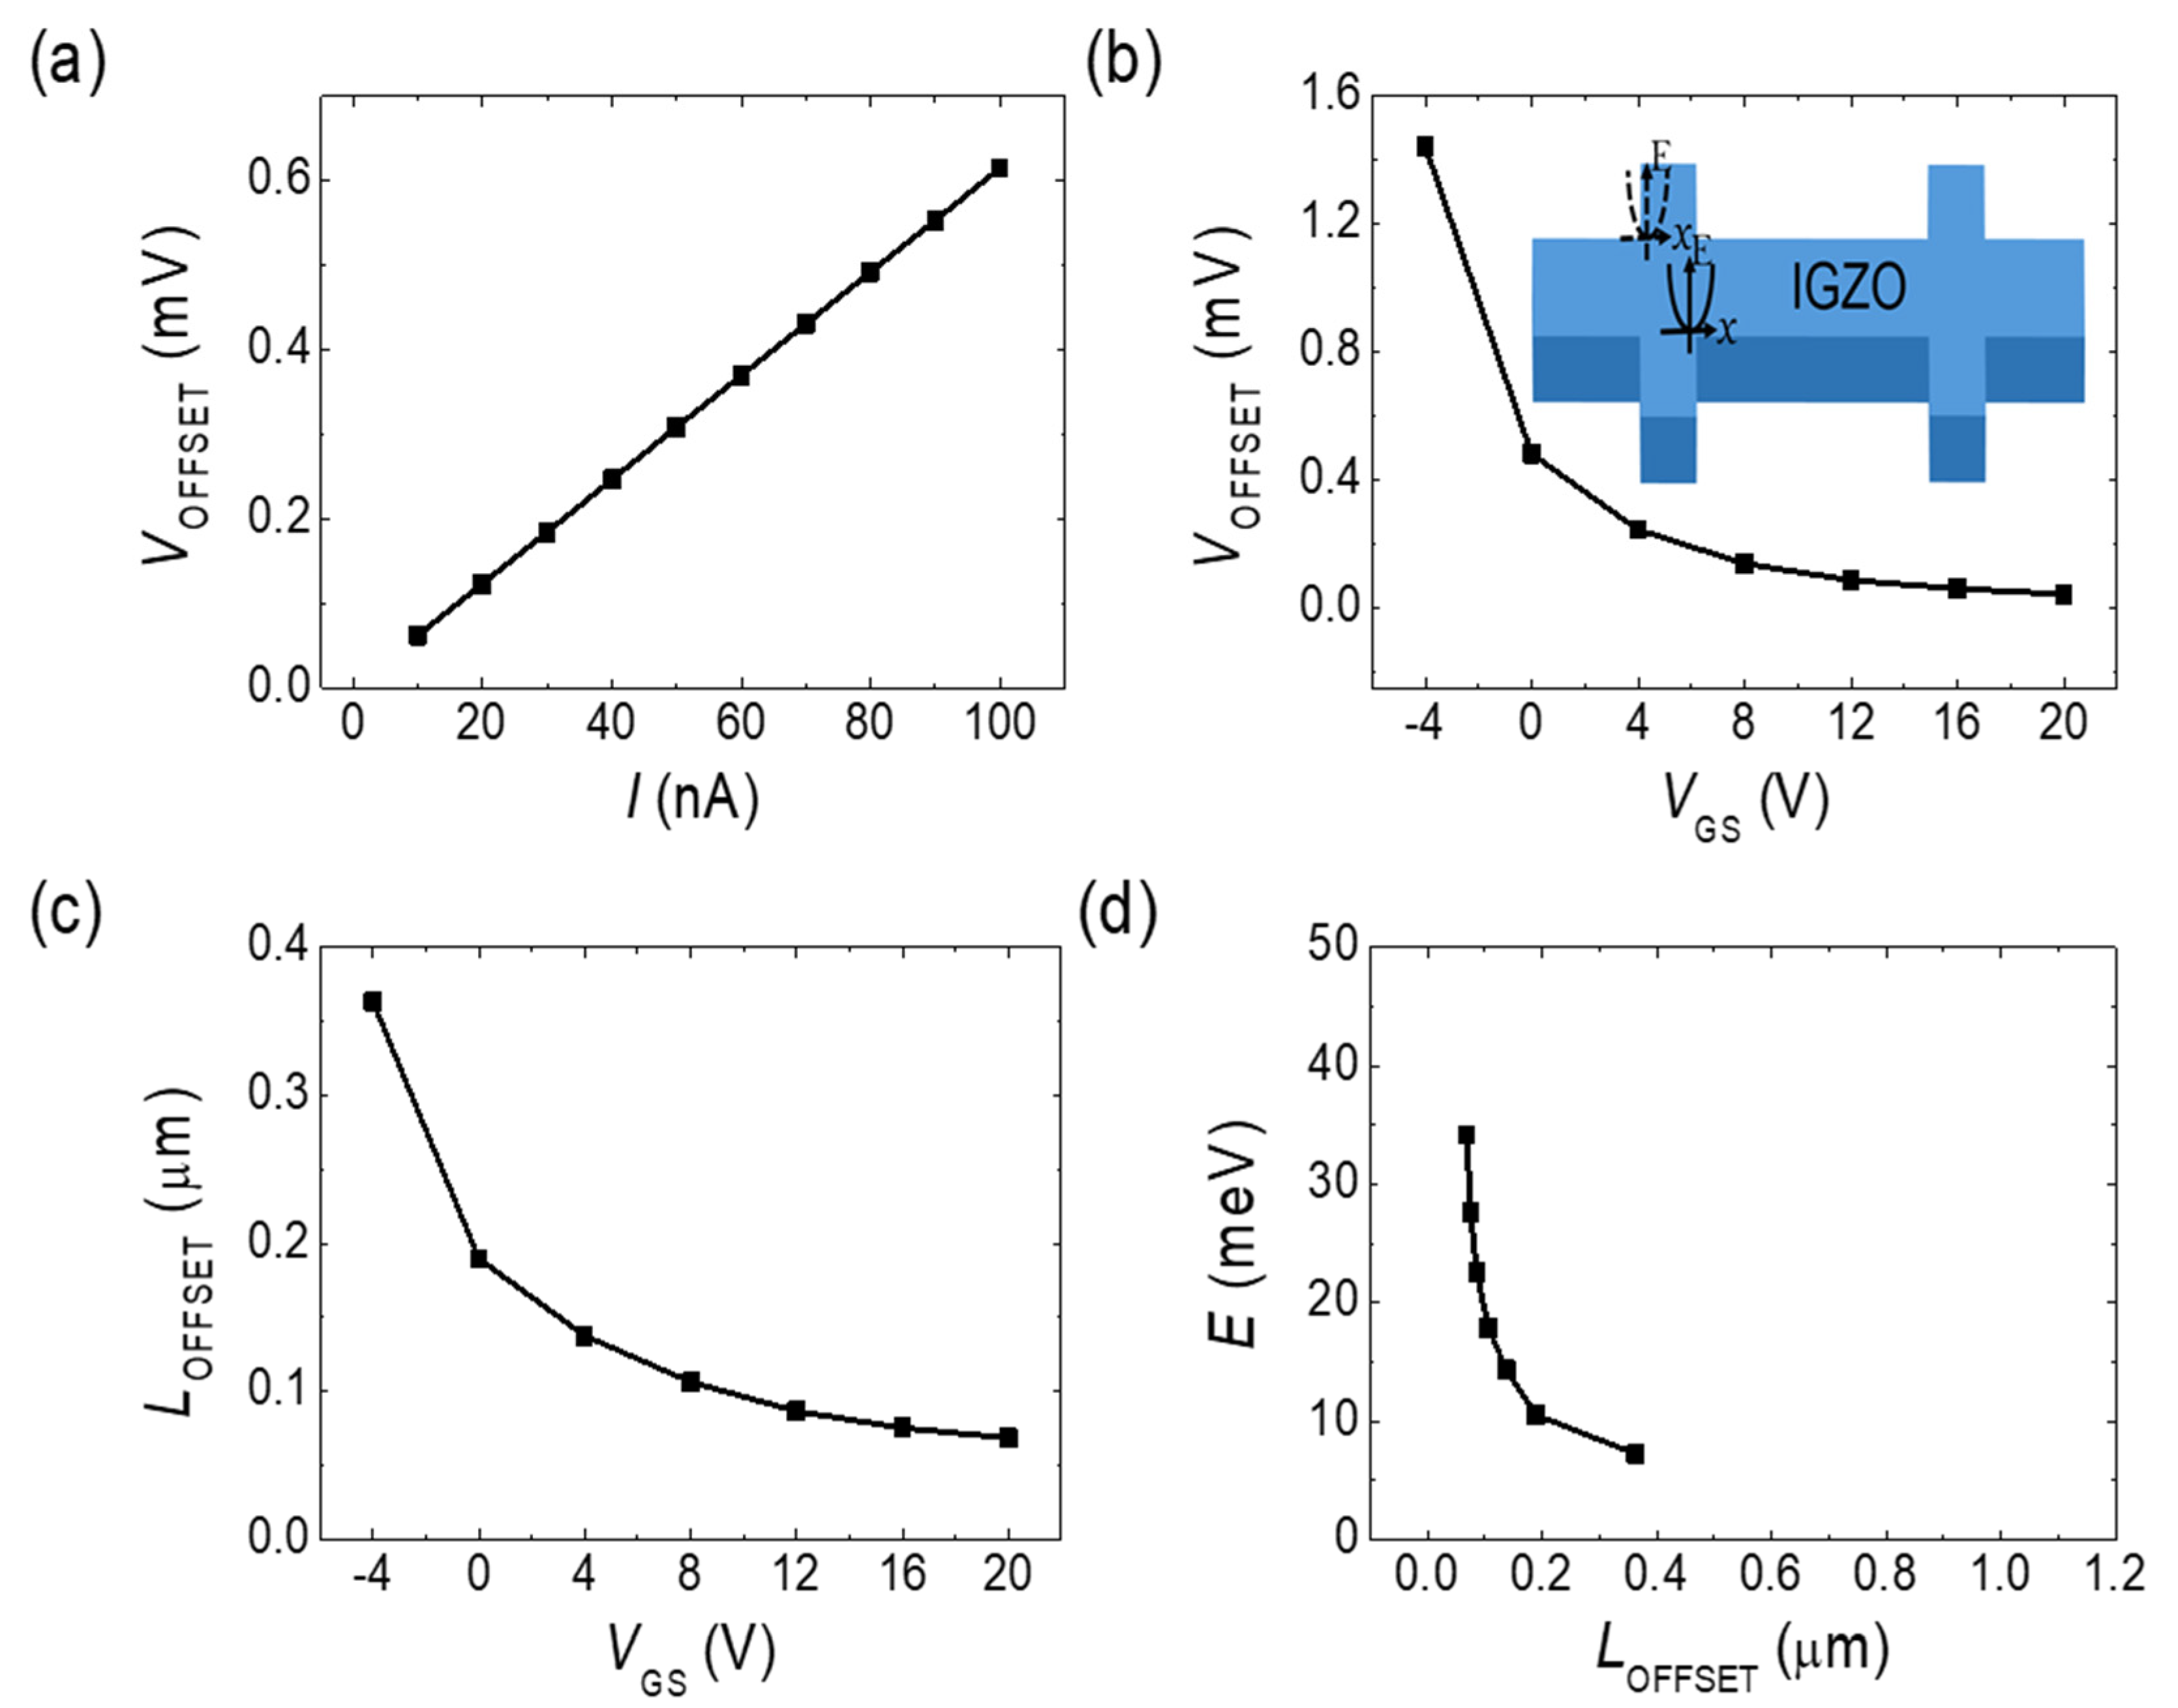
Figure 6 shows the Hall offset voltage as a function of VGS. In Figure 6a, the measured offset voltage clearly shows a linear dependence on the applied current, indicating a resistive behavior. As mentioned earlier, if the offset voltage is assumed to be induced from the misalignment of the Hall probes, it can be interpreted as the voltage across the resistor in the current direction between the unintentionally misaligned probing points. Figure 6b shows a plot of the measured Hall offset voltage versus the applied VGS, and the inset shows the possible locations and energy profiles of the probing points. This was attributed to the misalignment of longitudinal length, resulting in the decrease in the Hall offset voltage as the electron density increases. This offset length LOFFSET can be calculated from the Hall offset voltage VOFFSET, longitudinal voltage V3,5, and length L3,5 between the two longitudinal probes as follows:
L OFFSET = L 3 , 5 V OFFSET V 3 , 5
Figure 6c show a plot of LOFFSET as a function of VGS. Similar results can be obtained if the offset length is calculated from the geometry and the VGS-dependent conductivity value. From Figure 6c, it can be seen that LOFFSET decreased monotonously as VGS increased and, thus, the electron density increased. The increase of the two-dimensional electron density will induce a linear increase in the Fermi energy because the density of states is constant in two dimensions. The electron density can then be converted into the Fermi energy by simply dividing it by the two-dimensional density of states m*/πћ2, where m* is the electron effective mass of 0.34 m0 [23] and ћ is the Planck’s constant. Figure 6d shows a plot of the calculated Fermi energy versus the offset length. The x and y axes are interchanged from Figure 6c to represent the energy profile. The Fermi energy varies by approximately tens of meV over a length of a few tens of μm. This energy range is in good agreement with the reported result of the average barrier height range obtained from the percolation conduction model [23].
In percolation conduction, the conduction band edge has potential energy fluctuations and results in a nonflat, corrugated energy surface. Electrons find and flow along low-lying constant energy paths, inducing a current. If percolation conduction is assumed in the sample with many voltage probes (as in our case), the low-lying energy probing point locations are expected to be randomly placed in the active area even though the probes are lithographically aligned. In the a-IGZO TFT Hall probes, the actual probing points are located at the lowest, filled conduction band, as shown in the inset of Figure 6b. Therefore, the offset length deduced from the Hall offset voltage can be interpreted as the longitudinal distance between these randomly located top and bottom Hall probing points. Furthermore, this length varies with the two-dimensional electron density. The measured offset length can then be interpreted as the distance between the facing edges of the Hall probing points at the Fermi energy. Therefore, by measuring the offset length as a function of the density, the combined conduction band profile from the facing edges was determined as shown in Figure 6d. For identical top and bottom profiles, the length would be halved for each profile.
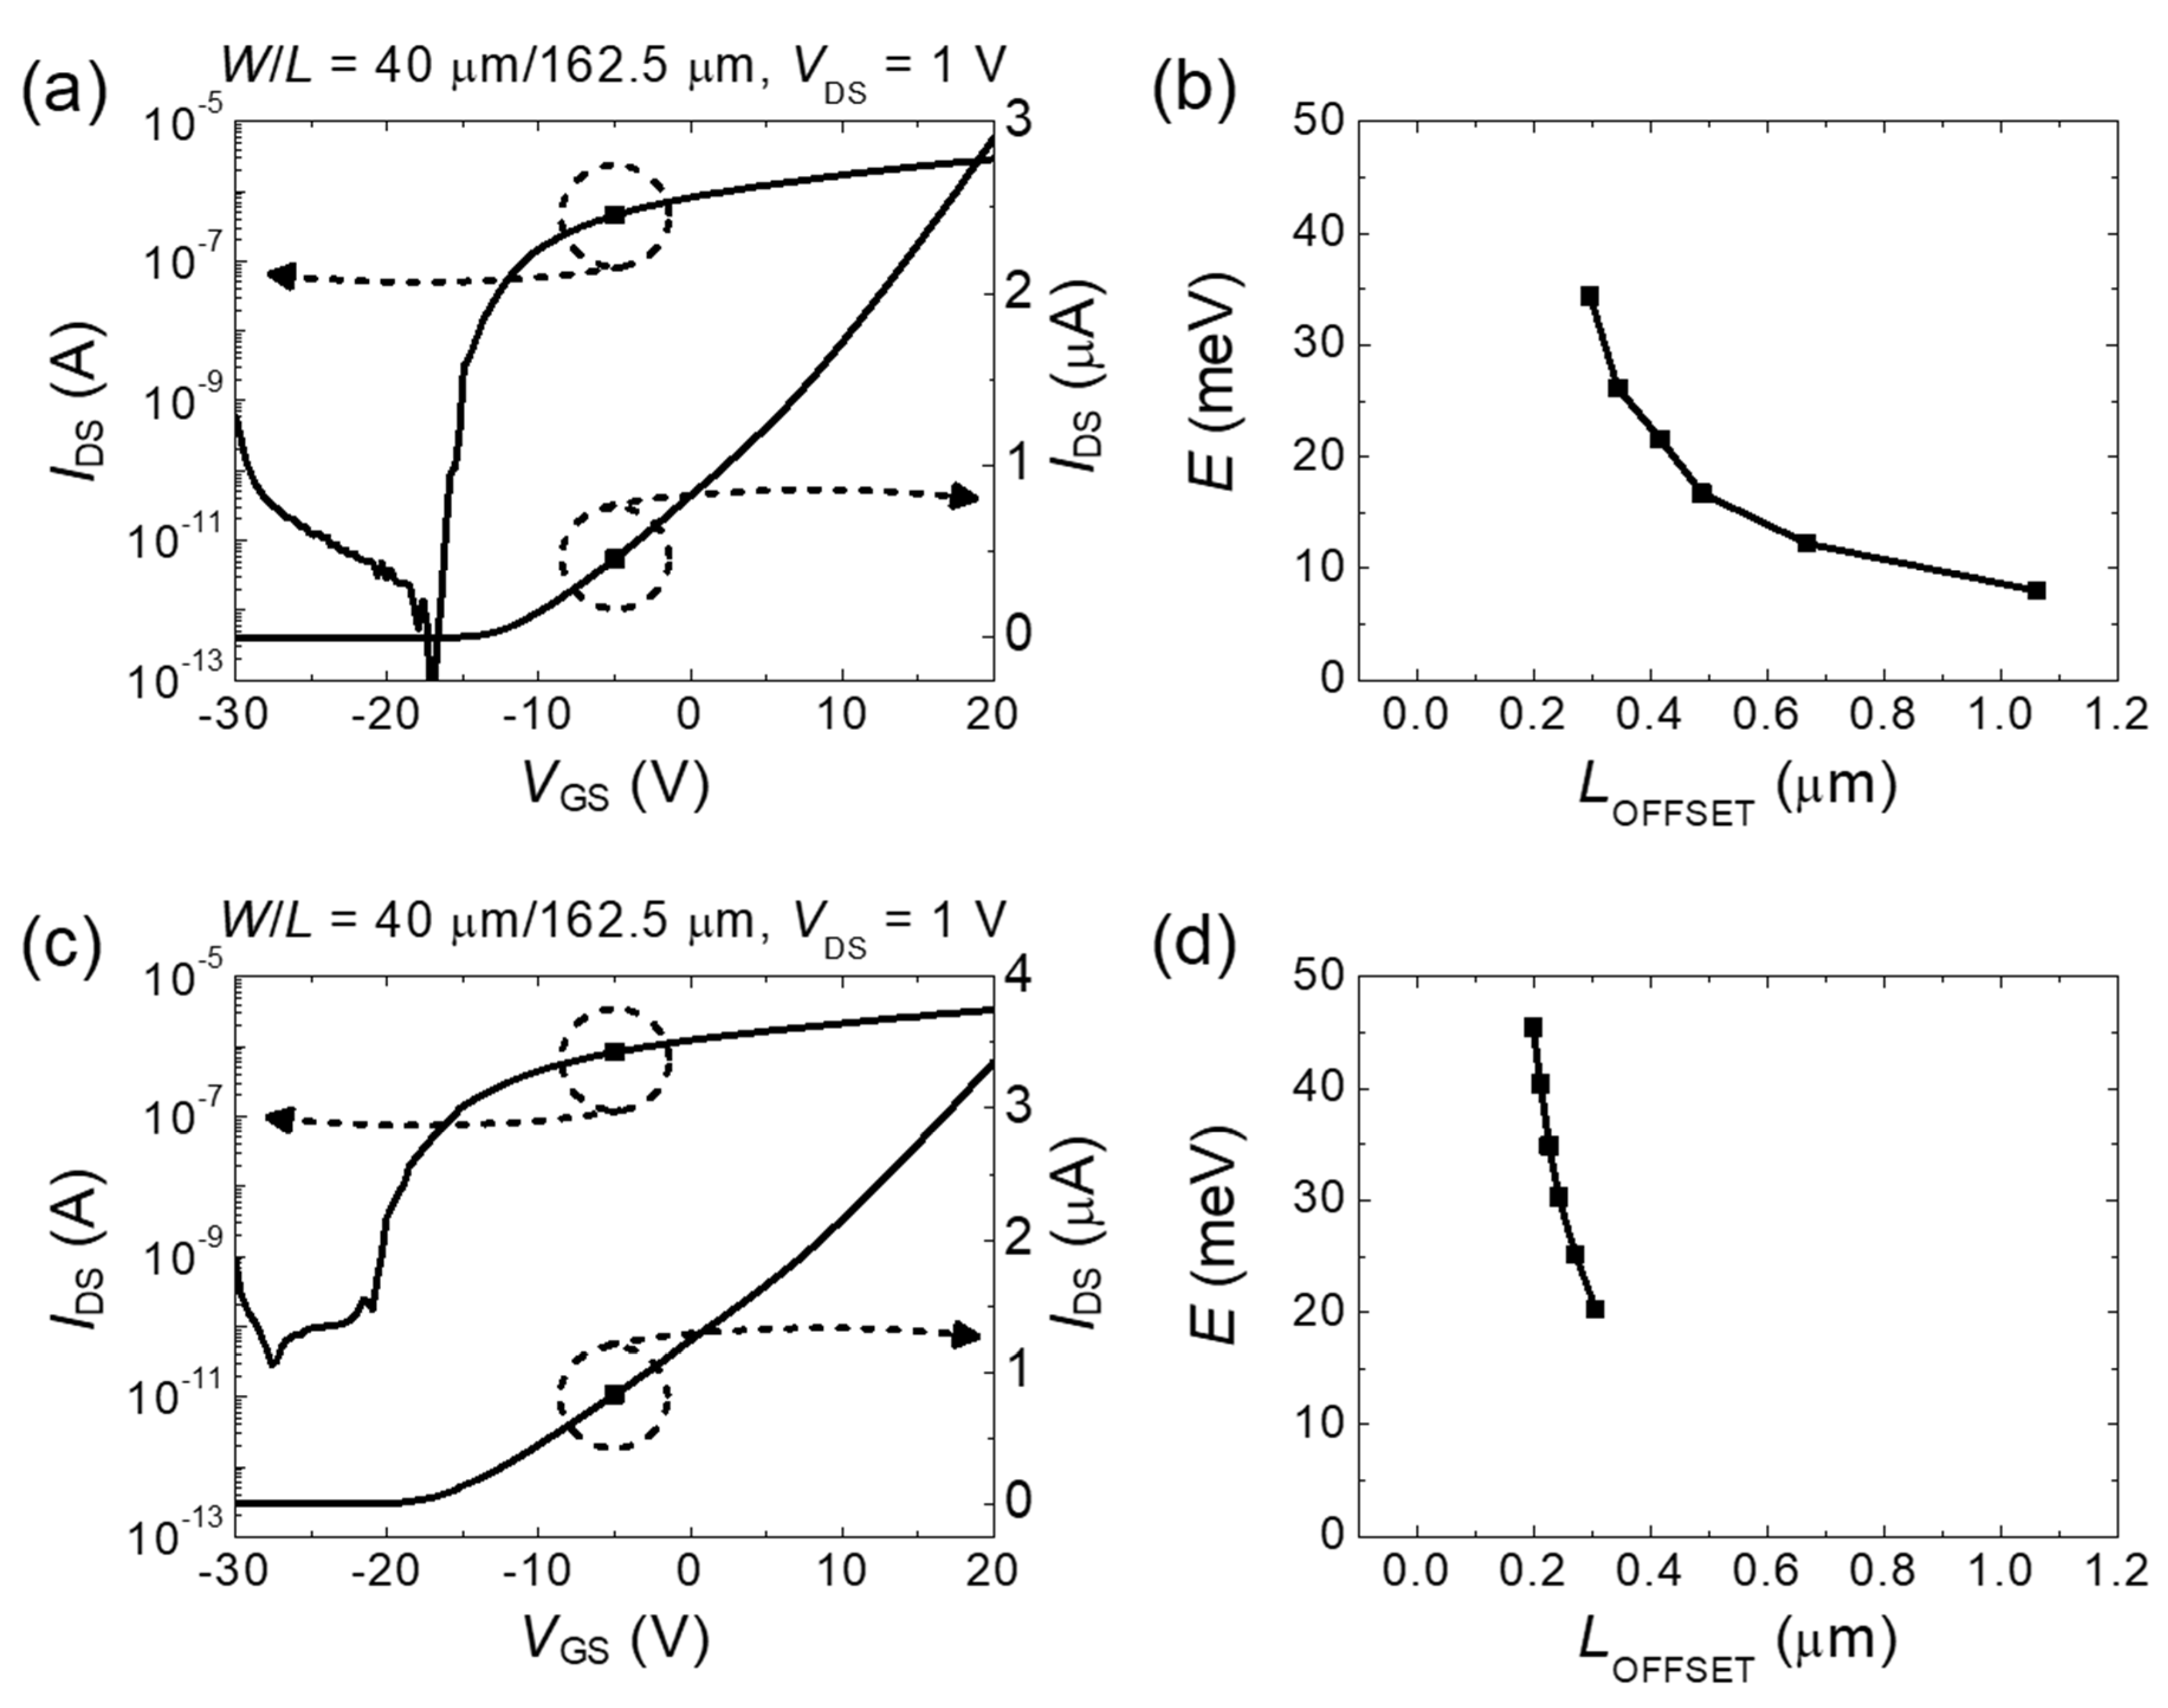
Figure 7 shows the results from two other samples with different VTH. Figure 7a,c shows the transfer curves of samples B and C, respectively, with the same measurement conditions except for the VGS sweep range. The VGS sweep was extended to −30 V to show the full on/off characteristics due to different threshold voltages. Figure 7b,d shows the deduced combined conduction band edge profiles in samples B and C, respectively. The results reported in Figure 7 were obtained using threshold voltages of −10.01 and −15.82 V, respectively. The threshold voltage determines the range of the electron density for the same VGS sweep. In particular, a lower threshold voltage leads to a higher electron density at the maximum VGS. Thus, the Fermi energy range of sample C can increase. It can be seen that the three samples measured showed similar profiles.

4. Conclusions

In this work, we systematically analyzed the Hall offset voltages of the two-dimensional electron system in three IGZO TFTs. The electrons were verified to be confined in two dimensions from the coincidence of the Hall voltages with respect to the perpendicularly applied magnetic field with tilting angles of 0°, 15°, and 30°. The Hall offset voltages decreased monotonously as the electron densities increased. We attributed the magnitude of the offset voltage to the misaligned longitudinal voltage between the probing points and the electron density to the Fermi energy. From these results, we deduced the combined conduction band profiles for the three samples with different threshold voltages. The extracted conduction band edge variation range of a few tens of meV is consistent with the value obtained from the analysis of percolation conduction [16].

Author Contributions

Conceptualization, S.-H.S.; experiment, H.-J.J., D.-H.K., and H.-S.C.; data analysis, H.-J.J. and S.-H.S.; writing—original draft preparation, H.-J.J.; supervision, S.-H.S.; and writing—review and editing, S.-H.S. All authors have read and agreed to the published version of the manuscript.

Funding

This work was supported by Basic Science Research Program through the National Research Foundation of Korea (NRF) grant funded by the Ministry of Education (No. 2017R1D1A1B03035429) and in part by Korea Institute for Advancement of Technology (KIAT) grant funded by the Korea Government (MOTIE) (N0001883, The Competency Development Program for Industry Specialist).

Conflicts of Interest

The authors declare no conflict of interest. The funders had no role in the design of the study; in the collection, analyses, or interpretation of data; in the writing of the manuscript, or in the decision to publish the results.

References

  1. Osada, T.; Akimoto, K.; Sato, T.; Ikeda, M.; Tsubuku, M.; Sakata, J.; Koyama, J.; Serikawa, T.; Yamazaki, S. Development of Liquid Crystal Display Panel Integrated with Drivers Using Amorphous In-Ga-Zn-Oxide Thin film Transistors. Jpn. J. Appl. Phys. 2010, 49, 03CC02. [Google Scholar] [CrossRef]
  2. Yoon, J.S.; Hong, S.J.; Kim, J.H.; Kim, D.H.; Ryosuke, T.; Nam, W.J.; Song, B.C.; Kim, J.M.; Kim, P.Y.; Park, K.H.; et al. 55-inch OLED TV using Optimal Driving Method for Large-size Panel based on InGaZnO TFTs. SID Int. Symp. Dig. Tech. Pap. 2014, 45, 849–852. [Google Scholar] [CrossRef]
  3. Tai, Y.H.; Chiu, H.L.; Chou, L.S. Active matrix touch sensor detecting time-constant change implemented by dual-gate IGZO TFTs. Solid State Electron. 2012, 72, 67–72. [Google Scholar] [CrossRef]
  4. Park, M.-J.; Jeong, H.-S.; Joo, H.-J.; Jeong, H.-Y.; Song, S.-H.; Kwon, H.-I. Gated Improvement of NO2 gas-sensing properties in InGaZnO thin-film transistors by a pre-biasing measurement method. Semicond. Sci. Technol. 2019, 34, 065010. [Google Scholar] [CrossRef]
  5. Ke, N.H.; Loan, P.T.K.; Tuan, D.A.; Dat, H.T.; Tran, C.V.; Hung, L.V.T. The characteristics of IGZO/ZnO/Cu2O: Na thin film solar cells fabricated by DC magnetron sputtering method. J. Photochem. Photobiol. A Chem. 2017, 349, 100–107. [Google Scholar] [CrossRef]
  6. Hara, K.; Horiguchi, T.; Kinoshita, T.; Sayama, K.; Sugihara, H.; Arakawa, H. Highly efficient photon-to-electron conversion with mercurochrome-sensitized nanoporous oxide semiconductor solar cells. Sol. Energy Mater. Sol. Cells 2000, 64, 115–134. [Google Scholar] [CrossRef]
  7. Nomura, K.; Ohta, H.; Takagi, A.; Kamiya, T.; Hirano, M.; Hosono, H. Room-temperature fabrication of transparent flexible thin-film transistors using amorphous oxide semiconductors. Nature 2004, 432, 488–492. [Google Scholar] [CrossRef] [PubMed]
  8. Hayashi, R.; Ofuji, M.; Kaji, N.; Takahashi, K.; Abe, K.; Yabuta, H.; Sano, M.; Kumomi, H.; Nomura, K.; Kamiya, T.; et al. Circuits using uniform TFTs based on amorphous In-Ga-Zn-O. J. Soc. Inf. Disp. 2007, 15, 11. [Google Scholar] [CrossRef]
  9. Kamiya, T.; Hosono, H. Material characteristics and applications of transparent amorphous oxide semiconductors. NPG Asia Mater. 2010, 2, 15–22. [Google Scholar] [CrossRef] [Green Version]
  10. Lee, S.Y.; Kim, D.H.; Chong, E.; Jeon, Y.W.; Kim, D.H. Effect of channel thickness on density of states in amorphous InGaZnO thin film transistor. Appl. Phys. Lett. 2011, 98, 122105. [Google Scholar] [CrossRef] [Green Version]
  11. Kwon, J.Y.; Jeong, J.K. Recent progress in high performance and reliable n-type transition metal oxide-based thin film transistors. Semicond. Sci. Technol. 2015, 30, 024002. [Google Scholar] [CrossRef]
  12. Zan, H.-W.; Yeh, C.-C.; Meng, H.-F.; Tsai, C.-C.; Chen, L.-H. Achieving High Field-Effect Mobility in Amorphous Indium-Gallium-Zinc Oxide by Capping a Strong Reduction Layer. Adv. Mater. 2012, 24, 3509–3514. [Google Scholar] [CrossRef] [PubMed]
  13. Kwon, J.Y.; Jung, J.S.; Son, K.S.; Kim, T.S.; Ryu, M.K.; Park, K.B.; Park, Y.S.; Lee, S.Y.; Kim, J.M. GaInZnO TFT for active matrix display. In Proceedings of the Fifteenth International Workshop on Active-Matrix Flatpanel Displays and Devices (AM-FPD’08), Tokyo, Japan, 2–4 July 2008; pp. 287–290. [Google Scholar]
  14. Nomura, K.; Takagi, A.; Kamiya, T.; Ohta, H.; Hirano, M.; Hosono, H. Amorphous Oxide semiconductors for High-Performance Flexible Thin-Film Transistors. Jpn. J. Appl. Phys. 2006, 45, 4303–4308. [Google Scholar] [CrossRef]
  15. Park, M.-J.; Yun, D.-J.; Ryu, M.-K.; Yang, J.-H.; Pi, J.-E.; Kwon, O.-S.; Kim, G.H.; Hwang, C.-S.; Bak, J.-Y.; Yoon, S.-M. Improvements in the bending performance and bias stability of flexible InGaZnO thin film transistors and optimum barrier structures for plastic poly(ethylene naphthalate) substrates. J. Mater. Chem. C 2015, 3, 4779–4786. [Google Scholar] [CrossRef]
  16. Kamiya, T.; Nomura, K.; Hosono, H. Electronic Structures above mobility edges in crystalline and Amorphous In-Ga-Zn-O: Percolation conduction Examined by Analytical Model. J. Disp. Technol. 2009, 5, 462–467. [Google Scholar] [CrossRef]
  17. Lee, S.; Ghaffarzadeh, K.; Nathan, A.; Robertson, J.; Jeon, S.; Kim, C.; Song, I.H.; Chung, U.I. Trap-limited and percolation conduction mechanisms in amorphous oxide semiconductor thin film transistors. Appl. Phys. Lett. 2011, 98, 203508. [Google Scholar] [CrossRef]
  18. Nag, M.; Steudel, S.; Genoe, J.; Gelinck, G.; Kadashchuk, A.; Groeseneken, G.; Heremans, P.; Bhoolokam, A. Conduction mechanism in amorphous InGaZnO thin film transistors. J. Appl. Phys. 2016, 55, 014301. [Google Scholar] [CrossRef]
  19. Wener, F. Hall measurements on low-mobility thin films. J. Appl. Phys. 2017, 122, 135306. [Google Scholar] [CrossRef]
  20. Yamaguchi, Y.; Hashimoto, H.; Kimura, M.; Hirako, M.; Yamaoka, T.; Satoshi, T. Magnetic-Field Area Sensor Using Poly-Si Micro Hall Devices. IEEE Electron Device Lett. 2010, 31, 1260–1262. [Google Scholar] [CrossRef]
  21. Jeong, J.K.; Yang, H.W.; Jeong, J.H.; Mo, Y.G.; Kim, H.D. Origin of threshold voltage instability in indium-gallium-zinc oxide thin film transistors. Appl. Phys. Lett. 2008, 93, 123508. [Google Scholar] [CrossRef]
  22. Olziersky, A.; Barquinha, P.; Vila, A.; Pereira, L.; Goncalves, G.; Fortunato, E.; Martins, R.; Morante, J.R. Insight on the Su-8 resist as passivation layer for transparent Ga2O3-In2O3-ZnO thin-film transistors. J. Appl. Phys. 2010, 108, 064505. [Google Scholar] [CrossRef]
  23. Kamiya, T.; Nomura, K.; Hosono, H. Origin of definite Hall voltage and positive slope in mobility-donor density relation in disordered oxide semiconductors. Appl. Phys. Lett. 2010, 96, 122103. [Google Scholar] [CrossRef]
  24. Streetman, B.G.; Banerjee, S.K. Solid State Electronic Devices, 7th ed.; Pearson Education Limited, University of Texas: Austin, TX, USA, 2016; pp. 129–131. [Google Scholar]
  25. Sallese, J.M.; Kayal, M.; Paun, M.A. Hall Effect Sensors Design, Integration and Behavior Analysis. J. Sens. Actuator Netw. 2013, 2, 85–97. [Google Scholar] [CrossRef] [Green Version]
  26. Ramsden, E. Hall-Effect Sensors: Theory and Application; Newnes Publication: Burlington, NJ, USA, 2006; pp. 1–9. [Google Scholar]
  27. Paun, M.A.; Sallese, J.M.; Kayal, M. Offset and drift analysis of the Hall Effect sensors. The geometrical parameters influence. Dig. J. Nanomater. Bios. 2012, 7, 883–891. [Google Scholar]
  28. ASTM Standard F76-86. Standard method for measuring hall mobility and hall coefficient in extrinsic semiconductor single crystals. In 1991 Annual Book of ASTM Standards; American Society for Testing Materials: Philadelphia, PA, USA, 1991. [Google Scholar]
  29. Wieder, H.H. Transport coefficients of InAs epilayers. Appl. Phys. Lett. 2003, 25, 206. [Google Scholar] [CrossRef]
  30. Ramos, A.C.A.; Alves, T.F.A.; Farias, G.A.; Costa Filho, R.N.; Almeida, N.S. 2DEG in the presence of tilted magnetic field at finite temperature. Physica E 2009, 41, 1267. [Google Scholar] [CrossRef]
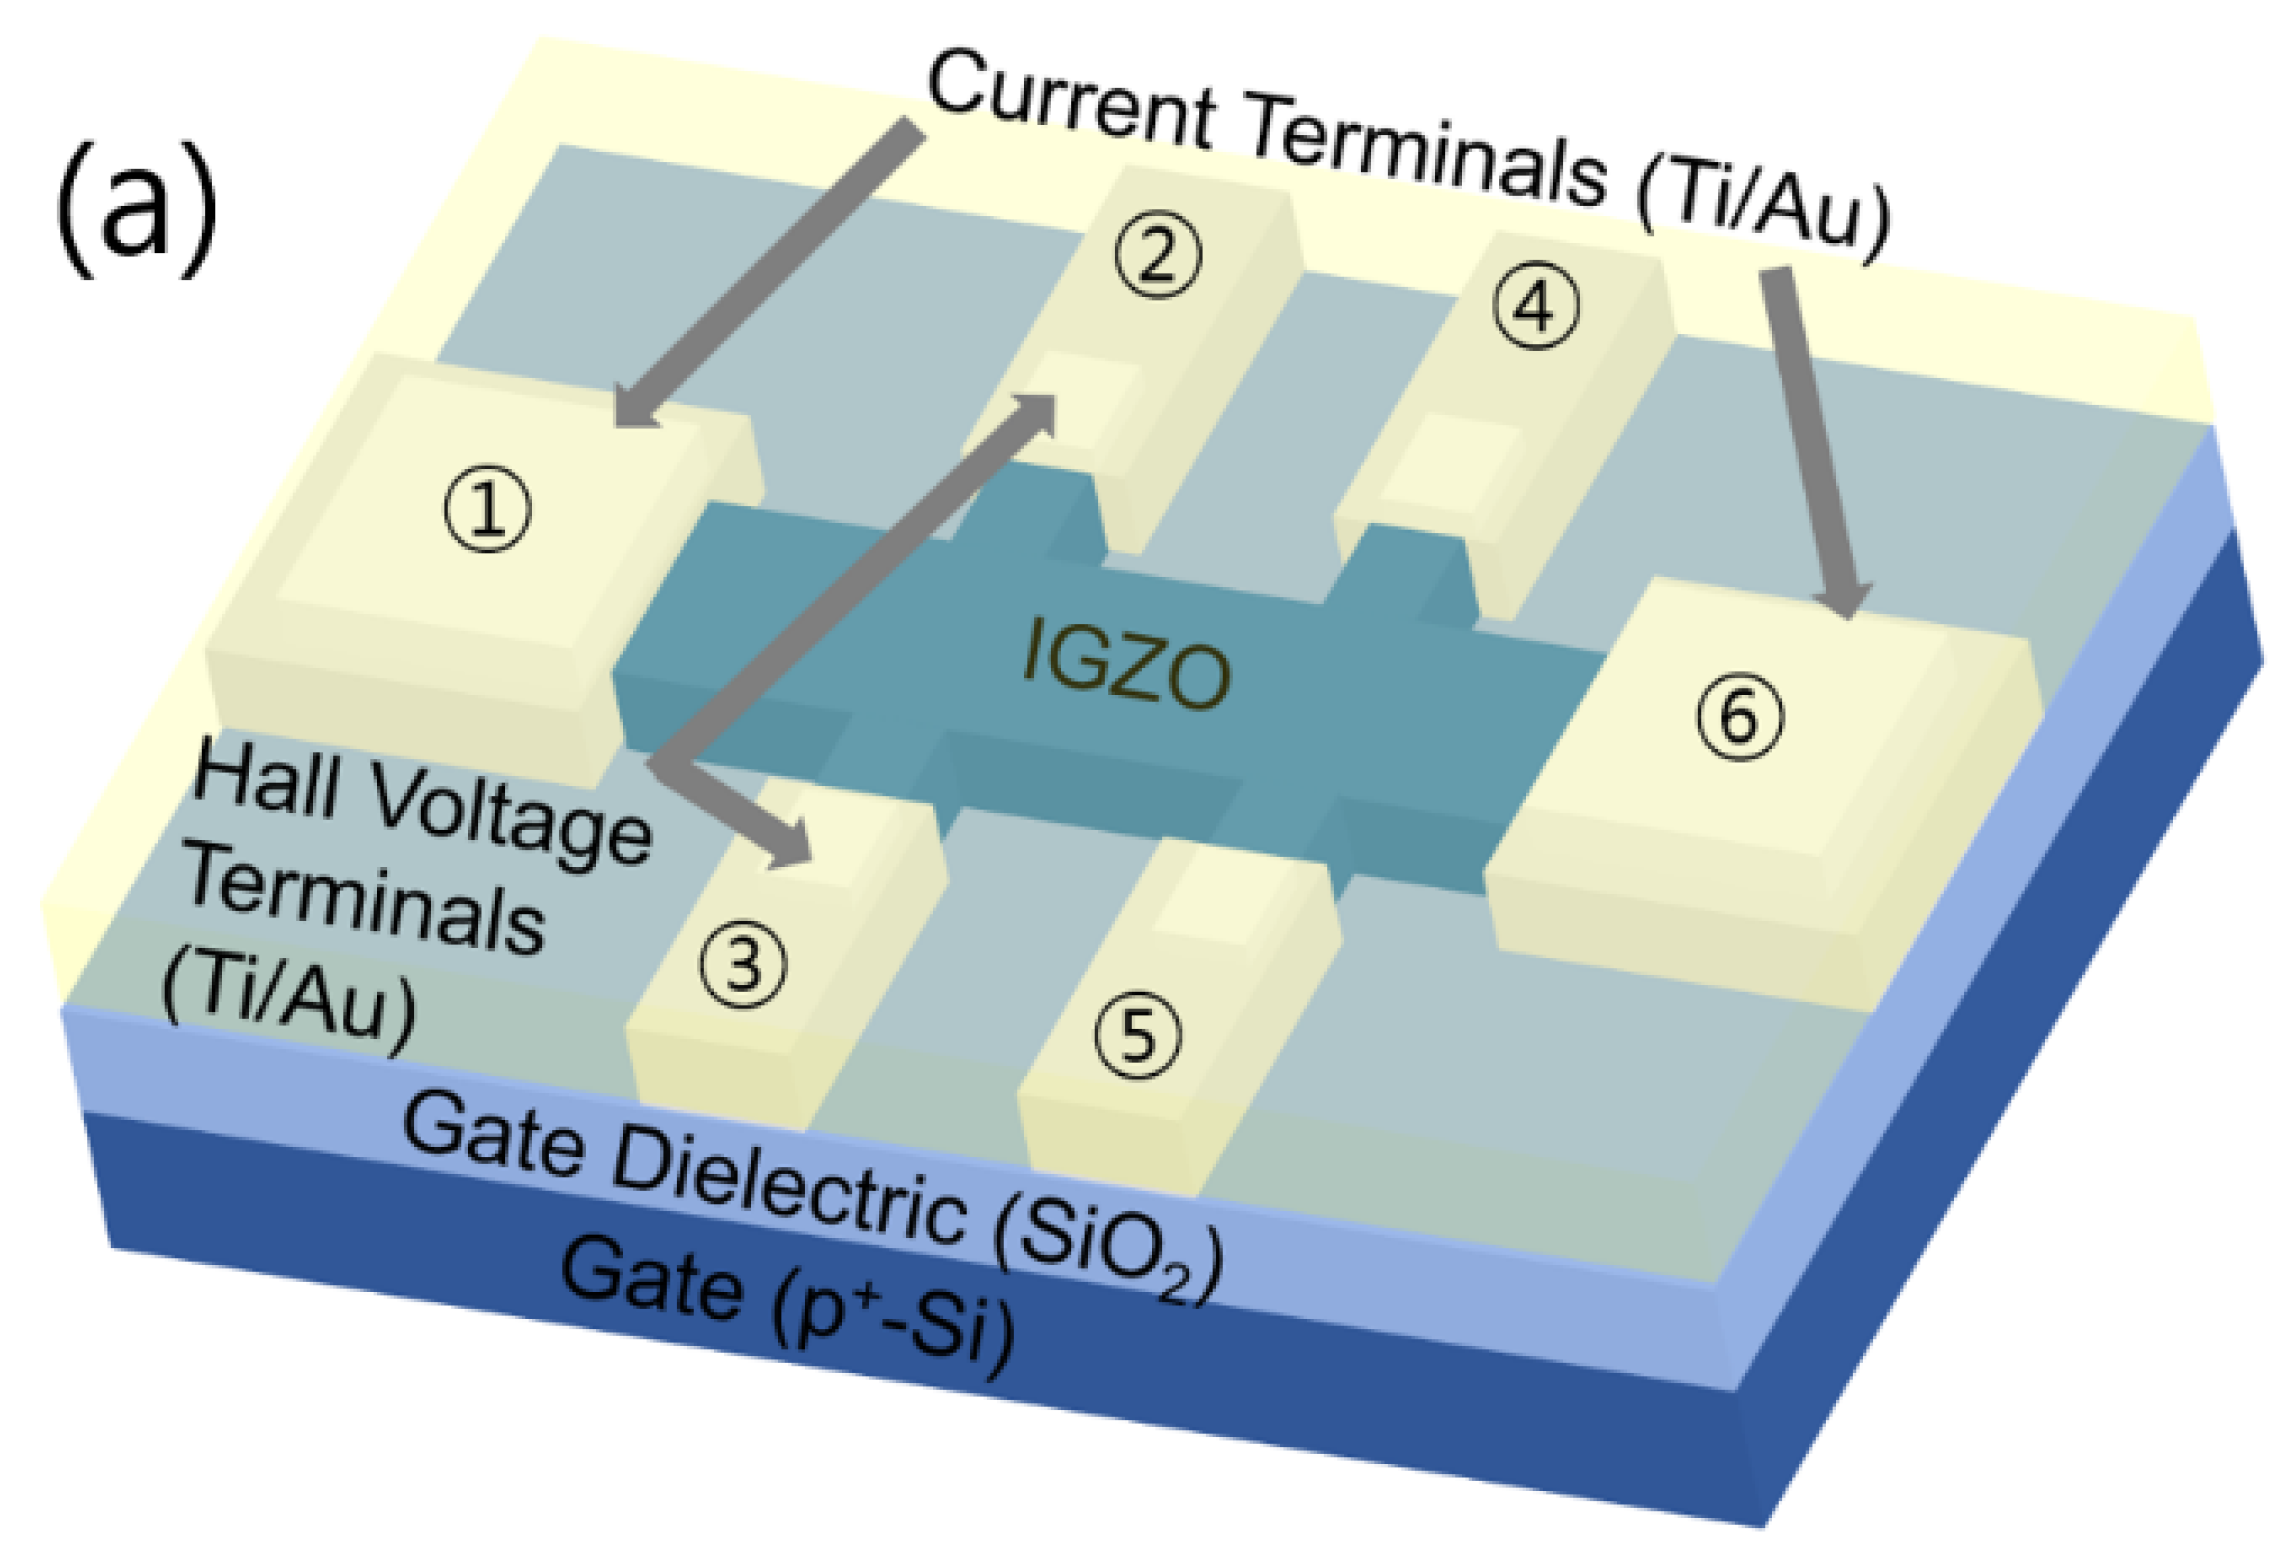
Figure 1. (a) Schematic of the a-IGZO Hall bar TFT without the top SU-8 passivation layer. The electrode terminals are labelled by numbers from 1 to 6. (b) Optical image of the fabricated a-IGZO TFT with the top passivation layer.
Micromachines 11 00822 g001aMicromachines 11 00822 g001b
Figure 2. Transfer curve of the a-IGZO Hall bar-patterned TFT.
Micromachines 11 00822 g002
Figure 3. (a) Hall voltages as a function of the magnetic field with various gate-source voltages VGS (−4, 0, 4, 8, 12, 16, and 20 V); a 17-Hz, 300-nA sinusoidal current was used. (b) Hall voltages with offset corrected by applying magnetic field reversal measurement data.
Micromachines 11 00822 g003
Figure 4. Electron density (nsheet) and Hall mobility (µHall) as a function of the gate voltage VGS.
Micromachines 11 00822 g004
Figure 5. Offset-corrected Hall voltages at a gate voltage VGS of 4 V and current level I of 100 nA as a function of the perpendicular magnetic field at tilting angles of 0°, 15°, and 30°.
Micromachines 11 00822 g005
Figure 6. Offset voltage as a function of the (a) applied current and (b) gate voltage VGS. The inset shows a schematic of the device with the possible probing point conduction band energy profiles. (c) Offset length versus VGS. The offset length was converted from the offset voltage using Equation (1). (d) Fermi energy versus offset length. The Fermi energy was calculated by dividing the electron density by the 2 dimensional electron density of states. This plot is interpreted as the combined conduction band edge energy profile.
Micromachines 11 00822 g006
Figure 7. Combined conduction band edge energy profiles from two other samples. (a) Transfer curve of Sample B with VTH = −10.01 V. (b) Deduced combined conduction band edge energy profile of Sample B. (c) Transfer curve of Sample C with VTH = −15.82 V. (d) Deduced combined conduction band edge energy profile of Sample C.
Micromachines 11 00822 g007