Trans Fat Intake and Its Dietary Sources in General Populations Worldwide: A Systematic Review


Abstract
1. Introduction
2. Materials and Methods
2.1. Search Strategy
2.2. Data Extraction and Analysis
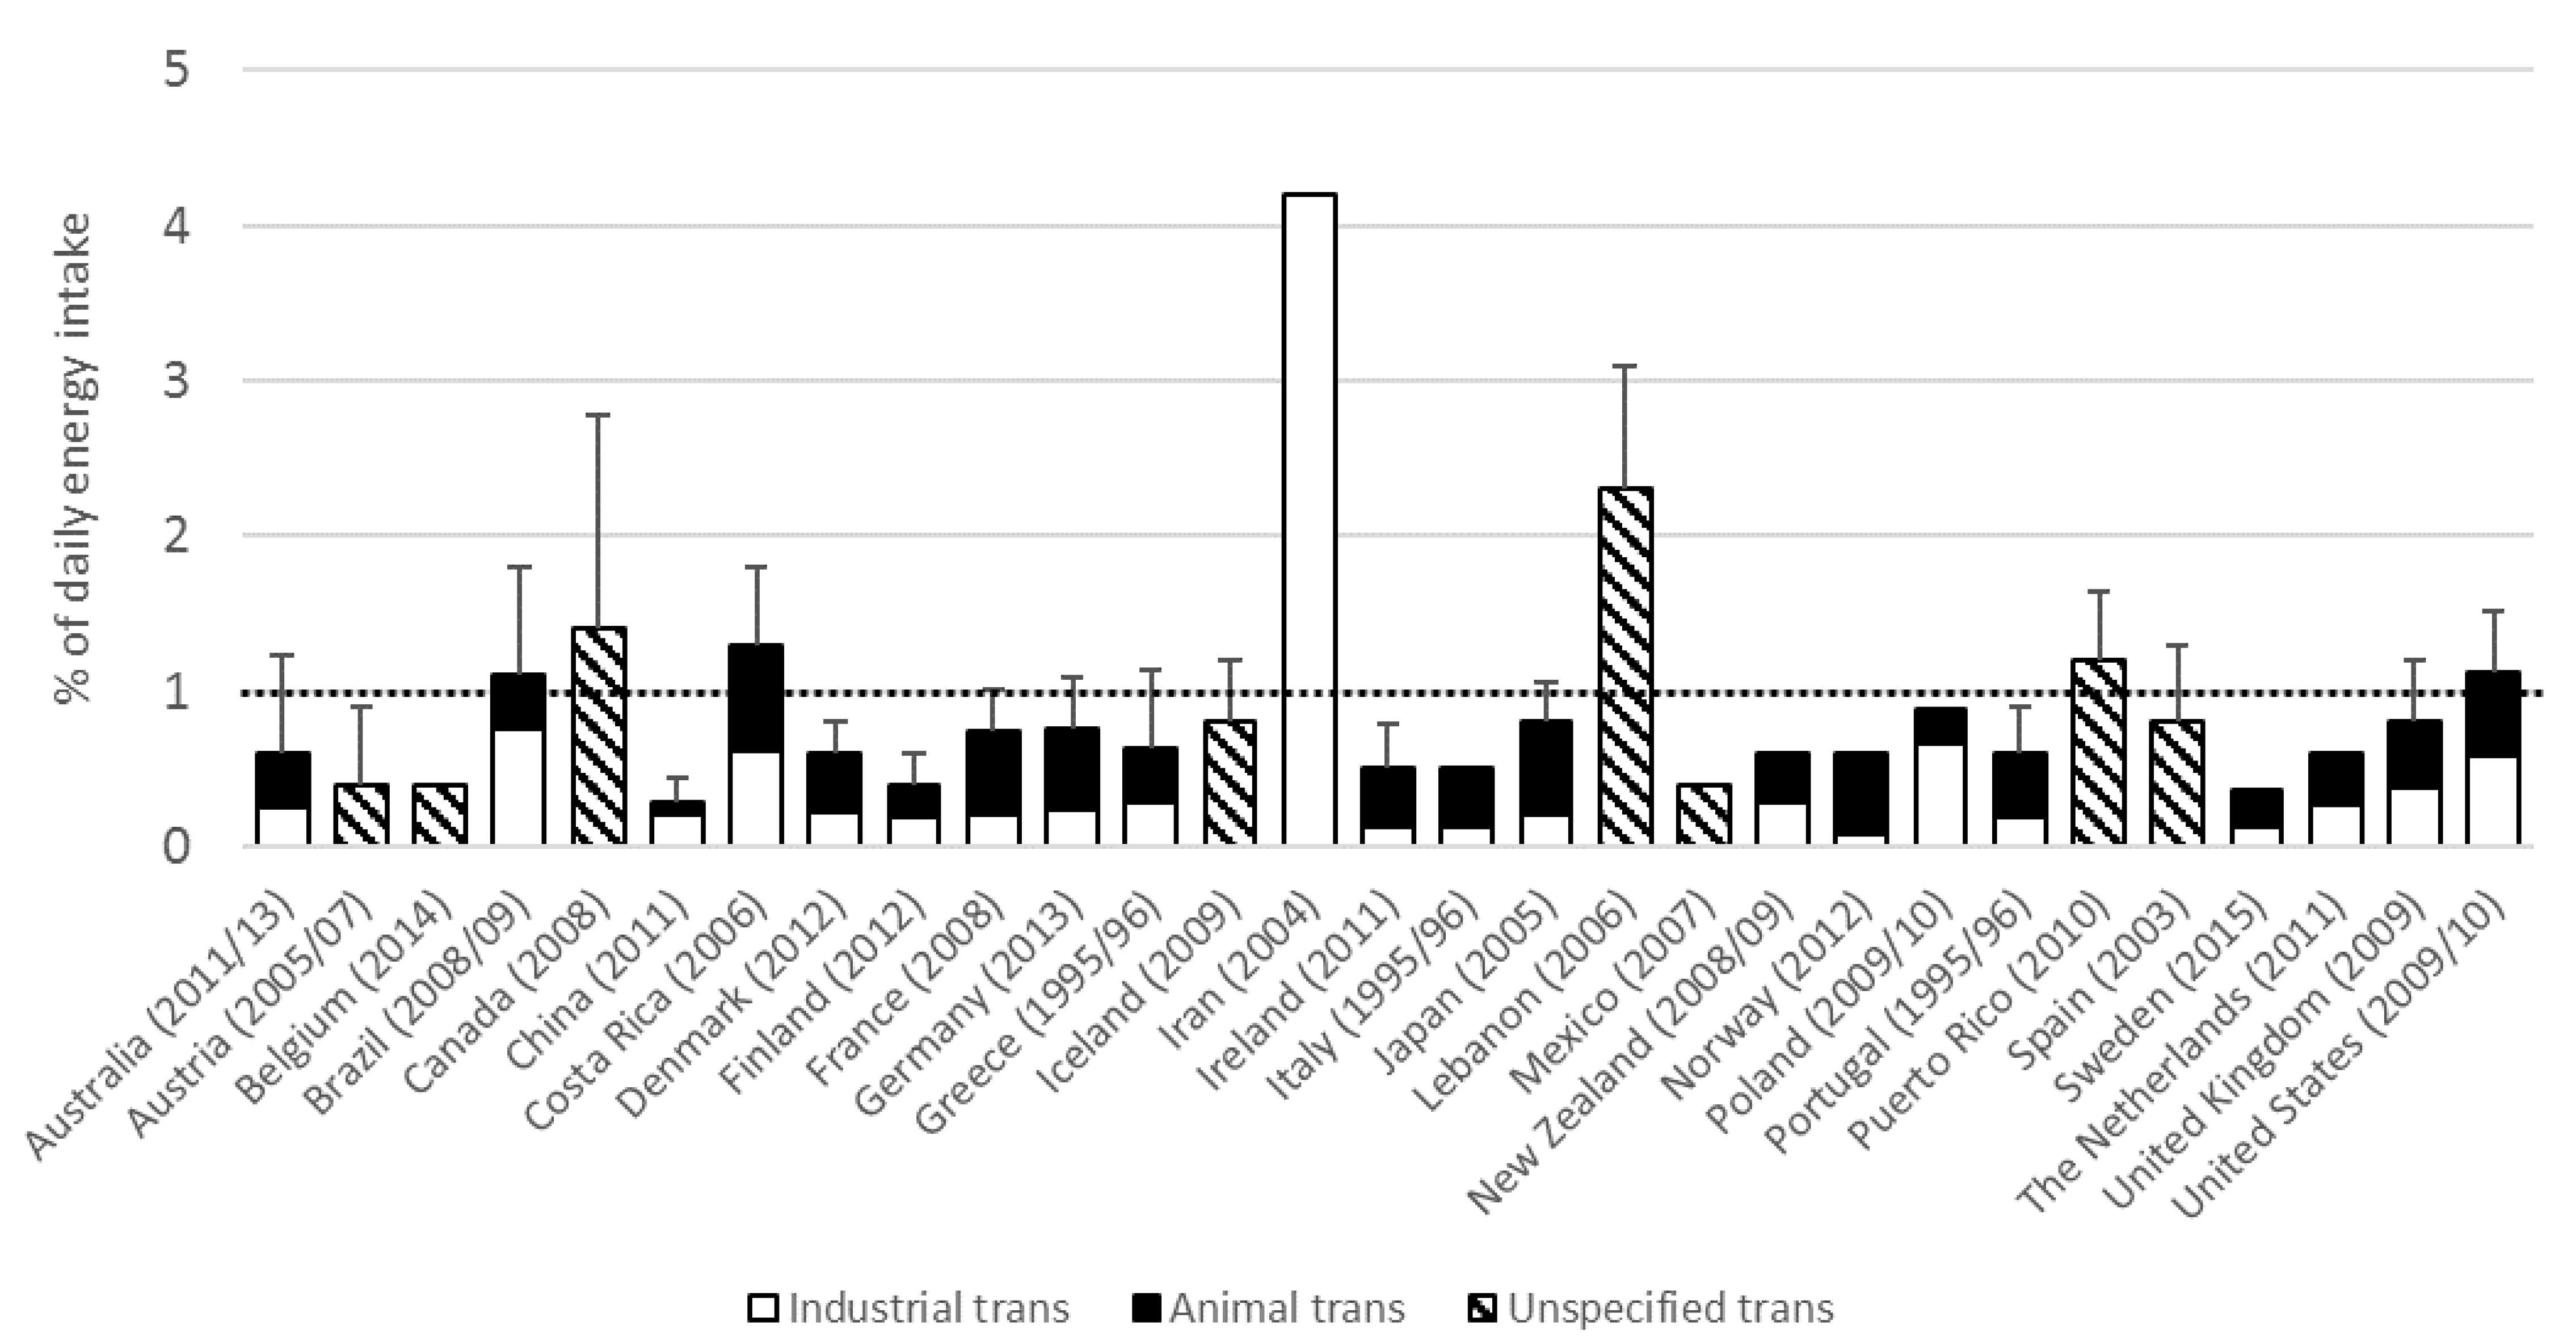
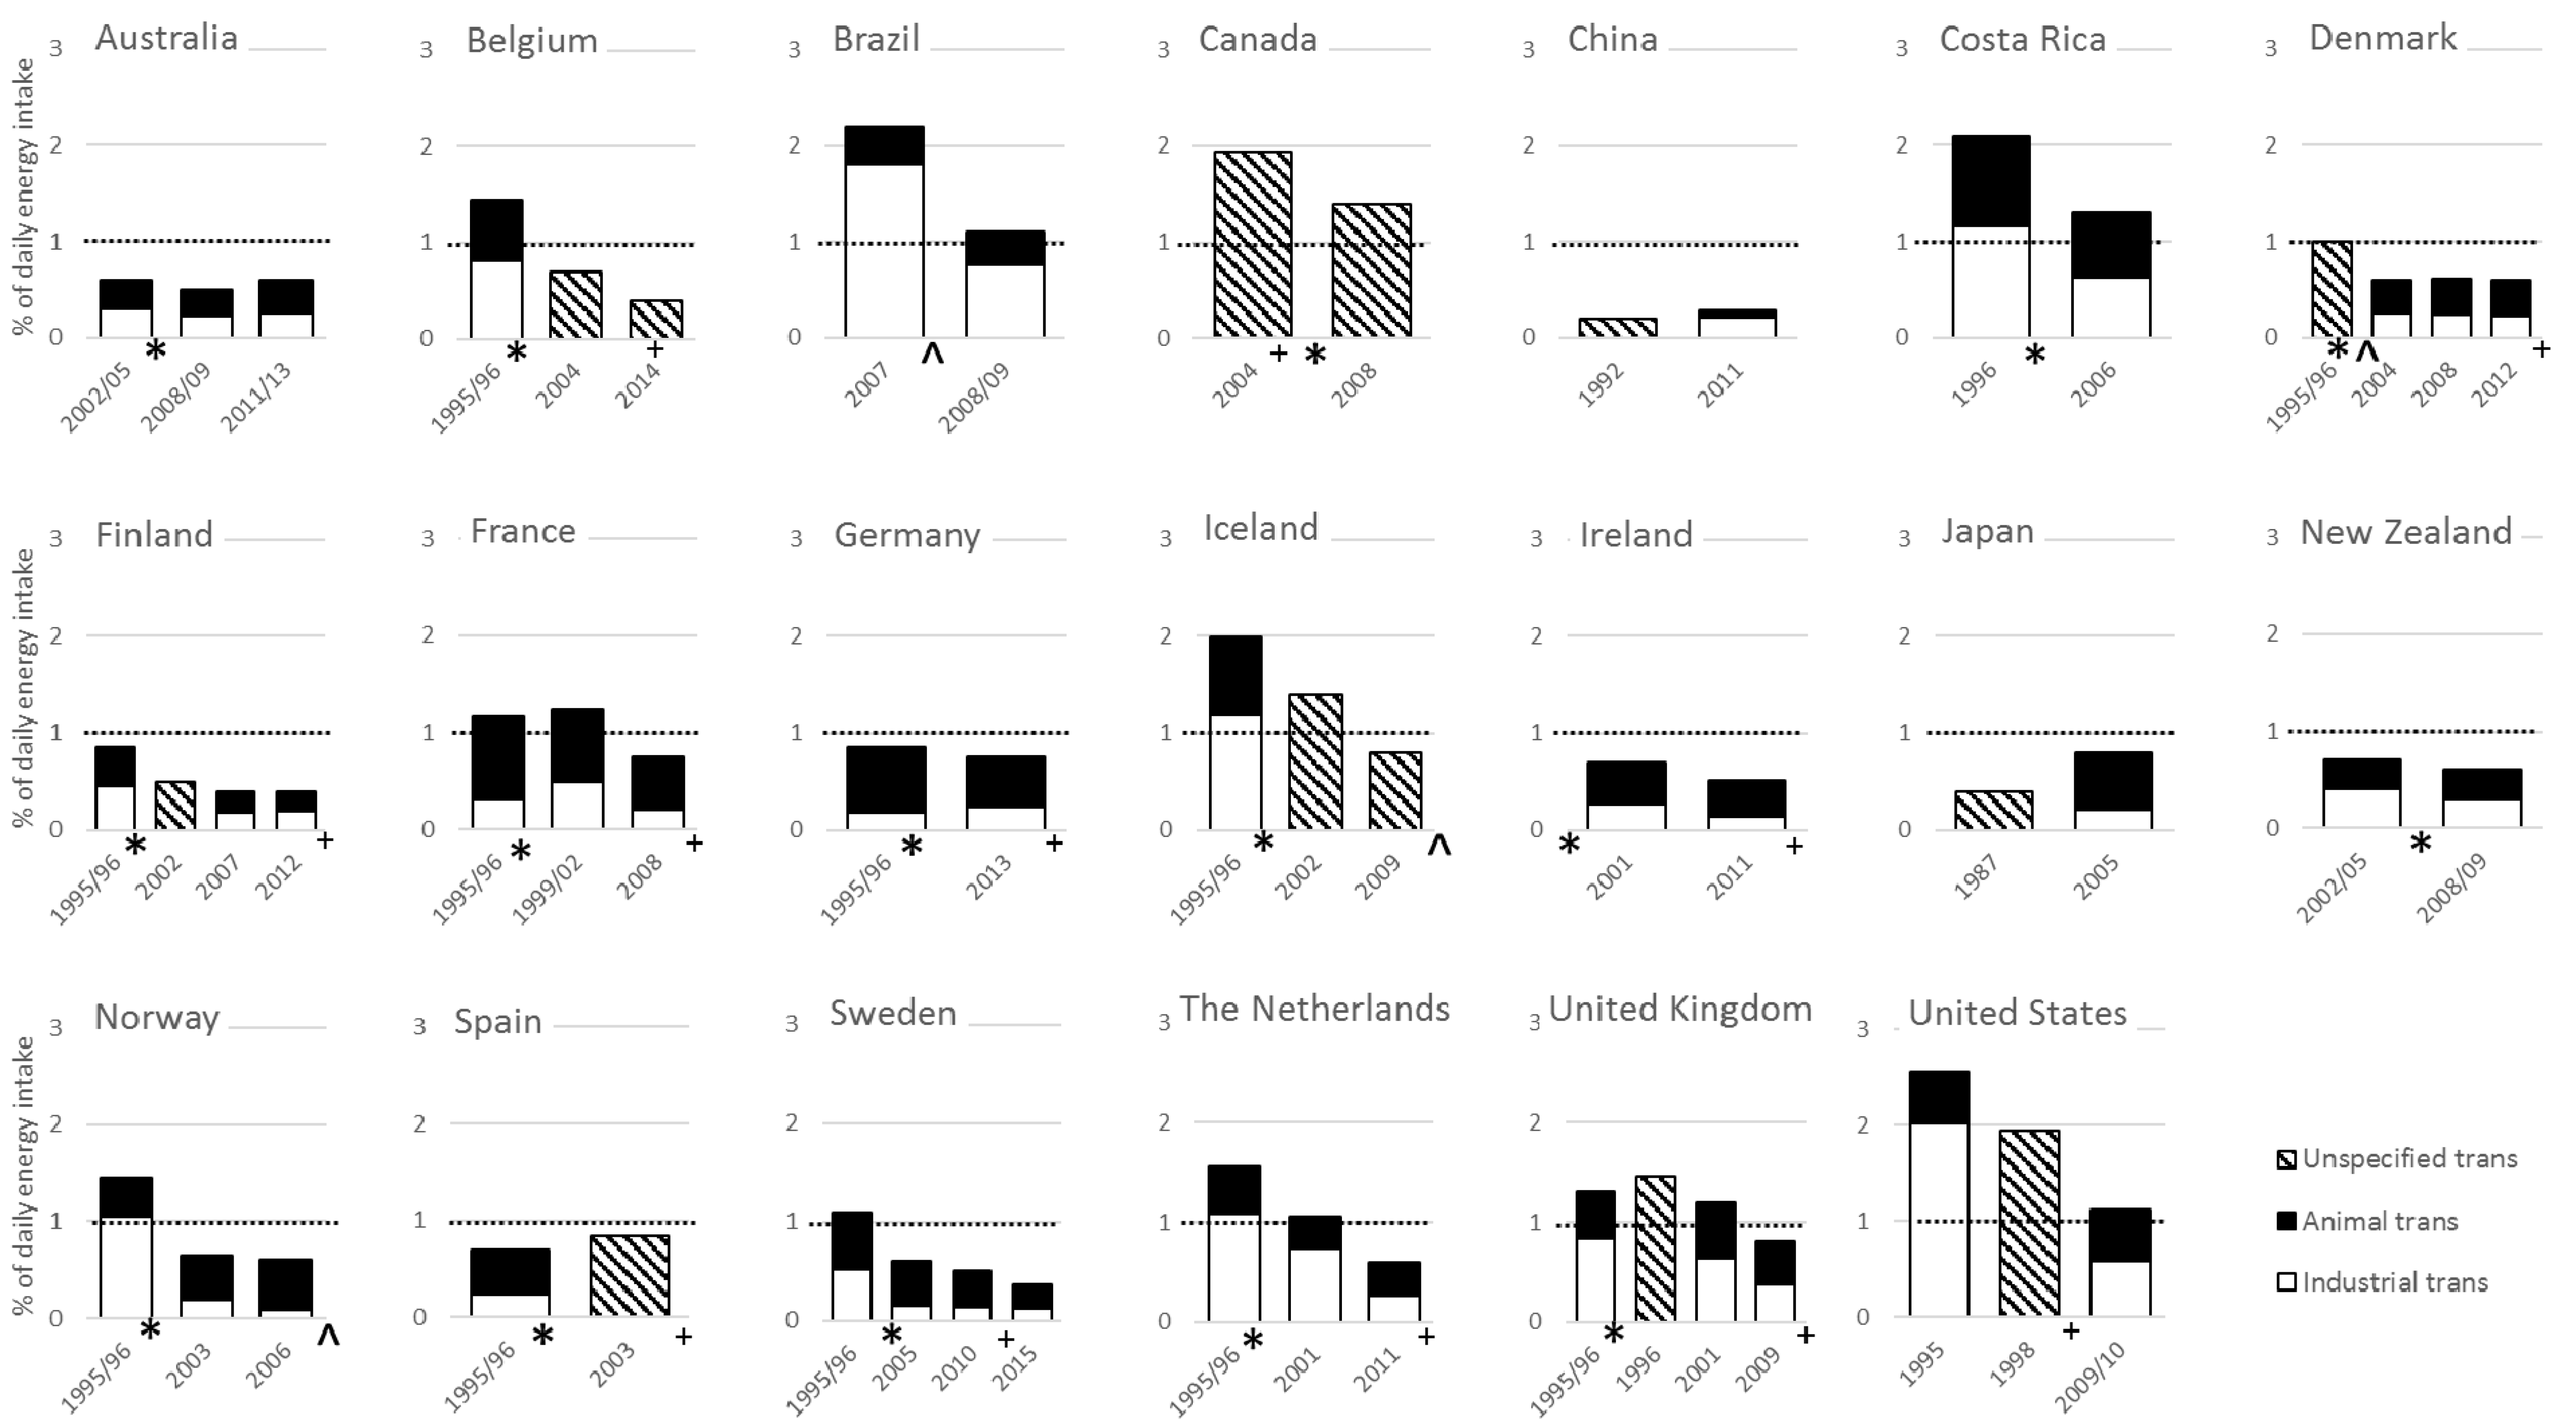
3. Results
4. Discussion
5. Conclusions
Supplementary Materials
Acknowledgments
Author Contributions
Conflicts of Interest
References
- Ascherio, A.; Katan, M.B.; Zock, P.L.; Stampfer, M.J.; Willett, W.C. Trans fatty acids and coronary heart disease. N. Engl. J. Med. 1999, 340, 1994–1998. [Google Scholar] [CrossRef] [PubMed]
- Mensink, R.P.; Katan, M.B. Effect of dietary trans fatty acids on high-density and low-density lipoprotein cholesterol levels in healthy subjects. N. Engl. J. Med. 1990, 323, 439–445. [Google Scholar] [CrossRef] [PubMed]
- Willett, W.C.; Stampfer, M.J.; Manson, J.E.; Colditz, G.A.; Speizer, F.E.; Rosner, B.A.; Sampson, L.A.; Hennekens, C.H. Intake of trans fatty acids and risk of coronary heart disease among women. Lancet 1993, 341, 581–585. [Google Scholar] [CrossRef]
- Mozaffarian, D.; Katan, M.B.; Ascherio, A.; Stampfer, M.J.; Willett, W.C. Trans fatty acids and cardiovascular disease. N. Engl. J. Med. 2006, 354, 1601–1613. [Google Scholar] [CrossRef] [PubMed]
- De Souza, R.J.; Mente, A.; Maroleanu, A.; Cozma, A.I.; Ha, V.; Kishibe, T.; Uleryk, E.; Budylowski, P.; Schünemann, H.; Beyene, J.; et al. Intake of saturated and trans unsaturated fatty acids and risk of all cause mortality, cardiovascular disease, and type 2 diabetes: Systematic review and meta-analysis of observational studies. BMJ 2015, 351, h3978. [Google Scholar] [CrossRef] [PubMed]
- Food and Agriculture Organization (FAO)/World Health Organisation (WHO). Fats and Fatty Acids in Human Nutrition; Report of an Expert Consultation; WHO Press: Geneva, Switzerland, 2010. [Google Scholar]
- Downs, S.M.; Thow, A.M.; Leeder, S.R. The effectiveness of policies for reducing dietary trans fat: A Systematic review of the evidence. Bull. World Health Organ. 2013, 91, 262–269. [Google Scholar] [CrossRef] [PubMed]
- World Health Organisation. Eliminating Trans Fats in Europe: A Policy Brief; WHO Regional Office for Europe: Copenhagen, Denmark, 2015. [Google Scholar]
- Craig-Schmidt, M.C. World-wide consumption of trans fatty acids. Atheroscler. Suppl. 2006, 7, 1–4. [Google Scholar] [CrossRef] [PubMed]
- Micha, R.; Khatibzadeh, S.; Shi, P.; Fahimi, S.; Lim, S.; Andrews, K.G.; Engell, R.E.; Powles, J.; Ezzati, M.; Mozaffarian, D.; et al. Global, regional, and national consumption levels of dietary fats and oils in 1990 and 2010: A systematic analysis including 266 country-specific nutrition surveys. BMJ 2014, 348, g2272. [Google Scholar] [CrossRef] [PubMed]
- Mouratidou, T.; Livaniou, A.; Saborido, C.M.; Wollgast, J.; Caldeira, S. Trans Fatty Acids in Europe: Where do We Stand? A synthesis of the evidence: 2003–2013, in JRC Science and Policy Reports; European Commission Joint Research Centre: Luxembourg, 2014. [Google Scholar]
- Precht, D.; Molkentin, J. Trans fatty acids: Implications for health, analytical methods, incidence in edible fats and intake (a review). Nahrung 1995, 39, 343–374. [Google Scholar] [CrossRef] [PubMed]
- Hulshof, K.F.; van Erp-Baart, M.A.; Anttolainen, M.; Becker, W.; Church, S.M.; Couet, C.; Hermann-Kunz, E.; Kesteloot, H.; Leth, T.; Martins, I.; et al. Intake of fatty acids in Western Europe with emphasis on trans fatty acids: The TRANSFAIR study. Eur. J. Clin. Nutr. 1999, 53, 143–157. [Google Scholar] [CrossRef]
- Martin-Saborido, C.; Mouratidou, T.; Livaniou, A.; Caldeira, S.; Wollgast, J. Public health economic evaluation of different European Union-level policy options aimed at reducing population dietary trans fat intake. Am. J. Clin. Nutr. 2016, 104, 1218–1226. [Google Scholar] [CrossRef] [PubMed]
- Tentative Determination Regarding Partially Hydrogenated Oils; Request for Comments and for Scientific Data and Information. Available online: https://www.federalregister.gov/documents/2013/11/08/2013-26854/tentative-determination-regarding-partially-hydrogenated-oils-request-for-comments-and-for (accessed on 5 August 2017).
- Stender, S.; Astrup, A.; Dyerberg, J. Tracing artificial trans fat in popular foods in Europe: A market basket investigation. BMJ Open 2014, 4, e005218. [Google Scholar] [CrossRef] [PubMed]
- Harika, R.K.; Eilander, A.; Alssema, M.; Osendarp, S.J.; Zock, P.L. Intake of fatty acids in general populations worldwide does not meet dietary recommendations to prevent coronary heart disease: A systematic review of data from 40 countries. Ann. Nutr. Metab. 2013, 63, 229–238. [Google Scholar] [CrossRef] [PubMed]
- Harika, R.K.; Cosgrove, M.C.; Osendarp, S.J.; Verhoef, P.; Zock, P.L. Fatty acid intakes of children and adolescents are not in line with the dietary intake recommendations for future cardiovascular health: A systematic review of dietary intake data from thirty countries. Br. J. Nutr. 2011, 106, 307–316. [Google Scholar] [CrossRef] [PubMed]
- Monge-Rojas, R.; Aragon, M.C.; Chinnock, A.; Campos, H.; Colón-Ramos, U. Changes in dietary intake and food sources of saturated and cis and trans unsaturated fatty acids in Costa Rican adolescents: 1996 versus 2006. Nutrition 2013, 29, 641–645. [Google Scholar] [CrossRef] [PubMed]
- Food Standards Australia New Zealand. Intakes of Trans Fatty Acids in the New Zealand and Australian Food Supply: Review Report, Attachment 1; FSANZ: Canberra, Australia, 2009. [Google Scholar]
- Australian Bureau of Statistics. Australian Health Survey: Nutrition First Results-Foods and Nutrients, 2011–12; Australian Bureau of Statistics: Belconnen, Australia, 2014. [Google Scholar]
- University of Vienna. Austrian Nutrition Report 2008; Institute of Nutritional Sciences: Vienna, Austria, 2009. [Google Scholar]
- Belgian Institute of Public Health. De Belgische Voedselconsumptiepeiling 1-2004; Department of Epidemiology: Brussels, Belgium, 2006. [Google Scholar]
- Lebacq, T. Vetten: Voedselconsumptiepeiling 2014–2015; Bel, S., Tafforeau, J., Eds.; Scientific Institute of Public Health: Brussels, Belgium, 2016. [Google Scholar]
- Castro, M.A.; Barros, R.R.; Bueno, M.B.; César, C.L.; Fisberg, R.M. Trans fatty acid intake among the population of the city of Sao Paulo, Brazil. Rev. Saude Publica 2009, 43, 991–997. [Google Scholar] [CrossRef] [PubMed]
- Pereira, R.A.; Duffey, K.J.; Sichieri, R.; Popkin, B.M. Sources of excessive saturated fat, trans fat and sugar consumption in Brazil: An analysis of the first Brazilian nationwide individual dietary survey. Public Health Nutr. 2014, 17, 113–121. [Google Scholar] [CrossRef] [PubMed]
- Souza, R.A.; Yokoo, E.M.; Sichieri, R.; Pereira, R.A. Energy and macronutrient intakes in Brazil: Results of the first nationwide individual dietary survey. Public Health Nutr. 2015, 18, 3086–3095. [Google Scholar] [CrossRef] [PubMed]
- Ratnayake, W.M.; L’Abbe, M.R.; Farnworth, S.; Dumais, L.; Gagnon, C.; Lampi, B.; Casey, V.; Mohottalage, D.; Rondeau, I.; Underhill, L.; et al. Trans fatty acids: Current contents in Canadian foods and estimated intake levels for the Canadian population. J. AOAC Int. 2009, 92, 1258–1276. [Google Scholar] [PubMed]
- Zhou, B.F.; Stamler, J.; Dennis, B.; Moag-Stahlberg, A.; Okuda, N.; Robertson, C.; Zhao, L.; Chan, Q.; Elliott, P.; INTERMAP Research Group. Nutrient intakes of middle-aged men and women in China, Japan, United Kingdom, and United States in the late 1990s: The INTERMAP study. J. Hum. Hypertens. 2003, 17, 623–630. [Google Scholar] [PubMed]
- Liu, A.D.; Li, J.W.; Liu, Z.P.; Zhou, P.P.; Mao, W.F.; Li, N.; Zhang, L. Trans Fatty Acid Levels in Foods and Intakes among Population Aged 3 Years and above in Beijing and Guangzhou Cities, China. Biomed. Environ. Sci. 2015, 28, 477–485. [Google Scholar] [PubMed]
- Danmarks Fodevareforskning. Dietary Habits in Denmark 2000–2002: Main Results; Department of Nutrition: Soborg, Denmark, 2005. [Google Scholar]
- DTU Fodevareinstituttet. Dietary Habits in Denmark 2003–2008: Main Results; Department of Nutrition: Soborg, Denmark, 2010. [Google Scholar]
- DTU Fodevareinstituttet. Dietary Habits in Denmark 2011–2013: Main Results; Department of Nutrition: Soborg, Denmark, 2015. [Google Scholar]
- Mannisto, S.; Ovaskainen, M.; Valsta, L. The National FINDIET 2002 Survey; National Public Health Institute: Helsinki, Finland, 2003. [Google Scholar]
- Paturi, M.; Tapanainen, H.; Reinivuo, H.; Pietinen, P. The National FINDIET 2007 Survey; KTL National Public Health Institute: Helsinki, Finland, 2008. [Google Scholar]
- Helldan, A.; Raulio, S.; Kosola, M.; Tapanainen, H.; Ovaskainen, M.L.; Smith, S. The National FINDIET 2012 Survey; National Institute for Health and Welfare: Tampere, Finland, 2013. [Google Scholar]
- Laloux, L.; du Chaffaut, L.; Razanamahefa, L.; Lafay, L. Trans fatty acid content of foods and intake levels in France. Eur. J. Lipid Sci. Technol. 2007, 109, 918–929. [Google Scholar] [CrossRef]
- Agence Francaise de Securite Sanitaire des Aliments. Avis de l’Agence Francaise de Securite Sanitaire des Aliments sur L’estimation des Apports en Acides Gras Trans de la Population Francaise; Agence Francaise de Securite Sanitaire des Aliments: Maisons-Alfort, France, 2009. [Google Scholar]
- Bundesinstitut fur Risikobewertung. Hohe der Derzeitigen Trans-Fettsaureaufnahme in Deutschland ist Gesundheidlich Unbedenklich; Bundesinstitut fur Risikobewertung: Berlin, Germany, 2013. [Google Scholar]
- Steingrimsdottir, L.; Porgeirsdottir, H.; Olafsdottir, A. The Diet of Icelanders : Dietary Survey of The Icelandic Nutrition Council 2002: Main findings; The Icelandic Nutrition Council: Reykjavik, Iceland, 2002. [Google Scholar]
- Porgeirsdottir, H.V.; Gunnarsdottir, H.; Gisladottir, I.; Gunnarsdottir, E.; Porsdottir, B.; Stefansdottir, I.; Steingrimsdottir, J.L. The Diet of Icelanders: Dietary Survey of The Icelandic Nutrition Council 2012 Main Findings; The Icelandic Nutrition Council: Reykjavik, Iceland, 2012. [Google Scholar]
- Mozaffarian, D.; Abdollahi, M.; Campos, H.; Houshiarrad, A.; Willett, W.C. Consumption of trans fats and estimated effects on coronary heart disease in Iran. Eur. J. Clin. Nutr. 2007, 61, 1004–1010. [Google Scholar] [CrossRef] [PubMed]
- Li, K.; McNulty, B.A.; Tiernery, A.M.; Devlin, N.F.; Joyce, T.; Leite, J.C.; Flynn, A.; Walton, J.; Brennan, L.; Gibney, M.J.; et al. Dietary fat intakes in Irish adults in 2011: How much has changed in 10 years? Br. J. Nutr. 2016, 115, 1798–1809. [Google Scholar] [CrossRef] [PubMed]
- Yamada, M.; Sasaki, S.; Murakami, K.; Takahashi, Y.; Okubo, H.; Hirota, N.; Notsu, A.; Todoriki, H.; Miura, A.; Fukui, M.; et al. Estimation of trans fatty acid intake in Japanese adults using 16-day diet records based on a food composition database developed for the Japanese population. J. Epidemiol. 2010, 20, 119–127. [Google Scholar] [CrossRef] [PubMed]
- Farhat, A.G.; Jaalouk, D.; Moukarzel, S.R.; Ayoub, J.J. Consumption of trans fatty acid and omega 6 to omega 3 ratio in Lebanese adults. Nutr. Food Sci. 2016, 46, 120–129. [Google Scholar] [CrossRef]
- Ramirez-Silva, I.; Villalpando, S.; Moreno-Saracho, J.E.; Bernal-Medina, D. Fatty acids intake in the Mexican population. Results of the National Nutrition Survey 2006. Nutr. Metab. 2011, 8, 33. [Google Scholar] [CrossRef] [PubMed]
- Johansson, L.; Borgejordet, A.; Pedersen, J.I. [Trans fatty acids in the Norwegian diet]. Tidsskr. Nor. Laegeforen. 2006, 126, 760–763. [Google Scholar] [PubMed]
- Norwegian Directorate of Health. Utviklingen I Norsk Kosthold 2015; Matforsyningsstatistikk og Forbruksundersokelser; Norwegian Directorate of Health: Oslo, Norway, 2015. [Google Scholar]
- Zbikowska, A.; Rutkowska, J.; Kowalska, M. Consumption Safety of Pastries, Confectioneries, and Potato Products as Related to Fat Content. J. Am. Coll. Nutr. 2015, 34, 507–514. [Google Scholar] [CrossRef] [PubMed]
- Palacios, C.; Trak, M.A.; Betancourt, J.; Joshipura, K.; Tucker, K.L. Validation and reproducibility of a semi-quantitative FFQ as a measure of dietary intake in adults from Puerto Rico. Public Health Nutr. 2015, 18, 2550–2558. [Google Scholar] [CrossRef] [PubMed]
- Mayneris-Perxachs, J.; Bondia-Pons, I.; Molto-Puigmarti, C.; Pairo, M.; Castellote, A.I.; Lopez-Sabater, M.C. Diet and plasma evaluation of the main isomers of conjugated linoleic acid and trans-fatty acids in a population sample from Mediterranean north-east Spain. Food Chem. 2010, 123, 296–305. [Google Scholar] [CrossRef]
- Becker, W.; Eriksson, A.; Haglund, M.; Wretling, S. Contents of total fat, fatty acids, starch, sugars and dietary fibre in Swedish market basket diets. Br. J. Nutr. 2015, 113, 1453–1465. [Google Scholar] [CrossRef] [PubMed]
- Darnerud, P.O.; Becker, W.; Ohrvik, V.; Kollander, B.; Sunstrom, B.; Strandler, H.S.; Nälsén, C.; von Malmborg, A.; Staffas, A.; Grönholm, R.; et al. Swedish Market Basket Survey 2015: Per capita-based analysis of nutrients and toxic compounds in market baskets and assessment of benefit or risk. In Livsmedelsverkets Rapportserie; National Food Agency: Uppsala, Sweden, 2017. [Google Scholar]
- Hulshof, K.F.A.M.; Ocke, M.C.; van Rossum, C.T.M.; Buurma-Rethans, E.J.M.; Brants, H.A.M.; Drijvers, J.J.M.M.; ter Doest, D. Resultaten van de Voedselconsumptiepeiling 2003; RIVM: Bilthoven, The Netherlands, 2004. [Google Scholar]
- Van Rossum, C.T.M.; Fransen, H.P.; Verkaik-Kloosterman, J.; Buurma-Rethans, E.J.M.; Ocké, M.C. Dutch National Food Consumption Survey 2007–2010: Supporting Tables; National Institute for Public Health and the Environment: Bilthoven, The Netherlands, 2011. [Google Scholar]
- Henderson, L.; Gregory, J.; Irving, K. The National Diet & Nutrition Survey: Adults Aged 19 to 64 Years, Vol 2. In Energy, Protein, Carbohydrate, Fat and Alcohol Intake; Office for National Statistics: London, UK, 2003. [Google Scholar]
- Pot, G.K.; Prynne, C.J.; Roberts, C.; Olson, A.; Nicholson, S.K.; Whitton, C.; Teucher, B.; Bates, B.; Henderson, H.; Pigott, S.; et al. National Diet and Nutrition Survey: Fat and fatty acid intake from the first year of the rolling programme and comparison with previous surveys. Br. J. Nutr. 2012, 107, 405–415. [Google Scholar] [CrossRef] [PubMed]
- Food and Drug Administration. Food Labeling: Trans Fatty Acids in Nutrition Labeling, Nutrient Content Claims, and Health Claims; Food and Drug Administration: College Park, MD, USA, 2003. [Google Scholar]
- Allison, D.B.; Egan, S.K.; Barraj, L.M.; Caughman, C.; Infante, M.; Heimbach, J.T. Estimated intakes of trans fatty and other fatty acids in the US population. J. Am. Diet. Assoc. 1999, 99, 166–174. [Google Scholar] [CrossRef]
- Doell, D.; Folmer, D.; Lee, H.; Honigfort, M.; Carberry, S. Updated estimate of trans fat intake by the US population. Food Addit. Contam. 2012, 29, 861–874. [Google Scholar] [CrossRef] [PubMed]
- Amcoff, E.; Edberg, A.; Barbieri, H.E.; Lindroos, A.K.; Nälsén, C.; Lemming, E.W. Riksmaten-Vuxna 2010–11: Livsmedels-Och Naringsintag Bland Vuxna I Sverige; Livsmedelsverket: Uppsala, Sweden, 2012. [Google Scholar]
- Public Health England. McCance and Widdowson’s Composition of Foods Integrated Dataset (CoFID). Available online: https://www.gov.uk/government/publications/composition-of-foods-integrated-dataset-cofid (accessed on 23 May 2017).
- Colon-Ramos, U.; Monge-Rojas, R.; Campos, H. Impact of WHO recommendations to eliminate industrial trans-fatty acids from the food supply in Latin America and the Caribbean. Health Policy Plan. 2014, 29, 529–541. [Google Scholar] [CrossRef] [PubMed]
- Stender, S.; Astrup, A.; Dyerberg, J. Artificial trans fat in popular foods in 2012 and in 2014: A market basket investigation in six European countries. BMJ Open 2016, 6, e010673. [Google Scholar] [CrossRef] [PubMed]
- Eckel, R.H.; Borra, S.; Lichtenstein, A.H.; Yin-Piazza, S.Y.; Trans Fat Conference Planning Group. Understanding the complexity of trans fatty acid reduction in the American diet: American Heart Association Trans Fat Conference 2006: Report of the Trans Fat Conference Planning Group. Circulation 2007, 115, 2231–2246. [Google Scholar] [PubMed]
- Stender, S.; Astrup, A.; Dyerberg, J. What went in when trans went out? N. Engl. J. Med. 2009, 361, 314–316. [Google Scholar] [CrossRef] [PubMed]
- Mozaffarian, D.; Jacobson, M.F.; Greenstein, J.S. Food reformulations to reduce trans fatty acids. N. Engl. J. Med. 2010, 362, 2037–2039. [Google Scholar] [CrossRef] [PubMed]
- Ratnayake, W.M.; L’Abbe, M.R.; Mozaffarian, D. Nationwide product reformulations to reduce trans fatty acids in Canada: When trans fat goes out, what goes in? Eur. J. Clin. Nutr. 2009, 63, 808–811. [Google Scholar] [CrossRef] [PubMed]
- Brouwer, I.A.; Wanders, A.J.; Katan, M.B. Trans fatty acids and cardiovascular health: Research completed? Eur. J. Clin. Nutr. 2013, 67, 541–547. [Google Scholar] [CrossRef] [PubMed]
- Gebauer, S.K.; Destaillats, F.; Dionisi, F.; Krauss, R.M.; Baer, D.J. Vaccenic acid and trans fatty acid isomers from partially hydrogenated oil both adversely affect LDL cholesterol: A double-blind, randomized controlled trial. Am. J. Clin. Nutr. 2015, 102, 1339–1346. [Google Scholar] [CrossRef] [PubMed]
- Willett, W.; Mozaffarian, D. Ruminant or industrial sources of trans fatty acids: Public health issue or food label skirmish? Am. J. Clin. Nutr. 2008, 87, 515–516. [Google Scholar] [PubMed]
- Kromhout, D.; Spaaij, C.J.; de Goede, J.; Weggemans, R.M. The 2015 Dutch food-based dietary guidelines. Eur. J. Clin. Nutr. 2016, 70, 869–878. [Google Scholar] [CrossRef] [PubMed]
- U.S. Department of Health and Human Services and U.S. Department of Agriculture. 2015–2020 Dietary Guidelines for Americans, 8th ed. Available online: http://health.gov/dietaryguidelines/2015/guidelines/ (accessed on 23 May 2017).
- Nordic Council of Ministers. Nordic Nutrition Recommendations 2012-Part 2; Integrating Nutrition and Physical Activity: Copenhagen, Denmark, 2014. [Google Scholar]
- Minguez-Alarcon, L.; Chavarro, J.E.; Mendiola, J.; Roca, M.; Tanrikut, C.; Vioque, J.; Jørgensen, N.; Torres-Cantero, A.M. Fatty acid intake in relation to reproductive hormones and testicular volume among young healthy men. Asian J. Androl. 2017, 19, 184–190. [Google Scholar] [CrossRef] [PubMed]
- Wise, L.A.; Wesselink, A.K.; Tucker, K.L.; Saklani, S.; Mikkelsen, E.M.; Cueto, H.; Riis, A.H.; Trolle, E.; McKinnon, C.J.; Hahn, K.A.; et al. Dietary fat intake and fecundability in two preconception cohort studies. Am. J. Epidemiol. 2017. [Google Scholar] [CrossRef] [PubMed]


| Country [Reference] | Survey Type | Survey Method | Survey Year | Food Composition Data Type | Year Food Composition Data | Age | Sample Size | Mean Trans Fat Intake | Mean Trans Fat Intake | SD Trans Fat Intake | 95th p Trans Fat Intake | Animal Trans | Industrial Trans | Study Quality # | Trans Fat Lowering Measures (Year) |
|---|---|---|---|---|---|---|---|---|---|---|---|---|---|---|---|
| Year | Number | g/day | En% | En% | En% | % | % | ||||||||
| Australia [20] | National | 24hr recall | 1995 | Market basket | 2002/2005 | 17+ | ~11,000 | 1.5 | 0.6 | 1.2 | 51 | 49 | Medium | Voluntary reduction (2007) | |
| Australia [20] | National | 24hr recall | 1995 | Market basket | 2008/2009 | 17+ | ~11,000 | 1.3 | 0.5 | 1.1 | 55 | 45 | Medium | ||
| Australia [21] | National | 24hr recall | 2011/12 | Food database | 2011/2013 | 19+ | ~9000 | 1.4 | 0.6 | 0.6 | 58 | 42 | Medium | ||
| Austria [22] | Local | 24hr recall | - | Market basket | 2005/2007 | 14–36 | 2989 | 1.0 | 0.4 | 0.5 | 1.4 | Medium | Mandatory limit (2009) 6 | ||
| Belgium [13] | Local | 3 d record | 1991/92 | Market basket | 1995/1996 | 18–65 | 492 | 4.1 | 1.4 | 0.5 | 2.1 3 | 44 | 57 | Medium | |
| Belgium [23] | National | 2 × 24hr recall | 2004 | Food database | 2004 | 15–64 | 3252 | 1.9 | 0.7 | 1.3 | Medium | 6 | |||
| Belgium [24] | National | 2 × 24hr recall | 2014/15 | Food database | 2014 | 15–64 | 3138 | 0.9 | 0.4 | 0.6 | Medium | ||||
| Brazil [25] | Local | 24hr recall | 2003 | Food database 2 | 2007 | 20–59 | 713 | 4.5 | 2.2 | 2.7 | 18 | 82 | Low | Mandatory limit (2007) | |
| Brazil [26,27] | National | 2 d record | 2008/09 | Food database | 2008/2009 | 10+ | 32,749 | 2.4 | 1.1 | 0.7 | 31 | 69 | Medium | ||
| Canada [28] | National | 24hr recall | 2004 | Food database | 2004 | 19+ | 19,053 | 4.7 | 1.9 | 2.8 | Medium | Mandatory labeling (2005), voluntary reduction (2007) | |||
| Canada [28] | National | 24hr recall | 2004 | Market basket | 2008 | 19+ | 19,053 | 3.4 | 1.4 | 1.4 | Medium | ||||
| China [29] | Local | 4 × 24hr recall | 1997/99 | Food database | 1992 | 40–59 | 839 | 0.5 | 0.2 | 0.4 | Low | ||||
| China [30] | Local | 3 × 24hr recall | 2011 | Market basket | 2011 | >18 | 4424 | 0.6 | 0.3 | 0.2 | 0.6 | 27 | 73 | Medium | |
| Costa Rica [19] | Local | 3 d record | 1996 | Food database | 1996 | 12–17 | 275 | 4.5 | 2.1 | 0.9 | 45 | 55 | Medium | Voluntary reduction (1996) | |
| Costa Rica [19] | Local | 3 d record | 2006 | Food database | 2006 | 12–17 | 133 | 2.8 | 1.3 | 0.5 | 52 | 48 | Medium | ||
| Denmark [13] | National | 7 d record | 1995 | Market basket | 1995/1996 | 1–80 | 3000 | 2.6 | 1.0 | 0.5 | 1.5 3 | High | Mandatory limit (2003) 6 | ||
| Denmark [31] | National | 7 d record | 2000/02 | Food database | 2004 | 18–75 | 3151 | 1.5 | 0.6 | 0.2 | 0.8 3 | 56 | 43 | High | |
| Denmark [32] | National | 7 d record | 2003/08 | Food database | 2008 | 18–75 | 3354 | 1.4 | 0.6 | 0.2 | 0.8 3 | 61 | 41 | High | |
| Denmark [33] | National | 7 d record | 2011/13 | Food database | 2012 | 18–75 | 3016 | 1.5 | 0.6 | 0.2 | 0.8 3 | 62 | 38 | High | |
| Finland [13] | National | 3 d record | 1992 | Market basket | 1995/1996 | 25–64 | 1861 | 2.1 | 0.9 | 0.3 | 1.2 3 | 46 | 53 | High | 6 |
| Finland [34] | National | 48hr recall | 2002 | Food database | 2002 | 25–64 | 2007 | 1.0 | 0.5 | 0.2 | Medium | ||||
| Finland [35] | National | 48hr recall | 2007 | Food database | 2007 | 25–64 | 1576 | 0.8 | 0.4 | 0.2 | 55 | 45 | Medium | ||
| Finland [36] | National | 48hr recall | 2012 | Food database | 2012 | 25–64 | 1295 | 1.0 | 0.4 | 0.2 | 53 | 47 | Medium | ||
| France [13] | National | 7 d record | 1993/94 | Market basket | 1995/1996 | 15–65 | 1500 | 2.3 | 1.2 | 0.3 | 1.6 3 | 75 | 26 | High | 6 |
| France [37] | National | 7 d record | 1998/99 | Market basket | 1999/2002 | 15+ | 1985 | 3.0 | 1.2 | 0.4 | 2.0 | 60 | 40 | High | |
| France [38] | National | 7 d record | 2006/07 | Food database | 2008 | 18–79 | 1918 | 1.8 | 0.8 | 0.3 | 1.2 | 72 | 28 | High | |
| Germany [13] | Local | diet history | 1991 | Market basket | 1995/1996 | 18–80 | 1897 | 2.1 | 0.9 | 0.2 | 1.1 3 | 79 | 21 | Medium | Voluntary reduction (2012) 6 |
| Germany [39] | National | 4 w diet history | 2005/06 | Food database | 2013 | 14–80 | 15,371 | 1.9 | 0.8 | 0.3 | 1.3 | 70 | 30 | Medium | |
| Greece [13] | Local | 24hr recall | 1995 | Market basket | 1995/1996 | 23–64 | 248 | 1.4 | 0.6 | 0.5 | 1.2 3 | 55 | 46 | Low | 6 |
| Iceland [13] | National | diet history | 1990 | Market basket | 1995/1996 | 15–80 | 1240 | 5.4 | 2.0 | 0.6 | 2.7 3 | 40 | 60 | High | Mandatory limit (2011) |
| Iceland [40] | National | 24hr recall | 2002 | Food database | 2002 | 15–80 | 1242 | 3.5 | 1.4 | 0.9 | Medium | ||||
| Iceland [41] | National | 2 × 24hr recall | 2010/11 | Food database | 2009 | 18–80 | 1312 | 1.8 | 0.8 | 0.4 | Medium | ||||
| Iran [42] | National | 3 × hh 24hr recall | 2001/03 | Market basket | 2004 | all | 35,924 | 12.3 | 4.2 | - 1 | 100 | Medium | Mandatory limit (2004) | ||
| Ireland [43] | National | 4 d record | 1997/99 | Food database | 2001 | 18–64 | 1097 | 1.9 | 0.7 | 0.3 | 62 | 38 | High | 6 | |
| Ireland [43] | National | 4 d semi-w record | 2008/10 | Food database | 2011 | 18–64 | 889 | 1.3 | 0.5 | 0.3 | 74 | 26 | Medium | ||
| Italy [13] | National | 7 d hh record | 1980/84 | Market basket | 1995/1996 | 1–80 | 10,000 | 1.6 | 0.5 | 76 | 24 | Medium | 6 | ||
| Japan [29] | Local | 4 × 24hr recall | 1997/99 | Food database | 1987 | 40–59 | 1145 | 0.9 | 0.4 | 0.3 | Medium | ||||
| Japan [44] | Local | 16 d semi-w record | 2002/03 | Food database | 2005 | 30–69 | 225 | 1.7 | 0.8 | 0.3 | 1.9 4 | 74 | 26 | Medium | |
| Lebanon [45] | Local | FFQ | 2009/11 | Food database 2 | 2006 | 19–70 | 657 | 6.1 | 2.3 | 0.8 | Low | ||||
| Mexico [46] | National | FFQ | 2006 | Food database | 2007 | 20–60 | 16,366 | 0.5 | 0.4 | 0.5 | Medium | ||||
| New Zealand [20] | National | 24hr recall | 1997 | Market basket | 2002/2005 | 15+ | 4636 | 1.9 | 0.7 | 1.3 | 43 | 57 | Medium | Voluntary reduction (2007) | |
| New Zealand [20] | National | 24hr recall | 1997 | Market basket | 2008/2009 | 15+ | 4636 | 1.6 | 0.6 | 1.2 | 52 | 48 | Medium | ||
| Norway [13] | National | FFQ | 1993/94 | Market basket | 1995/1996 | 16–79 | 3144 | 4.0 6 | 1.4 | 0.5 | 2.2 3 | 28 | 72 | Medium | Mandatory limit (2014) |
| Norway [47] | National | FFQ | 1997 | Food database | 2003 | 16–79 | 2672 | 1.6 | 0.6 | 71 | 29 | Medium | |||
| Norway [48] | National | hh record | 2012 | Food database | 2006 | All | 4125 hh | 1.6 | 0.6 | 87 | 13 | Low | |||
| Poland [49] | National | 1 m hh record | 2009/10 | Market basket | 2009/2010 | all | N/A | 2.0 | 0.9 | 25 | 75 | Medium | 6 | ||
| Portugal [13] | National | 24hr recall | 1988/89 | Market basket | 1995/1996 | 38 | 78 men | 1.6 | 0.6 | 0.3 | 1.1 3 | 69 | 31 | Medium | |
| Puerto Rico [50] | Local | 6 d record | 2012 | Food database | 2010 | 21+ | 92 | 2.5 | 1.2 | 0.4 | Medium | Mandatory limit (2007) | |||
| Spain [13] | National | 7 d hh record | 1991 | Market basket | 1995/1996 | 0–70 | 21,555 | 2.1 | 0.7 | 64 | 35 | Medium | 6 | ||
| Spain [51] | Local | FFQ | 2000 | Food database | 2003 | 18–77 | 516 | 1.9 | 0.8 | 0.5 | Low | ||||
| Sweden [13] | National | 7 d record | 1989 | Market basket | 1995/1996 | 1–74 | 3000 | 2.6 | 1.1 | 0.5 | 1.6 3 | 53 | 47 | High | 6 |
| Sweden [52] | National | Product/trade data | 2003 | Market basket | 2005 | all | N/A | 1.9 | 0.6 | 73 | 27 | Low | |||
| Sweden [52] | National | Product/trade data | 2007 | Market basket | 2010 | all | N/A | 1.7 | 0.5 | 73 | 27 | Low | |||
| Sweden [53] | National | Product/trade data | 2013 | Market basket | 2015 | All | N/A | 1.2 | 0.4 | 64 | 36 | Low | |||
| The Netherlands [13] | National | 2 d record | 1992 | Market basket | 1995/1996 | 1–92 | 6218 | 4.3 | 1.6 | 0.7 | 2.4 3 | 29 | 70 | High | 6 |
| The Netherlands [54] | National | 2 × 24hr recall | 2003 | Food database | 2001 | 19–30 | 750 | 2.8 | 1.1 | 0.5 | 1.5 | 30 | 70 | Medium | |
| The Netherlands [55] | National | 2 × 24hr recall | 2007/10 | Food database | 2011 | 19–69 | 2106 | 1.5 | 0.6 | 0.9 | 56 | 44 | Medium | ||
| United Kingdom [13] | National | 7 d hh record | 1996 | Market basket | 1995/1996 | 0–75 | 7921 | 2.8 | 1.3 | 37 | 64 | Medium | Voluntary reduction (2011) 6 | ||
| United Kingdom [29] | Local | 4 × 24hr recall | 1997/99 | Food database | 1996 | 40–59 | 501 | 3.6 | 1.5 | 0.9 | Low | ||||
| United Kingdom [56] | National | 7 d record | 2000/01 | Food database | 2001 | 19–64 | 1724 | 2.4 | 1.2 | 0.4 | 2.1 5 | 47 | 53 | High | |
| United Kingdom [57] | National | 4 d record | 2008/09 | Food database | 2009 | 19–64 | 434 | 1.6 | 0.8 | 0.4 | 53 | 47 | Medium | ||
| USA [58,59] | National | 2 × 24hr recall | 1994/96 | Food database | 1995 | 2+ | 11,258 | 5.3 | 2.6 | 2.1 | 3.2 3 | 21 | 79 | Medium | Mandatory labeling (2006), local bans |
| USA [29] | Local | 4 × 24hr recall | 1997/99 | Food database | 1998 | 40–59 | 2195 | 4.9 | 2.0 | 0.8 | Medium | ||||
| USA [58,60] | National | 2 × 24hr recall | 2003/06 | Food database | 2009/2010 | 2+ | ~10,000 | 2.5 | 1.1 | 0.4 | 48 | 52 | Medium |
© 2017 by the authors. Licensee MDPI, Basel, Switzerland. This article is an open access article distributed under the terms and conditions of the Creative Commons Attribution (CC BY) license (http://creativecommons.org/licenses/by/4.0/).
Share and Cite
Wanders, A.J.; Zock, P.L.; Brouwer, I.A. Trans Fat Intake and Its Dietary Sources in General Populations Worldwide: A Systematic Review. Nutrients 2017, 9, 840. https://doi.org/10.3390/nu9080840
Wanders AJ, Zock PL, Brouwer IA. Trans Fat Intake and Its Dietary Sources in General Populations Worldwide: A Systematic Review. Nutrients. 2017; 9(8):840. https://doi.org/10.3390/nu9080840
Chicago/Turabian StyleWanders, Anne J., Peter L. Zock, and Ingeborg A. Brouwer. 2017. "Trans Fat Intake and Its Dietary Sources in General Populations Worldwide: A Systematic Review" Nutrients 9, no. 8: 840. https://doi.org/10.3390/nu9080840
APA StyleWanders, A. J., Zock, P. L., & Brouwer, I. A. (2017). Trans Fat Intake and Its Dietary Sources in General Populations Worldwide: A Systematic Review. Nutrients, 9(8), 840. https://doi.org/10.3390/nu9080840