
Top Sodium Food Sources in the American Diet—Using National Health and Nutrition Examination Survey


Abstract
1. Introduction
2. Materials and Methods
2.1. Analytic Sample
2.2. Food Categorization
2.3. Statistical Analyses
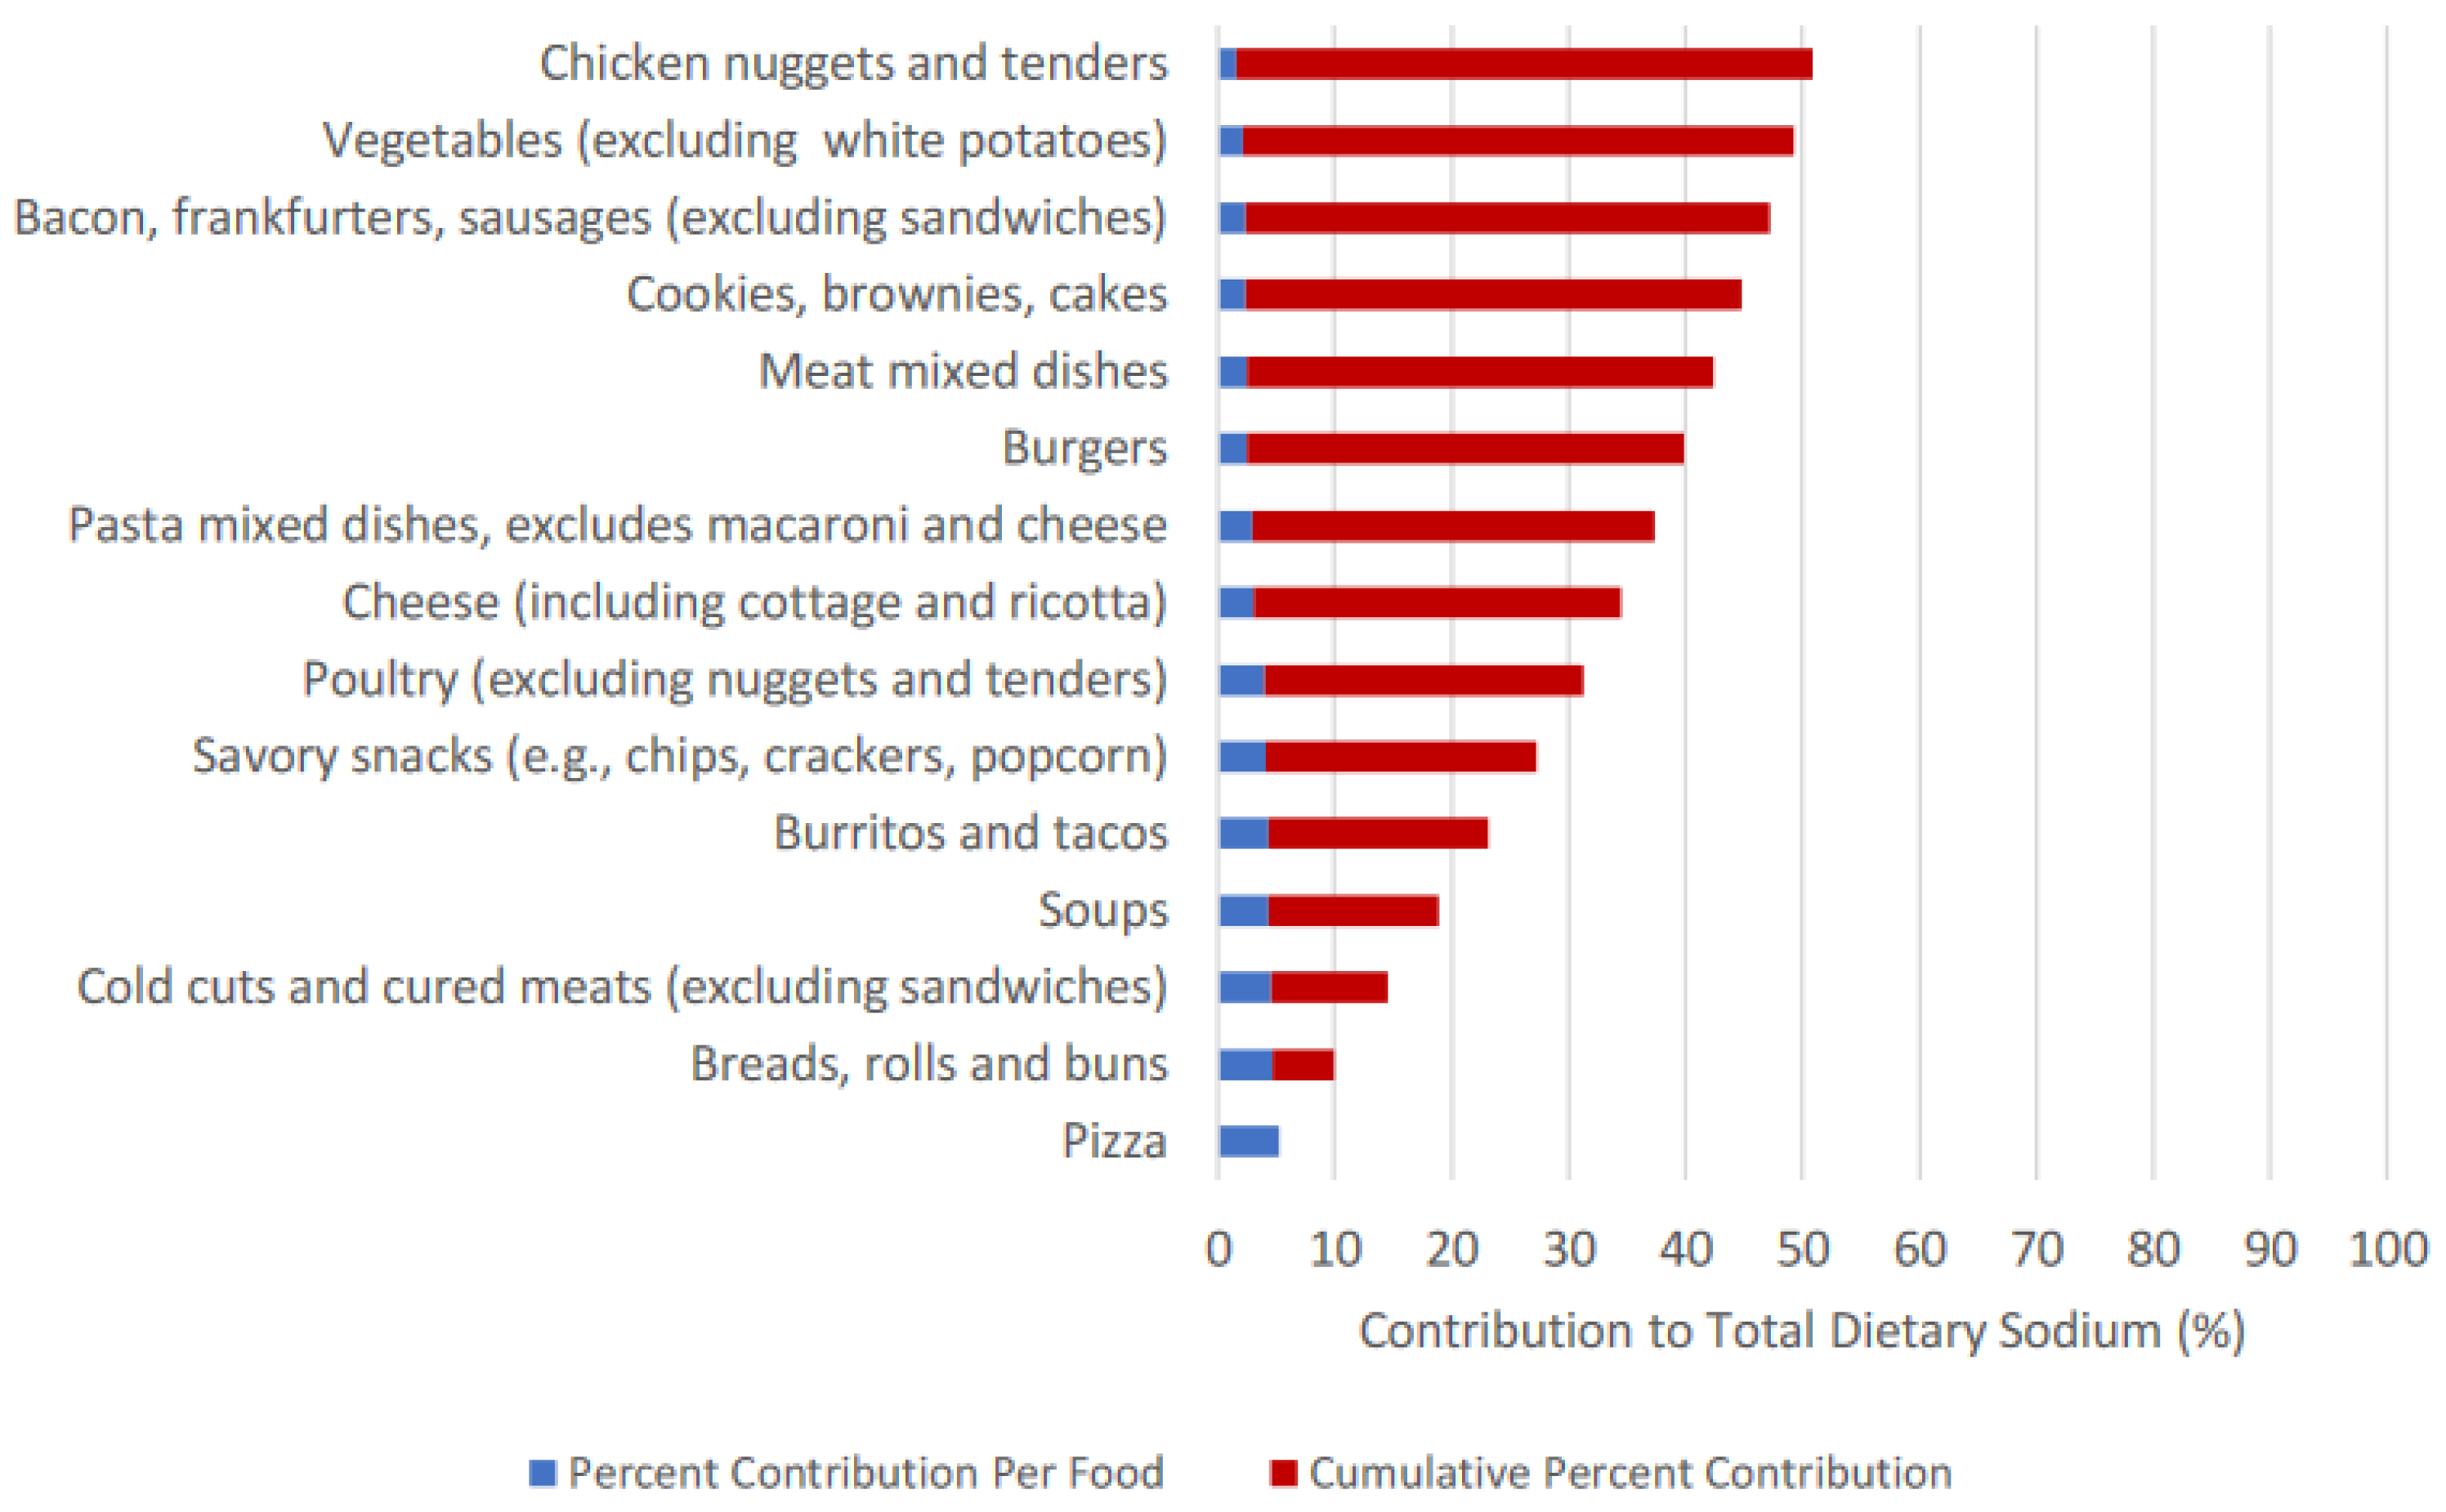
3. Results
4. Discussion
5. Conclusions
Supplementary Materials
Author Contributions
Funding
Institutional Review Board Statement
Informed Consent Statement
Data Availability Statement
Conflicts of Interest
References
- US Office of Disease Prevention and Health Promotion. Dietary Guidelines 2015–2020. Available online: https://health.gov/our-work/nutrition-physical-activity/dietary-guidelines/previous-dietary-guidelines/2015 (accessed on 1 December 2020).
- Kochanek, K.D.; SMurphy, J.X.; Arias, E. Mortality in the United States, 2016. NCHS Data Brief 2017, 293, 1–8. [Google Scholar]
- Holden, J.M.; Pehrsson, P.; Nickle, M.; Haytowitz, D.; Exler, J.; Showell, B.; Williams, J.; Thomas, R.; Ahuja, J.; Patterson, K.; et al. Usda Monitors Levels of Added Sodium in Commercial Packaged and Restaurant Foods. Procedia Food Sci. 2013, 2, 60–67. [Google Scholar] [CrossRef]
- Gillespie, C.; Maalouf, J.; Yuan, K.; Cogswell, M.E.; Gunn, J.P.; Levings, J.; Moshfegh, A.; Ahuja, J.K.C.; Merritt, R. Sodium Content in Major Brands of Us Packaged Foods, 2009. Am. J. Clin. Nutr. 2014, 101, 344–353. [Google Scholar] [CrossRef] [PubMed]
- McGuire, S. ; Institute of Medicine. Strategies to Reduce Sodium Intake in the United States; The National Academies Press: Washington, DC, USA, 2010; Volume 1, pp. 49–50. [Google Scholar]
- Henney, J.E.; O’Hara, J., 3rd; Taylor, C.L. Sodium-Intake Reduction and the Food Industry. N. Engl. J. Med. 2019, 381, 201–203. [Google Scholar] [CrossRef]
- Torres-Gonzalez, M.; Cifelli, C.; Agarwal, S.; Fulgoni, V. Sodium and Potassium in the American Diet: Important Food Sources from Nhanes 2015–2016 (P18-045-19). Curr. Dev. Nutr. 2019, 3, nzz039. [Google Scholar] [CrossRef]
- Centers for Disease Control and Prevention. Top 10 Sources of Sodium. Available online: https://www.cdc.gov/salt/sources.htm (accessed on 9 November 2020).
- Woodruff, R.C.; Zhao, L.; Ahuja, J.; Gillespie, C.; Goldman, J.; Harris, D.; Jackson, S.; Rhodes, D.; Sebastian, R.; Terry, A.; et al. Top Food Category Contributors to Sodium and Potassium Intake—United States, 2015–2016. MMWR Morb. Mortal. Wkly Rep. 2020, 69, 1064–1069. [Google Scholar] [CrossRef] [PubMed]
- United States Department of Agriculture. Dietary Guidelines. Available online: https://www.dietaryguidelines.gov/sites/default/files/2020-07/ScientificReport_of_the_2020DietaryGuidelinesAdvisoryCommittee_first-print.pdf (accessed on 14 January 2021).
- Centers for Disease Control and Prevention. National Health and Nutrition Examination Survey. Available online: https://www.cdc.gov/nchs/nhanes/index.htm (accessed on 9 November 2020).
- United States Department of Agriculture. Dietary Guidelines for Americans. Available online: https://www.dietaryguidelines.gov/sites/default/files/2020-12/Dietary_Guidelines_for_Americans_2020-2025.pdf (accessed on 20 December 2020).
- Branum, A.M.; Rossen, L.M. The Contribution of Mixed Dishes to Vegetable Intake among Us Children and Adolescents. Public Health Nutr. 2014, 17, 2053–2060. [Google Scholar] [CrossRef] [PubMed]
- Steinfeldt, L.C.; Martin, C.; Clemens, J.; Moshfegh, A.J. Comparing Two Days of Dietary Intake in What We Eat in America (Wweia), Nhanes, 2013–2016. Nutrients 2021, 13, 2621. [Google Scholar] [CrossRef] [PubMed]
- United States Department of Agriculture. Food and Nutrient Database for Dietary Studies (Fndds). Available online: https://www.ars.usda.gov/northeast-area/beltsville-md-bhnrc/beltsville-human-nutrition-research-center/food-surveys-research-group/docs/fndds-download-databases/ (accessed on 5 December 2020).
- Centers for Disease Control and Prevention. What We Eat in America Food Categories. Available online: https://stacks.cdc.gov/view/cdc/91457 (accessed on 5 December 2020).
- Huth, P.J.; Fulgoni, V.L.; Keast, D.R.; Park, K.; Auestad, N. Major Food Sources of Calories, Added Sugars, and Saturated Fat and Their Contribution to Essential Nutrient Intakes in the U.S. Diet: Data from the National Health and Nutrition Examination Survey (2003–2006). Nutr. J. 2013, 12, 116. [Google Scholar] [CrossRef] [PubMed]
- Freedman, L.S.; Guenther, P.M.; Krebs-Smith, S.M.; Kott, P.S. A Population’s Mean Healthy Eating Index-2005 Scores Are Best Estimated by the Score of the Population Ratio When One 24-Hour Recall Is Available. J. Nutr. 2008, 138, 1725–1729. [Google Scholar] [CrossRef]
- Kirkpatrick, S.I.; Raffoul, A.; Lee, K.M.; Jones, A.C. Top Dietary Sources of Energy, Sodium, Sugars, and Saturated Fats among Canadians: Insights from the 2015 Canadian Community Health Survey. Appl. Physiol. Nutr. Metab. 2019, 44, 650–658. [Google Scholar] [CrossRef] [PubMed]
- Krebs-Smith, S.M.; Kott, P.S.; Guenther, P.M. Mean Proportion and Population Proportion: Two Answers to the Same Question? J. Am. Diet. Assoc. 1989, 89, 671–676. [Google Scholar] [CrossRef] [PubMed]
- Institute of Medicine (U.S.) Subcommittee on Interpretation and Uses of Dietary Reference Intakes; Institute of Medicine (U.S.) Subcommittee on Upper Reference Levels of Nutrients; Institute of Medicine (U.S.) Standing Committee on the Scientific Evaluation of Dietary Reference Intakes. Dietary Reference Intakes. Applications in Dietary Assessment: A Report of the Subcommittees on Interpretation and Uses of Dietary Reference Intakes and the Standing Committee on the Scientific Evaluation of Dietary Reference Intakes, Food and Nutrition Board, Institute of Medicine; National Academy Press: Washington, DC, USA, 2000. [Google Scholar]
- Department of Human and Health Services. 2020 Poverty Guidelines. Available online: https://aspe.hhs.gov/2020-poverty-guidelines (accessed on 6 December 2020).
- Bailey, R.L.; Parker, E.A.; Rhodes, D.G.; Goldman, J.D.; Clemens, J.C.; Moshfegh, A.J.; Thuppal, S.V.; Weaver, C.M. Estimating Sodium and Potassium Intakes and Their Ratio in the American Diet: Data from the 2011–2012 Nhanes. J. Nutr. 2015, 146, 745–750. [Google Scholar] [CrossRef]
- Cogswell, M.E.; Zhang, Z.; Carriquiry, A.L.; Gunn, J.P.; Kuklina, E.V.; Saydah, S.H.; Yang, Q.; Moshfegh, A.J. Sodium and Potassium Intakes among Us Adults: Nhanes 2003–2008. Am. J. Clin. Nutr. 2012, 96, 647–657. [Google Scholar] [CrossRef]
- Burt, V.L.; Cohen, S.B. A Comparison of Methods to Approximate Standard Errors for Complex Survey Data. Rev. Public Data Use 1984, 12, 159–168. [Google Scholar]
- Fischer, P.W.; Vigneault, M.; Huang, R.; Arvaniti, K.; Roach, P. Sodium Food Sources in the Canadian Diet. Appl. Physiol. Nutr. Metab. 2009, 34, 884–892. [Google Scholar] [CrossRef] [PubMed]
- Bennett, G.; Bardon, L.A.; Gibney, E.R. A Comparison of Dietary Patterns and Factors Influencing Food Choice among Ethnic Groups Living in One Locality: A Systematic Review. Nutrients 2022, 14, 941. [Google Scholar] [CrossRef]
- Jackson, S.L.; Cogswell, M.; Zhao, L.; Terry, A.; Wang, C.; Wright, J.; King, S.C.; Bowman, B.; Chen, T.; Merritt, R.; et al. Association between Urinary Sodium and Potassium Excretion and Blood Pressure among Adults in the United States: National Health and Nutrition Examination Survey, 2014. Circulation 2018, 137, 237–246. [Google Scholar] [CrossRef]
- Cogswell, M.E.; Loria, C.M.; Terry, A.L.; Zhao, L.; Wang, C.-Y.; Chen, T.-C.; Wright, J.D.; Pfeiffer, C.M.; Merritt, R.; Moy, C.S.; et al. Estimated 24-Hour Urinary Sodium and Potassium Excretion in Us Adults. JAMA 2018, 319, 1209–1220. [Google Scholar] [CrossRef]
- Pfeiffer, C.M.; Hughes, J.; Cogswell, M.; Burt, V.; Lacher, D.; Lavoie, D.; Rabinowitz, D.; Johnson, C.; Pirkle, J.L. Urine Sodium Excretion Increased Slightly among U.S. Adults between 1988 and 2010. J. Nutr. 2014, 144, 698–705. [Google Scholar] [CrossRef]
- United States Food and Drugs Administration. Guidance for Industry: Voluntary Sodium Reduction Goals. Available online: https://www.fda.gov/regulatory-information/search-fda-guidance-documents/guidance-industry-voluntary-sodium-reduction-goals (accessed on 7 November 2020).
- Charlton, K.E.; Corso, B.; Ware, L.; Schutte, A.E.; Wepener, L.; Minicuci, N.; Naidoo, N.; Kowal, P. Effect of South Africa’s Interim Mandatory Salt Reduction Programme on Urinary Sodium Excretion and Blood Pressure. Prev. Med. Rep. 2021, 23, 101469. [Google Scholar] [CrossRef]
- Government of United Kingdom. National Diet and Nutrition Survey: Assessment of Dietary Sodium in Adults in England. 2014. Available online: https://www.gov.uk/government/statistics/national-diet-and-nutrition-survey-assessment-of-dietary-sodium-in-adults-in-england-2014 (accessed on 5 November 2022).
- Arcand, J.; Jefferson, K.; Schermel, A.; Shah, F.; Trang, S.; Kutlesa, D.; Lou, W.; L’Abbe, M.R. Examination of Food Industry Progress in Reducing the Sodium Content of Packaged Foods in Canada: 2010 to 2013. Appl. Physiol. Nutr. Metab. 2016, 41, 684–690. [Google Scholar] [CrossRef]
- National Cancer Institute. Usual Dietary Intake: Sas Macros for the Nci Method. Available online: https://epi.grants.cancer.gov/diet/usualintakes/macros.html (accessed on 20 November 2020).
- Kirkpatrick, S.I.; Guenther, P.; Subar, A.; Krebs-Smith, S.; Herrick, K.; Freedman, L.; Dodd, K.W. Using Short-Term Dietary Intake Data to Address Research Questions Related to Usual Dietary Intake among Populations and Subpopulations: Assumptions, Statistical Techniques, and Considerations. J. Acad. Nutr. Diet. 2022, 122, 1246–1262. [Google Scholar] [CrossRef] [PubMed]
- Kipnis, V.; Subar, A.F.; Midthune, D.; Freedman, L.S.; Ballard-Barbash, R.; Troiano, R.P.; Bingham, S.; Schoeller, D.A.; Schatzkin, A.; Carroll, R.J. Structure of Dietary Measurement Error: Results of the Open Biomarker Study. Am. J. Epidemiol. 2003, 158, 14–21. [Google Scholar] [CrossRef]
- Freedman, L.S.; Commins, J.M.; Moler, J.E.; Arab, L.; Baer, D.J.; Kipnis, V.; Midthune, D.; Moshfegh, A.J.; Neuhouser, M.L.; Prentice, R.L.; et al. Pooled Results from 5 Validation Studies of Dietary Self-Report Instruments Using Recovery Biomarkers for Energy and Protein Intake. Am. J. Epidemiol. 2014, 180, 172–188. [Google Scholar] [CrossRef] [PubMed]
- Moshfegh, A.J.; Rhodes, D.G.; Baer, D.J.; Murayi, T.; Clemens, J.C.; Rumpler, W.V.; Paul, D.R.; Sebastian, R.S.; Kuczynski, K.J.; Ingwersen, L.A.; et al. The Us Department of Agriculture Automated Multiple-Pass Method Reduces Bias in the Collection of Energy Intakes. Am. J. Clin. Nutr. 2008, 88, 324–332. [Google Scholar] [CrossRef]
- Health Canada. 2015 Canadian Community Health Survey—Nutrition User Guide. Available online: http://sda.chass.utoronto.ca/sdaweb/dli2/cchs/cchs2015_nu/more_doc/CCHS_NU_2015_PUMF_User_Guide.pdf (accessed on 2 July 2021).
- Blanton, C.A.; Moshfegh, A.; Baer, D.; Kretsch, M.J. The Usda Automated Multiple-Pass Method Accurately Estimates Group Total Energy and Nutrient Intake. J. Nutr. 2006, 136, 2594–2599. [Google Scholar] [CrossRef]
- Rhodes, D.G.; Murayi, T.; Clemens, J.C.; Baer, D.J.; Sebastian, R.S.; Moshfegh, A.J. The Usda Automated Multiple-Pass Method Accurately Assesses Population Sodium Intakes. Am. J. Clin. Nutr. 2013, 97, 958–964. [Google Scholar] [CrossRef]
- Subar, A.F.; Freedman, L.S.; Tooze, J.A.; Kirkpatrick, S.I.; Boushey, C.; Neuhouser, M.L.; Thompson, F.E.; Potischman, N.; Guenther, P.M.; Tarasuk, V.; et al. Addressing Current Criticism Regarding the Value of Self-Report Dietary Data. J. Nutr. 2015, 145, 2639–2645. [Google Scholar] [CrossRef] [PubMed]
- Huizinga, M.M.; Carlisle, A.J.; Cavanaugh, K.L.; Davis, D.L.; Gregory, R.P.; Schlundt, D.G.; Rothman, R.L. Literacy, Numeracy, and Portion-Size Estimation Skills. Am. J. Prev. Med. 2009, 36, 324–328. [Google Scholar] [CrossRef] [PubMed]
- Hernández, T.; Wilder, L.; Kuehn, D.; Rubotzky, K.; Moser-Veillon, P.; Godwin, S.; Thompson, C.; Wang, C. Portion Size Estimation and Expectation of Accuracy. J. Food Compos. Anal. 2006, 19, S14–S21. [Google Scholar] [CrossRef]
- Kirkpatrick, S.I.; Potischman, N.; Dodd, K.W.; Douglass, D.; Zimmerman, T.P.; Kahle, L.L.; Thompson, F.E.; George, S.M.; Subar, A.F. The Use of Digital Images in 24-Hour Recalls May Lead to Less Misestimation of Portion Size Compared with Traditional Interviewer-Administered Recalls. J. Nutr. 2016, 146, 2567–2573. [Google Scholar] [CrossRef] [PubMed]
- Hebert, J.R.; Clemow, L.; Pbert, L.; Ockene, I.S.; Ockene, J.K. Social Desirability Bias in Dietary Self-Report May Compromise the Validity of Dietary Intake Measures. Int. J. Epidemiol. 1995, 24, 389–398. [Google Scholar] [CrossRef]
- Murakami, K.; Livingstone, M.B.E. Prevalence and Characteristics of Misreporting of Energy Intake in Us Adults: Nhanes 2003–2012. Br. J. Nutr. 2015, 114, 1294–1303. [Google Scholar] [CrossRef] [PubMed]


| Food Categories 2 | |||||||||||||||||
|---|---|---|---|---|---|---|---|---|---|---|---|---|---|---|---|---|---|
| Overall Food Category Rank | 1 | 2 | 3 | 4 | 5 | 6 | 7 | 8 | 9 | 10 | 11 | 12 | 13 | 14 | 15 | Total % Contribution of Top 15 Categories | |
| n | Pizza | Breads, Rolls and Buns | Cold Cuts and Cured Meats (Excluding Sandwiches) | Soups | Burritos and Tacos | Savory Snacks (e.g., Chips, Crackers, Popcorn) | Poultry (Excluding Nuggets and Tenders) | Cheese (Including Cottage and Ricotta) | Pasta Mixed Dishes, Excludes Macaroni and Cheese | Burgers | Meat Mixed Dishes | Cookies, Brownies and Cakes | Bacon, Frankfurters and Sausages (Excluding Sandwiches) | Vegetables (Excluding White Potatoes) | Chicken Nuggets and Tenders | ||
| Total sample | 7081 | 5.26% | 4.66% | 4.59% | 4.34% | 4.29% | 4.14% | 4.03% | 3.11% | 2.90% | 2.52% | 2.47% | 2.44% | 2.38% | 2.16% | 1.54% | 50.83% |
| Household income 3 | |||||||||||||||||
| Low | 2029 | 5.56% | 4.08% | 3.37% | 4.75% | 5.01% | 3.79% | 4.44% | 3.05% | 3.32% | 3.01% | 1.77% | 2.39% | 2.24% | 1.58% | 2.37% | 50.73% |
| Middle | 2545 | 5.77% | 4.59% | 5.39% | 4.02% | 4.25% | 4.64% | 3.48% | 3.05% | 2.43% | 1.64% | 2.81% | 2.68% | 2.40% | 2.16% | 1.47% | 50.78% |
| High | 754 | 5.41% | 5.11% | 5.41% | 3.39% | 3.80% | 3.57% | 4.01% | 3.11% | 3.52% | 2.25% | 2.86% | 2.43% | 2.98% | 2.25% | 1.49% | 51.59% |
| Race/Ethnicity | |||||||||||||||||
| White | 2479 | 5.23% | 4.91% | 5.41% | 3.71% | 3.20% | 4.55% | 3.12% | 3.53% | 2.86% | 2.68% | 3.06% | 2.42% | 2.72% | 2.17% | 1.56% | 51.13% |
| Black | 1646 | 5.05% | 3.64% | 3.93% | 2.68% | 3.33% | 4.69% | 7.71% | 2.64% | 3.45% | 2.89% | 1.41% | 2.69% | 2.66% | 2.28% | 2.57% | 51.62% |
| Hispanic | 1627 | 5.77% | 3.92% | 3.14% | 6.33% | 9.38% | 3.24% | 4.39% | 2.58% | 2.19% | 2.21% | 1.21% | 2.18% | 1.65% | 1.79% | 1.01% | 50.99% |
| Asian | 853 | 4.03% | 6.26% | 2.18% | 9.25% | 2.35% | 2.11% | 4.72% | 1.22% | 1.62% | 1.08% | 1.93% | 2.06% | 1.05% | 3.31% | 0.90% | 44.07% |
| “Other” | 476 | 5.68% | 4.74% | 4.09% | 3.32% | 3.91% | 3.69% | 4.44% | 3.24% | 5.75% | 2.48% | 2.87% | 3.14% | 2.01% | 2.00% | 1.67% | 53.03% |
| Dietary Reference Intakes Age–Sex Groupings | |||||||||||||||||
| >1 y | 299 | 5.28% | 3.69% | 2.62% | 2.89% | 3.82% | 7.19% | 2.73% | 5.20% | 2.78% | 0.95% | 1.23% | 2.89% | 4.22% | 1.71% | 5.07% | 52.27% |
| 4–8 y | 623 | 6.89% | 4.36% | 4.85% | 2.77% | 2.92% | 6.23% | 3.21% | 3.76% | 2.85% | 1.89% | 1.55% | 3.58% | 2.10% | 1.18% | 3.30% | 51.44% |
| 9–13 y males | 328 | 9.61% | 4.50% | 3.68% | 2.26% | 6.38% | 8.68% | 3.57% | 2.76% | 3.08% | 1.87% | 0.96% | 2.64% | 2.51% | 0.94% | 2.85% | 56.29% |
| 9–13 y females | 353 | 8.86% | 3.99% | 3.05% | 3.68% | 2.10% | 6.38% | 3.57% | 3.24% | 3.82% | 1.57% | 1.78% | 3.65% | 1.47% | 1.40% | 2.88% | 51.44% |
| 14–18 y males | 341 | 9.32% | 4.42% | 6.27% | 3.90% | 3.62% | 5.18% | 4.63% | 2.34% | 3.00% | 3.96% | 1.26% | 2.01% | 1.36% | 0.65% | 3.00% | 54.92% |
| 14–18 y females | 323 | 7.23% | 5.19% | 3.74% | 3.50% | 4.02% | 5.93% | 7.28% | 2.73% | 2.61% | 2.07% | 0.99% | 2.63% | 1.23% | 1.51% | 3.08% | 53.74% |
| 19–30 y males | 422 | 6.96% | 3.16% | 5.98% | 1.74% | 7.41% | 3.24% | 4.05% | 2.07% | 2.78% | 3.42% | 2.38% | 0.71% | 2.00% | 1.31% | 2.39% | 49.60% |
| 19–30 y females | 436 | 5.42% | 3.41% | 2.68% | 3.08% | 5.74% | 3.99% | 4.06% | 3.43% | 3.59% | 2.03% | 2.73% | 1.82% | 2.88% | 2.69% | 2.26% | 49.81% |
| 31–50 y males | 677 | 5.88% | 4.35% | 4.01% | 5.25% | 6.33% | 3.01% | 5.34% | 3.00% | 2.06% | 3.48% | 1.19% | 2.08% | 2.52% | 1.83% | 0.85% | 51.18% |
| 31–50 y females | 744 | 4.76% | 4.86% | 3.47% | 4.54% | 5.02% | 4.02% | 4.02% | 3.36% | 2.37% | 2.24% | 1.99% | 2.52% | 3.07% | 3.48% | 0.98% | 50.70% |
| 51–70 y males | 876 | 3.71% | 5.29% | 5.72% | 4.19% | 2.79% | 3.92% | 3.67% | 3.24% | 3.54% | 2.42% | 2.88% | 2.80% | 2.44% | 1.96% | 0.50% | 49.07% |
| 51–70 y females | 900 | 3.23% | 5.65% | 3.96% | 6.28% | 2.18% | 3.63% | 3.34% | 3.59% | 3.24% | 2.32% | 4.62% | 2.60% | 1.83% | 3.18% | 0.94% | 50.59% |
| >70 y males | 390 | 2.43% | 5.87% | 7.55% | 6.99% | 0.84% | 2.52% | 2.48% | 2.04% | 2.36% | 1.96% | 4.69% | 3.80% | 2.93% | 2.10% | 0.83% | 49.39% |
| >70 y females | 369 | 1.06% | 6.29% | 5.55% | 6.96% | 1.54% | 4.60% | 3.13% | 3.89% | 3.43% | 1.19% | 4.03% | 3.61% | 2.90% | 3.80% | 0.62% | 52.60% |
| Food Categories 2 | |||||||||||||||
|---|---|---|---|---|---|---|---|---|---|---|---|---|---|---|---|
| Pizza | Breads, Rolls and Buns | Cold cuts and Cured Meats (Excluding Sandwiches) | Soups | Burritos and Tacos | Savory Snacks (e.g., Chips, Crackers, Popcorn) | Poultry (Excluding Nuggets and Tenders) | Cheese (Including Cottage and Ricotta) | Pasta Mixed Dishes, Excludes Macaroni and Cheese | Burgers | Meat Mixed Dishes | Cookies, Brownies and Cakes | Bacon, Frankfurters and Sausages (Excluding Sandwiches) | Vegetables (Excluding White Potatoes) | Chicken Nuggets and Tenders | |
| Total sample | 1388 ± 49 (930) | 385 ± 9.5 (2779) | 901 ± 36 (1075) | 1238 ± 45 (920) | 1656 ± 49 (618) | 303 ± 9.0 (3186) | 678 ± 27 (1502) | 315 ± 11 (1986) | 931 ± 39 (703) | 792 ± 19 (702) | 980 ± 58 (513) | 264 ± 10 (2225) | 552 ± 34 (976) | 167 ± 6.8 (2866) | 742 ± 36 (572) |
| Household income 3 | |||||||||||||||
| Low | 1443 ± 75 (287) | 361 ± 13 (718) | 691 ± 39 (298) | 1281 ± 118 (268) | 1716 ± 88 (191) | 292 ± 12 (859) | 735 ± 60 (423) | 325 ± 17 (547) | 1020 ± 78 (199) | 785 ± 33 (231) | 990 ± 168 (107) | 293 ± 28 (601) | 591 ± 59 (257) | 155 ± 10 (687) | 870 ± 85 (178) |
| Middle | 1396 ± 83 (344) | 381 ± 15 (1012) | 947 ± 62 (423) | 1244 ± 60 (312) | 1699 ± 83 (221) | 332 ± 16 (1175) | 654 ± 42 (500) | 323 ± 18 (686) | 888 ± 54 (255) | 828 ± 33 (250) | 1045 ± 93 (220) | 293 ± 20 (806) | 582 ± 69 (359) | 172 ± 11 (975) | 717 ± 52 (200) |
| High | 1434 ± 118 (85) | 390 ± 24 (318) | 1084 ± 135 (110) | 1134 ± 123 (100) | 1523 ± 128 (50) | 283 ± 23 (353) | 766 ± 105 (154) | 318 ± 43 (225) | 1071 ± 108 (79) | 764 ± 57 (78) | 879 ± 97 (66) | 245 ± 19 (266) | 666 ± 132 (105) | 159 ± 20 (360) | 781 ± 123 (71) |
| Race/Ethnicity | |||||||||||||||
| White | 1331 ± 69 (334) | 386 ± 14 (1093) | 941 ± 48 (491) | 1286 ± 78 (225) | 1475 ± 68 (163) | 331 ± 13 (1214) | 622 ± 42 (353) | 317 ± 16 (872) | 883 ± 51 (269) | 785 ± 25 (292) | 1063 ± 81 (237) | 253 ± 14 (820) | 560 ± 49 (393) | 160 ± 10 (987) | 731 ± 55 (229) |
| Black | 1480 ± 85 (216) | 359 ± 13 (541) | 888 ± 88 (235) | 1080 ± 67 (146) | 1779 ± 131 (95) | 315 ± 13 (814) | 866 ± 41 (469) | 346 ± 23 (383) | 1039 ± 77 (169) | 864 ± 47 (174) | 837 ± 90 (86) | 290 ± 24 (525) | 507 ± 21 (311) | 200 ± 12 (606) | 858 ± 67 (169) |
| Hispanic | 1548 ± 108 (207) | 368 ± 16 (569) | 761 ± 58 (214) | 1186 ± 66 (290) | 1943 ± 93 (275) | 285 ± 16 (628) | 623 ± 60 (373) | 292 ± 20 (460) | 896 ± 80 (131) | 762 ± 32 (151) | 773 ± 69 (72) | 260 ± 16 (466) | 578 ± 68 (143) | 145 ± 9.3 (654) | 656 ± 55 (88) |
| Asian | 1302 ± 125 (100) | 469 ± 25 (403) | 986 ± 111 (58) | 1328 ± 95 (200) | 1557 ± 135 (43) | 196 ± 13 (307) | 656 ± 69 (218) | 284 ± 30 (128) | 817 ± 72 (69) | 840 ± 127 (39) | 710 ± 89 (72) | 239 ± 15 (273) | 536 ± 69 (64) | 214 ± 15 (456) | 692 ± 90 (40) |
| “Other” | 1426 ± 125 (73) | 384 ± 47 (173) | 779 ± 172 (77) | 1088 ± 204 (59) | 1476 ± 143 (42) | 308 ± 29 (223) | 861 ± 111 (89) | 317 ± 34 (143) | 1233 ± 202 (65) | 792 ± 80 (46) | 891 ± 128 (46) | 381 ± 71 (141) | 517 ± 84 (65) | 193 ± 31 (163) | 752 ± 67 (46) |
| Dietary Reference Intakes Age–Sex Groupings | |||||||||||||||
| >1 y | 640 ± 94 (51) | 199 ± 21 (94) | 387 ± 58 (40) | 519 ± 61 (37) | 927 ± 205 (16) | 236 ± 24 (186) | 277 ± 25 (64) | 228 ± 26 (106) | 390 ± 56 (37) | 401 ± 63 (18) | 438 ± 52 (15) | 158 ± 13 (109) | 494 ± 79 (54) | 89 ± 14 (114) | 441 ± 33 (65) |
| 4–8 y | 951 ± 80 (136) | 288 ± 16 (236) | 626 ± 76 (107) | 908 ± 91 (57) | 984 ± 141 (45) | 280 ± 18 (365) | 403 ± 29 (120) | 272 ± 18 (189) | 565 ± 60 (76) | 522 ± 37 (60) | 667 ± 164 (36) | 213 ± 15 (248) | 408 ± 41 (83) | 98 ± 11 (188) | 522 ± 40 (110) |
| 9–13 y males | 1185 ± 124 (86) | 337 ± 21 (130) | 557 ± 61 (61) | 885 ± 117 (38) | 1523 ± 195 (39) | 494 ± 58 (175) | 752 ± 173 (63) | 287 ± 38 (79) | 981 ± 160 (33) | 642 ± 46 (30) | 943 ± 212 (11) | 242 ± 34 (116) | 462 ± 39 (47) | 96 ± 18 (87) | 736 ± 147 (31) |
| 9–13 y females | 982 ± 121 (88) | 346 ± 26 (105) | 646 ± 84 (39) | 1010 ± 94 (44) | 1285 ± 125 (28) | 329 ± 34 (205) | 668 ± 83 (52) | 309 ± 39 (91) | 785 ± 124 (47) | 656 ± 58 (35) | 622 ± 102 (17) | 231 ± 25 (146) | 382 ± 45 (40) | 127 ± 16 (112) | 611 ± 58 (50) |
| 14–18 y males | 2008 ± 190 (71) | 507 ± 61 (113) | 1237 ± 190 (59) | 1295 ± 275 (41) | 1713 ± 158 (32) | 412 ± 41 (164) | 1128 ± 201 (53) | 341 ± 41 (88) | 1155 ± 150 (42) | 865 ± 71 (58) | 977 ± 203 (18) | 298 ± 55 (104) | 687 ± 79 (28) | 125 ± 34 (72) | 846 ± 93 (42) |
| 14–18 y females | 1233 ± 161 (54) | 428 ± 33 (100) | 792 ± 83 (37) | 995 ± 91 (37) | 1716 ± 306 (28) | 359 ± 34 (160) | 771 ± 89 (75) | 320 ± 47 (72) | 846 ± 147 (27) | 618 ± 59 (34) | 1252 ± 336 (10) | 225 ± 30 (101) | 413 ± 109 (26) | 113 ± 18 (102) | 1085 ± 165 (29) |
| 19–30 y males | 1932 ± 247 (67) | 419 ± 34 (119) | 1401 ± 176 (60) | 1019 ± 112 (30) | 2120 ± 138 (65) | 320 ± 29 (158) | 967 ± 157 (84) | 306 ± 33 (109) | 1265 ± 119 (46) | 929 ± 57 (65) | 959 ± 151 (34) | 226 ± 25 (80) | 555 ± 98 (48) | 167 ± 22 (127) | 1159 ± 198 (41) |
| 19–30 y females | 1216 ± 136 (62) | 345 ± 25 (138) | 718 ± 129 (51) | 1253 ± 137 (43) | 1430 ± 110 (53) | 315 ± 35 (182) | 547 ± 56 (111) | 325 ± 33 (133) | 1044 ± 117 (51) | 731 ± 45 (42) | 806 ± 76 (41) | 205 ± 37 (123) | 748 ± 283 (57) | 192 ± 18 (188) | 864 ± 84 (40) |
| 31–50 y males | 1734 ± 176 (83) | 465 ± 36 (267) | 1093 ± 103 (103) | 1599 ± 174 (90) | 1933 ± 147 (84) | 327 ± 24 (248) | 937 ± 101 (169) | 404 ± 50 (184) | 1455 ± 240 (47) | 922 ± 66 (91) | 747 ± 94 (61) | 351 ± 44 (177) | 694 ± 96 (94) | 197 ± 23 (253) | 1039 ± 248 (30) |
| 31–50 y females | 1219 ± 122 (79) | 411 ± 31 (265) | 787 ± 84 (75) | 1229 ± 135 (107) | 1719 ± 135 (73) | 270 ± 31 (304) | 526 ± 58 (196) | 271 ± 19 (235) | 667 ± 76 (69) | 762 ± 41 (59) | 884 ± 166 (45) | 264 ± 32 (200) | 619 ± 151 (96) | 194 ± 25 (364) | 652 ± 76 (39) |
| 51–70 y males | 1720 ± 262 (65) | 412 ± 25 (420) | 1004 ± 122 (170) | 1310 ± 111 (132) | 1615 ± 130 (66) | 352 ± 37 (342) | 769 ± 76 (205) | 363 ± 41 (233) | 1168 ± 126 (74) | 828 ± 58 (93) | 1316 ± 222 (72) | 333 ± 36 (277) | 541 ± 51 (147) | 175 ± 21 (392) | 643 ± 107 (25) |
| 51–70 y females | 1262 ± 103 (59) | 359 ± 32 (387) | 736 ± 45 (121) | 1227 ± 110 (147) | 1338 ± 133 (14) | 219 ± 18 (363) | 520 ± 35 (185) | 303 ± 37 (257) | 768 ± 62 (86) | 729 ± 47 (62) | 1203 ± 180 (71) | 271 ± 35 (252) | 395 ± 35 (115) | 167 ± 17 (484) | 656 ± 132 (44) |
| >70 y males | 1455 ± 103 (16) | 391 ± 23 (210) | 1206 ± 178 (88) | 1484 ± 183 (57) | 1785 ± 190 (12) | 214 ± 20 (164) | 691 ± 83 (55) | 274 ± 26 (103) | 928 ± 122 (32) | 753 ± 57 (34) | 1213 ± 220 (48) | 292 ± 25 (145) | 561 ± 84 (79) | 139 ± 18 (175) | 656 ± 158 (14) |
| >70 y females | 1054 ± 129 (13) | 324 ± 17 (195) | 665 ± 61 (64) | 1076 ± 115 (60) | 1146 ± 108 (13) | 262 ± 34 (170) | 495 ± 56 (70) | 283 ± 30 (107) | 957 ± 156 (36) | 666 ± 72 (21) | 854 ± 123 (34) | 213 ± 21 (147) | 500 ± 93 (62) | 172 ± 15 (208) | 555 ± 118 (12) |
| Food Categories 2 | ||||||||||||||||
|---|---|---|---|---|---|---|---|---|---|---|---|---|---|---|---|---|
| n | Pizza | Breads, Rolls and Buns | Cold Cuts and Cured Meats (Excluding Sandwiches) | Soups | Burritos and Tacos | Savory Snacks (e.g., Chips, Crackers, Popcorn) | Poultry (Excluding Nuggets and Tenders) | Cheese (Including Cottage and Ricotta) | Pasta Mixed Dishes, Excludes Macaroni and Cheese | Burgers | Meat Mixed Dishes | Cookies, Brownies and Cakes | Bacon, Frankfurters and Sausages (Excluding Sandwiches) | Vegetables (Excluding White Potatoes) | Chicken Nuggets and Tenders | |
| Total sample | 7081 | 178 ± 10.4 | 157.6 ± 5.39 | 155 ± 9.25 | 147 ± 9.02 | 145 ± 9.42 | 140 ± 5.09 | 136 ± 7.05 | 105 ± 4.95 | 98.2 ± 6.69 | 85.3 ± 5.08 | 83.6 ± 8.11 | 82.3 ± 3.86 | 80.8 ± 6.40 | 52.3 ± 3.94 | 73.4 ± 3.41 |
| Household income 3 | ||||||||||||||||
| Low | 2029 | 180 ± 18.4 | 132 ± 6.96 | 109 ± 10.5 | 154 ± 19.5 | 162 ± 16.4 | 122 ± 6.47 | 143 ± 14.7 | 98.6 ± 7.64 | 107 ± 13.7 | 97.2 ± 8.55 | 57.3 ± 12.1 | 77.2 ± 8.51 | 72.4 ± 9.64 | 76.5 ± 11.2 | 51.1 ± 3.75 |
| Middle | 2545 | 194 ± 17.8 | 155 ± 8.26 | 181 ± 16.9 | 135 ± 12.3 | 143 ± 15.6 | 156 ± 9.59 | 117 ± 10.3 | 103 ± 7.54 | 81.9 ± 8.30 | 88.9 ± 9.13 | 94.7 ± 14.6 | 90.4 ± 7.90 | 80.8 ± 11.4 | 49.6 ± 5.67 | 72.8 ± 5.53 |
| High | 754 | 186 ± 31.3 | 176 ± 16.1 | 186 ± 33.3 | 117 ± 19.7 | 131 ± 26.9 | 123 ± 13.1 | 138 ± 23.6 | 107 ± 18.1 | 121 ± 23.4 | 77.8 ± 14.9 | 98.4 ± 19.6 | 83.5 ± 8.82 | 103 ± 27.8 | 51.2 ± 12.4 | 77.6 ± 10.6 |
| Race/Ethnicity | ||||||||||||||||
| White | 2479 | 178 ± 15.5 | 167 ± 8.2 | 184 ± 14.2 | 126 ± 13.3 | 109 ± 12.5 | 155 ± 7.93 | 106 ± 9.49 | 120 ± 7.62 | 97.2 ± 9.34 | 91.2 ± 7.71 | 104 ± 13.2 | 82.4 ± 5.58 | 92.4 ± 10.2 | 53.0 ± 5.98 | 73.7 ± 5.28 |
| Black | 1646 | 166 ± 16.3 | 120 ± 7.0 | 129 ± 16.7 | 88.2 ± 10.2 | 110 ± 15.9 | 154 ± 8.22 | 254 ± 17.3 | 86.9 ± 7.60 | 113 ± 13.1 | 95.1 ± 9.92 | 46.2 ± 8.02 | 88.6 ± 8.30 | 87.6 ± 6.53 | 84.4 ± 10.4 | 74.9 ± 5.38 |
| Hispanic | 1627 | 193 ± 21.3 | 131 ± 8.3 | 105 ± 12.6 | 212 ± 19.1 | 314 ± 27.5 | 108 ± 7.23 | 147 ± 16.7 | 86.4 ± 7.41 | 73.4 ± 10.2 | 74.0 ± 7.75 | 40.4 ± 6.68 | 73.1 ± 5.74 | 55.3 ± 8.50 | 33.7 ± 5.03 | 59.8 ± 4.53 |
| Asian | 853 | 139 ± 20.7 | 216 ± 16.0 | 75.2 ± 15.9 | 319 ± 33.3 | 81.3 ± 17.2 | 72.8 ± 6.41 | 163 ± 21.6 | 42.1 ± 6.20 | 55.9 ± 8.91 | 37.3 ± 10.7 | 66.7 ± 12.2 | 71.2 ± 6.37 | 36.3 ± 7.03 | 31.2 ± 8.97 | 114 ± 9.30 |
| “Other” | 476 | 197 ± 38.4 | 164 ± 24.6 | 142 ± 39.9 | 115 ± 24.1 | 136 ± 33.7 | 128 ± 17.3 | 154 ± 31.9 | 112 ± 19.2 | 199 ± 50.0 | 86.0 ± 19.9 | 99.5 ± 21.4 | 109 ± 24.0 | 69.5 ± 18.2 | 57.8 ± 11.6 | 69.1 ± 12.5 |
| Dietary Reference Intakes Age–Sex Groupings | ||||||||||||||||
| >1 y | 299 | 103 ± 23.4 | 72.0 ± 9.72 | 51.2 ± 11.9 | 56.6 ± 12.3 | 74.6 ± 32.3 | 140 ± 17.3 | 53.4 ± 9.42 | 102 ± 13.8 | 54.3 ± 12.4 | 18.6 ± 6.07 | 24.0 ± 8.39 | 56.5 ± 8.30 | 82.5 ± 18.7 | 99.1 ± 16.5 | 33.4 ± 5.87 |
| 4–8 y | 623 | 180 ± 23.3 | 114 ± 9.25 | 126 ± 22.1 | 72.3 ± 12.4 | 76.2 ± 17.5 | 162 ± 13.0 | 83.6 ± 10.4 | 98.0 ± 9.49 | 74.4 ± 11.4 | 49.2 ± 8.66 | 40.3 ± 12.9 | 93.2 ± 8.79 | 54.6 ± 8.84 | 86.1 ± 12.0 | 30.9 ± 3.66 |
| 9–13 y males | 328 | 300 ± 52.7 | 140 ± 14.9 | 115 ± 22.0 | 70.3 ± 15.0 | 199 ± 50.4 | 271 ± 39.1 | 111 ± 30.9 | 86.0 ± 15.3 | 96.0 ± 26.5 | 58.2 ± 14.6 | 29.8 ± 10.4 | 82.3 ± 10.9 | 78.2 ± 14.3 | 89.0 ± 25.0 | 29.4 ± 6.02 |
| 9–13 y females | 353 | 257 ± 45.0 | 116 ± 14.8 | 88.2 ± 19.9 | 107 ± 22.7 | 60.7 ± 14.1 | 185 ± 23.8 | 103 ± 20.5 | 93.9 ± 15.9 | 111 ± 23.9 | 45.4 ± 10.1 | 51.6 ± 16.8 | 106 ± 12.9 | 42.4 ± 9.57 | 83.5 ± 19.3 | 40.7 ± 6.44 |
| 14–18 y males | 341 | 369 ± 62.6 | 175 ± 32.3 | 248 ± 66.2 | 154 ± 40.7 | 143 ± 34.5 | 205 ± 25.1 | 184 ± 48.3 | 92.7 ± 18.2 | 119 ± 26.5 | 157 ± 25.8 | 50.0 ± 18.0 | 79.5 ± 17.8 | 53.8 ± 14.4 | 119 ± 23.8 | 25.6 ± 5.34 |
| 14–18 y females | 323 | 206 ± 39.8 | 148 ± 21.0 | 106 ± 30.1 | 99.8 ± 19.8 | 115 ± 34.3 | 169 ± 23.5 | 207 ± 39.1 | 77.7 ± 15.1 | 74.4 ± 19.1 | 58.9 ± 12.7 | 28.3 ± 12.6 | 75.0 ± 12.9 | 35.1 ± 10.4 | 87.8 ± 24.5 | 43.0 ± 8.08 |
| 19–30 y males | 422 | 295 ± 52.8 | 134 ± 16.7 | 254 ± 50.1 | 73.6 ± 21.5 | 314 ± 49.1 | 137 ± 16.0 | 172 ± 34.9 | 87.8 ± 12.8 | 118 ± 25.5 | 145 ± 22.3 | 101 ± 23.2 | 29.9 ± 4.96 | 84.8 ± 18.8 | 101 ± 26.5 | 55.7 ± 9.65 |
| 19–30 y females | 436 | 175 ± 31.6 | 110 ± 12.7 | 86.6 ± 19.1 | 99.6 ± 23.8 | 186 ± 36.4 | 129 ± 17.6 | 131.4 ± 17.4 | 111 ± 15.3 | 116 ± 24.3 | 65.8 ± 12.8 | 88.4 ± 18.3 | 58.9 ± 11.3 | 93.0 ± 39.1 | 73.1 ± 16.2 | 86.9 ± 10.0 |
| 31–50 y males | 677 | 253 ± 37.7 | 187 ± 19.9 | 173 ± 31.4 | 226 ± 40.8 | 273 ± 43.0 | 130 ± 14.6 | 230 ± 32.0 | 129 ± 21.4 | 88.7 ± 22.6 | 150 ± 21.9 | 51.0 ± 9.57 | 89.5 ± 14.6 | 108 ± 19.7 | 36.7 ± 12.2 | 78.8 ± 10.7 |
| 31–50 y females | 744 | 145 ± 27.2 | 148 ± 17.4 | 106 ± 17.2 | 138 ± 20.8 | 153 ± 29.0 | 122 ± 15.8 | 123 ± 15.9 | 102 ± 9.89 | 72.3 ± 11.9 | 68.3 ± 13.6 | 60.6 ± 19.4 | 76.9 ± 10.8 | 93.6 ± 30.4 | 29.8 ± 6.78 | 106 ± 15.3 |
| 51–70 y males | 876 | 151 ± 35.2 | 215 ± 17.9 | 233 ± 37.3 | 170 ± 28.5 | 114 ± 22.5 | 160 ± 20.8 | 149 ± 21.4 | 132 ± 19.1 | 144 ± 30.8 | 98.3 ± 16.0 | 117 ± 32.4 | 114 ± 15.3 | 99.1 ± 14.1 | 20.5 ± 6.46 | 79.6 ± 10.5 |
| 51–70 y females | 900 | 91.3 ± 24.4 | 160 ± 17.4 | 112 ± 16.5 | 178 ± 26.9 | 61.6 ± 12.4 | 103 ± 9.94 | 94.6 ± 12.6 | 101 ± 15.5 | 91.7 ± 17.1 | 65.5 ± 14.0 | 131 ± 38.1 | 73.5 ± 12.2 | 51.8 ± 8.08 | 26.6 ± 7.63 | 89.9 ± 10.4 |
| >70 y males | 390 | 84.5 ± 33.8 | 204 ± 19.6 | 262 ± 57.1 | 243 ± 54.6 | 29.3 ± 9.52 | 87.8 ± 11.0 | 86.2 ± 21.3 | 71.0 ± 10.1 | 82.1 ± 25.5 | 68.3 ± 18.9 | 163 ± 45.0 | 132 ± 14.5 | 102 ± 24.5 | 28.9 ± 11.5 | 72.9 ± 10.3 |
| >70 y females | 369 | 29.0 ± 9.98 | 172 ± 14.9 | 152 ± 27.1 | 191 ± 40.8 | 42.1 ± 16.6 | 126 ± 19.3 | 85.6 ± 16.1 | 107 ± 15.5 | 94.0 ± 21.9 | 32.6 ± 9.63 | 110 ± 28.2 | 99.0 ± 11.9 | 79.4 ± 18.9 | 17.0 ± 6.71 | 104 ± 10.9 |
Disclaimer/Publisher’s Note: The statements, opinions and data contained in all publications are solely those of the individual author(s) and contributor(s) and not of MDPI and/or the editor(s). MDPI and/or the editor(s) disclaim responsibility for any injury to people or property resulting from any ideas, methods, instructions or products referred to in the content. |
© 2023 by the authors. Licensee MDPI, Basel, Switzerland. This article is an open access article distributed under the terms and conditions of the Creative Commons Attribution (CC BY) license (https://creativecommons.org/licenses/by/4.0/).
Share and Cite
Ahmed, M.; Ng, A.; Christoforou, A.; Mulligan, C.; L’Abbé, M.R. Top Sodium Food Sources in the American Diet—Using National Health and Nutrition Examination Survey. Nutrients 2023, 15, 831. https://doi.org/10.3390/nu15040831
Ahmed M, Ng A, Christoforou A, Mulligan C, L’Abbé MR. Top Sodium Food Sources in the American Diet—Using National Health and Nutrition Examination Survey. Nutrients. 2023; 15(4):831. https://doi.org/10.3390/nu15040831
Chicago/Turabian StyleAhmed, Mavra, Alena (Praneet) Ng, Anthea Christoforou, Christine Mulligan, and Mary R. L’Abbé. 2023. "Top Sodium Food Sources in the American Diet—Using National Health and Nutrition Examination Survey" Nutrients 15, no. 4: 831. https://doi.org/10.3390/nu15040831
APA StyleAhmed, M., Ng, A., Christoforou, A., Mulligan, C., & L’Abbé, M. R. (2023). Top Sodium Food Sources in the American Diet—Using National Health and Nutrition Examination Survey. Nutrients, 15(4), 831. https://doi.org/10.3390/nu15040831