

Dark Sweet Cherry (Prunus avium) Supplementation Reduced Blood Pressure and Pro-Inflammatory Interferon Gamma (IFNγ) in Obese Adults without Affecting Lipid Profile, Glucose Levels and Liver Enzymes


Abstract
1. Introduction
2. Materials and Methods
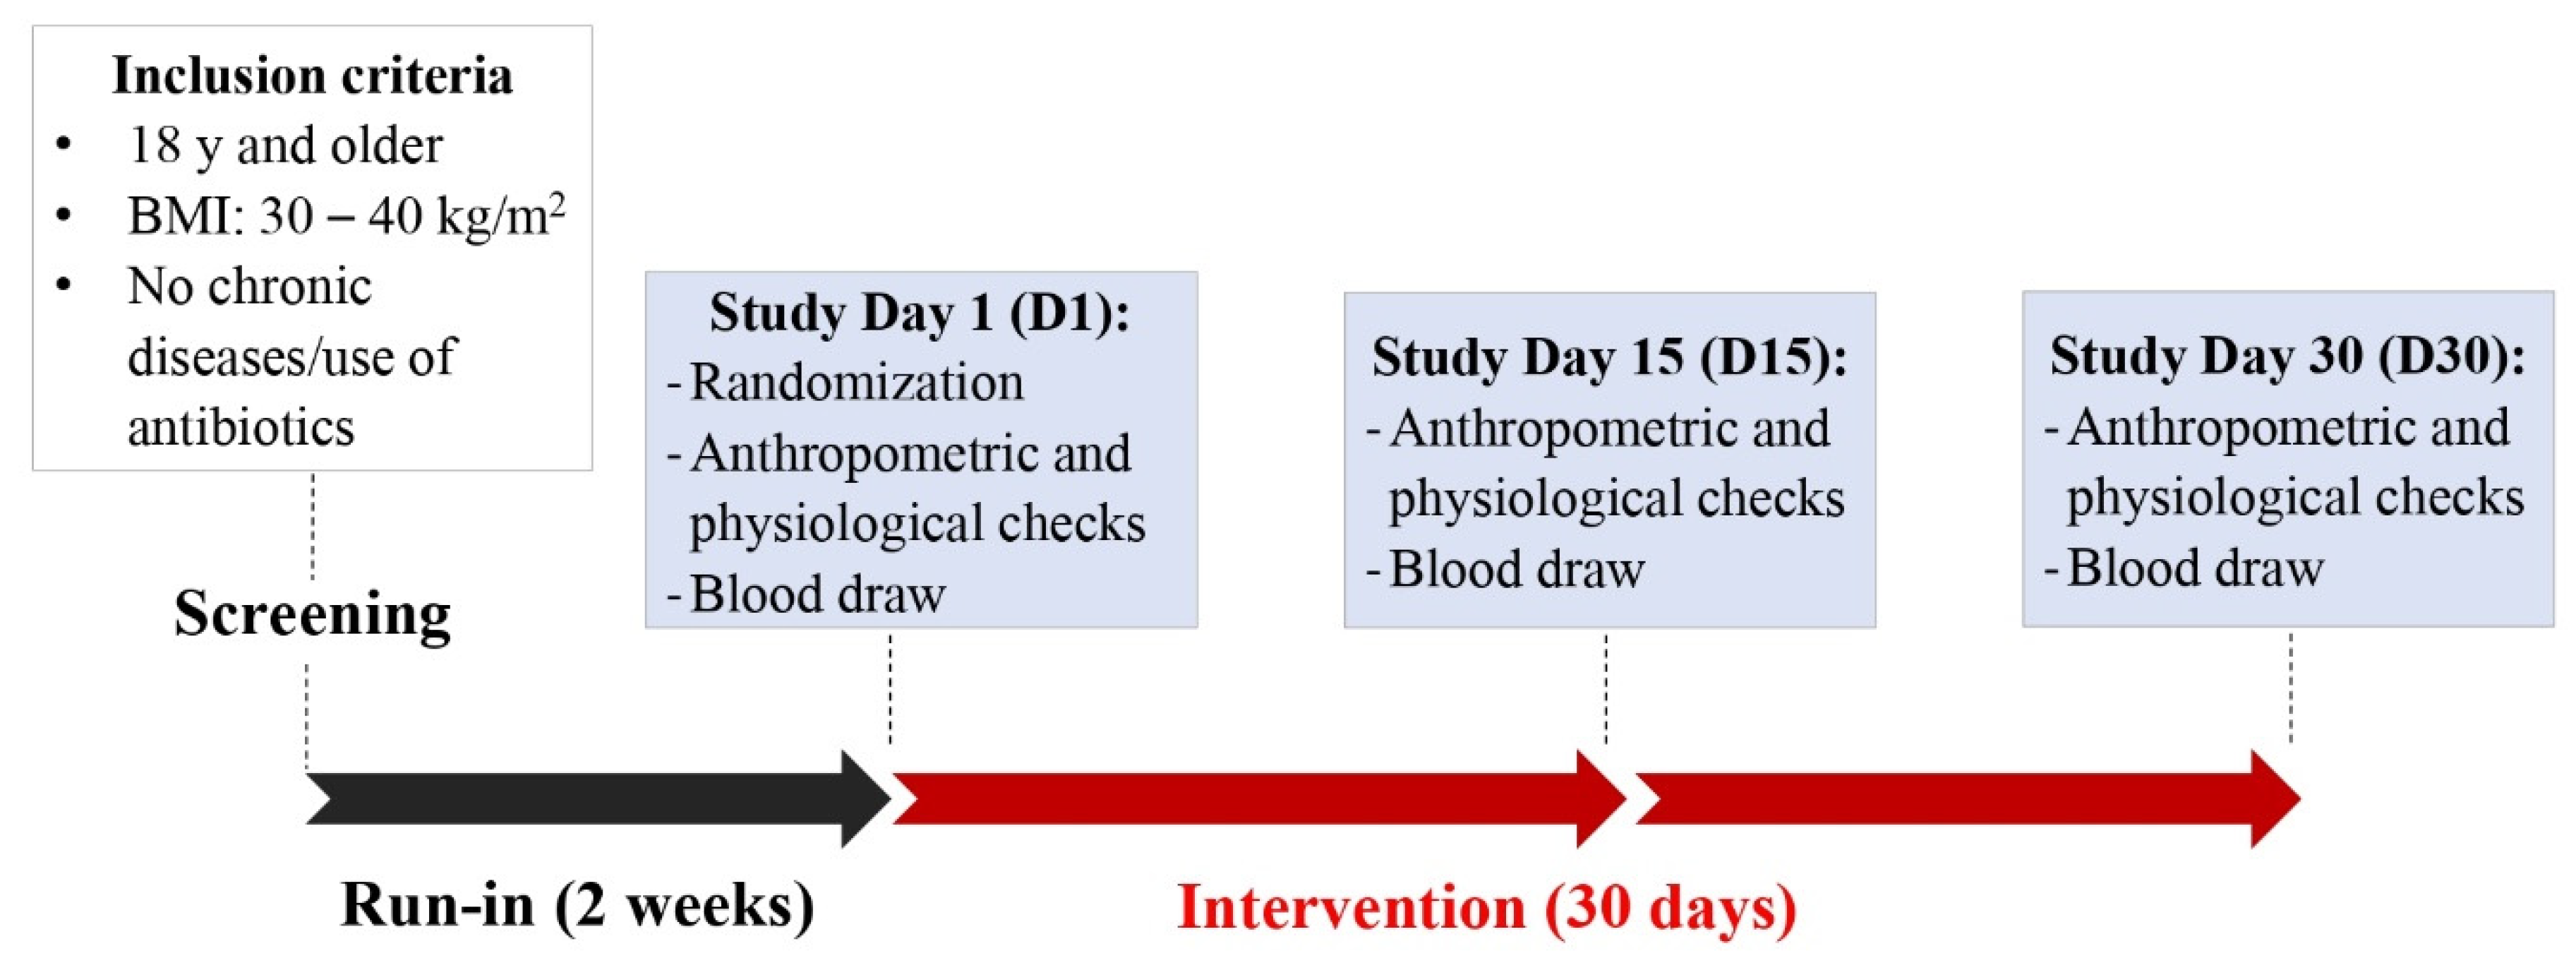
2.1. Study Design and Participant Eligibility
2.2. DSC Supplementation
2.3. Dietary Assessment
2.4. Anthropometric Measurements and Physiological Biomarkers
2.5. Blood Sample Collection
2.6. Analysis of Inflammatory and Oxidative Stress Biomarkers
2.7. Blood Lipid Profile
2.8. Liver Enzymes
2.9. Hemoglobin A1c (HbA1c) and Estimated Average Glucose (eAG)
2.10. Statistical Analysis
3. Results
3.1. Participant Flow Diagram, Baseline Characteristics and Compliance
3.2. Nutritional Patterns, Anthropometric and Physiological Assessments
3.3. Blood Biomarkers of Inflammation and Oxidative Stress
3.3.1. Cytokines
3.3.2. ESR and ROS Levels
3.3.3. WBC Count
3.4. Cholesterol Levels
3.5. HbA1c and eAG
3.6. Liver Enzymes
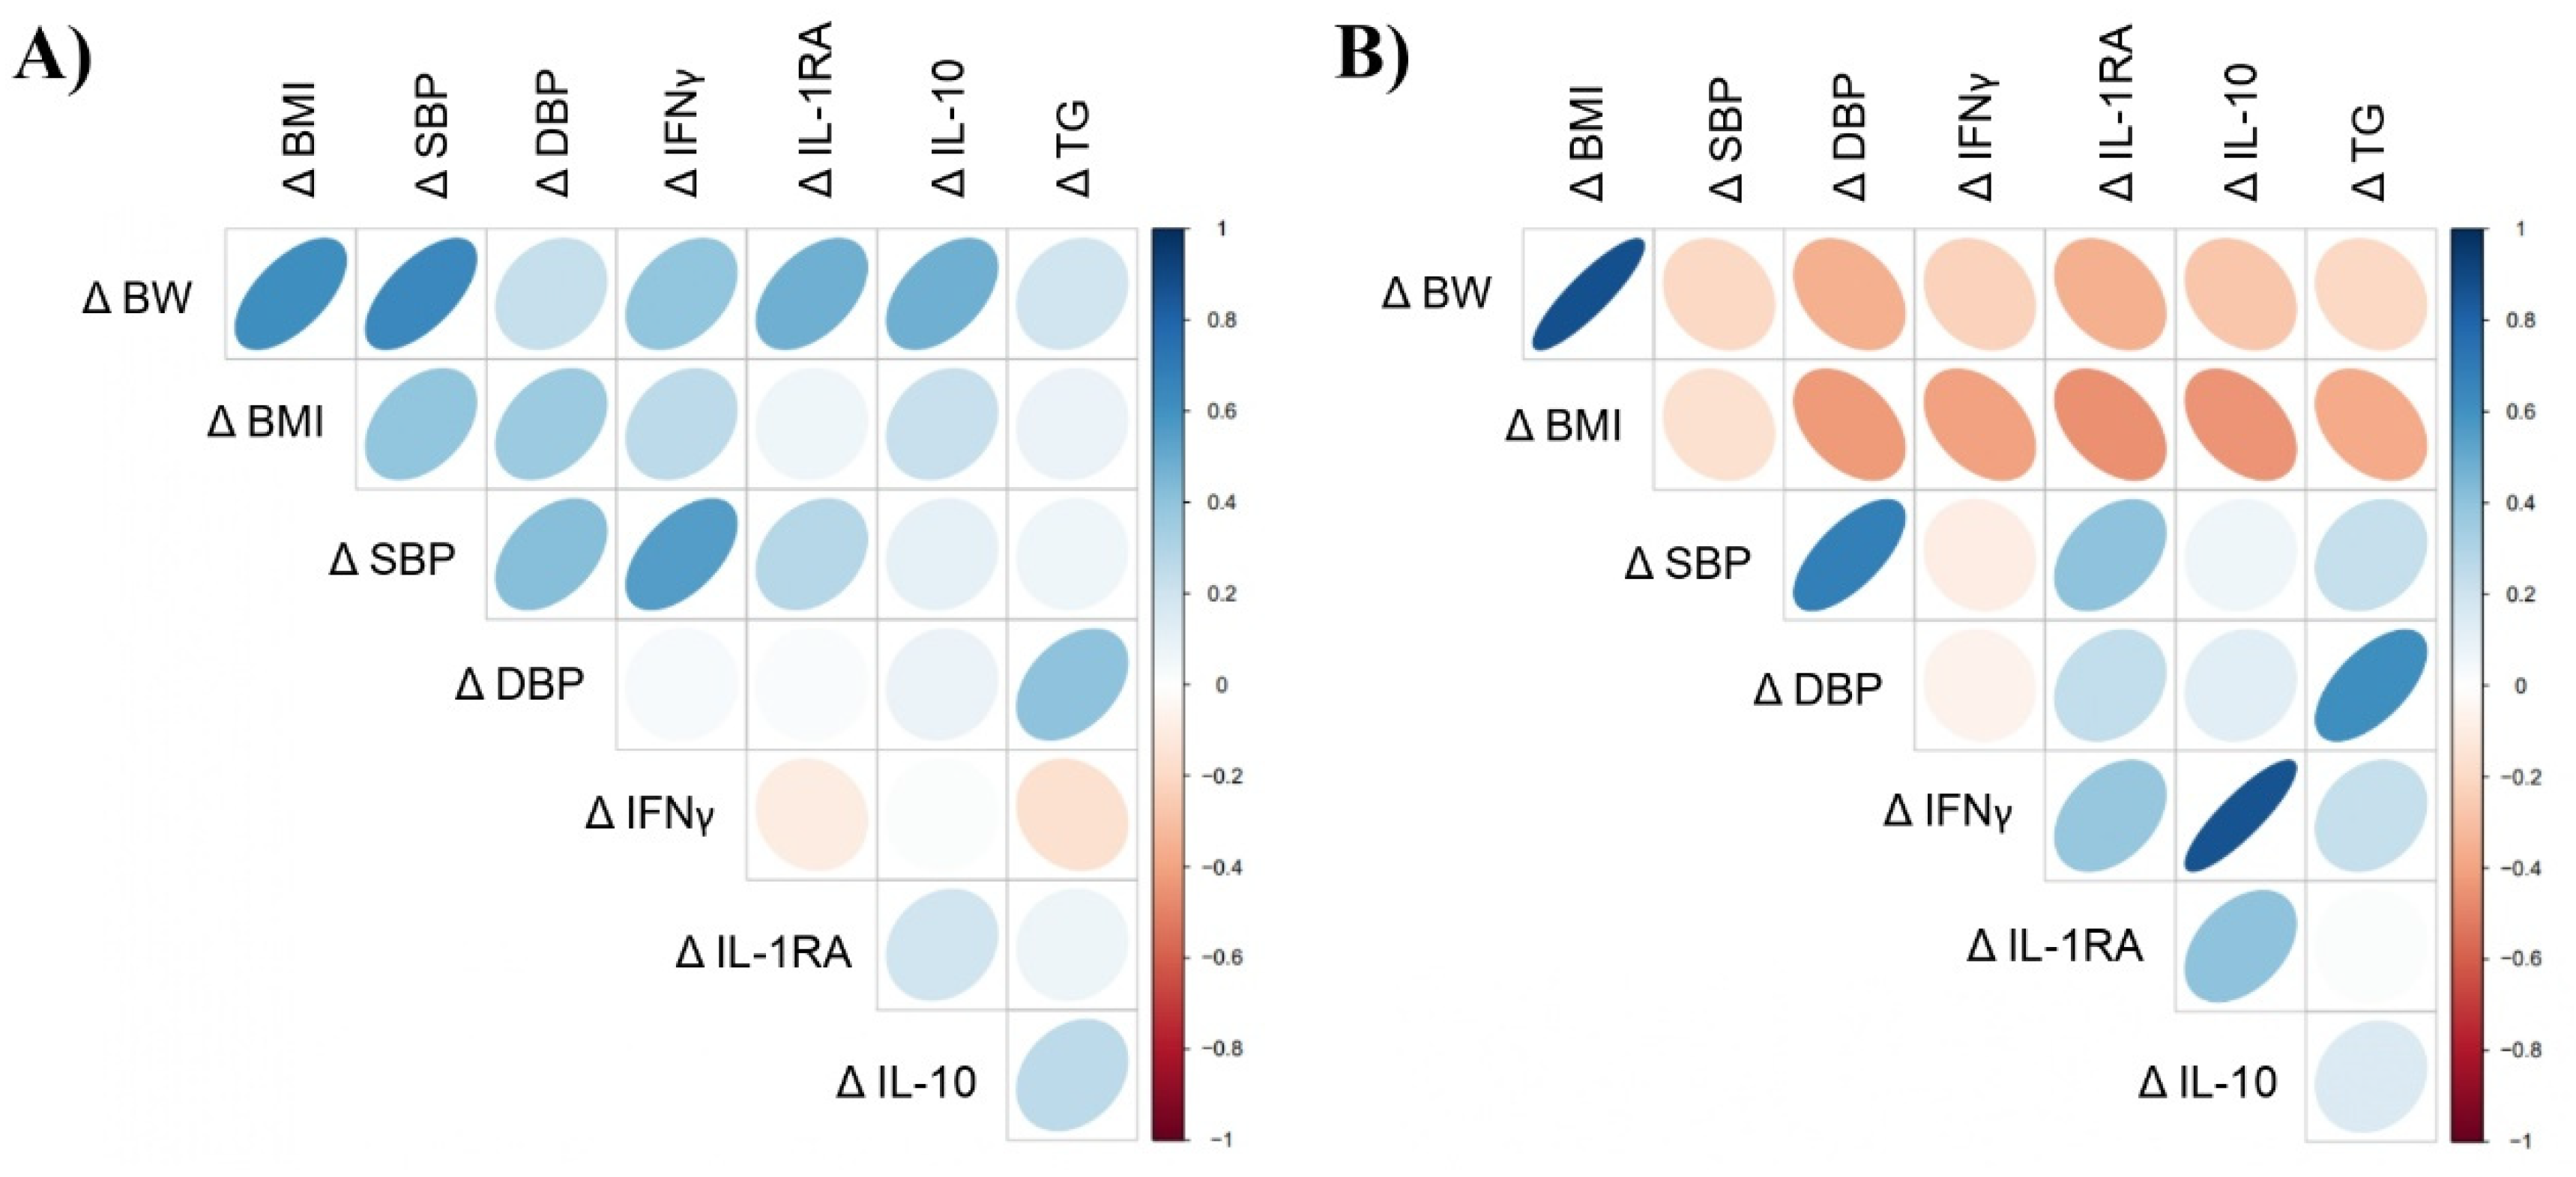
3.7. Correlation Analysis
4. Discussion
5. Conclusions
Supplementary Materials
Author Contributions
Funding
Institutional Review Board Statement
Informed Consent Statement
Data Availability Statement
Acknowledgments
Conflicts of Interest
References
- Blüher, M. Obesity: Global epidemiology and pathogenesis. Nat. Rev. Endocrinol. 2019, 15, 288–298. [Google Scholar] [CrossRef] [PubMed]
- Centers for Disease Control and Prevention. Nutrition, Physical Activity, and Obesity. Data, Trend and Maps. Available online: https://www.cdc.gov/nccdphp/dnpao/data-trends-maps/index.html (accessed on 31 October 2021).
- Andersen, C.J.; Murphy, K.E.; Fernandez, M.L. Impact of Obesity and Metabolic Syndrome on Immunity. Adv. Nutr. 2016, 7, 66–75. [Google Scholar] [CrossRef] [PubMed]
- Marseglia, L.; Manti, S.; D’Angelo, G.; Nicotera, A.G.; Parisi, E.; Di Rosa, G.; Gitto, E.; Arrigo, T. Oxidative Stress in Obesity: A Critical Component in Human Diseases. Int. J. Mol. Sci. 2014, 16, 378–400. [Google Scholar] [CrossRef] [PubMed]
- Calder, P.C.; Ahluwalia, N.; Brouns, F.; Buetler, T.; Clement, K.; Cunningham, K.; Esposito, K.; Jönsson, L.S.; Kolb, H.; Lansink, M.; et al. Dietary factors and low-grade inflammation in relation to overweight and obesity. Br. J. Nutr. 2011, 106 (Suppl. S3), S1–S78. [Google Scholar] [CrossRef] [PubMed]
- de Heredia, F.P.; Gómez-Martínez, S.; Marcos, A. Obesity, inflammation and the immune system. Proc. Nutr. Soc. 2012, 71, 332–338. [Google Scholar] [CrossRef]
- Sun, B.; Karin, M. Obesity, inflammation, and liver cancer. J. Hepatol. 2012, 56, 704–713. [Google Scholar] [CrossRef]
- Polyzos, S.A.; Kountouras, J.; Mantzoros, C.S. Obesity and nonalcoholic fatty liver disease: From pathophysiology to therapeutics. Metabolism 2019, 92, 82–97. [Google Scholar] [CrossRef]
- Ramírez-Moreno, E.; Arias-Rico, J.; Jiménez-Sánchez, R.C.; Estrada-Luna, D.; Jiménez-Osorio, A.S.; Zafra-Rojas, Q.Y.; Ariza-Ortega, J.A.; Flores-Chávez, O.R.; Morales-Castillejos, L.; Sandoval-Gallegos, E.M. Role of Bioactive Compounds in Obesity: Metabolic Mechanism Focused on Inflammation. Foods 2022, 11, 1232. [Google Scholar] [CrossRef]
- Fonseca, L.R.; Silva, G.R.; Luís, Â.; Cardoso, H.J.; Correia, S.; Vaz, C.V.; Duarte, A.P.; Socorro, S. Sweet cherries as anti-cancer agents: From bioactive compounds to function. Molecules 2021, 26, 2941. [Google Scholar] [CrossRef]
- Wu, T.; Tang, Q.; Yu, Z.; Gao, Z.; Hu, H.; Chen, W.; Zheng, X.; Yu, T. Inhibitory effects of sweet cherry anthocyanins on the obesity development in C57BL/6 mice. Int. J. Food Sci. Nutr. 2014, 65, 351–359. [Google Scholar] [CrossRef]
- Noratto, G.D.; Lage, N.N.; Chew, B.P.; Mertens-Talcott, S.U.; Talcott, S.T.; Pedrosa, M.L. Non-anthocyanin phenolics in cherry (Prunus avium L.) modulate IL-6, liver lipids and expression of PPARδ and LXRs in obese diabetic (db/db) mice. Food Chem. 2018, 266, 405–414. [Google Scholar] [CrossRef] [PubMed]
- Kelley, D.S.; Rasooly, R.; Jacob, R.A.; Kader, A.A.; Mackey, B.E. Consumption of Bing Sweet Cherries Lowers Circulating Concentrations of Inflammation Markers in Healthy Men and Women. J. Nutr. 2006, 136, 981–986. [Google Scholar] [CrossRef] [PubMed]
- Kelley, D.S.; Adkins, Y.; Reddy, A.; Woodhouse, L.R.; Mackey, B.E.; Erickson, K.L. Sweet bing cherries lower circulating concentrations of markers for chronic inflammatory diseases in healthy humans. J. Nutr. 2013, 143, 340–344. [Google Scholar] [CrossRef] [PubMed]
- Kent, K.; Charlton, K.E.; Jenner, A.; Roodenrys, S. Acute reduction in blood pressure following consumption of anthocyanin-rich cherry juice may be dose-interval dependant: A pilot cross-over study. Int. J. Food Sci. Nutr. 2016, 67, 47–52. [Google Scholar] [CrossRef] [PubMed]
- Lim, C.-Y.; In, J. Randomization in clinical studies. Korean J. Anesthesiol. 2019, 72, 221–232. [Google Scholar] [CrossRef]
- Krebs-Smith, S.M.; Pannucci, T.E.; Subar, A.F.; Kirkpatrick, S.I.; Lerman, J.L.; Tooze, J.A.; Wilson, M.M.; Reedy, J. Update of the Healthy Eating Index: HEI-2015. J. Acad. Nutr. Diet. 2018, 118, 1591–1602. [Google Scholar] [CrossRef]
- Ghanbari, M.; Momen Maragheh, S.; Aghazadeh, A.; Mehrjuyan, S.R.; Hussen, B.M.; Abdoli Shadbad, M.; Dastmalchi, N.; Safaralizadeh, R. Interleukin-1 in Obesity-Related Low-Grade Inflammation: From Molecular Mechanisms to Therapeutic Strategies. Int. Immunopharmacol. 2021, 96, 107765. [Google Scholar] [CrossRef]
- Frühbeck, G.; Catalán, V.; Ramírez, B.; Valentí, V.; Becerril, S.; Rodríguez, A.; Moncada, R.; Baixauli, J.; Silva, C.; Escalada, J.; et al. Serum Levels of IL-1 RA Increase with Obesity and Type 2 Diabetes in Relation to Adipose Tissue Dysfunction and are Reduced After Bariatric Surgery in Parallel to Adiposity. J. Inflamm. Res. 2022, 15, 1331–1345. [Google Scholar] [CrossRef]
- Esposito, K.; Pontillo, A.; Giugliano, F.; Giugliano, G.; Marfella, R.; Nicoletti, G.; Giugliano, D. Association of Low Interleukin-10 Levels with the Metabolic Syndrome in Obese Women. J. Clin. Endocrinol. Metab. 2003, 88, 1055–1058. [Google Scholar] [CrossRef]
- Leon-Cabrera, S.; Arana-Lechuga, Y.; Esqueda-León, E.; Terán-Pérez, G.; Gonzalez-Chavez, A.; Escobedo, G.; Moctezuma, J.V. Reduced Systemic Levels of IL-10 Are Associated with the Severity of Obstructive Sleep Apnea and Insulin Resistance in Morbidly Obese Humans. Mediat. Inflamm. 2015, 2015, 493409. [Google Scholar] [CrossRef] [PubMed]
- Panee, J. Monocyte Chemoattractant Protein 1 (MCP-1) in obesity and diabetes. Cytokine 2012, 60, 1–12. [Google Scholar] [CrossRef]
- Elyasi, A.; Voloshyna, I.; Ahmed, S.; Kasselman, L.J.; Behbodikhah, J.; De Leon, J.; Reiss, A.B. The role of interferon-γ in cardiovascular disease: An update. Inflamm. Res. 2020, 69, 975–988. [Google Scholar] [CrossRef] [PubMed]
- Castro, A.R.; Silva, S.O.; Soares, S.C. The Use of High Sensitivity C-Reactive Protein in Cardiovascular Disease Detection. J. Pharm. Pharm. Sci. 2018, 21, 496–503. [Google Scholar] [CrossRef]
- Choi, J.; Joseph, L.; Pilote, L. Obesity and C-reactive protein in various populations: A systematic review and meta-analysis. Obes. Rev. 2013, 14, 232–244. [Google Scholar] [CrossRef] [PubMed]
- Luan, Y.-Y.; Yao, Y.-M. The clinical significance and potential role of C-reactive protein in chronic inflammatory and neuro-degenerative diseases. Front. Immunol. 2018, 9, 1302. [Google Scholar] [CrossRef] [PubMed]
- Alende-Castro, V.; Alonso-Sampedro, M.; Vazquez-Temprano, N.; Tuñez, C.; Rey, D.; García-Iglesias, C.; Sopeña, B.; Gude, F.; Gonzalez-Quintela, A. Factors influencing erythrocyte sedimentation rate in adults: New evidence for an old test. Medicine 2019, 98, e16816. [Google Scholar] [CrossRef]
- McMurray, F.; Patten, D.A.; Harper, M.E. Reactive oxygen species and oxidative stress in obesity—Recent findings and empirical approaches. Obesity 2016, 24, 2301–2310. [Google Scholar] [CrossRef]
- Gu, Y.; Hu, K.; Huang, Y.; Zhang, Q.; Liu, L.; Meng, G.; Wu, H.; Xia, Y.; Bao, X.; Shi, H.; et al. White blood cells count as an indicator to identify whether obesity leads to increased risk of type 2 diabetes. Diabetes Res. Clin. Pract. 2018, 141, 140–147. [Google Scholar] [CrossRef]
- Ribeiro, I.S.; Pereira, Í.S.; Santos, D.P.; Lopes, D.N.; Prado, A.O.; Calado, S.P.; Gonçalves, C.V.; Galantini, M.P.; Muniz, I.P.; Santos, G.S.; et al. Association between body composition and inflammation: A central role of IL-17 and IL-10 in diabetic and hypertensive elderly women. Exp. Gerontol. 2019, 127, 110734. [Google Scholar] [CrossRef] [PubMed]
- Chai, S.C.; Davis, K.; Wright, R.S.; Kuczmarski, M.F.; Zhang, Z. Impact of tart cherry juice on systolic blood pressure and low-density lipoprotein cholesterol in older adults: A randomized controlled trial. Food Funct. 2018, 9, 3185–3194. [Google Scholar] [CrossRef]
- Yahfoufi, N.; Alsadi, N.; Jambi, M.; Matar, C. The Immunomodulatory and Anti-Inflammatory Role of Polyphenols. Nutrients 2018, 10, 1618. [Google Scholar] [CrossRef]
- Ouyang, W.; Rutz, S.; Crellin, N.K.; Valdez, P.A.; Hymowitz, S.G. Regulation and Functions of the IL-10 Family of Cytokines in Inflammation and Disease. Annu. Rev. Immunol. 2011, 29, 71–109. [Google Scholar] [CrossRef] [PubMed]
- Kim, H.; Simbo, S.Y.; Fang, C.; McAlister, L.; Roque, A.; Banerjee, N.; Talcott, S.T.; Zhao, H.; Kreider, R.B.; Mertens-Talcott, S.U. Açaí (Euterpe oleracea Mart.) beverage consumption improves biomarkers for inflammation but not glucose-or lipid-metabolism in individuals with metabolic syndrome in a randomized, double-blinded, placebo-controlled clinical trial. Food Funct. 2018, 9, 3097–3103. [Google Scholar] [CrossRef] [PubMed]
- Ebrahimi, M.; Heidari-Bakavoli, A.R.; Shoeibi, S.; Mirhafez, S.R.; Moohebati, M.; Esmaily, H.; Ghazavi, H.; Karimian, M.S.; Parizadeh, S.M.R.; Mohammadi, M.; et al. Association of Serum hs-CRP Levels with the Presence of Obesity, Diabetes Mellitus, and Other Cardiovascular Risk Factors. J. Clin. Lab. Anal. 2016, 30, 672–676. [Google Scholar] [CrossRef] [PubMed]
- Kent, K.; Charlton, K.; Roodenrys, S.; Batterham, M.; Potter, J.; Traynor, V.; Gilbert, H.; Morgan, O.; Richards, R. Consumption of anthocyanin-rich cherry juice for 12 weeks improves memory and cognition in older adults with mild-to-moderate dementia. Eur. J. Nutr. 2017, 56, 333–341. [Google Scholar] [CrossRef] [PubMed]
- Vargas, A.J.; McDonnell, L.N.; Liu, Z.; Wertheim, B.C.; Thomson, C.A.; Thompson, P.A. A pilot sweet cherry feeding study in overweight men: Tolerance, safety, and anthocyanin exposure. J. Funct. Foods 2014, 11, 500–508. [Google Scholar] [CrossRef]
- Chai, S.C.; Davis, K.; Zhang, Z.; Zha, L.; Kirschner, K.F. Effects of Tart Cherry Juice on Biomarkers of Inflammation and Oxidative Stress in Older Adults. Nutrients 2019, 11, 228. [Google Scholar] [CrossRef]
- Martin, K.R.; Burrell, L.; Bopp, J. Authentic tart cherry juice reduces markers of inflammation in overweight and obese subjects: A randomized, crossover pilot study. Food Funct. 2018, 9, 5290–5300. [Google Scholar] [CrossRef]
- Kimble, R.; Keane, K.M.; Lodge, J.K.; Howatson, G. The influence of tart cherry (Prunus cerasus, cv montmorency) concentrate supplementation for 3 months on cardiometabolic risk factors in middle-aged adults: A randomised, placebo-controlled trial. Nutrients 2021, 13, 1417. [Google Scholar] [CrossRef] [PubMed]
- Kelley, D.S.; Adkins, Y.; Laugero, K.D. A Review of the Health Benefits of Cherries. Nutrients 2018, 10, 368. [Google Scholar] [CrossRef]
- Tishkowski, K.; Gupta, V. Erythrocyte Sedimentation Rate. Available online: https://www.ncbi.nlm.nih.gov/books/NBK557485/ (accessed on 15 March 2022).
- El-Mikkawy, D.M.E.; El-Sadek, M.A.; El-Badawy, M.A.; Samaha, D. Circulating level of interleukin-6 in relation to body mass indices and lipid profile in Egyptian adults with overweight and obesity. Egypt. Rheumatol. Rehabil. 2020, 47, 7. [Google Scholar] [CrossRef]
- Travis, O.K.; Tardo, G.A.; Giachelli, C.; Siddiq, S.; Nguyen, H.T.; Crosby, M.T.; Johnson, T.D.; Brown, A.K.; Booz, G.W.; Smith, A.N.; et al. Interferon γ neutralization reduces blood pressure, uterine artery resistance index, and placental oxidative stress in placental ischemic rats. Am. J. Physiol. Regul. Integr. Comp. Physiol. 2021, 321, R112–R124. [Google Scholar] [CrossRef]
- Johnson, S.A.; Navaei, N.; Pourafshar, S.; Jaime, S.J.; Akhavan, N.S.; Alvarez-Alvarado, S.; Proaño, G.V.; Litwin, N.S.; Clark, E.A.; Foley, E.M.; et al. Effects of montmorency Tart Cherry juice consumption on cardiometabolic biomarkers in adults with metabolic syndrome: A randomized controlled pilot trial. J. Med. Food 2020, 23, 1238–1247. [Google Scholar] [CrossRef] [PubMed]
- Eslami, O.; Khorramrouz, F.; Fatahi, S.; Sohouli, M.H.; Shidfar, F. A systematic review and meta-analysis of cherry (Prunus spp.) consumption on glycemic markers and lipid profile. Obes. Med. 2021, 30, 100388. [Google Scholar] [CrossRef]
- Song, H.; Wu, T.; Xu, D.; Chu, Q.; Lin, D.; Zheng, X. Dietary sweet cherry anthocyanins attenuates diet-induced hepatic steatosis by improving hepatic lipid metabolism in mice. Nutrition 2016, 32, 827–833. [Google Scholar] [CrossRef] [PubMed]
- Dziadek, K.; Kopeć, A.; Piątkowska, E. Intake of fruit and leaves of sweet cherry beneficially affects lipid metabolism, oxidative stress and inflammation in Wistar rats fed with high fat-cholesterol diet. J. Funct. Foods 2019, 57, 31–39. [Google Scholar] [CrossRef]
- Yang, L.; Ling, W.; Du, Z.; Chen, Y.; Li, D.; Deng, S.; Liu, Z.; Yang, L. Effects of Anthocyanins on Cardiometabolic Health: A Systematic Review and Meta-Analysis of Randomized Controlled Trials. Adv. Nutr. 2017, 8, 684–693. [Google Scholar] [CrossRef]
- MedlinePlus (Internet). Bethesda (MD): National Library of Medicine (US). Cholesterol Levels: What You Need to Know. Available online: https://medlineplus.gov/cholesterollevelswhatyouneedtoknow.html (accessed on 15 March 2022).
- MedlinePlus (Internet). Bethesda (MD): National Library of Medicine. Triglycerides. Available online: https://medlineplus.gov/triglycerides.html (accessed on 15 March 2022).
- World Health Organization (WHO). Healthy Diet: Key Facts. 2020. Available online: https://www.who.int/news-room/fact-sheets/detail/healthy-diet (accessed on 29 October 2022).
- Farnier, M.; Zeller, M.; Masson, D.; Cottin, Y. Triglycerides and risk of atherosclerotic cardiovascular disease: An update. Arch. Cardiovasc. Dis. 2021, 114, 132–139. [Google Scholar] [CrossRef] [PubMed]
- Lachin, T. Effect of antioxidant extract from cherries on diabetes. Recent Patents Endocrine, Metab. Immune Drug Discov. 2014, 8, 67–74. [Google Scholar] [CrossRef]
- Saleh, F.A.; El-Darra, N.; Raafat, K. Hypoglycemic effects of Prunus cerasus L. pulp and seed extracts on Alloxan-Induced Diabetic Mice with histopathological evaluation. Biomed. Pharmacother. 2017, 88, 870–877. [Google Scholar] [CrossRef]
- MedlinePlus (Internet). Bethesda (MD): National Library of Medicine. Estimated Average Glucose (eAG). Available online: https://medlineplus.gov/ency/patientinstructions/000966.htm (accessed on 15 March 2022).
- Lala, V.; Zubair, M.; Minter, D.A. Liver Function Tests. Available online: https://www.ncbi.nlm.nih.gov/books/NBK482489/ (accessed on 15 March 2022).
- Abenavoli, L.; Larussa, T.; Corea, A.; Procopio, A.; Boccuto, L.; Dallio, M.; Federico, A.; Luzza, F. Dietary Polyphenolsand Non-Alcoholic Fatty Liver Disease. Nutrients 2021, 13, 494. [Google Scholar] [CrossRef] [PubMed]
- Rosas, M.; Pinneo, S.; O’Mealy, C.; Tsang, M.; Liu, C.; Kern, M.; Hooshmand, S.; Hong, M.Y. Effects of fresh mango consumption on cardiometabolic risk factors in overweight and obese adults. Nutr. Metab. Cardiovasc. Dis. 2022, 32, 494–503. [Google Scholar] [CrossRef] [PubMed]
- Kelley, D.S.; Adkins, Y.C.; Zunino, S.J.; Woodhouse, L.R.; Bonnel, E.L.; Breksa III, A.P.; Manners, G.D.; Mackey, B.E. Citrus limonin glucoside supplementation decreased biomarkers of liver disease and inflammation in overweight human adults. J. Funct. Foods 2015, 12, 271–281. [Google Scholar] [CrossRef]
- Faghihzadeh, F.; Adibi, P.; Hekmatdoost, A. The effects of resveratrol supplementation on cardiovascular risk factors in patients with non-alcoholic fatty liver disease: A randomised, double-blind, placebo-controlled study. Br. J. Nutr. 2015, 114, 796–803. [Google Scholar] [CrossRef]
- Mirmiran, P.; Esmaillzadeh, A.; Azizi, F. Under-reporting of energy intake affects estimates of nutrient intakes. Asia Pac. J. Clin. Nutr. 2006, 15, 459–464. [Google Scholar]
- Cӑtoi, A.F.; Pârvu, A.E.; Andreicuț, A.D.; Mironiuc, A.; Crӑciun, A.; Cӑtoi, C.; Pop, I.D. Metabolically Healthy versus Unhealthy Morbidly Obese: Chronic Inflammation, Nitro-Oxidative Stress, and Insulin Resistance. Nutrients 2018, 10, 1199. [Google Scholar] [CrossRef]
- Abderrahim, F.; Huanatico, E.; Repo-Carrasco-Valencia, R.; Arribas, S.M.; Gonzalez, M.C.; Condezo-Hoyos, L. Effect of germination on total phenolic compounds, total antioxidant capacity, Maillard reaction products and oxidative stress markers in canihua (Chenopodium pallidicaule). J. Cereal Sci. 2012, 56, 410–417. [Google Scholar] [CrossRef]
- Lage, N.N.; Layosa, M.A.A.; Arbizu, S.; Chew, B.P.; Pedrosa, M.L.; Mertens-Talcott, S.; Talcott, S.; Noratto, G.D. Dark sweet cherry (Prunus avium) phenolics enriched in anthocyanins exhibit enhanced activity against the most aggressive breast cancer subtypes without toxicity to normal breast cells. J. Funct. Foods 2020, 64, 103710. [Google Scholar] [CrossRef]
- Giusti, M.M.; Wrolstad, R.E. Characterization and Measurement of Anthocyanins by UV-Visible Spectroscopy. Curr. Protoc. Food Anal. Chem. 2001, 1, F1.2.1–F1.2.13. [Google Scholar] [CrossRef]


| Variable | Day | Treatment | Mixed Effect Model p Values | Sliced by Treatment and/or Time Point | |||
|---|---|---|---|---|---|---|---|
| Cherry (n = 19) | Placebo (n = 21) | Trt. | Day | Trtxday | |||
| BW (kg) | D1 | 94.26 (88.37, 100.16) | 93.80 (87.41, 100.18) X | 0.91 | 0.003 | 0.26 | Placebo (p = 0.0002) ↑ D30 |
| D15 | 93.75 (87.49, 100.01) n = 17 | 94.69 (87.93, 101.45) n = 20 | |||||
| D30 | 94.71 (88.80, 100.63) | 94.86 (88.14, 101.58) Y | |||||
| BMI (kg/m2) | D1 | 33.55 (32.16, 34.94) | 33.05 (31.87, 34.22) X | 0.69 | 0.01 | 0.30 | Placebo (p = 0.006) ↑ D30 |
| D15 | 33.58 (33.89, 33.28) (n = 16) | 33.16 (31.93, 34.39) n = 20 | |||||
| D30 | 33.68 (32.25, 35.11) | 33.47 (32.29, 34.64) Y | |||||
| BF (%) | D1 | 33.68 (30.31, 37.05) | 36.03 (33.74, 38.32) | 0.25 | 0.56 | 0.45 | NS |
| D15 | 34.88 (31.27, 38.49) n = 16 | 35.63 (33.38, 37.88) n = 20 | |||||
| D30 | 33.92 (30.75, 37.09) | 36.07 (33.96, 38.17) | |||||
| WC (cm) | D1 | 102.08 (96.51, 107.65) n = 16 | 101.81 (95.6,2 108.00) n = 17 | 0.83 | 0.68 | 0.46 | NS |
| D15 | 101.86 (96.66, 107.07) n = 17 | 100.54 (95.86, 105.21) n = 19 | |||||
| D30 | 101.47 (96.38, 106.56) n = 19 | 101.76 (96.35, 107.17) n = 21 | |||||
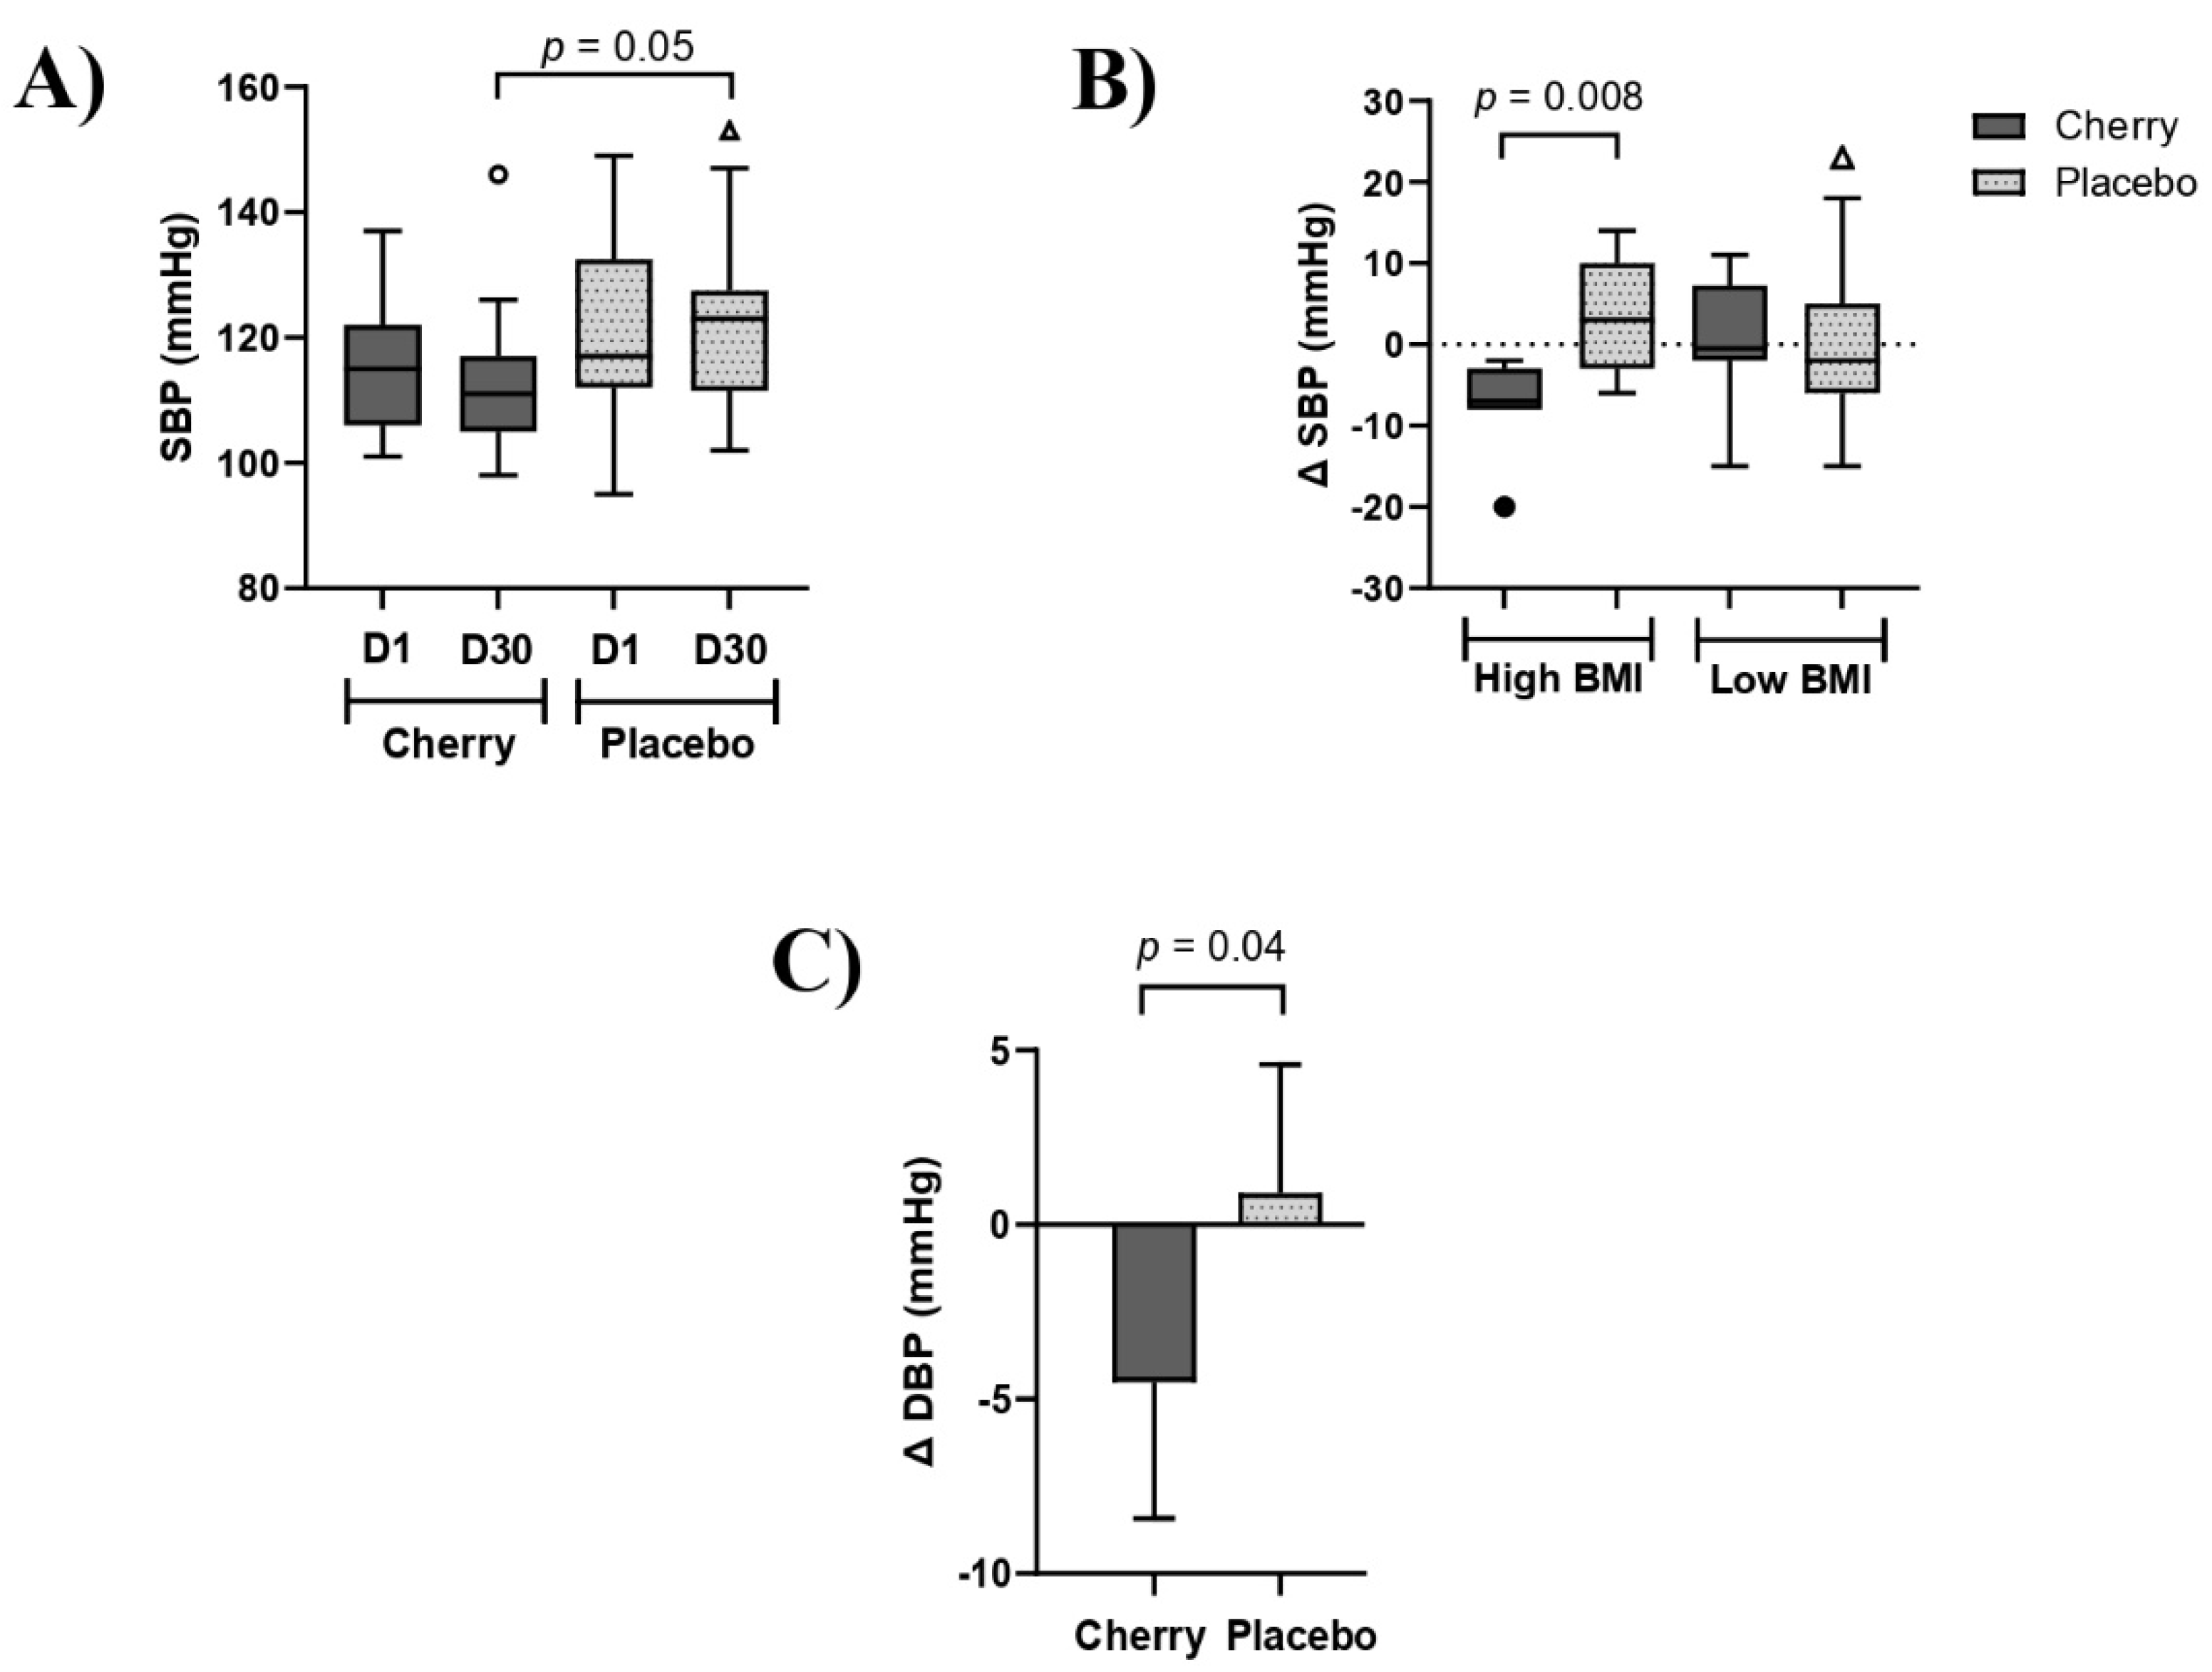
| SBP (mmHg) | D1 | 115.32 (110.20, 120.43) | 121.43 (114.82, 128.04) | 0.03 | 0.23 | 0.49 | Cherry vs. Placebo D30 (p = 0.05) |
| D15 | 112.00 (104.18, 119.82) n = 16 | 120.20 (115.19, 125.21) n = 20 | |||||
| D30 | 112.84 (107.57, 118.11) A | 122.33 (116.47, 128.20) B | |||||
| DBP (mmHg) | D1 | 77.53 (73.40, 81.65) A | 83.95 (79.88, 88.02) B | 0.007 | 0.32 | 0.26 | Cherry vs. Placebo D1 (p = 0.05) Cherry vs. Placebo D30 (p = 0.005) |
| D15 | 77.31 (72.26, 82.36) n = 16 | 81.50 (78.28, 84.72) n = 20 | |||||
| D30 | 74.63 (70.60, 78.66) A | 83.38 (79.07, 87.69) B | |||||
| HR (bpm) | D1 | 73.05 (65.45, 80.66) | 73.00 (69.36, 76.64) | 0.80 | 0.03 | 0.52 | Placebo (p = 0.04) ↑ D30 |
| D15 | 71.50 (66.04, 76.96) n = 16 | 72.42 (68.09, 76.75) X n = 19 | |||||
| D30 | 74.79 (68.58, 81.00) | 77.52 (72.81, 82.24) Y | |||||
| OS (SpO2%) | D1 | 97.05 (96.11, 98.00) | 97.38 (96.78, 97.98) | 0.77 | 0.99 | 0.06 | NS |
| D15 | 97.33 (96.14, 98.53) n = 15 | 97.42 (96.93, 95.00) n = 19 | |||||
| D30 | 97.58 (97.12, 98.04) | 96.62 (95.00, 98.24) | |||||
| Variable | Day | Treatment | 2-Way ANOVA p Values | Sliced by Treatment and/or Time Point | |||
|---|---|---|---|---|---|---|---|
| Cherry (n = 19) | Placebo (n = 21) | Trt. | Day | Trtxday | |||
| Inflammatory cytokines | |||||||
| IL–1RA (pg/mL) | D1 | 10.18 (3.27, 17.09) n = 18 | 11.09 (8.15, 14.03) X n = 20 | 0.72 | 0.01 | 0.10 | Placebo (p = 0.002) ↓ D30 |
| D15 | 10.55 (3.92, 17.18) n = 14 | 8.22 (5.55, 10.88) n = 16 | |||||
| D30 | 8.51 (3.81, 13.21) n = 18 | 7.00 (5.04, 8.97) Y n = 20 | |||||
| IL–18 (pg/mL) | D1 | 29.58 (20.12, 39.03) n = 19 | 28.81 (17.12, 40.49) | 0.45 | 0.13 | 0.20 | NS |
| D15 | 25.77 (16.90, 34.64) n = 16 | 18.09 (13.24, 22.93) n = 16 | |||||
| D30 | 29.40 (19.83, 38.96) n = 18 | 23.44 (15.77, 31.12) | |||||
| TNF–α (pg/mL) | D1 | 21.96 (15.88, 28.05) n = 19 | 29.00 (21.88, 36.11) | 0.84 | 0.40 | 0.11 | NS |
| D15 | 28.35 (20.87, 35.82) n = 17 | 24.07 (18.18, 29.96) n = 18 | |||||
| D30 | 23.17 (17.29, 29.05) n = 18 | 22.94 (17.32, 28.57) | |||||
| RANTES (ng/mL) | D1 | 82.14 (39.08, 125.20) n = 15 | 97.76 (62.13, 133.39) n = 15 | 0.69 | 0.63 | 0.77 | NS |
| D15 | 98.59 (52.15, 145.03) n = 13 | 94.51 (42.33, 146.70) n = 12 | |||||
| D30 | 76.10 (48.66, 103.55) n = 15 | 87.77 (60.04, 115.50) n = 15 | |||||
| IL-6 (pg/mL) | D1 | 9.70 (1.76, 17.65) n = 14 | 35.55 (−3.03, 74.15) n = 15 | 0.82 | 0.32 | 0.50 | NS |
| D15 | 7.12 (0.13, 14.12) n = 12 | 39.11 (−4.19, 82.42) n = 13 | |||||
| D30 | 7.08 (1.75, 12.42) n = 14 | 31.87 (2.80, 66.53) n = 15 | |||||
| IL-10 (pg/mL) | D1 | 9.41 (6.52, 12.31) n = 17 | 9.07 (6.28, 11.86) X | 0.31 | 0.0005 | <0.0001 | Cherry vs. Placebo D30 (p = 0.04) Placebo (p = <0.0001) ↑ D30 |
| D30 | 8.62 (6.36, 10.87) A n = 17 | 15.25 (10.97, 19.52) B,Y | |||||
| MCP-1 (pg/mL) | D1 | 297.11 (254.83, 339.39) n = 18 | 261.04 (221.94, 300.15) | 0.53 | 0.43 | 0.03 | NS |
| D30 | 282.06 (237.62, 326.52) n = 18 | 298.99 (238.69, 359.29) | |||||
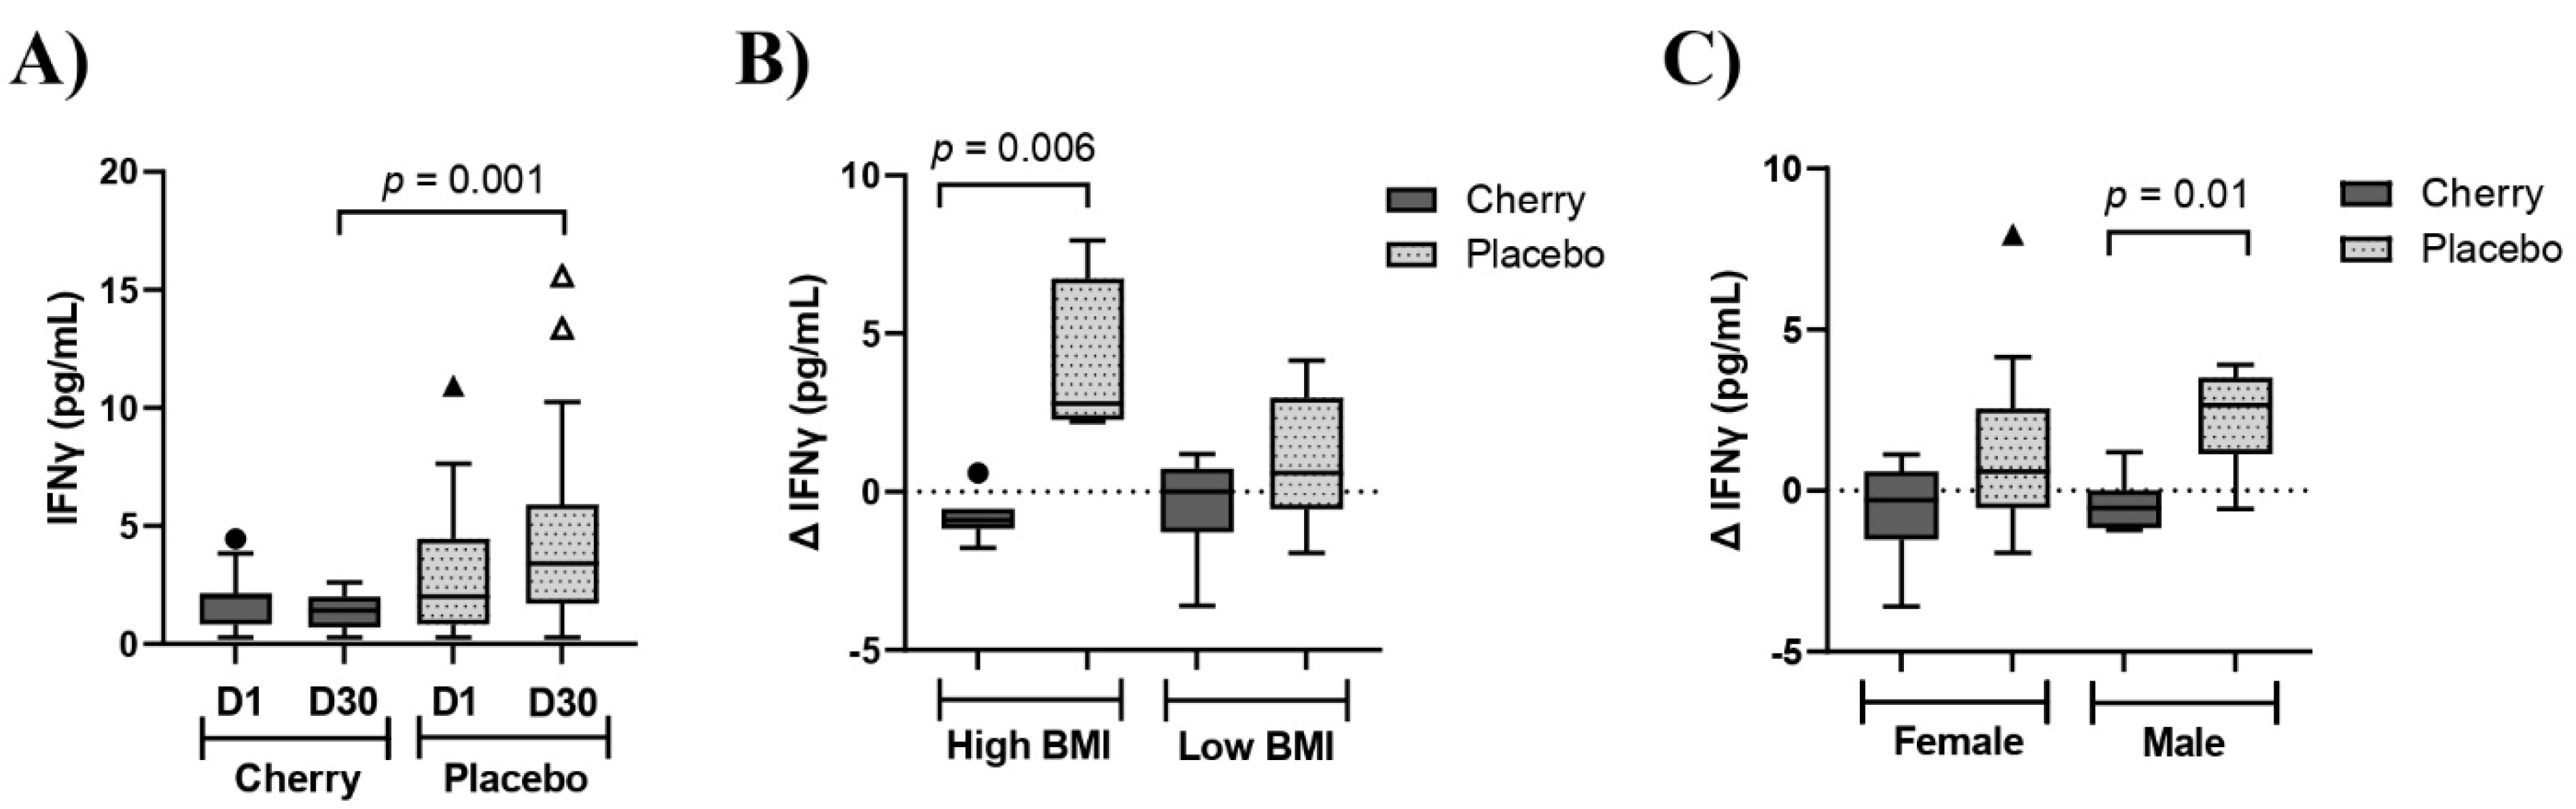
| IFNγ (pg/mL) | D1 | 1.80 (1.22, 2.38) n = 17 | 3.00 (1.49, 4.76) n = 15 | 0.01 | 0.68 | 0.01 | Cherry vs. Placebo D30 (p = 0.001) |
| D30 | 1.31 (0.89, 1.73) A n = 17 | 4.76 (2.48, 7.03) B n = 15 | |||||
| IL-1β (pg/mL) | D1 | 0.69 (0.43, 0.94) A n = 18 | 2.02 (0.83, 3.22) B n = 14 | 0.02 | 0.15 | 0.75 | Cherry vs. Placebo D1 (p = 0.05) D30 (p = 0.03) |
| D30 | 0.55 (0.34, 0.76) A n = 18 | 2.30 (0.77, 3.83) B n = 14 | |||||
| Inflammatory markers | |||||||
| ESR (mm/hr) | D1 | 11.8 (6.7, 16.8) n = 18 | 11.5 (6.9, 16.1) n = 20 | 0.97 | 0.71 | 0.93 | NS |
| D30 | 10.7 (7.9, 13.5) n = 18 | 12.3 (9.6, 14.9) n = 20 | |||||
| CRP (*) | D15 | 2.27 (1.38, 3.16) n = 14 | 1.51 (0.85, 2.17) n = 13 | 0.65 | 0.45 | 0.02 | NS |
| D30 | 1.61 (1.00, 2.23) n = 17 | 2.80 (1.40, 4.20) n = 15 | |||||
| Oxidative stress | |||||||
| ROS/Hb (RFU/mg) | D1 | 1.21 × 10⁵ (0.78, 1.32 × 10⁵) n = 18 | 1.27 × 10⁵ (0.83, 1.70 × 10⁵) X | 0.72 | 0.04 | 0.43 | Placebo (p = 0.03) ↓ D15 |
| D15 | 1.08 × 10⁵ (0.83, 1.32 × 10⁵) n = 16 | 0.85 × 10⁵ (0.62, 1.09 × 10⁵) Y n = 18 | |||||
| D30 | 1.01 × 10⁵ (0.77, 1.24 × 10⁵) n = 18 | 0.96 × 10⁵ (0.75, 1.18 × 10⁵) | |||||
| Variable | Day | Treatment | 2-Way ANOVA p Values | Sliced by Treatment and/or Time Point | |||
|---|---|---|---|---|---|---|---|
| Cherry (n = 19) | Placebo (n = 21) | Trt. | Day | Trtxday | |||
| Lipid profile | |||||||
| TC (mg/dL) | D1 | 180.12 (168.35, 191.88) n = 17 | 177.65 (161.66, 193.64) n = 20 | 0.79 | 0.08 | 0.93 | NS |
| D30 | 184.41 (172.23, 196.59) n = 17 | 181.55 (163.48, 199.62) n = 20 | |||||
| TG (mg/dL) | D1 | 97.47 (72.20, 122.73) X n = 17 | 110.00 (86.74, 133.26) X n = 20 | 0.56 | 0.0003 | 0.56 | Cherry (p = 0.006) ↑ D30 Placebo (p = 0.02) ↑ D30 |
| D30 | 123.59 (87.82, 159.35) Y n = 17 | 131.20 (99.78, 162.62) Y n = 20 | |||||
| HDL (mg/dL) | D1 | 46.24 (40.10, 52.37) n = 17 | 48.70 (44.40, 53.00) n = 20 | 0.54 | 0.51 | 0.67 | NS |
| D30 | 46.00 (39.70, 52.30) n = 17 | 47.60 (43.43, 51.77) n = 20 | |||||
| LDL (mg/dL) | D1 | 114.71 (102.93, 126.48) n = 17 | 108.80 (95.67, 121.92) n = 20 | 0.48 | 0.47 | 0.99 | NS |
| D30 | 116.00 (104.25, 127.75) n = 17 | 110.05 (96.86, 123.24) n = 20 | |||||
| Non-HDL (mg/dL) | D1 | 132.71 (118.72, 146.69) n = 17 | 128.95 (113.73, 114.17) n = 20 | 0.68 | 0.01 | 0.85 | NS |
| D30 | 138.41 (124.67, 152.16) n = 17 | 135.95 (116.95, 150.95) n = 20 | |||||
| Hemoglobin A1c and glucose | |||||||
| HbA1c (%) | D1 | 5.40 (5.22, 5.58) n = 18 | 5.52 (5.30, 5.75) | 0.39 | 0.12 | 0.79 | NS |
| D30 | 5.43 (5.26, 5.61) n = 18 | 5.55 (5.33, 5.77) | |||||
| eAG (mg/dL) | D1 | 108.44 (103.21, 113.68) n = 18 | 112.00 (105.49, 118.51) | 0.39 | 0.13 | 0.79 | NS |
| D30 | 109.39 (104.41, 114.37) n = 18 | 112.67 (106.37, 118.97) | |||||
| Liver enzymes | |||||||
| APh (IU/L) | D1 | 71.07 (63.93, 78.22) n = 14 | 83.13 (67.84, 98.41) n = 16 | 0.13 | 0.41 | 0.43 | NS |
| D30 | 71.14 (63.08, 79.21) n = 14 | 85.63 (68.50, 102.70) n = 16 | |||||
| AST (IU/L) | D1 | 23.53 (16.83, 30.23) n = 17 | 19.95 (17.97, 21.92) n = 19 | 0.28 | 0.95 | 0.58 | NS |
| D30 | 23.82 (17.17, 30.48) n = 17 | 19.58 (17.57, 21.59) n = 19 | |||||
| ALT (IU/L) | D1 | 25.06 (16.19, 33.93) n = 16 | 20.05 (16.18, 23.92) n = 19 | 0.20 | 0.72 | 0.28 | NS |
| D30 | 26.06 (17.35, 34.77) n = 16 | 19.32 (15.57, 23.06) n = 19 | |||||
Disclaimer/Publisher’s Note: The statements, opinions and data contained in all publications are solely those of the individual author(s) and contributor(s) and not of MDPI and/or the editor(s). MDPI and/or the editor(s) disclaim responsibility for any injury to people or property resulting from any ideas, methods, instructions or products referred to in the content. |
© 2023 by the authors. Licensee MDPI, Basel, Switzerland. This article is an open access article distributed under the terms and conditions of the Creative Commons Attribution (CC BY) license (https://creativecommons.org/licenses/by/4.0/).
Share and Cite
Arbizu, S.; Mertens-Talcott, S.U.; Talcott, S.; Noratto, G.D. Dark Sweet Cherry (Prunus avium) Supplementation Reduced Blood Pressure and Pro-Inflammatory Interferon Gamma (IFNγ) in Obese Adults without Affecting Lipid Profile, Glucose Levels and Liver Enzymes. Nutrients 2023, 15, 681. https://doi.org/10.3390/nu15030681
Arbizu S, Mertens-Talcott SU, Talcott S, Noratto GD. Dark Sweet Cherry (Prunus avium) Supplementation Reduced Blood Pressure and Pro-Inflammatory Interferon Gamma (IFNγ) in Obese Adults without Affecting Lipid Profile, Glucose Levels and Liver Enzymes. Nutrients. 2023; 15(3):681. https://doi.org/10.3390/nu15030681
Chicago/Turabian StyleArbizu, Shirley, Susanne U. Mertens-Talcott, Stephen Talcott, and Giuliana D. Noratto. 2023. "Dark Sweet Cherry (Prunus avium) Supplementation Reduced Blood Pressure and Pro-Inflammatory Interferon Gamma (IFNγ) in Obese Adults without Affecting Lipid Profile, Glucose Levels and Liver Enzymes" Nutrients 15, no. 3: 681. https://doi.org/10.3390/nu15030681
APA StyleArbizu, S., Mertens-Talcott, S. U., Talcott, S., & Noratto, G. D. (2023). Dark Sweet Cherry (Prunus avium) Supplementation Reduced Blood Pressure and Pro-Inflammatory Interferon Gamma (IFNγ) in Obese Adults without Affecting Lipid Profile, Glucose Levels and Liver Enzymes. Nutrients, 15(3), 681. https://doi.org/10.3390/nu15030681