
Effectiveness of Time-Restricted Eating with Caloric Restriction vs. Caloric Restriction for Weight Loss and Health: Meta-Analysis


Abstract
:1. Introduction
2. Materials and Methods
2.1. Search Strategy
2.2. Study Selection
2.3. Data Extraction and Collection
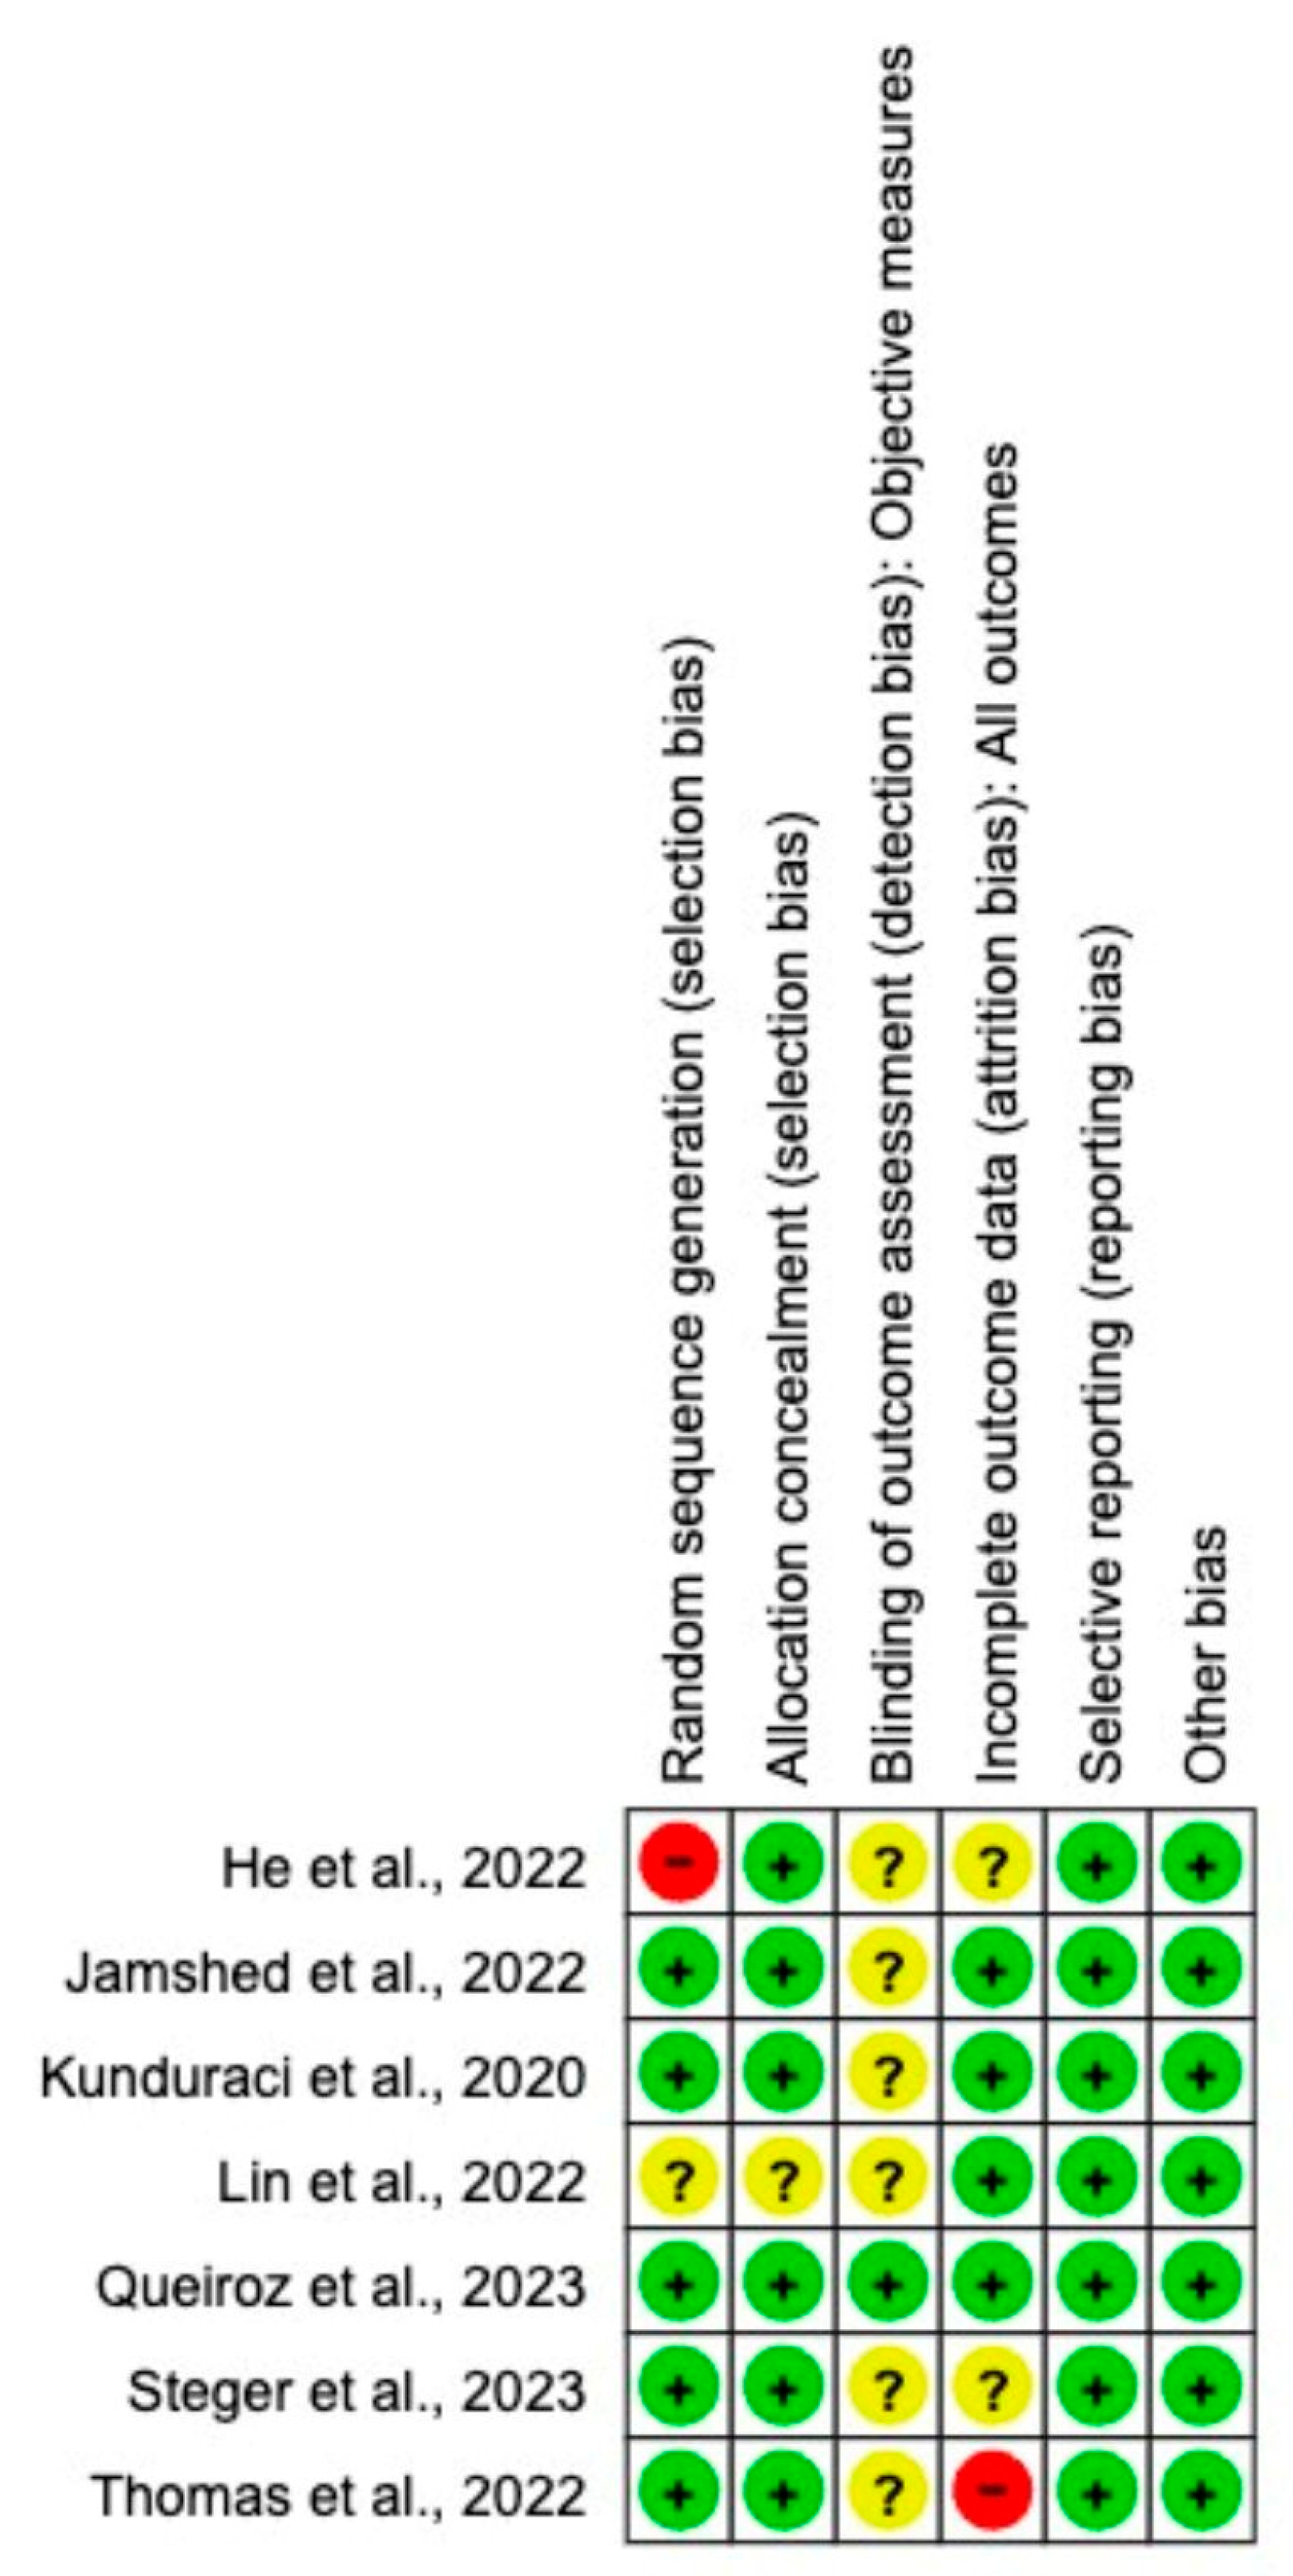
2.4. Risk of Bias and Certainty of Evidence Assessment
2.5. Data Analysis and Statistical Methods
3. Results
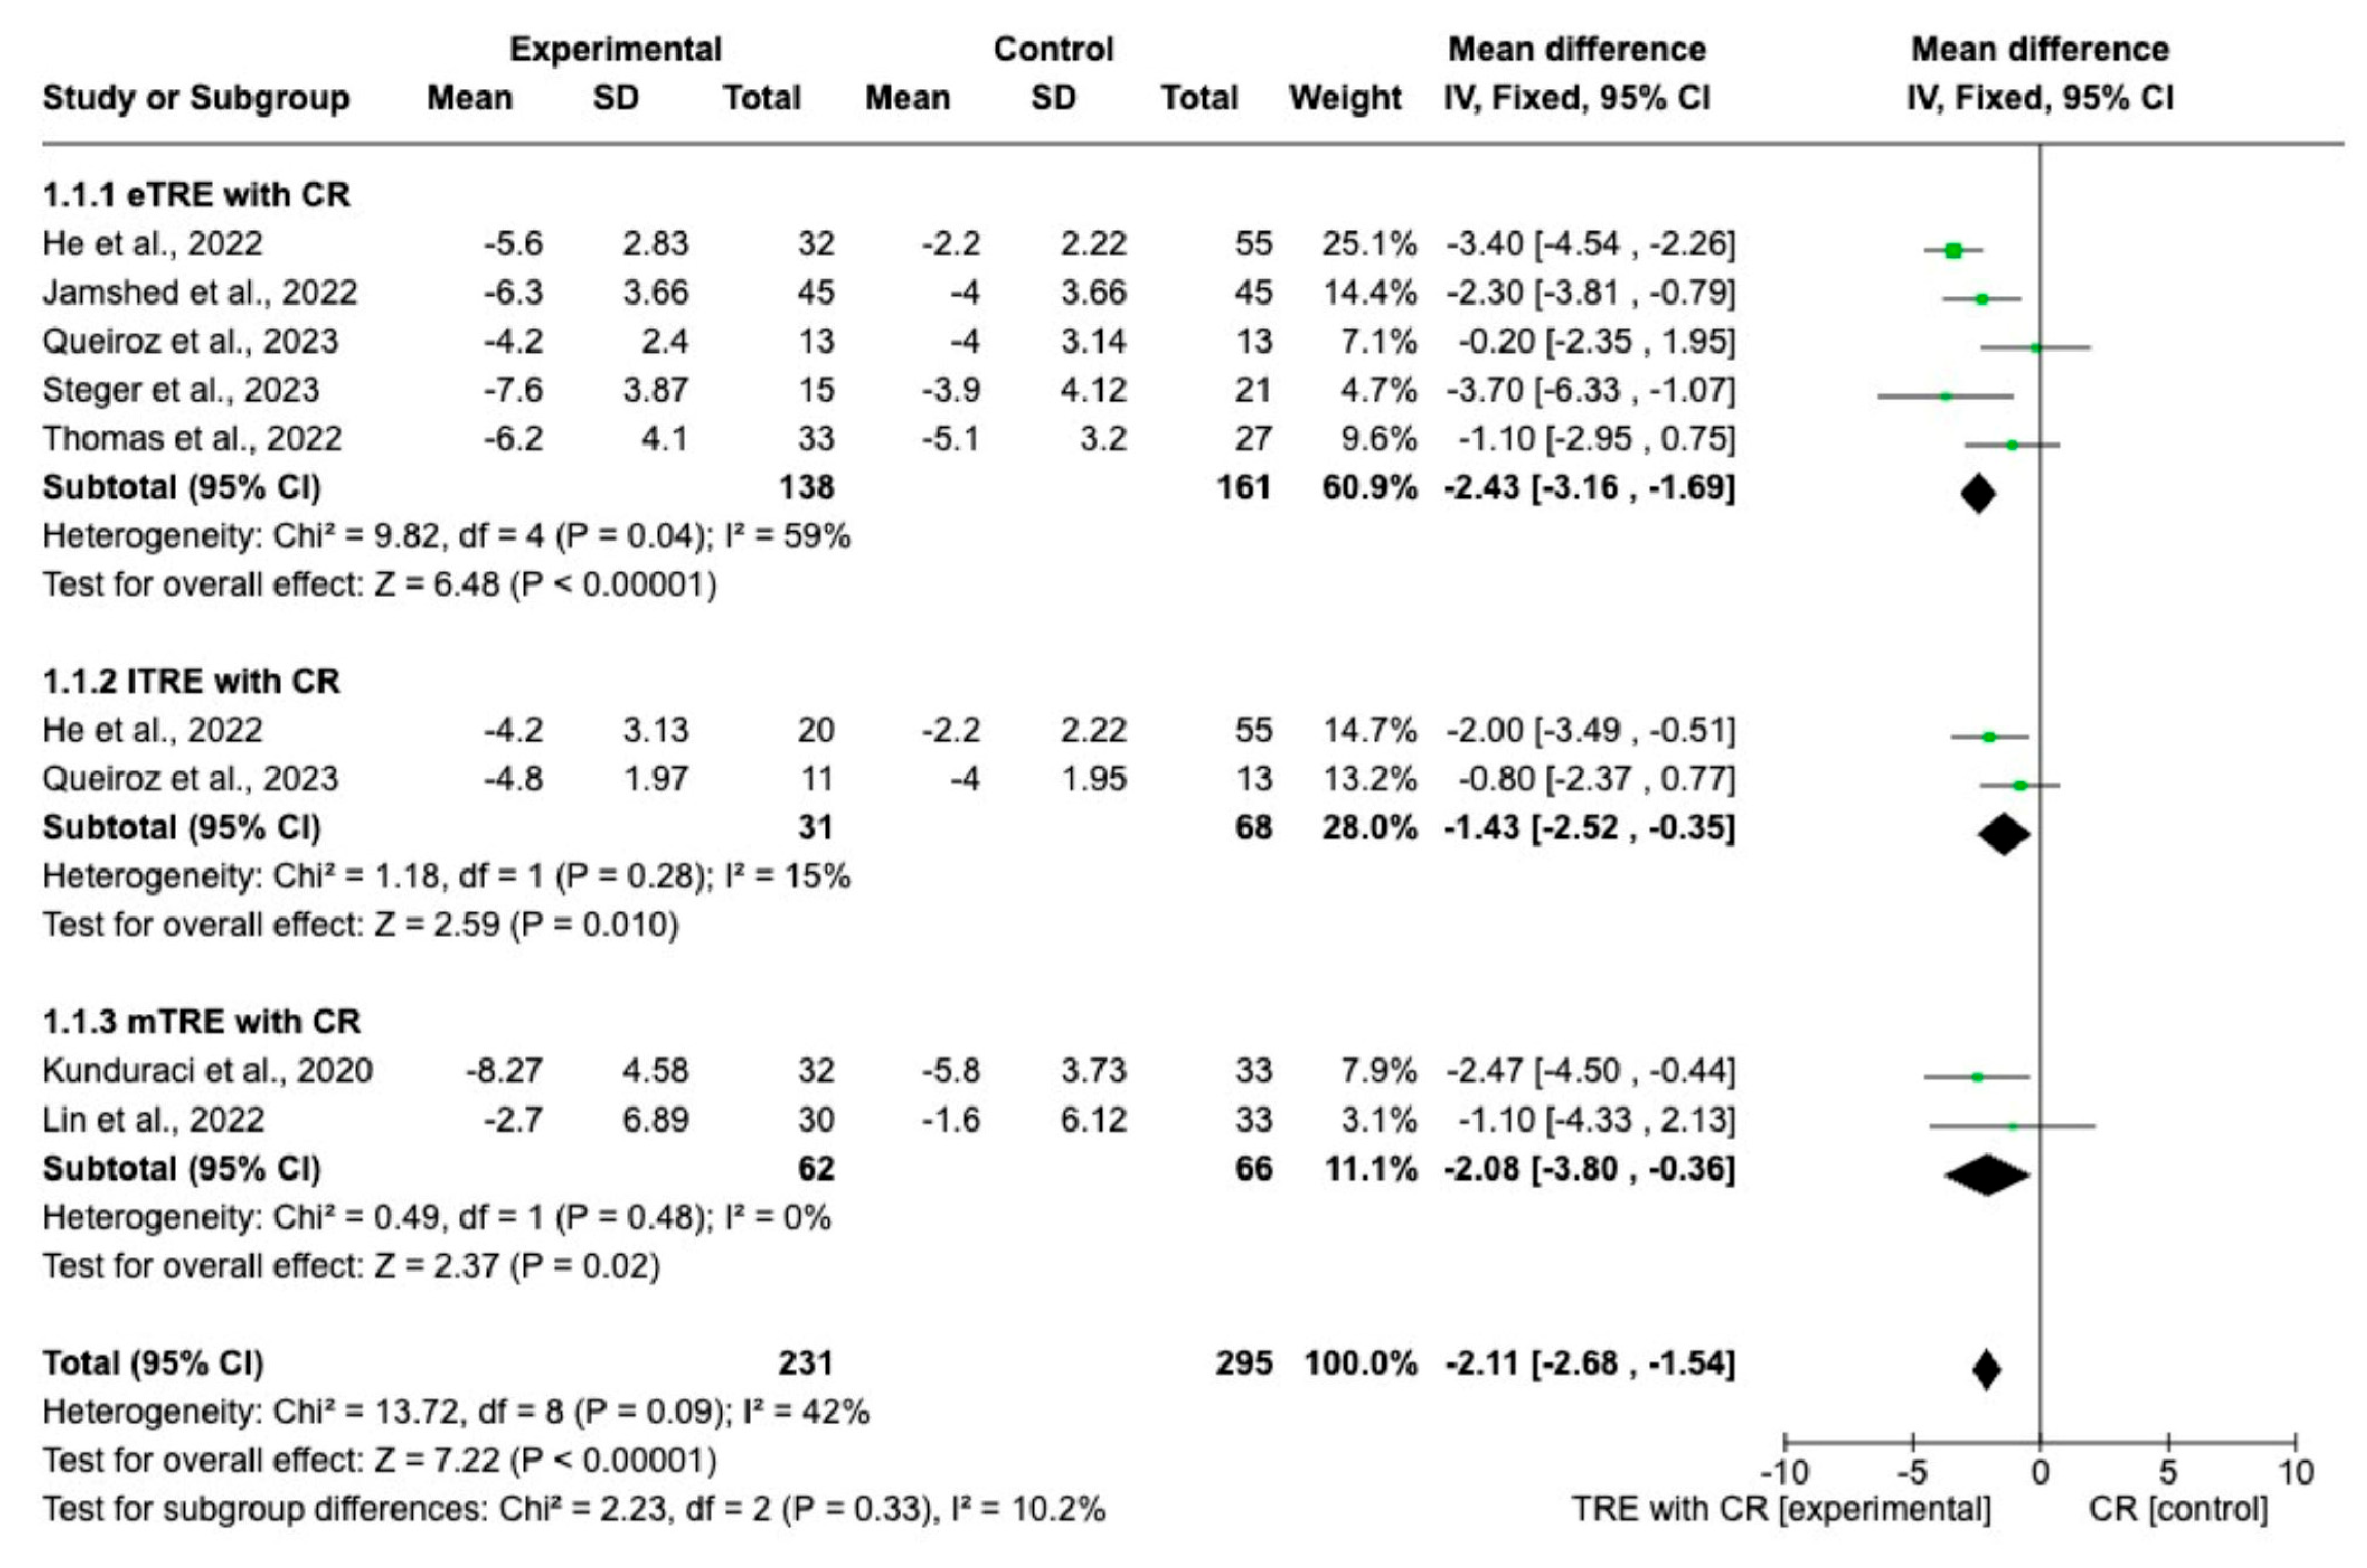
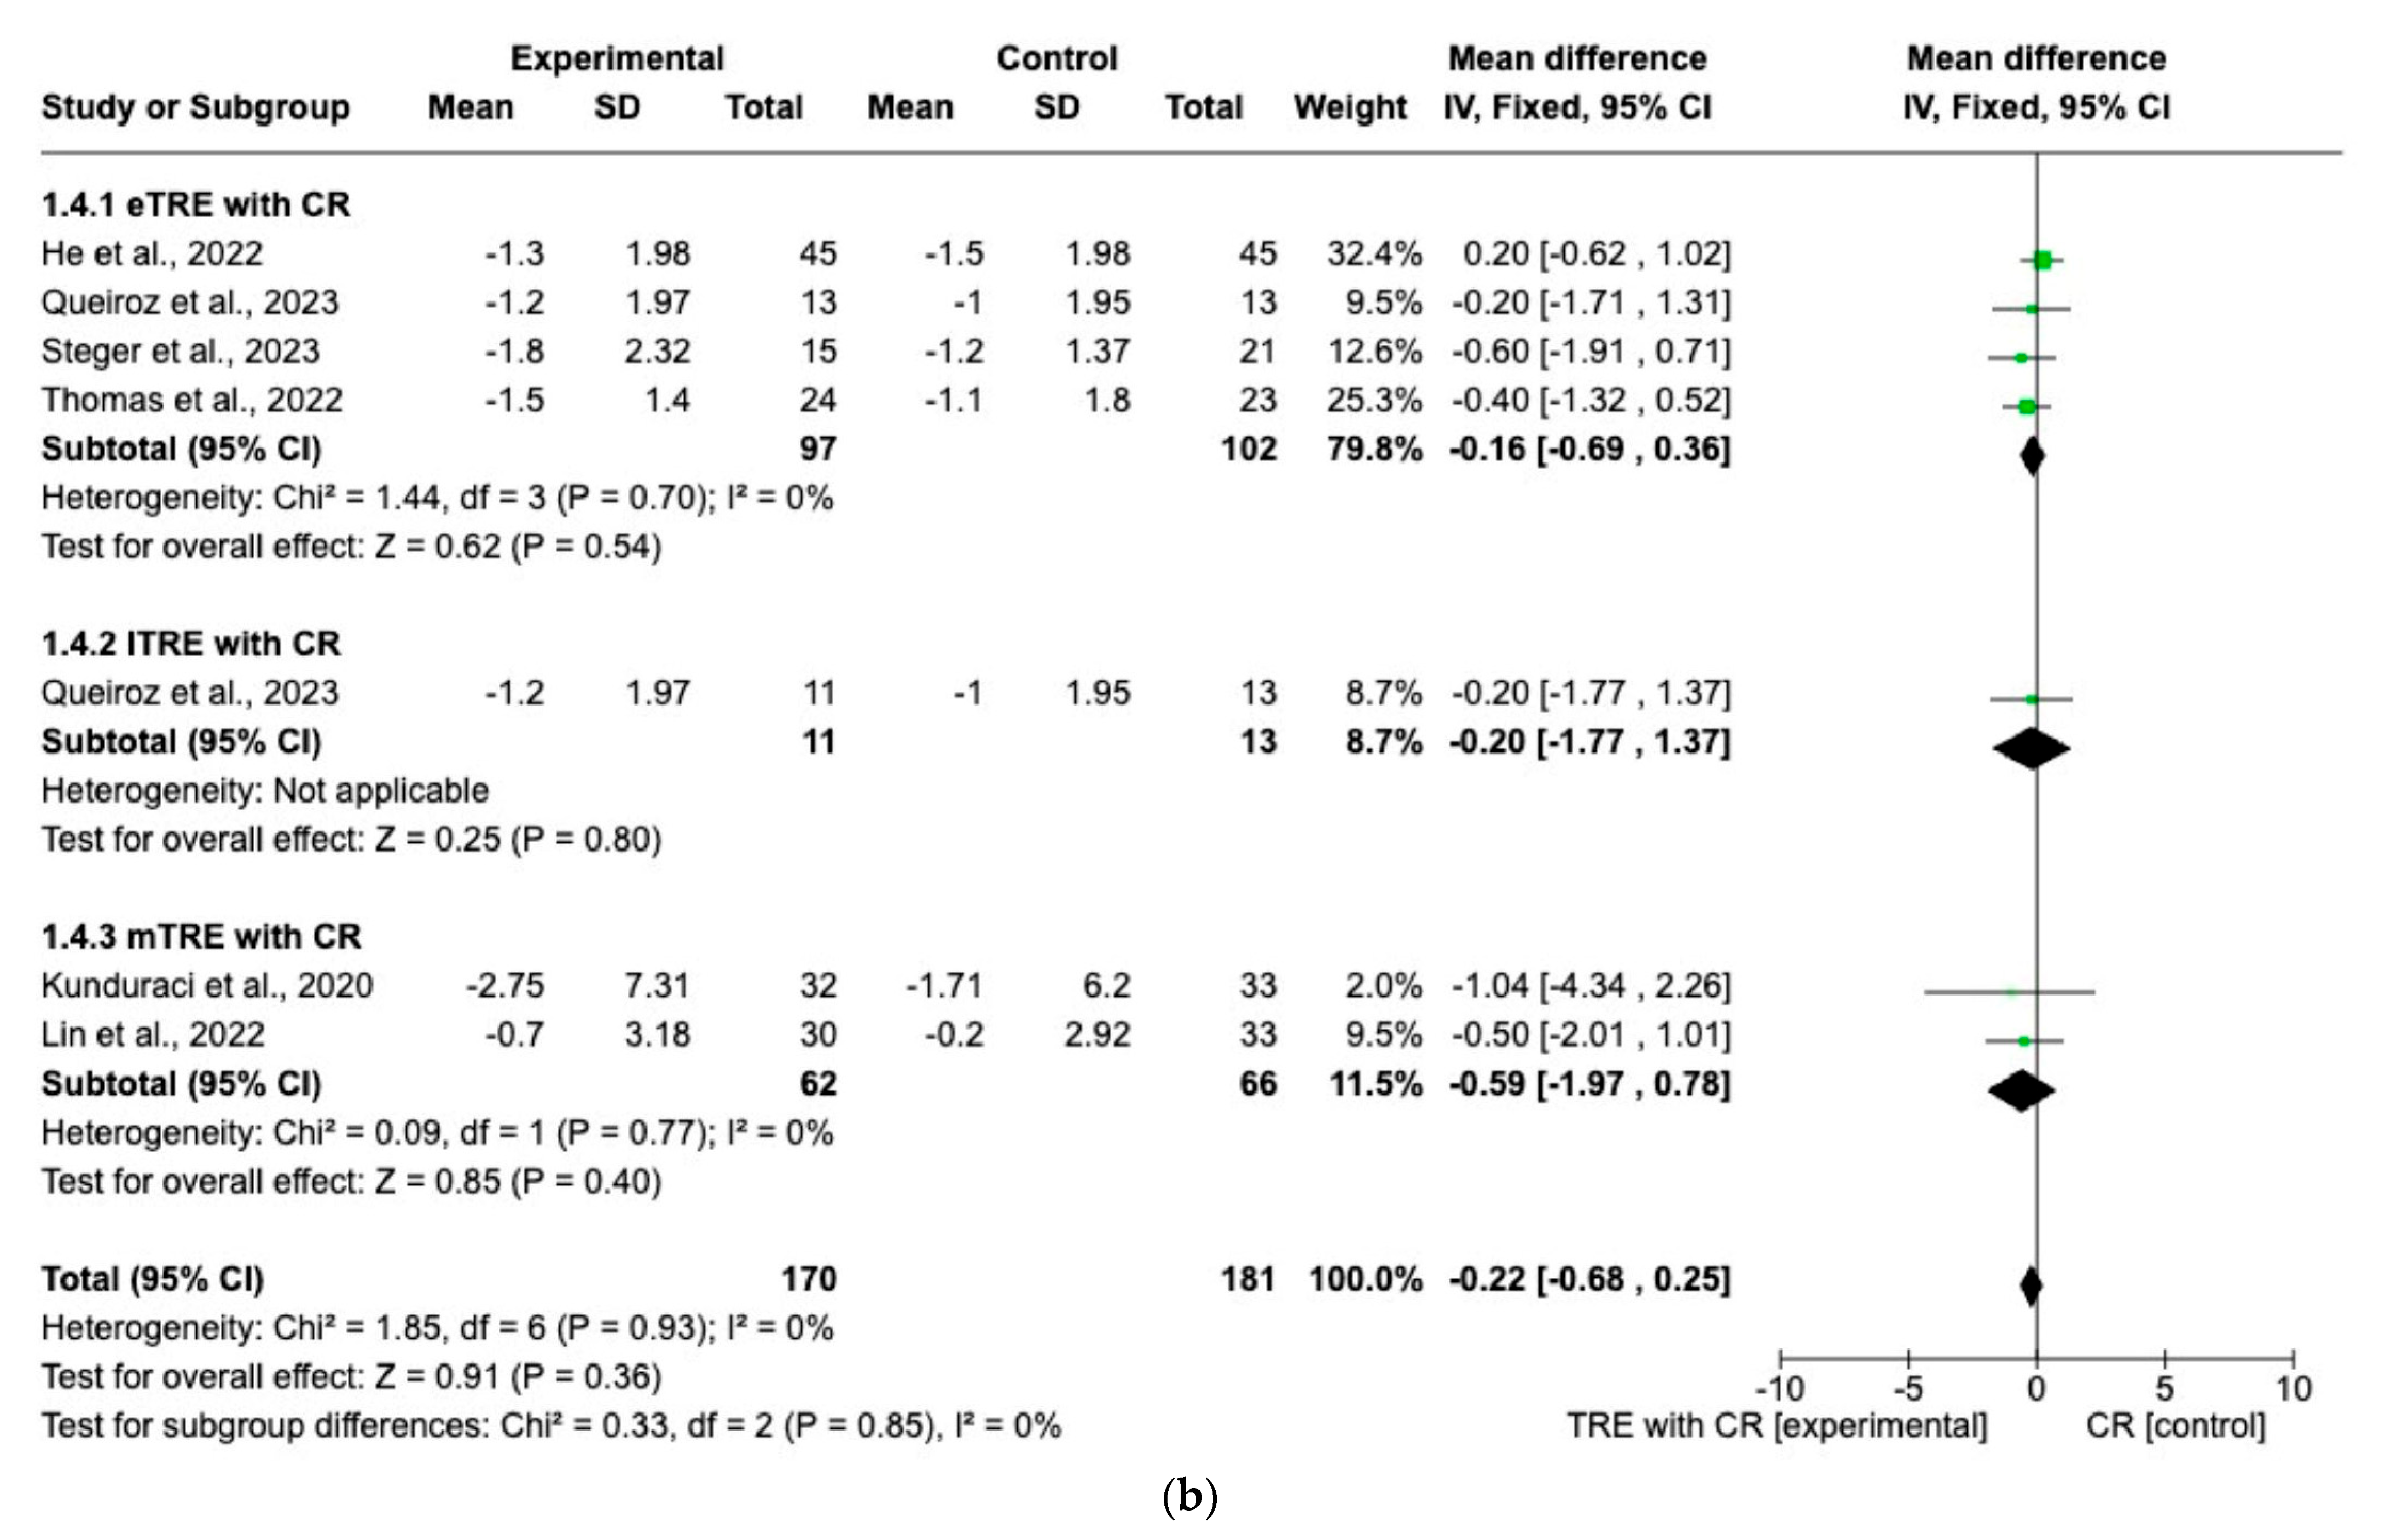
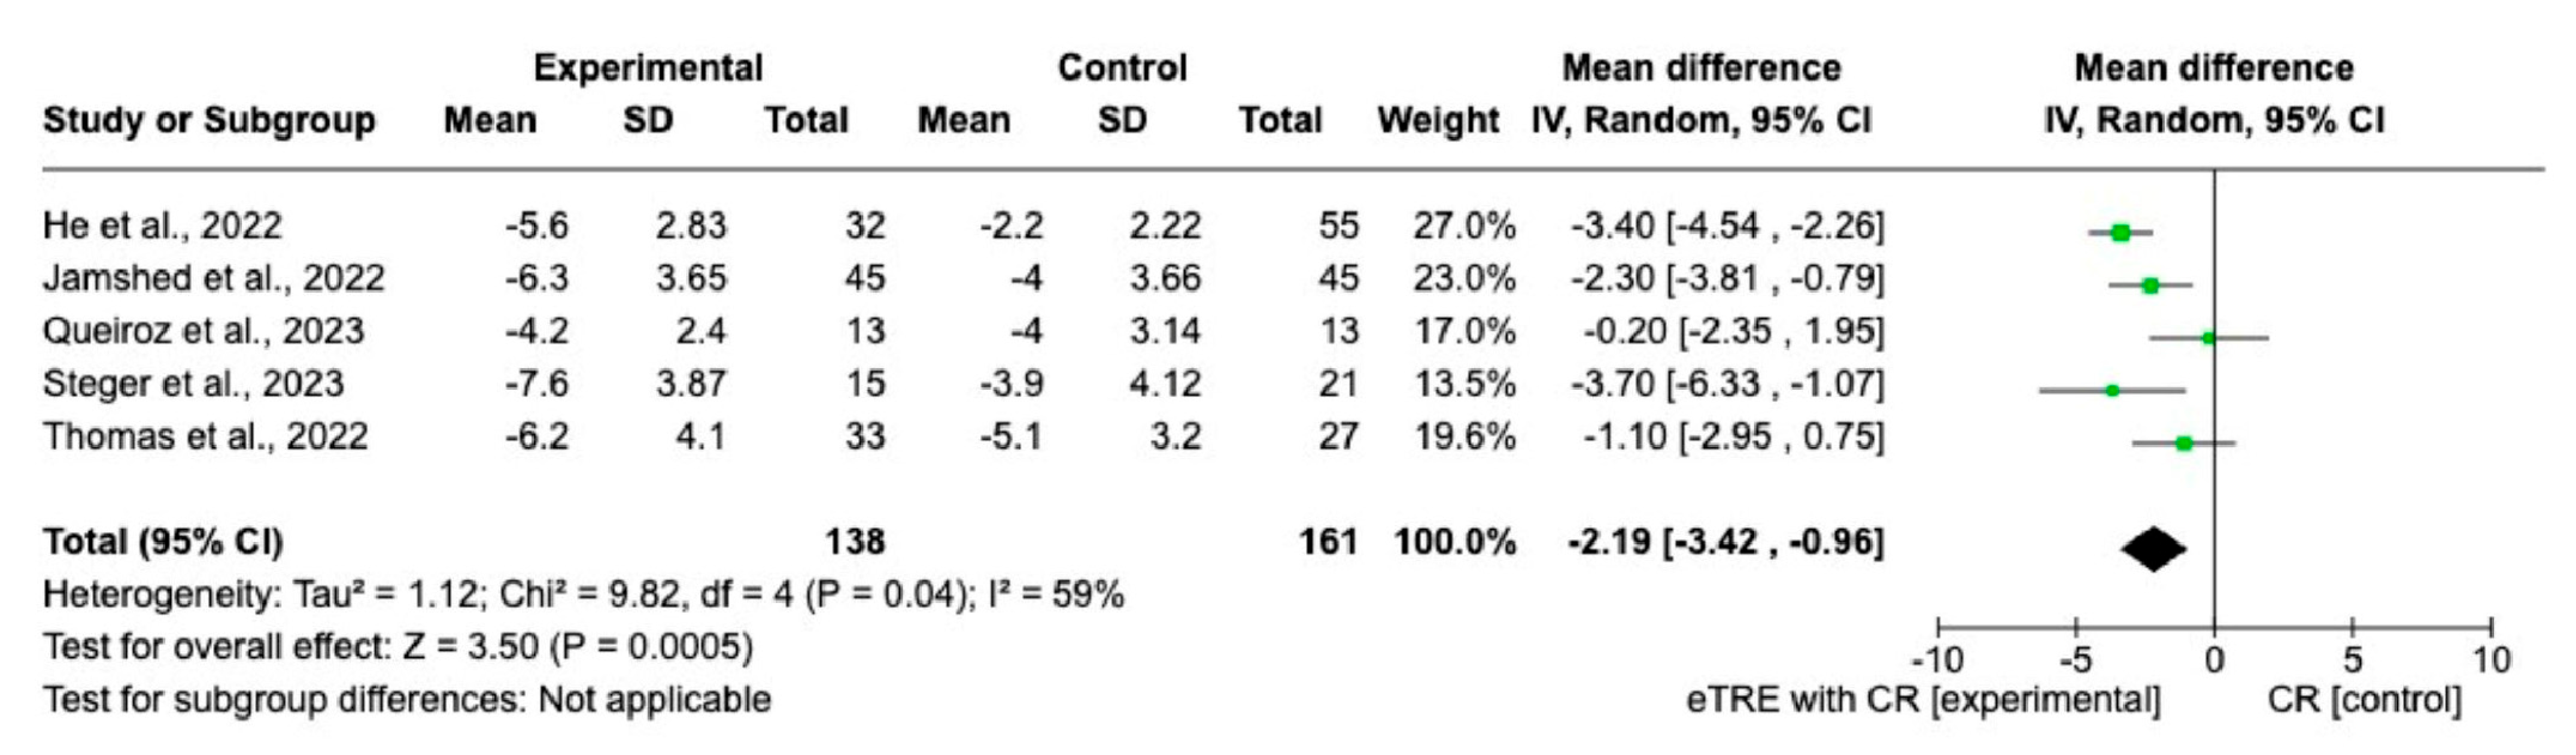
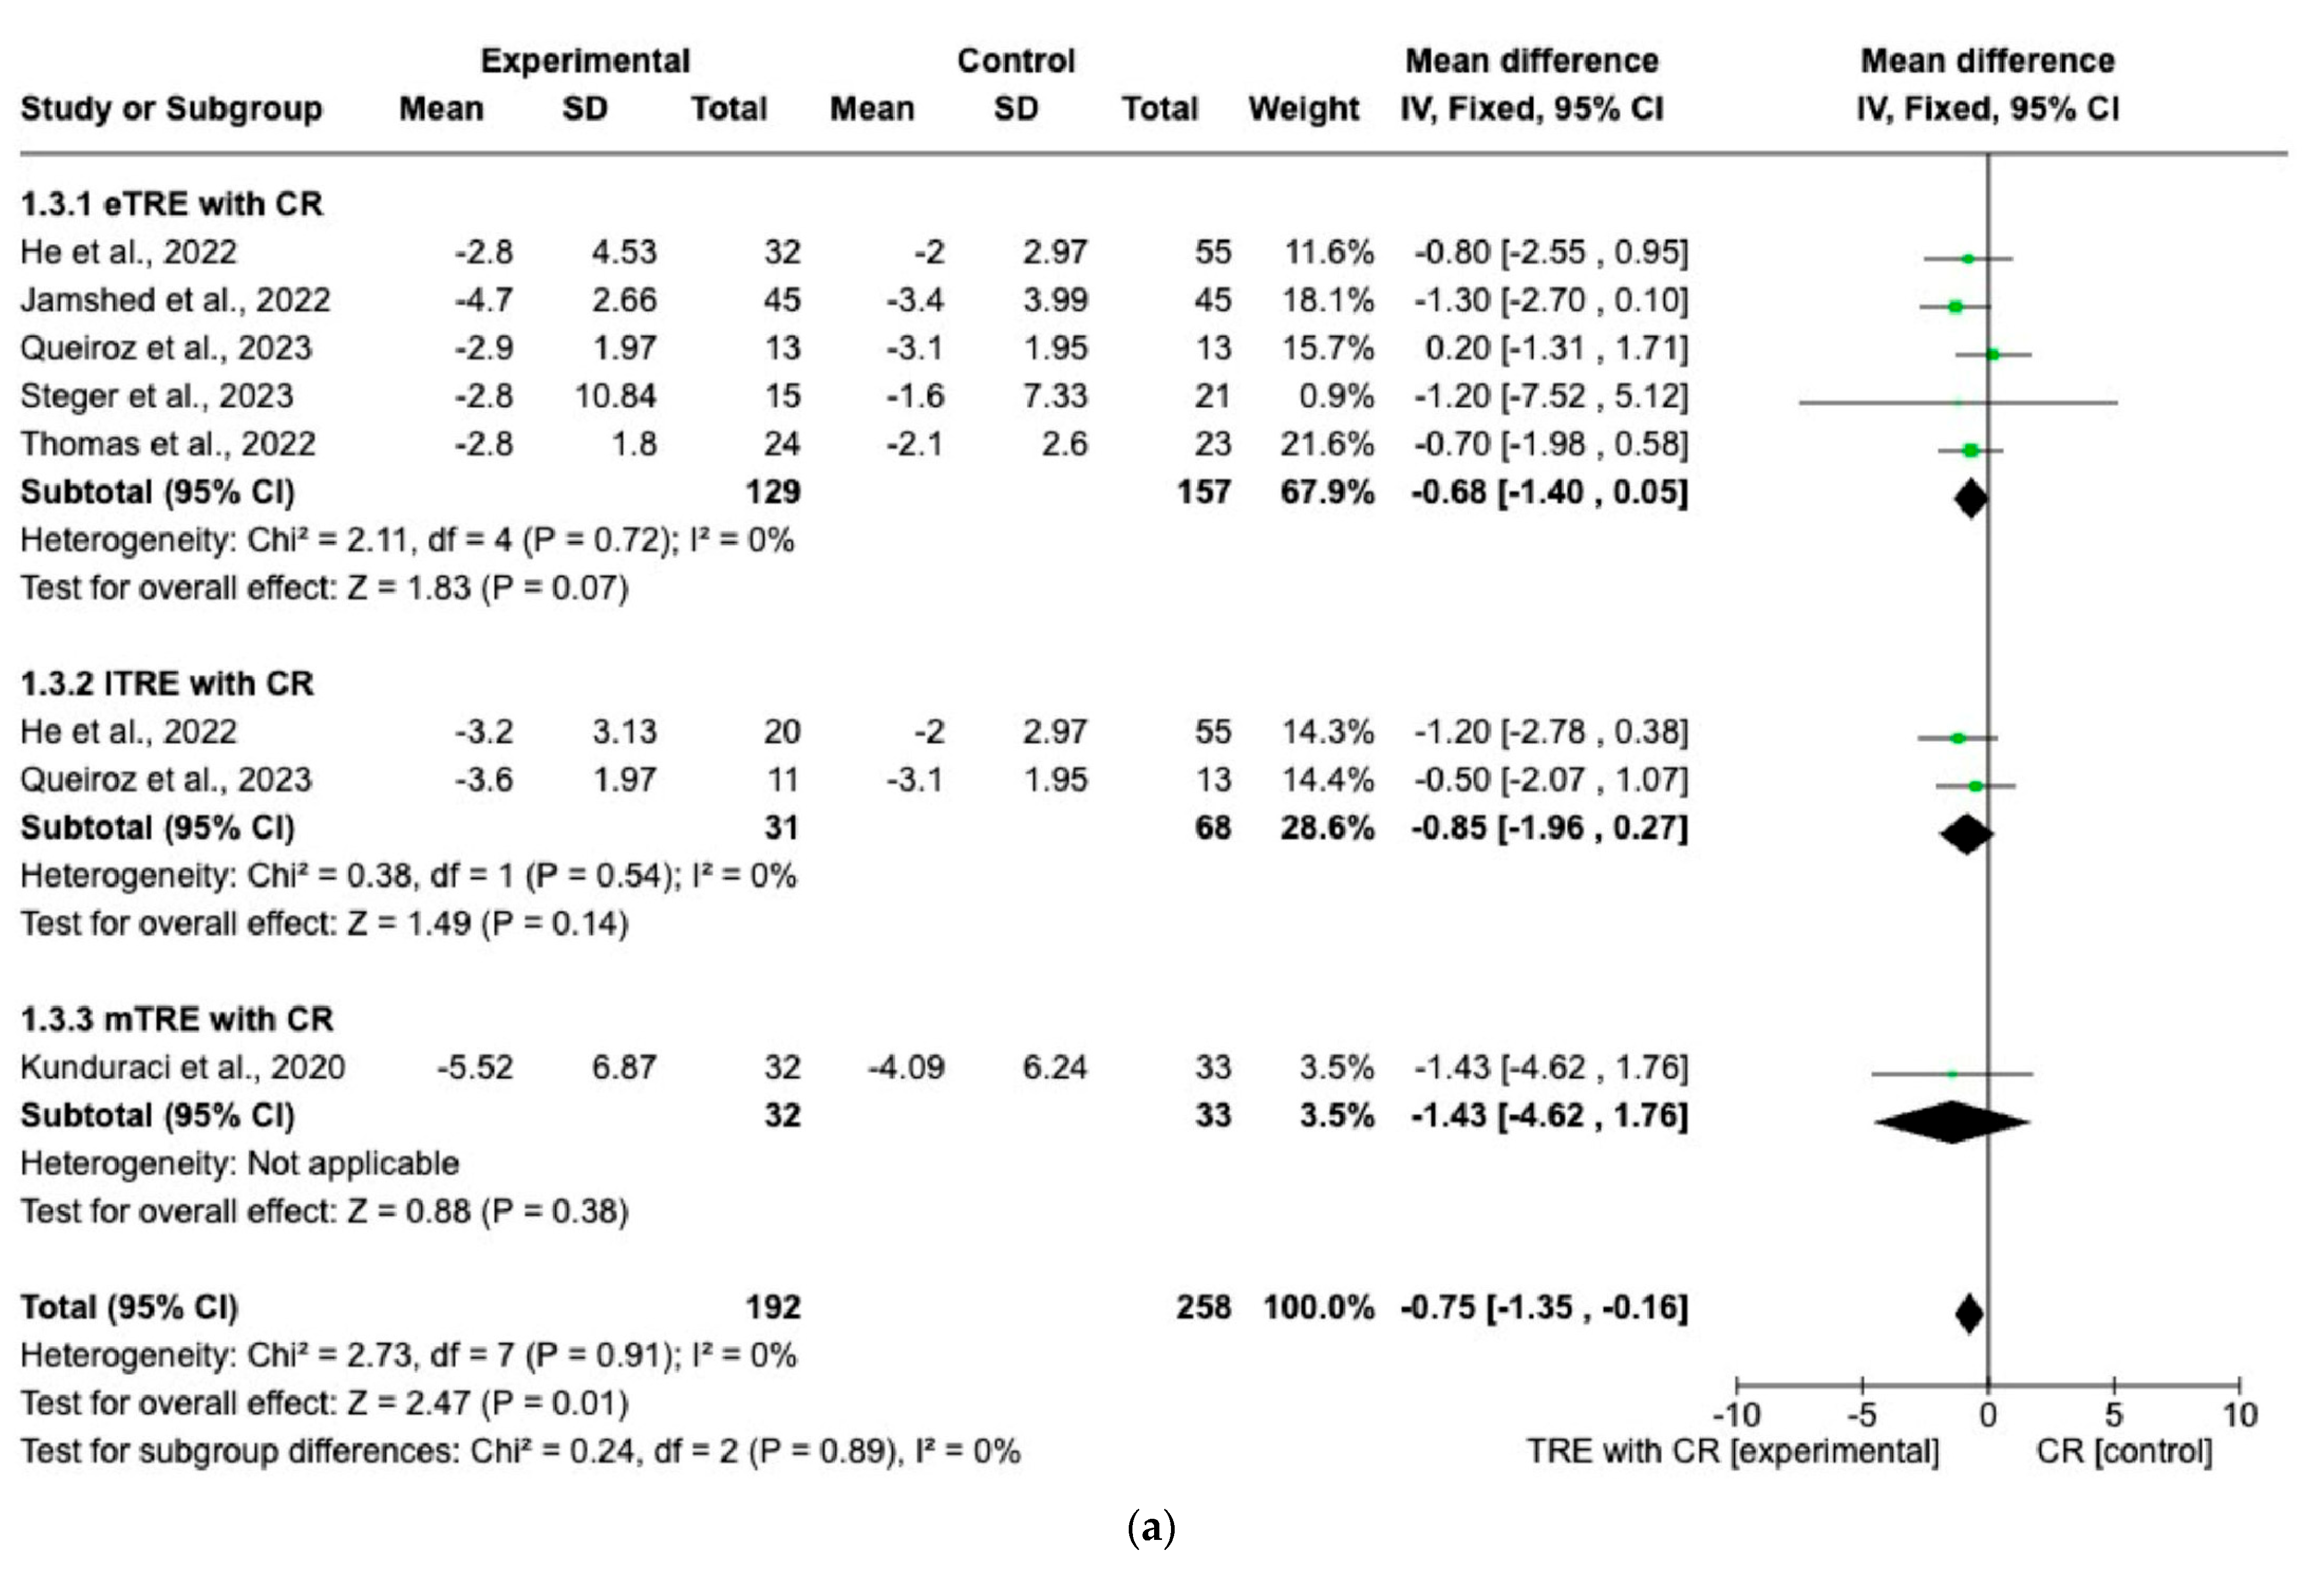
3.1. Effects of TRE with CR vs. CR on Changes in Anthropometric Parameters
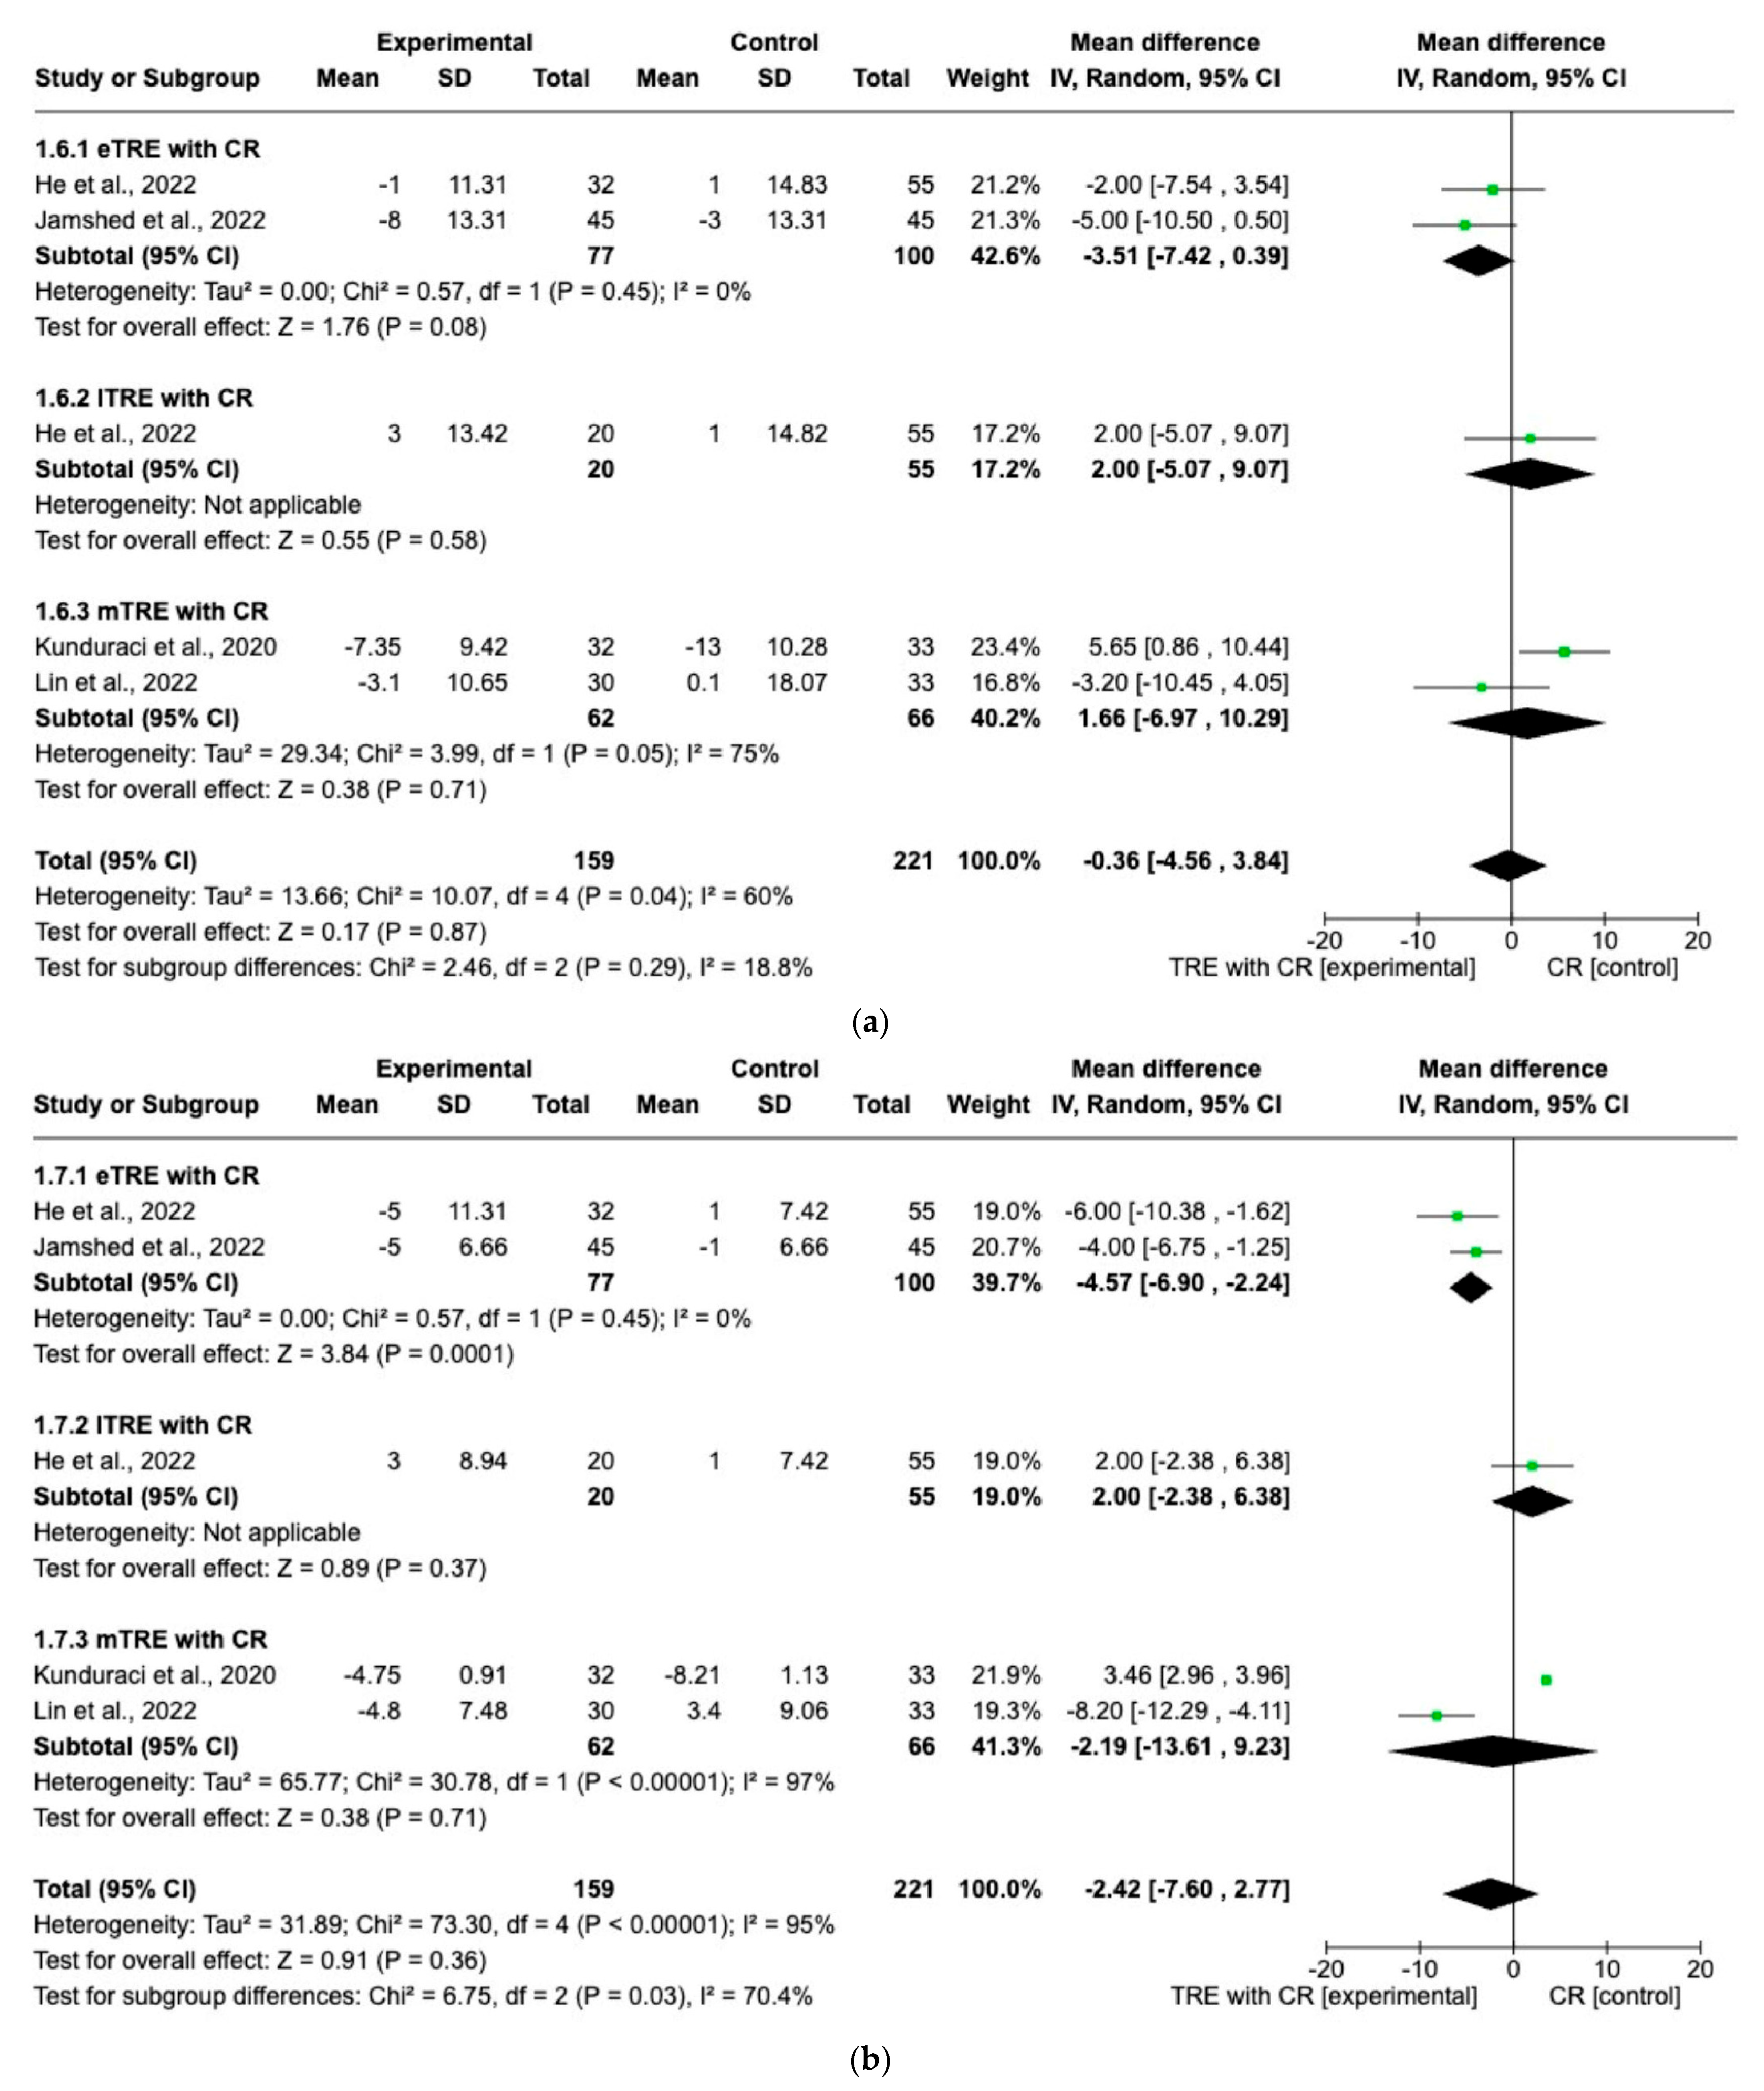
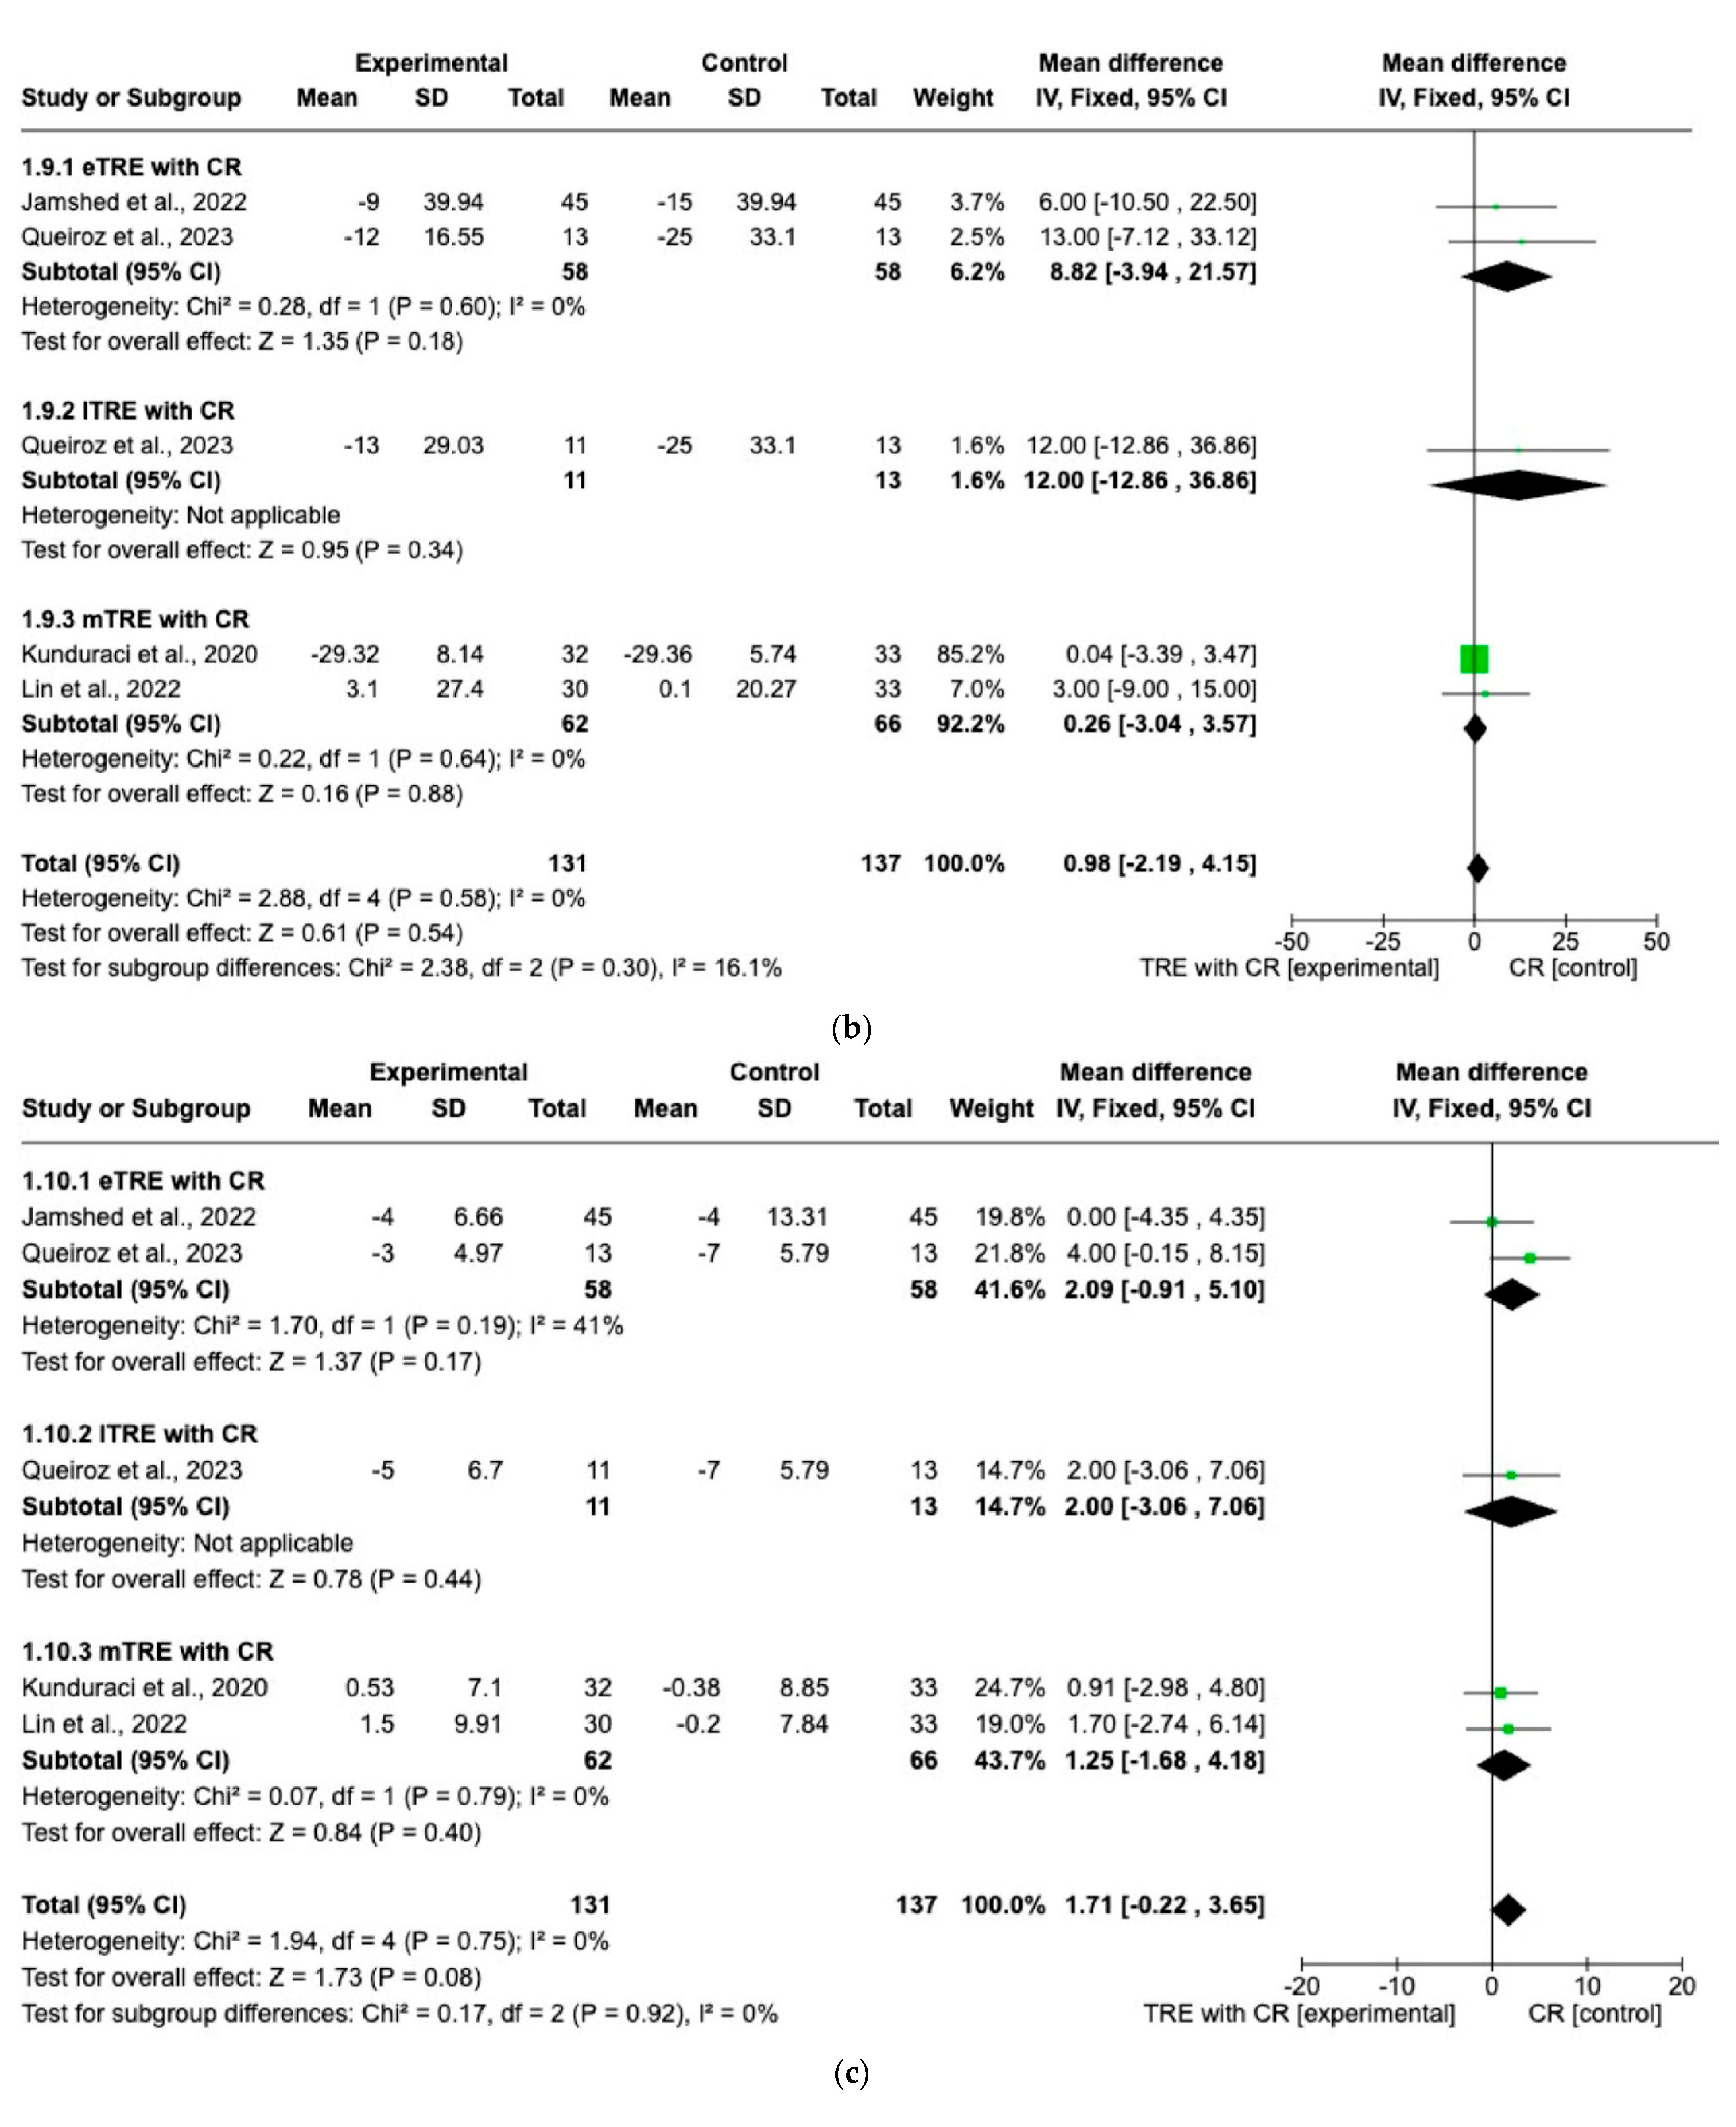
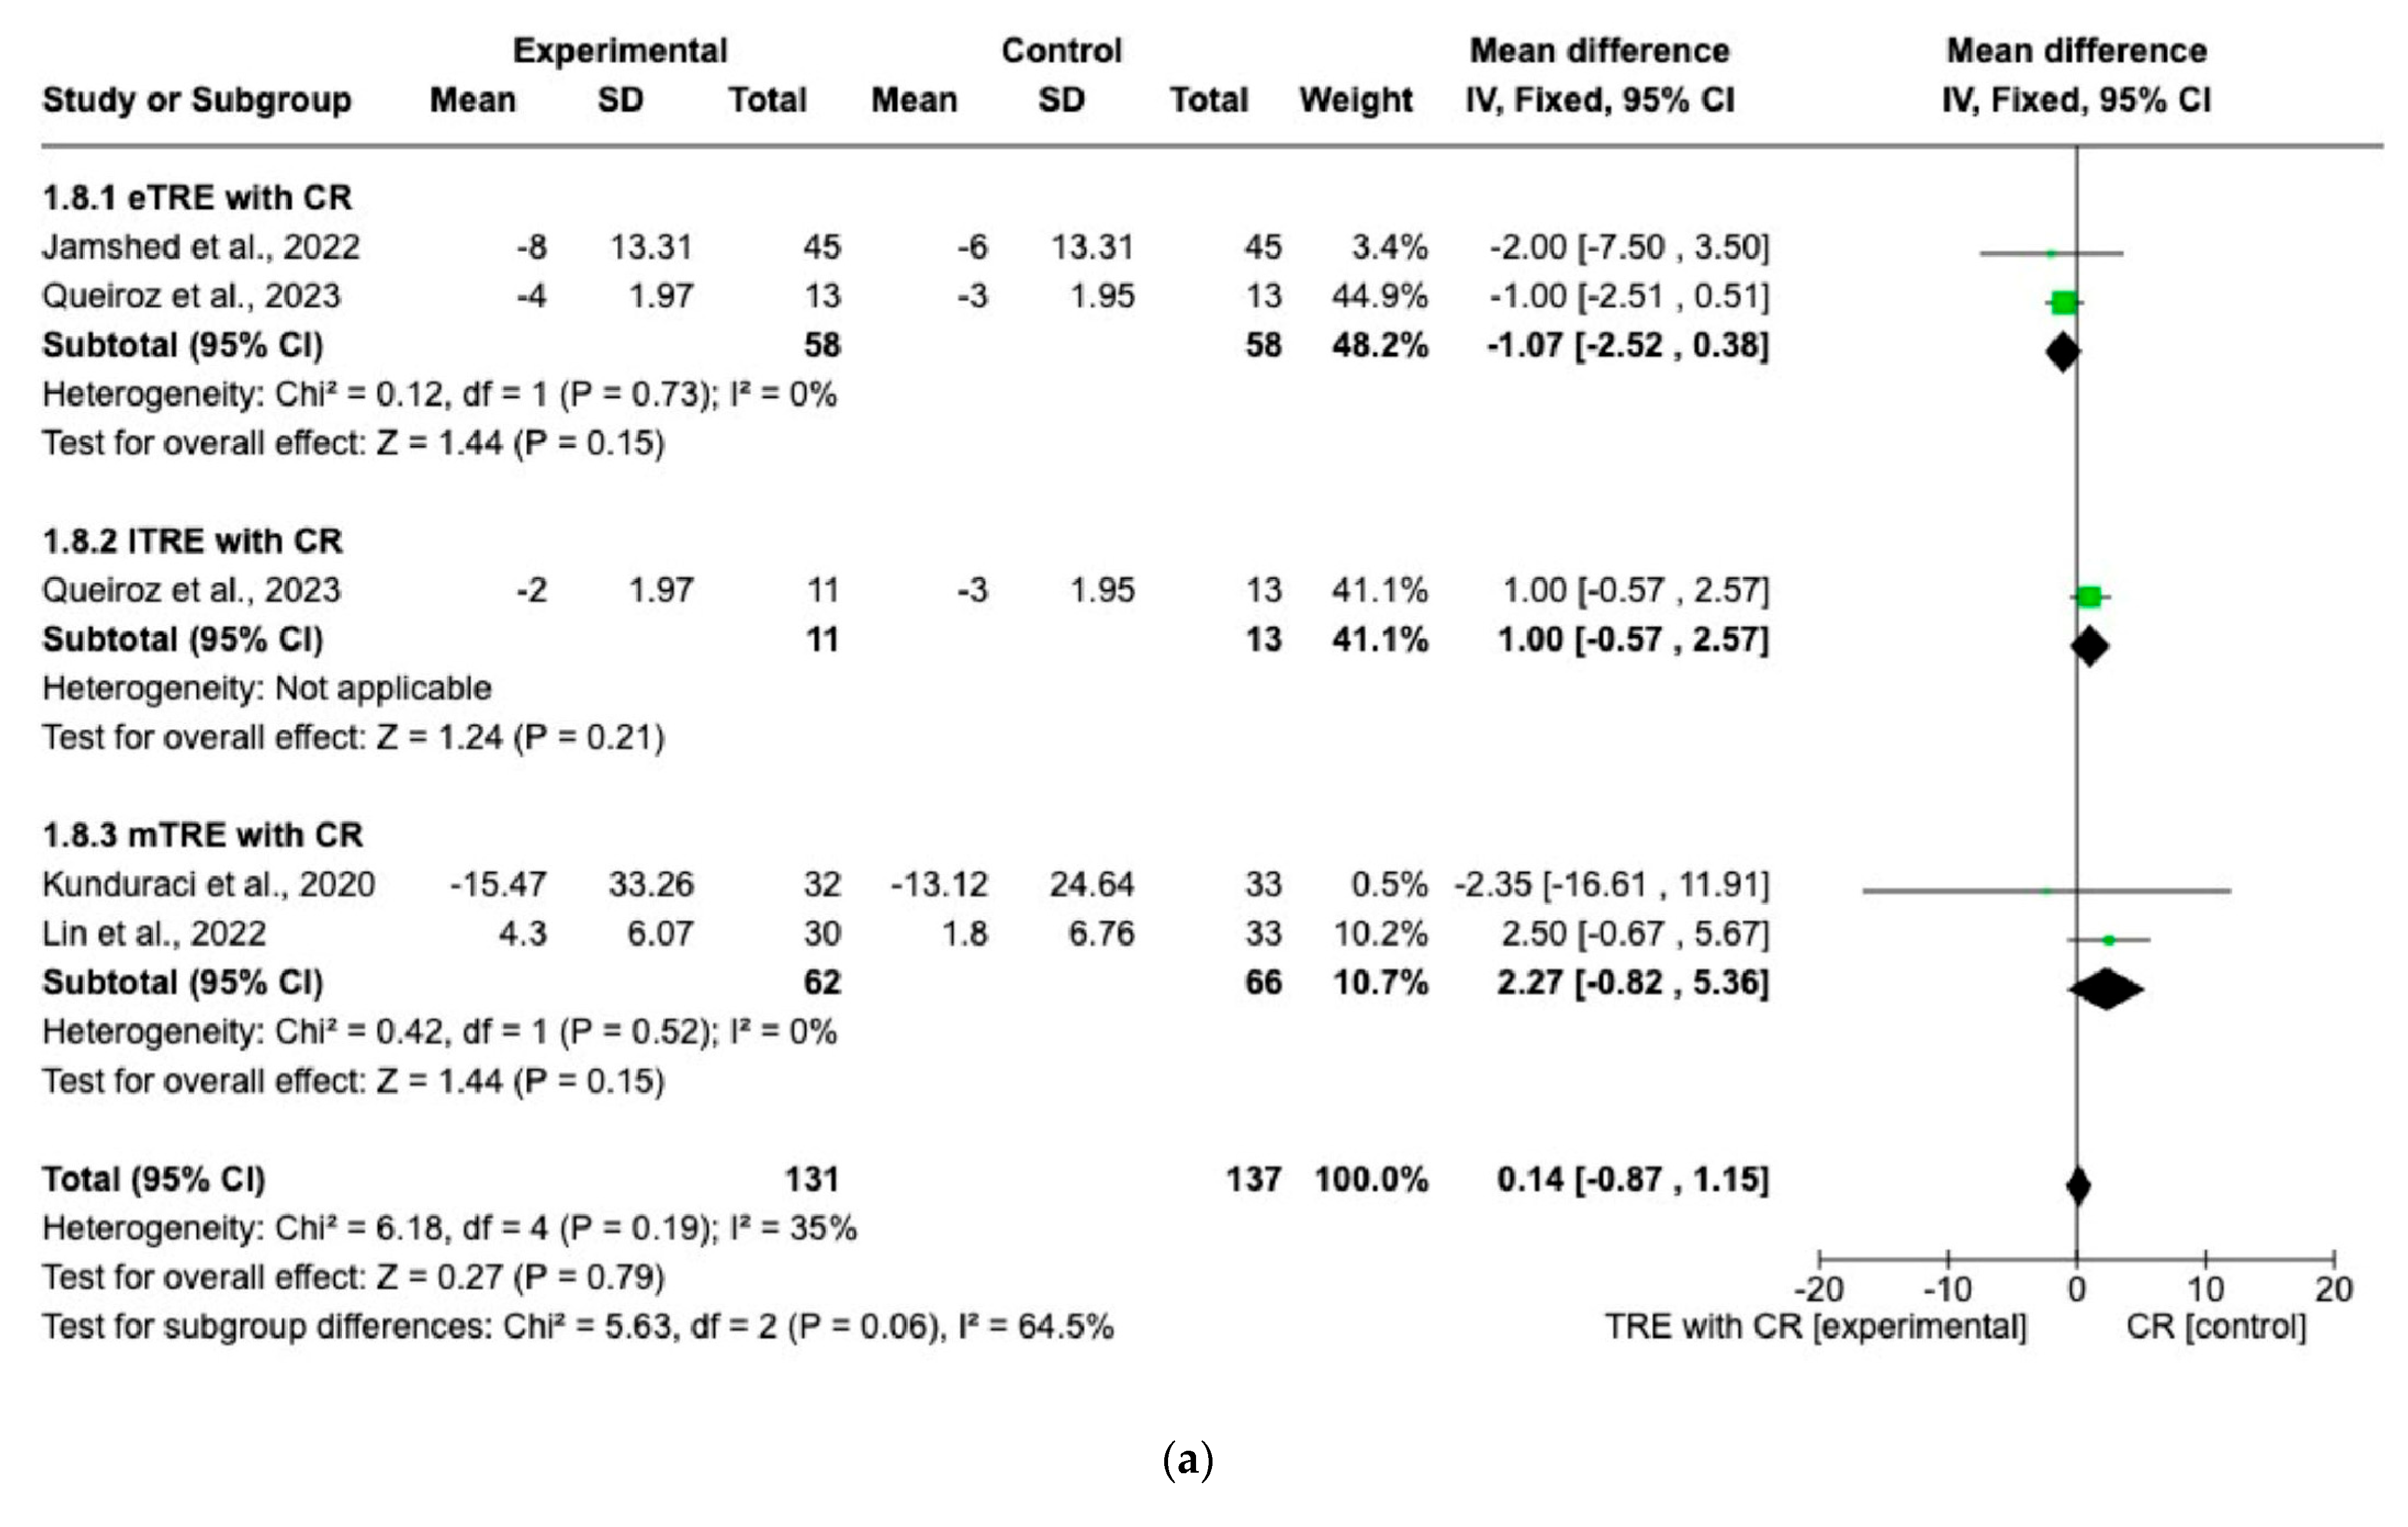
3.2. Effects of TRE with CR vs. CR on Changes in Biochemical Parameters
3.3. Certainty of the Evidence
4. Discussion
5. Conclusions
Author Contributions
Funding
Institutional Review Board Statement
Informed Consent Statement
Data Availability Statement
Conflicts of Interest
Appendix A. Search Strategy for Each Database
- Pubmed
- 2.
- Web of Science
- 3.
- Cochrane library
- #1 (Time restricted feeding): ti, ab, kw
- #2 (Time restricted eating): ti, ab, kw
- #3 (Time restricted diet); ti, ab, kw
- #4 #1 or #2 or #3
- #5 (Calorie restriction): ti, ab, kw
- #6 (Energy restriction): ti, ab, kw
- #7 (Caloric restriction): ti, ab, kw
- #8 #5 or #6 or #7
- MeSH descriptor:
- #9 (overweight)
- #10 (obesity)
- #11 (obese)
- #12 (metabolic syndrome)
- #13 (weight loss)
- #14 (weight reduction)
- #15 #9 or #10 or #11 or #12 or #13 or #14
- #16 #4 and #8 and #15
- 4.
- Embase
Appendix B

| Section and Topic | Item # | Checklist Item | Location Where Item Is Reported |
|---|---|---|---|
| TITLE | |||
| Title | 1 | Identify the report as a systematic review. | Title page |
| ABSTRACT | |||
| Abstract | 2 | See the PRISMA 2020 for abstract checklist. | Title page |
| INTRODUCTION | |||
| Rationale | 3 | Describe the rationale for the review in the context of existing knowledge. | Section 1 |
| Objectives | 4 | Provide an explicit statement of the objective(s) or question(s) the review addresses. | Section 1 |
| METHODS | |||
| Eligibility criteria | 5 | Specify the inclusion and exclusion criteria for the review and how studies were grouped for the syntheses. | Section 2.2 |
| Information sources | 6 | Specify all databases, registers, websites, organisations, reference lists, and other sources searched or consulted to identify studies. Specify the date when each source was last searched or consulted. | Section 2.1 |
| Search strategy | 7 | Present the full search strategies for all databases, registers, and websites, including any filters and limits used. | Section 2.1 and Appendix A |
| Selection process | 8 | Specify the methods used to decide whether a study met the inclusion criteria of the review, including how many reviewers screened each record and each report retrieved; whether they worked independently; and if applicable, details of automation tools used in the process. | Section 2.1 |
| Data collection process | 9 | Specify the methods used to collect data from reports, including how many reviewers collected data from each report; whether they worked independently; any processes for obtaining or confirming data from study investigators; and if applicable, details of automation tools used in the process. | Section 2.3 |
| Data items | 10 a | List and define all outcomes for which data were sought. Specify whether all results that were compatible with each outcome domain in each study were sought (e.g., for all measures, time points, analyses), and if not, the methods used to decide which results to collect. | Section 2.2 |
| 10 b | List and define all other variables for which data were sought (e.g., participant and intervention characteristics, funding sources). Describe any assumptions made about any missing or unclear information. | Section 2.1 and Section 2.2 | |
| Study risk of bias assessment | 11 | Specify the methods used to assess risk of bias in the included studies, including details of the tool(s) used; how many reviewers assessed each study and whether they worked independently; and if applicable, details of automation tools used in the process. | Section 2.4 |
| Effect measures | 12 | Specify for each outcome the effect measure(s) (e.g., risk ratio, mean difference) used in the synthesis or presentation of results. | Section 2.4 |
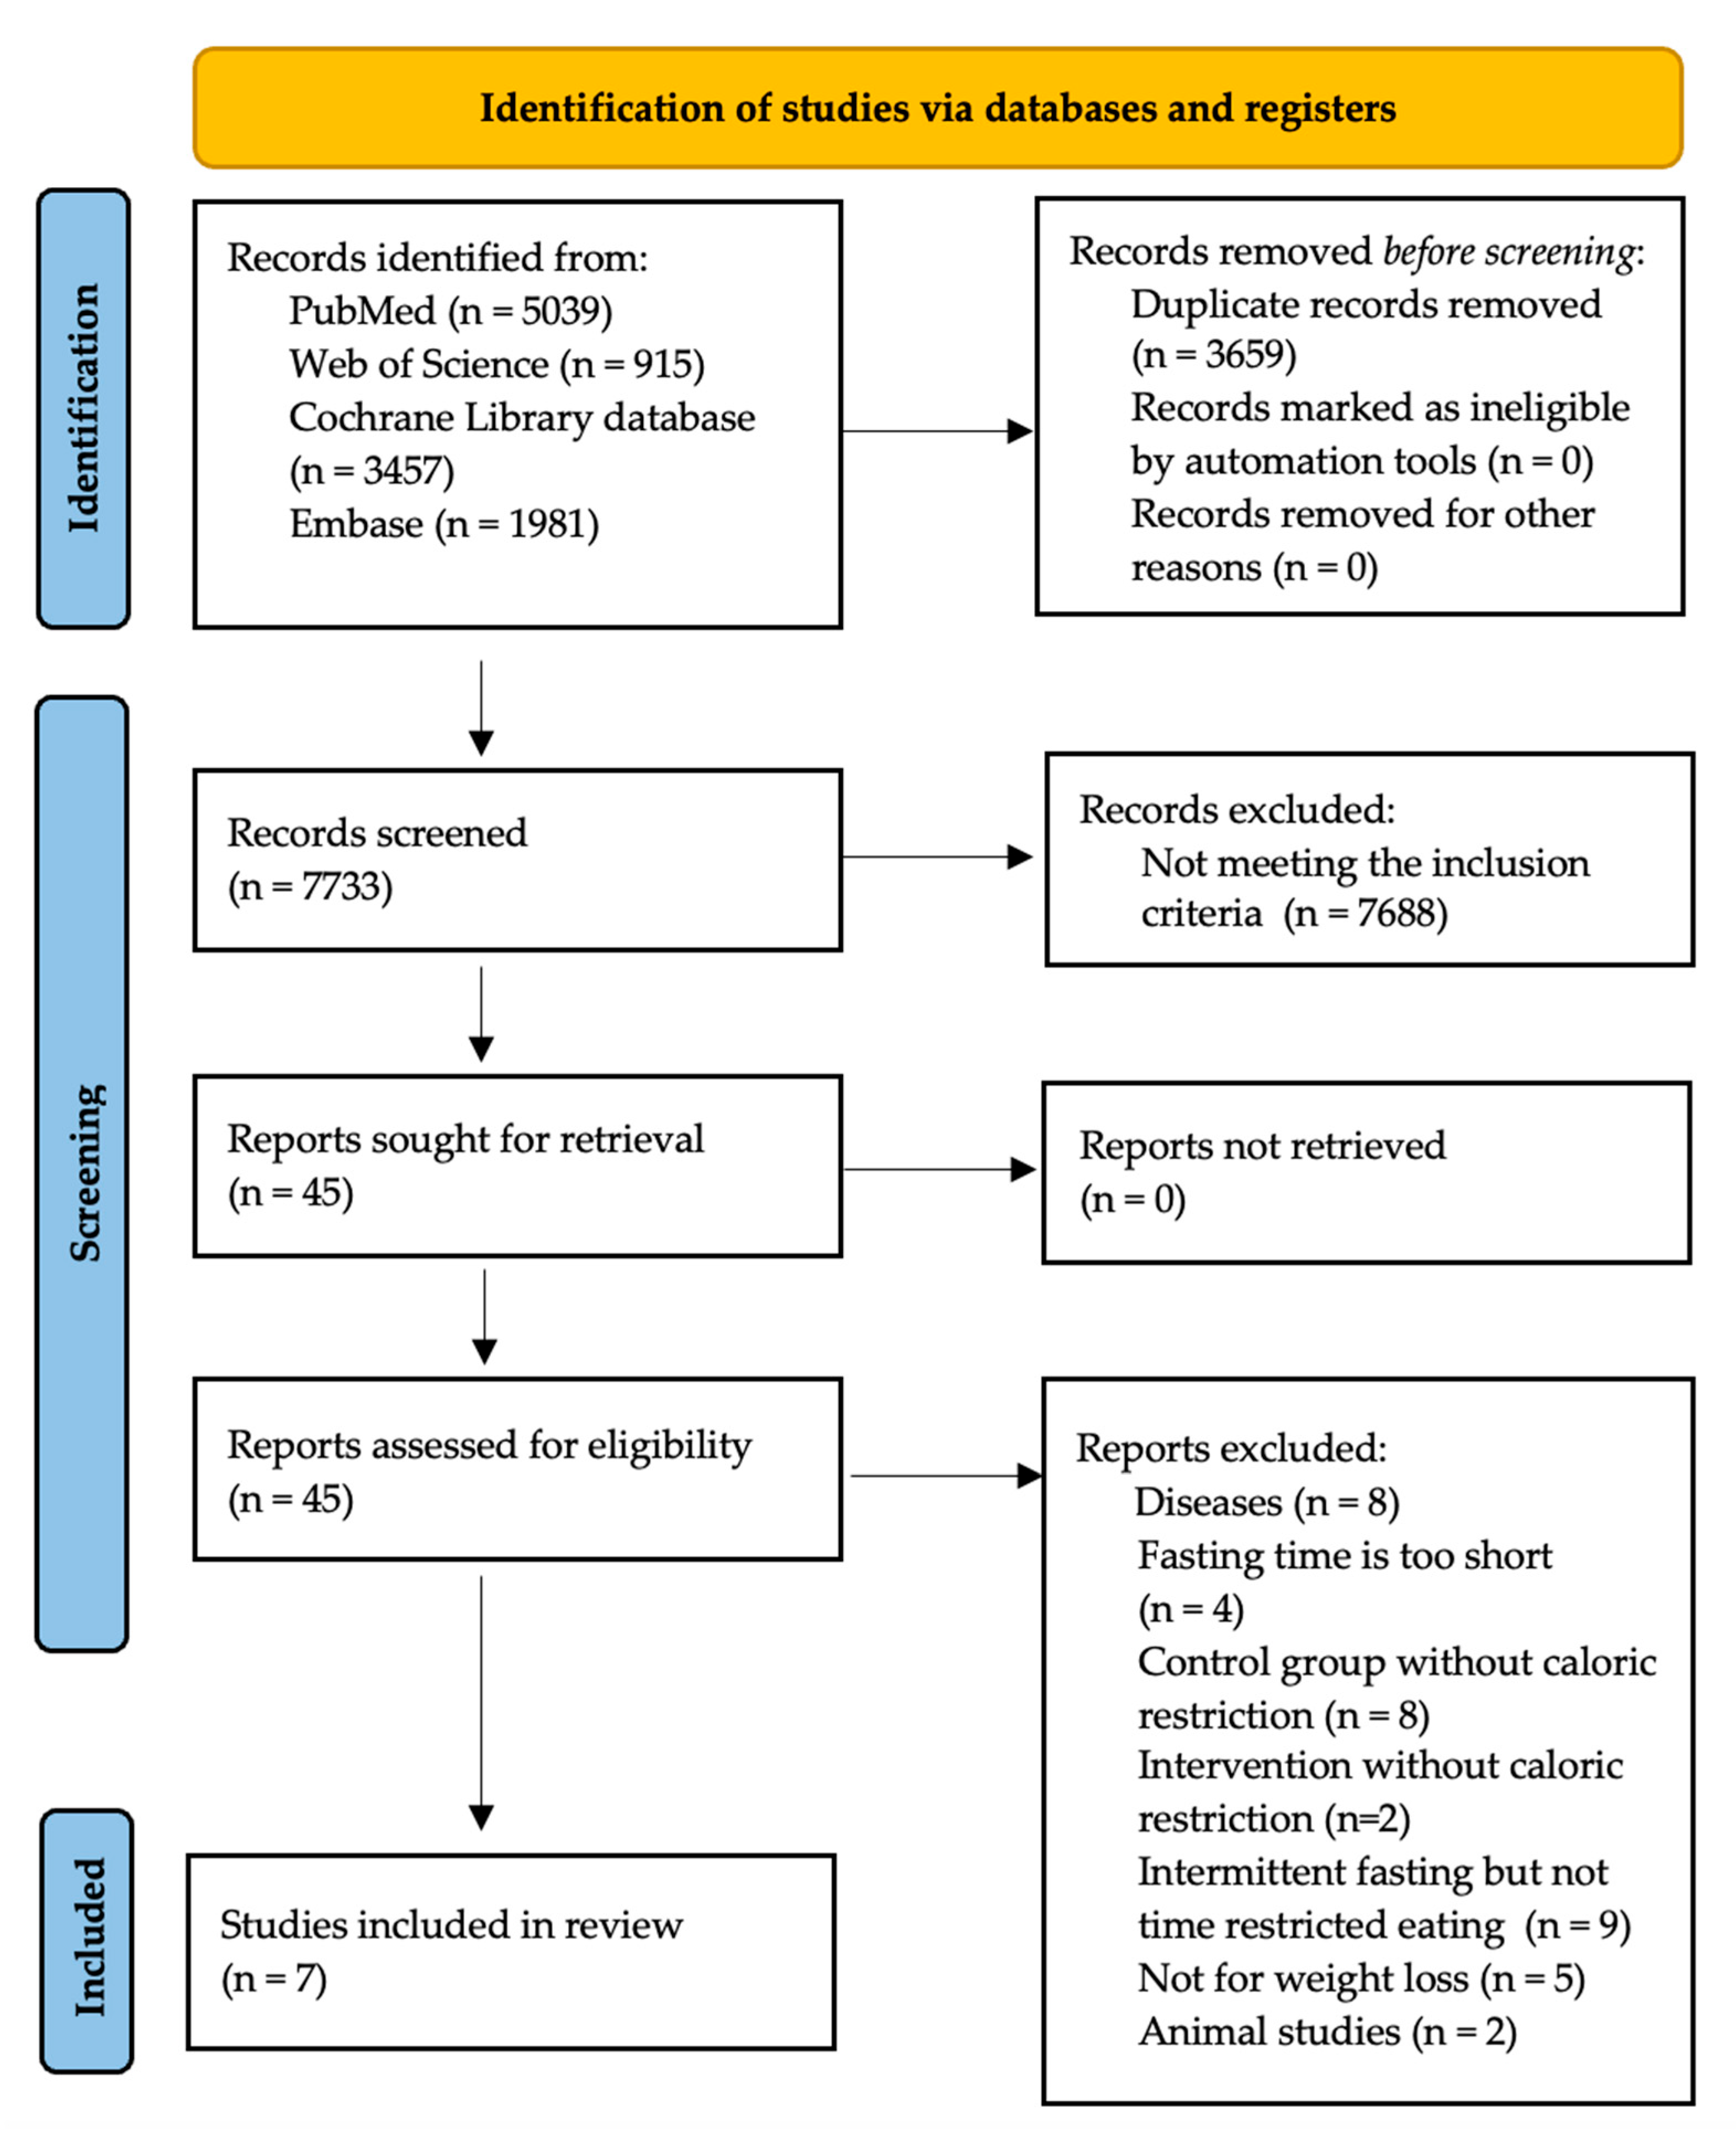
| Synthesis methods | 13 a | Describe the processes used to decide which studies were eligible for each synthesis (e.g., tabulating the study intervention characteristics and comparing against the planned groups for each synthesis (item #5)). | Section 2.2 and Figure 1 |
| 13 b | Describe any methods required to prepare the data for presentation or synthesis, such as handling of missing summary statistics, or data conversions. | Section 2.4 | |
| 13 c | Describe any methods used to tabulate or visually display results of individual studies and syntheses. | Section 2.4 | |
| 13 d | Describe any methods used to synthesize results and provide a rationale for the choice(s). If meta-analysis was performed, describe the model(s) and method(s) to identify the presence and extent of statistical heterogeneity, as well as software package(s) used. | Section 2.4 and Section 2.5 | |
| 13 e | Describe any methods used to explore possible causes of heterogeneity among study results (e.g., subgroup analysis, meta-regression). | Section 2.5 | |
| 13 f | Describe any sensitivity analyses conducted to assess robustness of the synthesized results. | Section 2.4 | |
| Reporting bias assessment | 14 | Describe any methods used to assess risk of bias due to missing results in a synthesis (arising from reporting biases). | Figure 2 |
| Certainty assessment | 15 | Describe any methods used to assess certainty (or confidence) in the body of evidence for an outcome. | Section 2.4 and Table 2 |
| RESULTS | |||
| Study selection | 16 a | Describe the results of the search and selection process, from the number of records identified in the search to the number of studies included in the review, ideally using a flow diagram. | Figure 1 |
| 16 b | Cite studies that might appear to meet the inclusion criteria but were excluded, and explain why they were excluded. | Figure 1 | |
| Study characteristics | 17 | Cite each included study and present its characteristics. | Table 1 |
| Risk of bias in studies | 18 | Present assessments of risk of bias for each included study. | Figure 2 |
| Results of individual studies | 19 | For all outcomes, present, for each study: (a) summary statistics for each group (where appropriate) and (b) an effect estimate and its precision (e.g., confidence/credible interval), ideally using structured tables or plots. | Figure 3, Figure 4, Figure 5, Figure 6, Figure 7 and Figure 8 |
| Results of syntheses | 20 a | For each synthesis, briefly summarize the characteristics and risk of bias among contributing studies. | Table 1 |
| 20 b | Present results of all statistical syntheses conducted. If meta-analysis was done, present for each the summary estimate and its precision (e.g., confidence/credible interval) and measures of statistical heterogeneity. If comparing groups, describe the direction of the effect. | Section 3 | |
| 20 c | Present results of all investigations of possible causes of heterogeneity among study results. | Section 3 | |
| 20 d | Present results of all sensitivity analyses conducted to assess the robustness of the synthesized results. | Section 3 | |
| Reporting biases | 21 | Present assessments of risk of bias due to missing results (arising from reporting biases) for each synthesis assessed. | Figure 2 |
| Certainty of evidence | 22 | Present assessments of certainty (or confidence) in the body of evidence for each outcome assessed. | Table 2 |
| DISCUSSION | |||
| Discussion | 23 a | Provide a general interpretation of the results in the context of other evidence. | Section 4 |
| 23 b | Discuss any limitations of the evidence included in the review. | Section 4 | |
| 23 c | Discuss any limitations of the review processes used. | Section 4 | |
| 23 d | Discuss implications of the results for practice, policy, and future research. | Section 4 | |
| OTHER INFORMATION | |||
| Registration and protocol | 24 a | Provide registration information for the review, including register name and registration number, or state that the review was not registered. | Section 2.1 |
| 24 b | Indicate where the review protocol can be accessed, or state that a protocol was not prepared. | N | |
| 24 c | Describe and explain any amendments to information provided at registration or in the protocol. | N | |
| Support | 25 | Describe sources of financial or non-financial support for the review, as well as the role of the funders or sponsors in the review. | Funding |
| Competing interests | 26 | Declare any competing interests of the review authors. | Conflicts of Interest |
| Availability of data, code, and other materials | 27 | Report which of the following are publicly available and where they can be found: template data collection forms; data extracted from included studies; data used for all analyses; analytic code; and any other materials used in the review. | N |
References
- Lin, X.; Li, H. Obesity: Epidemiology, Pathophysiology, and Therapeutics. Front. Endocrinol. 2021, 12, 706978. [Google Scholar] [CrossRef] [PubMed]
- Stefan, N.; Birkenfeld, A.L.; Schulze, M.B. Global Pandemics Interconnected—Obesity, Impaired Metabolic Health and COVID-19. Nat. Rev. Endocrinol. 2021, 17, 135–149. [Google Scholar] [CrossRef] [PubMed]
- Alimoradi, Z.; Golboni, F.; Griffiths, M.D.; Broström, A.; Lin, C.Y.; Pakpour, A.H. Weight-Related Stigma and Psychological Distress: A Systematic Review and Meta-Analysis. Clin. Nutr. 2020, 39, 2001–2013. [Google Scholar] [CrossRef] [PubMed]
- Blüher, M. Obesity: Global Epidemiology and Pathogenesis. Nat. Rev. Endocrinol. 2019, 15, 288–298. [Google Scholar] [CrossRef]
- Kim, J.Y. Optimal Diet Strategies for Weight Loss and Weight Loss Maintenance. J. Obes. Metab. Syndr. 2021, 30, 20–31. [Google Scholar] [CrossRef]
- Rynders, C.A.; Thomas, E.A.; Zaman, A.; Pan, Z.; Catenacci, V.A.; Melanson, E.L. Effectiveness of Intermittent Fasting and Time-Restricted Feeding Compared to Continuous Energy Restriction for Weight Loss. Nutrients 2019, 11, 2442. [Google Scholar] [CrossRef]
- Queiroz, J.D.N.; MacEdo, R.C.O.; Dos Santos, G.C.; Munhoz, S.V.; MacHado, C.L.F.; De Menezes, R.L.; Menzem, E.N.; Moritz, C.E.J.; Pinto, R.S.; Tinsley, G.M.; et al. Cardiometabolic Effects of Early v. Delayed Time-Restricted Eating plus Energetic Restriction in Adults with Overweight and Obesity: An Exploratory Randomised Clinical Trial. Br. J. Nutr. 2023, 129, 637–649. [Google Scholar] [CrossRef]
- Xie, Z.; Sun, Y.; Ye, Y.; Hu, D.; Zhang, H.; He, Z.; Zhao, H.; Yang, H.; Mao, Y. Randomized Controlled Trial for Time-Restricted Eating in Healthy Volunteers without Obesity. Nat. Commun. 2022, 13, 1003. [Google Scholar] [CrossRef]
- Page, M.J.; McKenzie, J.E.; Bossuyt, P.M.; Boutron, I.; Hoffmann, T.C.; Mulrow, C.D.; Shamseer, L.; Tetzlaff, J.M.; Akl, E.A.; Brennan, S.E.; et al. The PRISMA 2020 Statement: An Updated Guideline for Reporting Systematic Reviews. Int. J. Surg. 2021, 88, 105906. [Google Scholar] [CrossRef]
- Methley, A.M.; Campbell, S.; Chew-Graham, C.; McNally, R.; Cheraghi-Sohi, S. PICO, PICOS and SPIDER: A Comparison Study of Specificity and Sensitivity in Three Search Tools for Qualitative Systematic Reviews. BMC Health Serv. Res. 2014, 14, 579. [Google Scholar] [CrossRef]
- He, M.; Wang, J.; Liang, Q.; Li, M.; Guo, H.; Wang, Y.; Deji, C.; Sui, J.; Wang, Y.W.; Liu, Y.; et al. Time-Restricted Eating with or without Low-Carbohydrate Diet Reduces Visceral Fat and Improves Metabolic Syndrome: A Randomized Trial. Cell Rep. Med. 2022, 3, 100777. [Google Scholar] [CrossRef] [PubMed]
- Thomas, E.A.; Zaman, A.; Sloggett, K.J.; Steinke, S.; Grau, L.; Catenacci, V.A.; Cornier, M.; Rynders, C.A. Early Time-restricted Eating Compared with Daily Caloric Restriction: A Randomized Trial in Adults with Obesity. Obesity 2022, 30, 1027–1038. [Google Scholar] [CrossRef]
- Steger, F.L.; Jamshed, H.; Bryan, D.R.; Richman, J.S.; Warriner, A.H.; Hanick, C.J.; Martin, C.K.; Salvy, S.J.; Peterson, C.M. Early Time-Restricted Eating Affects Weight, Metabolic Health, Mood, and Sleep in Adherent Completers: A Secondary Analysis. Obesity 2023, 31, 96–107. [Google Scholar] [CrossRef] [PubMed]
- Lin, Y.J.; Wang, Y.T.; Chan, L.C.; Chu, N.F. Effect of Time-Restricted Feeding on Body Composition and Cardio-Metabolic Risk in Middle-Aged Women in Taiwan. Nutrition 2022, 93, 111504. [Google Scholar] [CrossRef] [PubMed]
- Kunduraci, Y.E.; Ozbek, H. Does the Energy Restriction Intermittent Fasting Diet Alleviate Metabolic Syndrome Biomarkers? A Randomized Controlled Trial. Nutrients 2020, 12, 3213. [Google Scholar] [CrossRef]
- Jamshed, H.; Steger, F.L.; Bryan, D.R.; Richman, J.S.; Warriner, A.H.; Hanick, C.J.; Martin, C.K.; Salvy, S.J.; Peterson, C.M. Effectiveness of Early Time-Restricted Eating for Weight Loss, Fat Loss, and Cardiometabolic Health in Adults with Obesity: A Randomized Clinical Trial. JAMA Intern. Med. 2022, 182, 953–962. [Google Scholar] [CrossRef]
- Higgins, J.P.T.; Altman, D.G.; Gotzsche, P.C.; Juni, P.; Moher, D.; Oxman, A.D.; Savovic, J.; Schulz, K.F.; Weeks, L.; Sterne, J.A.C. The Cochrane Collaboration’s Tool for Assessing Risk of Bias in Randomised Trials. BMJ 2011, 343, d5928. [Google Scholar] [CrossRef]
- Guyatt, G.; Oxman, A.D.; Akl, E.A.; Kunz, R.; Vist, G.; Brozek, J.; Norris, S.; Falck-Ytter, Y.; Glasziou, P.; deBeer, H. GRADE Guidelines: 1. Introduction—GRADE Evidence Profiles and Summary of Findings Tables. J. Clin. Epidemiol. 2011, 64, 383–394. [Google Scholar] [CrossRef]
- Higgins, J.P.T.; Thomas, J.; Chandler, J.; Cumpston, M.; Li, T.; Page, M.J.; Welch, V.A. (Eds.) Cochrane Handbook for Systematic Reviews of Interventions; Wiley: Hoboken, NJ, USA, 2019; ISBN 9781119536628. [Google Scholar]
- Huang, L.; Chen, Y.; Wen, S.; Lu, D.; Shen, X.; Deng, H.; Xu, L. Is Time-Restricted Eating (8/16) Beneficial for Body Weight and Metabolism of Obese and Overweight Adults? A Systematic Review and Meta-Analysis of Randomized Controlled Trials. Food Sci. Nutr. 2023, 11, 1187–1200. [Google Scholar] [CrossRef]
- Horn, D.B.; Almandoz, J.P.; Look, M. What Is Clinically Relevant Weight Loss for Your Patients and How Can It Be Achieved? A Narrative Review. Postgrad. Med. 2022, 134, 359–375. [Google Scholar] [CrossRef]
- Ryan, D.H.; Yockey, S.R. Weight Loss and Improvement in Comorbidity: Differences at 5%, 10%, 15%, and Over. Curr. Obes. Rep. 2017, 6, 187–194. [Google Scholar] [CrossRef] [PubMed]
- Wing, R.R.; Lang, W.; Wadden, T.A.; Safford, M.; Knowler, W.C.; Bertoni, A.G.; Hill, J.O.; Brancati, F.L.; Peters, A.; Wagenknecht, L. Benefits of Modest Weight Loss in Improving Cardiovascular Risk Factors in Overweight and Obese Individuals with Type 2 Diabetes. Diabetes Care 2011, 34, 1481–1486. [Google Scholar] [CrossRef] [PubMed]
- Liu, J.; Yi, P.; Liu, F. The Effect of Early Time-Restricted Eating vs. Later Time-Restricted Eating on 2 Weight Loss and Metabolic Health: A Network Meta-Analysis of Randomized Controlled Trials Keywords. J. Clin. Endocrinol. Metab. 2023, 108, 1824–1834. [Google Scholar] [CrossRef] [PubMed]
- Dong, T.A.; Sandesara, P.B.; Dhindsa, D.S.; Mehta, A.; Arneson, L.C.; Dollar, A.L.; Taub, P.R.; Sperling, L.S. Intermittent Fasting: A Heart Healthy Dietary Pattern? Am. J. Med. 2020, 133, 901–907. [Google Scholar] [CrossRef] [PubMed]
- Paoli, A.; Tinsley, G.; Bianco, A.; Moro, T. The Influence of Meal Frequency and Timing on Health in Humans: The Role of Fasting. Nutrients 2019, 11, 719. [Google Scholar] [CrossRef]
- Charlot, A.; Hutt, F.; Sabatier, E.; Zoll, J. Beneficial Effects of Early Time-Restricted Feeding on Metabolic Diseases: Importance of Aligning Food Habits with the Circadian Clock. Nutrients 2021, 13, 1405. [Google Scholar] [CrossRef] [PubMed]
- Hołowko, J.; Michalczyk, M.M.; Zajac, A.; Czerwińska-Rogowska, M.; Ryterska, K.; Banaszczak, M.; Jakubczyk, K.; Stachowska, E. Six Weeks of Calorie Restriction Improves Body Composition and Lipid Profile in Obese and Overweight Former Athletes. Nutrients 2019, 11, 1461. [Google Scholar] [CrossRef] [PubMed]
- Huffman, K.M.; Parker, D.C.; Bhapkar, M.; Racette, S.B.; Martin, C.K.; Redman, L.M.; Das, S.K.; Connelly, M.A.; Pieper, C.F.; Orenduff, M.; et al. Calorie Restriction Improves Lipid-Related Emerging Cardiometabolic Risk Factors in Healthy Adults without Obesity: Distinct Influences of BMI and Sex from CALERIE TM a Multicentre, Phase 2, Randomised Controlled Trial. EClinicalMedicine 2022, 43, 101261. [Google Scholar] [CrossRef]
- Soare, A.; Weiss, E.P.; Pozzilli, P. Benefits of Caloric Restriction for Cardiometabolic Health, Including Type 2 Diabetes Mellitus Risk. Diabetes Metab. Res. Rev. 2014, 30, 41–47. [Google Scholar] [CrossRef]
- Liu, L.; Chen, W.; Wu, D.; Hu, F. Metabolic Efficacy of Time-Restricted Eating in Adults: A Systematic Review and Meta-Analysis of Randomized Controlled Trials. J. Clin. Endocrinol. Metab. 2022, 107, 3428–3441. [Google Scholar] [CrossRef]
- Meng, H.; Zhu, L.; Kord-Varkaneh, H.O.; Santos, H.; Tinsley, G.M.; Fu, P. Effects of Intermittent Fasting and Energy-Restricted Diets on Lipid Profile: A Systematic Review and Meta-Analysis. Nutrition 2020, 77, 110801. [Google Scholar] [CrossRef] [PubMed]
- Santos, H.O.; Macedo, R.C.O. Impact of Intermittent Fasting on the Lipid Profile: Assessment Associated with Diet and Weight Loss. Clin. Nutr. ESPEN 2018, 24, 14–21. [Google Scholar] [CrossRef]
- Pellegrini, M.; Cioffi, I.; Evangelista, A.; Ponzo, V.; Goitre, I.; Ciccone, G.; Ghigo, E.; Bo, S. Effects of Time-Restricted Feeding on Body Weight and Metabolism. A Systematic Review and Meta-Analysis. Rev. Endocr. Metab. Disord. 2020, 21, 17–33. [Google Scholar] [CrossRef] [PubMed]
- Ordovas, J.M. Genetic Influences on Blood Lipids and Cardiovascular Disease Risk: Tools for Primary Prevention. Proc. Am. J. Clin. Nutr. 2009, 89, 1509S–1517S. [Google Scholar] [CrossRef]
- Sun, J.C.; Tan, Z.T.; He, C.J.; Hu, H.L.; Zhai, C.L.; Qian, G. Time-Restricted Eating with Calorie Restriction on Weight Loss and Cardiometabolic Risk: A Systematic Review and Meta-Analysis. Eur. J. Clin. Nutr. 2023, 7, 1014–1025. [Google Scholar] [CrossRef] [PubMed]
- Chen, W.; Liu, X.; Bao, L.; Yang, P.; Zhou, H. Health Effects of the Time-Restricted Eating in Adults with Obesity: A Systematic Review and Meta-Analysis. Front. Nutr. 2023, 10, 1079250. [Google Scholar] [CrossRef]
- Turner, L.; Charrouf, R.; Martínez-Vizcaíno, V.; Hutchison, A.; Heilbronn, L.K.; Fernández-Rodríguez, R. The Effects of Time-Restricted Eating versus Habitual Diet on Inflammatory Cytokines and Adipokines in the General Adult Population: A Systematic Review with Meta-Analysis. Am. J. Clin. Nutr. 2023, in press. [Google Scholar] [CrossRef]
- Schroor, M.M.; Joris, P.J.; Plat, J.; Mensink, R.P. Effects of Intermittent Energy Restriction Compared with Those of Continuous Energy Restriction on Body Composition and Cardiometabolic Risk Markers—A Systematic Review and Meta-Analysis of Randomized Controlled Trials in Adults. Adv. Nutr. 2023, in press. [Google Scholar] [CrossRef]


| Study | Country | Study Group (Population) | Duration | Outcomes | Type of Intervention | Eating Window | Caloric Restriction (CR) | Sample Size n (m/f) | Age (Years) | BMI (kg/m2) |
|---|---|---|---|---|---|---|---|---|---|---|
| Queiroz et al. (2023) [7] | Brazil | Overweight and obesity | 8 weeks | Changes in BW, FFM, FM, HDL, LDL, TG, TC, FG | eTRE | (8:16) 8:00–16:00 | −25% EI | 13 (2/11) | 33 ± 6 | 30.0 ± 8.0 |
| lTRE | (8:16) 12:00–20:00 | −25% EI | 11 (2/9) | 30 ± 7 | 30.0 ± 5.0 | |||||
| Non-TRE | 8:00–20:00 | −25% EI | 13 (2/11) | 26 ± 4 | 30.0 ± 1.0 | |||||
| Thomas et al. (2022) [12] | Colorado, USA | Overweight and obesity | 12 weeks | Changes in BW, FFM, FM | eTRE | (10:14) Starting within 3 h after waking up | −35% EI | 41 (7/34) | 38 ± 8 | 34.6 ± 5.8 |
| Non-TRE | Unrestricted eating time | −35% EI | 40 (5/35) | 38 ± 8 | 33.7 ± 5.6 | |||||
| Steger et al. (2023) [13] | United Kingdom | Obesity | 14 weeks | Changes in BW, FFM, FM | eTRE | (8:16) 7:00–15:00 | −500 kcal/day | 15 (4/11) | 46 ± 11 | 38.5 ± 7.1 |
| Non-TRE | ≥12 h/day | −500 kcal/day | 21 (6/15) | 42 ± 12 | 38.3 ± 6.0 | |||||
| Lin et al. (2022) [14] | Taiwan | Normal and overweight women | 8 weeks | Changes in BW, FFM, WC, DBP, SBP, HDL, LDL, TG, TC, FG | mTRE | (8:16) 10:00–18:00 or 12:00–20:00 | −200 kcal/day | 30 (0/30) | 50 ± 8 | 25.9 ± 3.7 |
| Non-TRE | Unrestricted eating time | −200 kcal/day | 33 (0/33) | 54 ± 8 | 25.7 ± 3.8 | |||||
| He et al. (2022) [11] | China | Obesity with metabolic syndrome | 12 weeks | Changes in BW, FM, WC, DBP, SBP | eTRE | (8:16) 8:00–16:00 | Carbohydrate restriction to < 26% of EI; CR undefined | 32 (22/10) | 41 ± 9 | 29.1 ± 3.4 |
| lTRE | (8:16) 12:00–20:00 | Carbohydrate restriction to < 26% of EI; CR undefined | 20 (15/5) | 37 ± 8 | 28.8 ± 2.7 | |||||
| Non-TRE | Unrestricted eating time | Carbohydrate restriction to < 26% of EI; CR undefined | 55 (30/25) | 41 ± 1 | 29.3 ± 3.7 | |||||
| Kunduraci et al. (2020) [15] | Turkey | Obesity with metabolic syndrome | 12 weeks | Changes in BW, FFM, FM, WC, DBP, SBP, HDL, LDL, TG, TC, FG | mTRE | (8:16) 8:00–16:00 or 9:00–17:00 or 10:00–18:00 or 11:00–19:00 | −25% EI | 32 (16/16) | 47 ± 12 | 36.6 ± 5.3 |
| Non-TRE | Unrestricted eating time | −25% EI | 33 (15/18) | 49 ± 12 | 32.9 ± 4.1 | |||||
| Jamshed et al. (2022) [16] | Alabama, USA | Obesity | 12 weeks | Changes in BW, FFM, FM, WC, DBP, SBP, HDL, LDL, TG, TC, FG | eTRE | (8:16) 7:00–15:00 | −500 kcal/day | 45 (10/35) | 43 ± 10 | 40.1 ± 6.6 |
| Non-TRE | ≥ 12 h/day | −500 kcal/day | 45 (8/37) | 43 ± 11 | 39.2 ± 6.8 |
| Certainty Assessment | No. of Patients | Effect | Certainty | ||||||||
|---|---|---|---|---|---|---|---|---|---|---|---|
| No. of Studies | Study Design | Risk of Bias | Inconsistency | Indirectness | Imprecision | Other Considerations | TRE with CR | CR | Relative (95% CI) | Absolute (95% CI) | |
| BW | |||||||||||
| 9 | randomized trials | serious | not serious | not serious | serious | none | 231 | 295 | - | MD 2.11 lower (2.68 lower to 1.54 lower) | Low |
| BM | |||||||||||
| 8 | randomized trials | serious | not serious | not serious | serious | none | 192 | 258 | - | MD 0.75 lower (1.35 lower to 0.16 lower) | Low |
| FFM | |||||||||||
| 7 | randomized trials | serious | not serious | not serious | serious | none | 170 | 181 | - | MD 0.22 lower (0.68 lower to 0.25 higher) | Low |
| WC | |||||||||||
| 5 | randomized trials | serious | not serious | not serious | serious | none | 165 | 221 | - | MD 1.27 lower (2.36 lower to 0.19 lower) | Low |
| SBP | |||||||||||
| 5 | randomized trials | serious | serious | not serious | serious | none | 159 | 221 | - | MD 0.36 lower (4.56 lower to 3.84 higher) | Very low |
| DBP | |||||||||||
| 5 | randomized trials | serious | very serious | not serious | serious | none | 159 | 221 | - | MD 2.42 lower (7.6 lower to 2.77 higher) | Very low |
| FG | |||||||||||
| 4 | randomized trials | serious | not serious | not serious | serious | none | 131 | 137 | - | MD 0.14 higher (0.87 lower to 1.15 higher) | Low |
| TC | |||||||||||
| 5 | randomized trials | serious | not serious | not serious | serious | none | 131 | 137 | - | MD 0.98 higher (2.19 lower to 4.15 higher) | Low |
| HDL | |||||||||||
| 5 | randomized trials | serious | not serious | not serious | serious | none | 131 | 137 | - | MD 1.71 higher (0.22 lower to 3.65 higher) | Low |
| LDL | |||||||||||
| 5 | randomized trials | serious | not serious | not serious | serious | none | 131 | 137 | - | MD 0.77 higher (2.59 lower to 1.05 higher) | Low |
| TG | |||||||||||
| 5 | randomized trials | serious | not serious | not serious | serious | none | 131 | 137 | - | MD 2.26 higher (4.43 lower to 8.96 higher) | Low |
Disclaimer/Publisher’s Note: The statements, opinions and data contained in all publications are solely those of the individual author(s) and contributor(s) and not of MDPI and/or the editor(s). MDPI and/or the editor(s) disclaim responsibility for any injury to people or property resulting from any ideas, methods, instructions or products referred to in the content. |
© 2023 by the authors. Licensee MDPI, Basel, Switzerland. This article is an open access article distributed under the terms and conditions of the Creative Commons Attribution (CC BY) license (https://creativecommons.org/licenses/by/4.0/).
Share and Cite
Črešnovar, T.; Habe, B.; Jenko Pražnikar, Z.; Petelin, A. Effectiveness of Time-Restricted Eating with Caloric Restriction vs. Caloric Restriction for Weight Loss and Health: Meta-Analysis. Nutrients 2023, 15, 4911. https://doi.org/10.3390/nu15234911
Črešnovar T, Habe B, Jenko Pražnikar Z, Petelin A. Effectiveness of Time-Restricted Eating with Caloric Restriction vs. Caloric Restriction for Weight Loss and Health: Meta-Analysis. Nutrients. 2023; 15(23):4911. https://doi.org/10.3390/nu15234911
Chicago/Turabian StyleČrešnovar, Tanja, Bernarda Habe, Zala Jenko Pražnikar, and Ana Petelin. 2023. "Effectiveness of Time-Restricted Eating with Caloric Restriction vs. Caloric Restriction for Weight Loss and Health: Meta-Analysis" Nutrients 15, no. 23: 4911. https://doi.org/10.3390/nu15234911
APA StyleČrešnovar, T., Habe, B., Jenko Pražnikar, Z., & Petelin, A. (2023). Effectiveness of Time-Restricted Eating with Caloric Restriction vs. Caloric Restriction for Weight Loss and Health: Meta-Analysis. Nutrients, 15(23), 4911. https://doi.org/10.3390/nu15234911