

Aronia in the Type 2 Diabetes Treatment Regimen

Abstract
:1. Introduction
2. Materials and Methods
2.1. Study Design
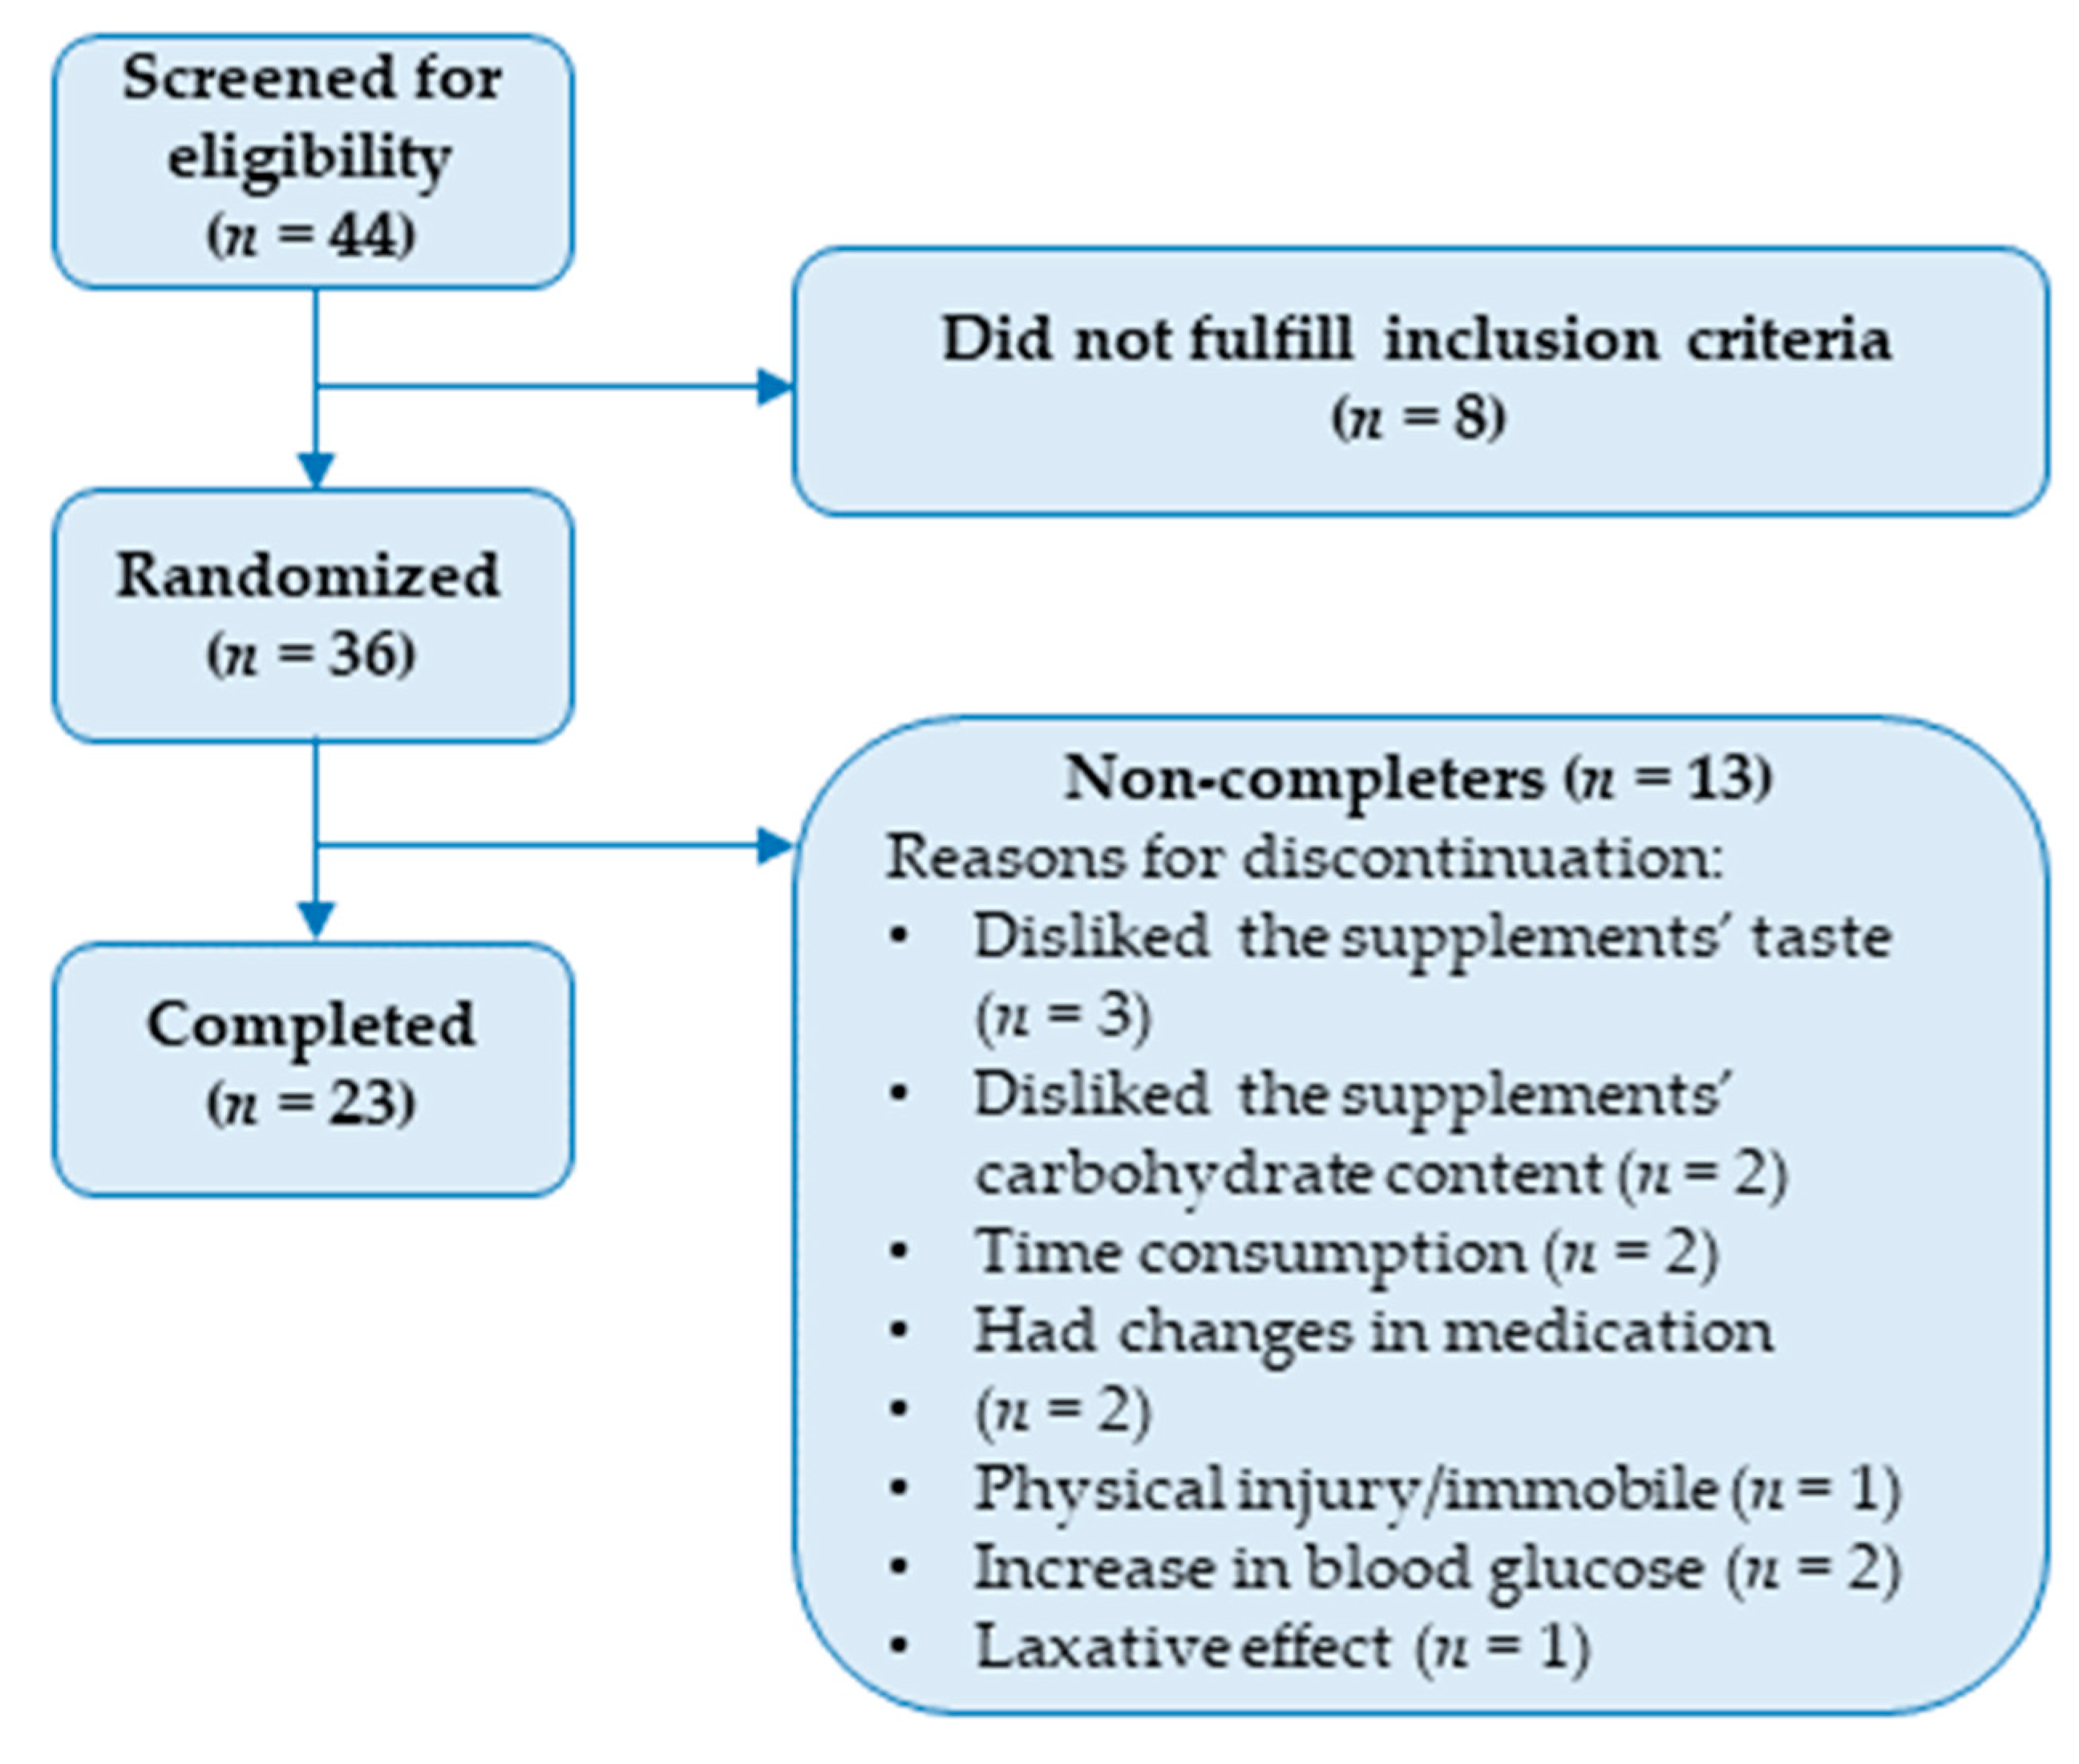
2.2. Participants
2.3. Test Products
2.4. Compliance
2.5. Oral Glucose Tolerance Test
2.6. Anthropometric Measurements
2.7. Blood Analyses
2.7.1. Baseline Measurements, HbA1c and Lipids
2.7.2. Glucose (Complete Cases)
2.7.3. Fructosamine and Glucose (Incomplete Cases)
2.7.4. Insulin, Glucagon, GIP, and GLP-1
2.8. Power Calculation
2.9. Statistics and Calculations
3. Results
3.1. Baseline Characteristics
3.2. Compliance
3.3. Anthropometric Measurements
3.4. Blood Analyses
4. Discussion
5. Conclusions
Author Contributions
Funding
Institutional Review Board Statement
Informed Consent Statement
Data Availability Statement
Acknowledgments
Conflicts of Interest
References
- Paunović, S.M.; Mašković, P.; Milinković, M. Optimization of Primary Metabolites and Antimicrobial Activity in Aronia Berries as Affected by Soil Cultivation Systems. Erwerbs-Obstbau 2022, 64, 581–589. [Google Scholar] [CrossRef]
- Kulling, S.E.; Rawel, H.M. Chokeberry (Aronia melanocarpa)—A review on the characteristic components and potential health effects. Planta Medica 2008, 74, 1625–1634. [Google Scholar] [CrossRef] [PubMed]
- Simeonov, S.B.; Botushanov, N.P.; Karahanian, E.B.; Pavlova, M.B.; Husianitis, H.K.; Troev, D.M. Effects of Aronia melanocarpa juice as part of the dietary regimen in patients with diabetes mellitus. Folia Medica 2002, 44, 20–23. [Google Scholar] [PubMed]
- Milutinović, M.; Radovanović, R.V.; Šavikin, K.; Radenković, S.; Arvandi, M.; Pešić, M.; Kostić, M.; Miladinović, B.; Branković, S.; Kitić, D. Chokeberry juice supplementation in type 2 diabetic patients-impact on health status. J. Appl. Biomed. 2019, 17, 218–224. [Google Scholar] [CrossRef] [PubMed]
- Yamane, T.; Kozuka, M.; Wada-Yoneta, M.; Sakamoto, T.; Nakagaki, T.; Nakano, Y.; Ohkubo, I. Aronia juice suppresses the elevation of postprandial blood glucose levels in adult healthy Japanese. Clin. Nutr. Exp. 2017, 12, 20–26. [Google Scholar] [CrossRef]
- Christiansen, C.B.; Mellbye, F.B.; Hermansen, K.; Jeppesen, P.B.; Gregersen, S. Effects of Aronia melanocarpa on Cardiometabolic Diseases: A Systematic Review of Quasi-Design Studies and Randomized Controlled Trials. Rev. Diabet. Stud. 2022, 18, 76–92. [Google Scholar] [CrossRef]
- Pandey, K.B.; Rizvi, S.I. Plant Polyphenols as Dietary Antioxidants in Human Health and Disease. Oxidative Med. Cell. Longev. 2009, 2, 897484. [Google Scholar] [CrossRef]
- Jurendić, T.; Ščetar, M. Aronia melanocarpa products and by-products for health and nutrition: A review. Antioxidants 2021, 10, 1052. [Google Scholar] [CrossRef]
- Oszmiański, J.; Wojdylo, A. Aronia melanocarpa phenolics and their antioxidant activity. Eur. Food Res. Technol. 2005, 221, 809–813. [Google Scholar] [CrossRef]
- Jakobek, L.; Šeruga, M.; Medvidović-Kosanović, M.; Novak, I. Antioxidant activity and polyphenols of Aronia in comparison to other berry species. Agric. Conspec. Sci. 2007, 72, 301–306. [Google Scholar]
- Tolić, M.-T.; Landeka Jurčević, I.; Panjkota Krbavčić, I.; Marković, K.; Vahčić, N. Phenolic content, antioxidant capacity and quality of chokeberry (Aronia melanocarpa) products. Food Technol. Biotechnol. 2015, 53, 171–179. [Google Scholar] [CrossRef] [PubMed]
- Zare, R.; Kimble, R.; Ali Redha, A.; Cerullo, G.; Clifford, T. How can chokeberry (Aronia) (poly)phenol-rich supplementation help athletes? A systematic review of human clinical trials. Food Funct. 2023, 14, 5478–5491. [Google Scholar] [CrossRef] [PubMed]
- Hollman, P.C.; Cassidy, A.; Comte, B.; Heinonen, M.; Richelle, M.; Richling, E.; Serafini, M.; Scalbert, A.; Sies, H.; Vidry, S. The biological relevance of direct antioxidant effects of polyphenols for cardiovascular health in humans is not established. J. Nutr. 2011, 141, 989s–1009s. [Google Scholar] [CrossRef]
- Yamane, T.; Kozuka, M.; Konda, D.; Nakano, Y.; Nakagaki, T.; Ohkubo, I.; Ariga, H. Improvement of blood glucose levels and obesity in mice given aronia juice by inhibition of dipeptidyl peptidase IV and α-glucosidase. J. Nutr. Biochem. 2016, 31, 106–112. [Google Scholar] [CrossRef] [PubMed]
- Van de Laar, F.A.; Lucassen, P.L.; Akkermans, R.P.; Van de Lisdonk, E.H.; Rutten, G.E.; Van Weel, C. Alpha-glucosidase inhibitors for type 2 diabetes mellitus. Cochrane Database Syst. Rev. 2005, 2009, CD003639. [Google Scholar] [CrossRef] [PubMed]
- Omar, B.; Ahrén, B. Pleiotropic Mechanisms for the Glucose-Lowering Action of DPP-4 Inhibitors. Diabetes 2014, 63, 2196–2202. [Google Scholar] [CrossRef]
- Wong, C.Y.; Al-Salami, H.; Dass, C.R. C2C12 cell model: Its role in understanding of insulin resistance at the molecular level and pharmaceutical development at the preclinical stage. J. Pharm. Pharmacol. 2020, 72, 1667–1693. [Google Scholar] [CrossRef]
- Chen, J.; Zhu, J.; Meng, X. Aronia melanocarpa anthocyanin extracts are an effective regulator of suppressor of cytokine signaling 3-dependent insulin resistance in HepG2 and C2C12 cells. J. Funct. Foods 2020, 75, 104258. [Google Scholar] [CrossRef]
- Chen, J.; Meng, X. Aronia melanocarpa Anthocyanin Extracts Improve Hepatic Structure and Function in High-Fat Diet-/Streptozotocin-Induced T2DM Mice. J. Agric. Food Chem. 2022, 70, 11531–11543. [Google Scholar] [CrossRef]
- Mu, J.; Xin, G.; Zhang, B.; Wang, Y.; Ning, C.; Meng, X. Beneficial effects of Aronia melanocarpa berry extract on hepatic insulin resistance in type 2 diabetes mellitus rats. J. Food Sci. 2020, 85, 1307–1318. [Google Scholar] [CrossRef]
- Wiczkowski, W.; Romaszko, E.; Piskula, M.K. Bioavailability of cyanidin glycosides from natural chokeberry (Aronia melanocarpa) juice with dietary-relevant dose of anthocyanins in humans. J. Agric. Food Chem. 2010, 58, 12130–12136. [Google Scholar] [CrossRef] [PubMed]
- Xie, L.; Vance, T.; Kim, B.; Lee, S.G.; Caceres, C.; Wang, Y.; Hubert, P.A.; Lee, J.-Y.; Chun, O.K.; Bolling, B.W. Aronia berry polyphenol consumption reduces plasma total and low-density lipoprotein cholesterol in former smokers without lowering biomarkers of inflammation and oxidative stress: A randomized controlled trial. Nutr. Res. 2017, 37, 67–77. [Google Scholar] [CrossRef] [PubMed]
- Valero-Cases, E.; Nuncio-Jáuregui, N.; Frutos, M.J. Influence of Fermentation with Different Lactic Acid Bacteria and in Vitro Digestion on the Biotransformation of Phenolic Compounds in Fermented Pomegranate Juices. J. Agric. Food Chem. 2017, 65, 6488–6496. [Google Scholar] [CrossRef] [PubMed]
- Du, X.; Myracle, A.D. Fermentation alters the bioaccessible phenolic compounds and increases the alpha-glucosidase inhibitory effects of aronia juice in a dairy matrix following in vitro digestion. Food Funct. 2018, 9, 2998–3007. [Google Scholar] [CrossRef]
- Kim, N.-H.; Jegal, J.; Kim, Y.N.; Chung, D.-M.; Heo, J.-D.; Rho, J.-R.; Yang, M.H.; Jeong, E.J. Antiobesity Effect of Fermented Chokeberry Extract in High-Fat Diet-Induced Obese Mice. J. Med. Food 2018, 21, 1113–1119. [Google Scholar] [CrossRef]
- Gregersen, S.; Jeppesen, P.B.; Holst, J.J.; Hermansen, K. Antihyperglycemic effects of stevioside in type 2 diabetic subjects. Metabolism 2004, 53, 73–76. [Google Scholar] [CrossRef]
- Matthews, D.R.; Hosker, J.P.; Rudenski, A.S.; Naylor, B.; Treacher, D.F.; Turner, R.C. Homeostasis model assessment: Insulin resistance and β-cell function from fasting plasma glucose and insulin concentrations in man. Diabetologia 1985, 28, 412–419. [Google Scholar] [CrossRef]
- Matsuda, M.; DeFronzo, R.A. Insulin sensitivity indices obtained from oral glucose tolerance testing: Comparison with the euglycemic insulin clamp. Diabetes Care 1999, 22, 1462–1470. [Google Scholar] [CrossRef]
- Danese, E.; Montagnana, M.; Nouvenne, A.; Lippi, G. Advantages and pitfalls of fructosamine and glycated albumin in the diagnosis and treatment of diabetes. J. Diabetes Sci. Technol. 2015, 9, 169–176. [Google Scholar] [CrossRef]
- Davies, M.J.; Aroda, V.R.; Collins, B.S.; Gabbay, R.A.; Green, J.; Maruthur, N.M.; Rosas, S.E.; Del Prato, S.; Mathieu, C.; Mingrone, G. Management of hyperglycaemia in type 2 diabetes, 2022. A consensus report by the American Diabetes Association (ADA) and the European Association for the Study of Diabetes (EASD). Diabetologia 2022, 65, 1925–1966. [Google Scholar] [CrossRef]
- Holst, J.J.; Rosenkilde, M.M. GIP as a Therapeutic Target in Diabetes and Obesity: Insight From Incretin Co-agonists. J. Clin. Endocrinol. Metab. 2020, 105, e2710–e2716. [Google Scholar] [CrossRef] [PubMed]
- Yamane, T.; Imai, M.; Handa, S.; Yamada, K.; Sakamoto, T.; Ishida, T.; Inui, H.; Yamamoto, Y.; Nakagaki, T.; Nakano, Y. Reduction of blood glucose and HbA1c levels by cyanidin 3,5-diglucoside in KKAy mice. J. Funct. Foods 2019, 58, 21–26. [Google Scholar] [CrossRef]
- Esfahani, A.; Lam, J.; Kendall, C.W. Acute effects of raisin consumption on glucose and insulin reponses in healthy individuals. J. Nutr. Sci. 2014, 3, e1. [Google Scholar] [CrossRef] [PubMed]
- Atkinson, F.S.; Foster-Powell, K.; Brand-Miller, J.C. International Tables of Glycemic Index and Glycemic Load Values: 2008. Diabetes Care 2008, 31, 2281–2283. [Google Scholar] [CrossRef] [PubMed]
- Kay, C.D.; Mazza, G.; Holub, B.J. Anthocyanins Exist in the Circulation Primarily as Metabolites in Adult Men1. J. Nutr. 2005, 135, 2582–2588. [Google Scholar] [CrossRef]
- de Ferrars, R.M.; Czank, C.; Zhang, Q.; Botting, N.P.; Kroon, P.A.; Cassidy, A.; Kay, C.D. The pharmacokinetics of anthocyanins and their metabolites in humans. Br. J. Pharmacol. 2014, 171, 3268–3282. [Google Scholar] [CrossRef]
- Ahlqvist, E.; Prasad, R.B.; Groop, L. Subtypes of Type 2 Diabetes Determined From Clinical Parameters. Diabetes 2020, 69, 2086–2093. [Google Scholar] [CrossRef]
- Leonard, W.; Zhang, P.; Ying, D.; Adhikari, B.; Fang, Z. Fermentation transforms the phenolic profiles and bioactivities of plant-based foods. Biotechnol. Adv. 2021, 49, 107763. [Google Scholar] [CrossRef]
- Zhang, H.; Hassan, Y.I.; Liu, R.; Mats, L.; Yang, C.; Liu, C.; Tsao, R. Molecular Mechanisms Underlying the Absorption of Aglycone and Glycosidic Flavonoids in a Caco-2 BBe1 Cell Model. ACS Omega 2020, 5, 10782–10793. [Google Scholar] [CrossRef]
- King, E.S.; Bolling, B.W. Composition, polyphenol bioavailability, and health benefits of aronia berry: A review. J. Food Bioact. 2020, 11, 13–30. [Google Scholar] [CrossRef]


| Nutritional Content Per Daily Dose | FAE | AE | Placebo |
|---|---|---|---|
| Energy (kcal) | 234.6 | 240.1 | 227.3 |
| Total fats (g) (%) | 3.7 (14.2) | 4.0 (15.0) | 3.5 (13.9) |
| -Saturated (g) | 2.9 | 3.0 | 2.4 |
| -Unsaturated (g) | 0.4 | 0.6 | 0.5 |
| -Polyunsaturated | 0.2 | 0.2 | 0.5 |
| Total carbohydrates (g) (%) | 43.2 (73.7) | 45.1 (75.1) | 41.1 (72.3) |
| -Free sugars (g) | 38.6 | 38.6 | 34.7 |
| Dietary fibers (g) | 9.2 | 6.6 | 8.1 |
| Protein (g) (%) | 2.5 (4.3) | 2.5 (4.2) | 3.7 (6.5) |
| Variable (Unit) | Completers (n = 23). Value in Mean ± SD or Median (IQR) | Randomized (n = 36). Value in Mean ± SD or Median (IQR) |
|---|---|---|
| Gender | 15 (M) 8 (W) | 21 (M) 15 (W) |
| Age (years) | 67.6 ± 5.5 | 66.9 ± 6.0 |
| Body weight (kg) | 82.0 ± 16.2 | 85.9 (72.6–95.5) |
| Body mass index (kg/m2) | 26.7 (23.2–29.8) | 28.6 (24.3–32.0) |
| Waist circumference (cm) | 101.5 (94.4–108.2) (M) 115.5 (95.6–124.4) (W) | 105.3 (97.1–112.6) (M) 116 (96.8–123.8) (W) |
| Systolic blood pressure (mmHg) | 141 ± 23.3 | 142 ± 20.9 |
| Diastolic blood pressure (mmHg) | 81 ± 13.3 | 81 ± 11.9 |
| Fasting plasma glucose (mmol/L) | 7.7 ± 1.6 | 7.9 ± 1.8 |
| Hemoglobin A1c (mmol/mol) | 50.0 (47.5–54) | 50.5 (47.0–55.0) |
| Medication/Compound | Completers (n = 23). Received by (Number Participants (%)) | Randomized (n = 36). Received by (Number Participants (%)) |
|---|---|---|
| Metformin | 21 (91.3) | 33 (91.7) |
| Insulin | 1 (4.3) | 3 (8.3) |
| GLP-1 receptor agonist | 4 (17.4) | 6 (16.7) |
| Dipeptidyl peptidase 4 inhibitor | 2 (8.7) | 2 (5.6) |
| Sodium–glucose Cotransporter-2 inhibitor | 8 (34.8) | 9 (25.0) |
| Sulfonylurea | 2 (8.7) | 3 (8.3) |
| Statins | 15 (65.2) | 25 (69.4) |
| ACE inhibitor | 10 (43.5) | 15 (41.7) |
| Angiotensin II receptor blocker | 4 (17.4) | 9 (25.0) |
| Beta-blocker | 8 (34.8) | 11 (30.6) |
| Antiplatelet/anticoagulant treatment | 6 (26.1) | 9 (25.0) |
| Calcium channel blocker | 6 (26.1) | 10 (27.8) |
| Cardiac glycosides | 0 (0.0) | 1 (2.8) |
| Diuretics | 5 (21.7) | 8 (22.2) |
| Levothyroxine treatment | 2 (8.7) | 2 (5.6) |
| Dietary supplement | 12 (52.2) | 20 (55.6) |
| Variable (Unit) | Δ-Mean for FAE | Δ-Mean for AE | Δ-Mean for Placebo | ||||
|---|---|---|---|---|---|---|---|
| Pre | Post | Pre | Post | Pre | Post | ||
| Body weight (kg) n = 36 | 0.75 ± 0.30 | 0.46 ± 0.26 | 0.60 ± 0.30 | ||||
| 86.3 ± 4.13 a | 87 ± 4.13 a | 87.7 ± 4.12 | 88.2 ± 4.12 | 87.6 ± 4.12 | 88.2 ± 4.12 | ||
| Body mass index (n = 36) | (ratio) | 1.01 (0.99–1.03) | 1.01 (0.99–1.03) | 0.98 (0.96–1.01) | |||
| kg/m2 | 28.7 | 29.0 | 28.8 | 29.0 | 28.9 | 28.5 | |
| Waist circumference (cm) n = 36 | 0.27 ± 0.73 | 0.54 ± 0.66 | −0.16 ± 0.72 | ||||
| 109.1 ± 3.18 | 109.4 ± 3.20 | 109.8 ± 3.18 | 110.3 ± 3.18 | 110 ± 3.18 | 109.9 ± 3.19 | ||
| HbA1c n = 36 | (ratio) | 1.02 (0.98–1.06) | 1.02 (0.99–1.06) | 1.00 (0.97–1.04) | |||
| (mmol/mol) | 53.8 ± 1.36 | 54.8 ± 1.42 | 53.6 ± 1.35 | 54.8 ± 1.38 | 54 ± 1.35 | 54.1 ± 1.39 | |
| Fructosamine (µmol/L) n = 36 | 3.90 ± 7.86 | 12.38 ± 7.09 | 10.01 ± 7.76 | ||||
| 294.66 ± 11.08 | 298.56 ± 11.35 | 284.84 ± 10.91 | 297.22 ± 10.91 | 289.97 ± 10.80 | 299.98 ± 11.30 | ||
| Fasting glucose (mmol/L) n = 36 | 0.24 ± 0.26 | 0.46 ± 0.24 | 0.24 ± 0.26 | ||||
| 8.53 ± 0.34 | 8.77 ± 0.36 | 8.32 ± 0.34 | 8.78 ± 0.34 | 8.38 ± 0.33 | 8.61 ± 0.35 | ||
| AUC (mmol/L × 240 min) n = 36 | −16.76 ± 90.87 | 55.37 ± 80.70 | 157.13 ± 88.83 | ||||
| 3339.12 ± 131.41 | 3322.36 ± 135.16 | 3334.96 ± 129.03 | 3390.33 ± 129.03 | 3243.17 ± 127.78 | 3400.30 ± 134.46 | ||
| iAUC (mmol/L × 240 min n = 36 | (ratio) | 1.00 (0.87–1.14) | 0.94 (0.83–1.05) | 1.01 (0.88–1.15) | |||
| (mmol/L × 240 min) | 1261.33 ± 92.58 | 1245.19 ± 92.58 | 1316.59 ± 92.61 | 1243.24 ± 92.61 | 1232.13 ± 92.50 | 1305.22 ± 92.50 | |
| Fasting insulin n = 23 | (ratio) | 1.08 (0.91–1.27) | 0.96 (0.81–1.13) | 0.89 (0.75–1.05) | |||
| (pmol/L) | 6.7 ± 1.03 | 7.22 ± 1.11 | 6.95 ± 1.07 | 6.66 ± 1.02 | 7.48 ± 1.15 | 6.65 ± 1.02 | |
| HOMA-IR n = 23 | (ratio) | 1.09 (0.90–1.32) | 1.00 (0.83–1.22) | 0.92 (0.76–1.12) | |||
| (response scale) | 2.55 ± 0.43 | 2.78 ± 0.47 | 2.49 ± 0.42 | 2.49 ± 0.42 | 2.73 ± 0.46 | 2.5 ± 0.43 | |
| Matsuda for 120 min AUC (response scale) n = 23 | −0.27 ± 0.30 | 0.39 ± 0.30 | 0.26 ± 0.30 | ||||
| 4.24 ± 0.66 | 3.97 ± 0.66 | 4.02 ± 0.66 | 4.41 ± 0.66 | 4.1 ± 0.66 | 4.35 ± 0.66 | ||
| Fasting GLP-1 n = 23 | (ratio) | 1.12 (0.86–1.47) | 1.06 (0.81–1.38) | 1.01 (0.77–1.32) | |||
| (pmol/L) | 9.84 ± 2.26 | 11.05 ± 2.54 | 9.87 ± 2.27 | 10.43 ± 2.40 | 10.19 ± 2.34 | 10.29 ± 2.36 | |
| Fasting GIP n = 23 | (ratio) | 1.59 (1.11–2.29) b | 0.98 (0.69–1.41) | 0.94 (0.65–1.34) b | |||
| (pmol/L) | 5.53 ± 1.01 c | 8.81 ± 1.61 c | 7.7 ± 1.41 | 7.57 ± 1.38 | 6.74 ± 1.23 | 6.30 ± 1.15 | |
| Fasting glucagon (pmol/L) n = 23 | −0.35 ± 0.46 | 1.06 ± 0.46 | 0.54 ± 0.46 | ||||
| 4.27 ± 0.70 | 3.92 ± 0.70 | 2.75 ± 0.70 | 3.81 ± 0.70 | 3.71 ± 0.70 | 4.25 ± 0.70 | ||
Disclaimer/Publisher’s Note: The statements, opinions and data contained in all publications are solely those of the individual author(s) and contributor(s) and not of MDPI and/or the editor(s). MDPI and/or the editor(s) disclaim responsibility for any injury to people or property resulting from any ideas, methods, instructions or products referred to in the content. |
© 2023 by the authors. Licensee MDPI, Basel, Switzerland. This article is an open access article distributed under the terms and conditions of the Creative Commons Attribution (CC BY) license (https://creativecommons.org/licenses/by/4.0/).
Share and Cite
Christiansen, C.B.; Jeppesen, P.B.; Hermansen, K.; Gregersen, S. Aronia in the Type 2 Diabetes Treatment Regimen. Nutrients 2023, 15, 4188. https://doi.org/10.3390/nu15194188
Christiansen CB, Jeppesen PB, Hermansen K, Gregersen S. Aronia in the Type 2 Diabetes Treatment Regimen. Nutrients. 2023; 15(19):4188. https://doi.org/10.3390/nu15194188
Chicago/Turabian StyleChristiansen, Christine B., Per B. Jeppesen, Kjeld Hermansen, and Søren Gregersen. 2023. "Aronia in the Type 2 Diabetes Treatment Regimen" Nutrients 15, no. 19: 4188. https://doi.org/10.3390/nu15194188
APA StyleChristiansen, C. B., Jeppesen, P. B., Hermansen, K., & Gregersen, S. (2023). Aronia in the Type 2 Diabetes Treatment Regimen. Nutrients, 15(19), 4188. https://doi.org/10.3390/nu15194188