
Most Commonly-Consumed Food Items by Food Group, and by Province, in China: Implications for Diet Quality Monitoring


Abstract
:1. Introduction
2. Materials and Methods
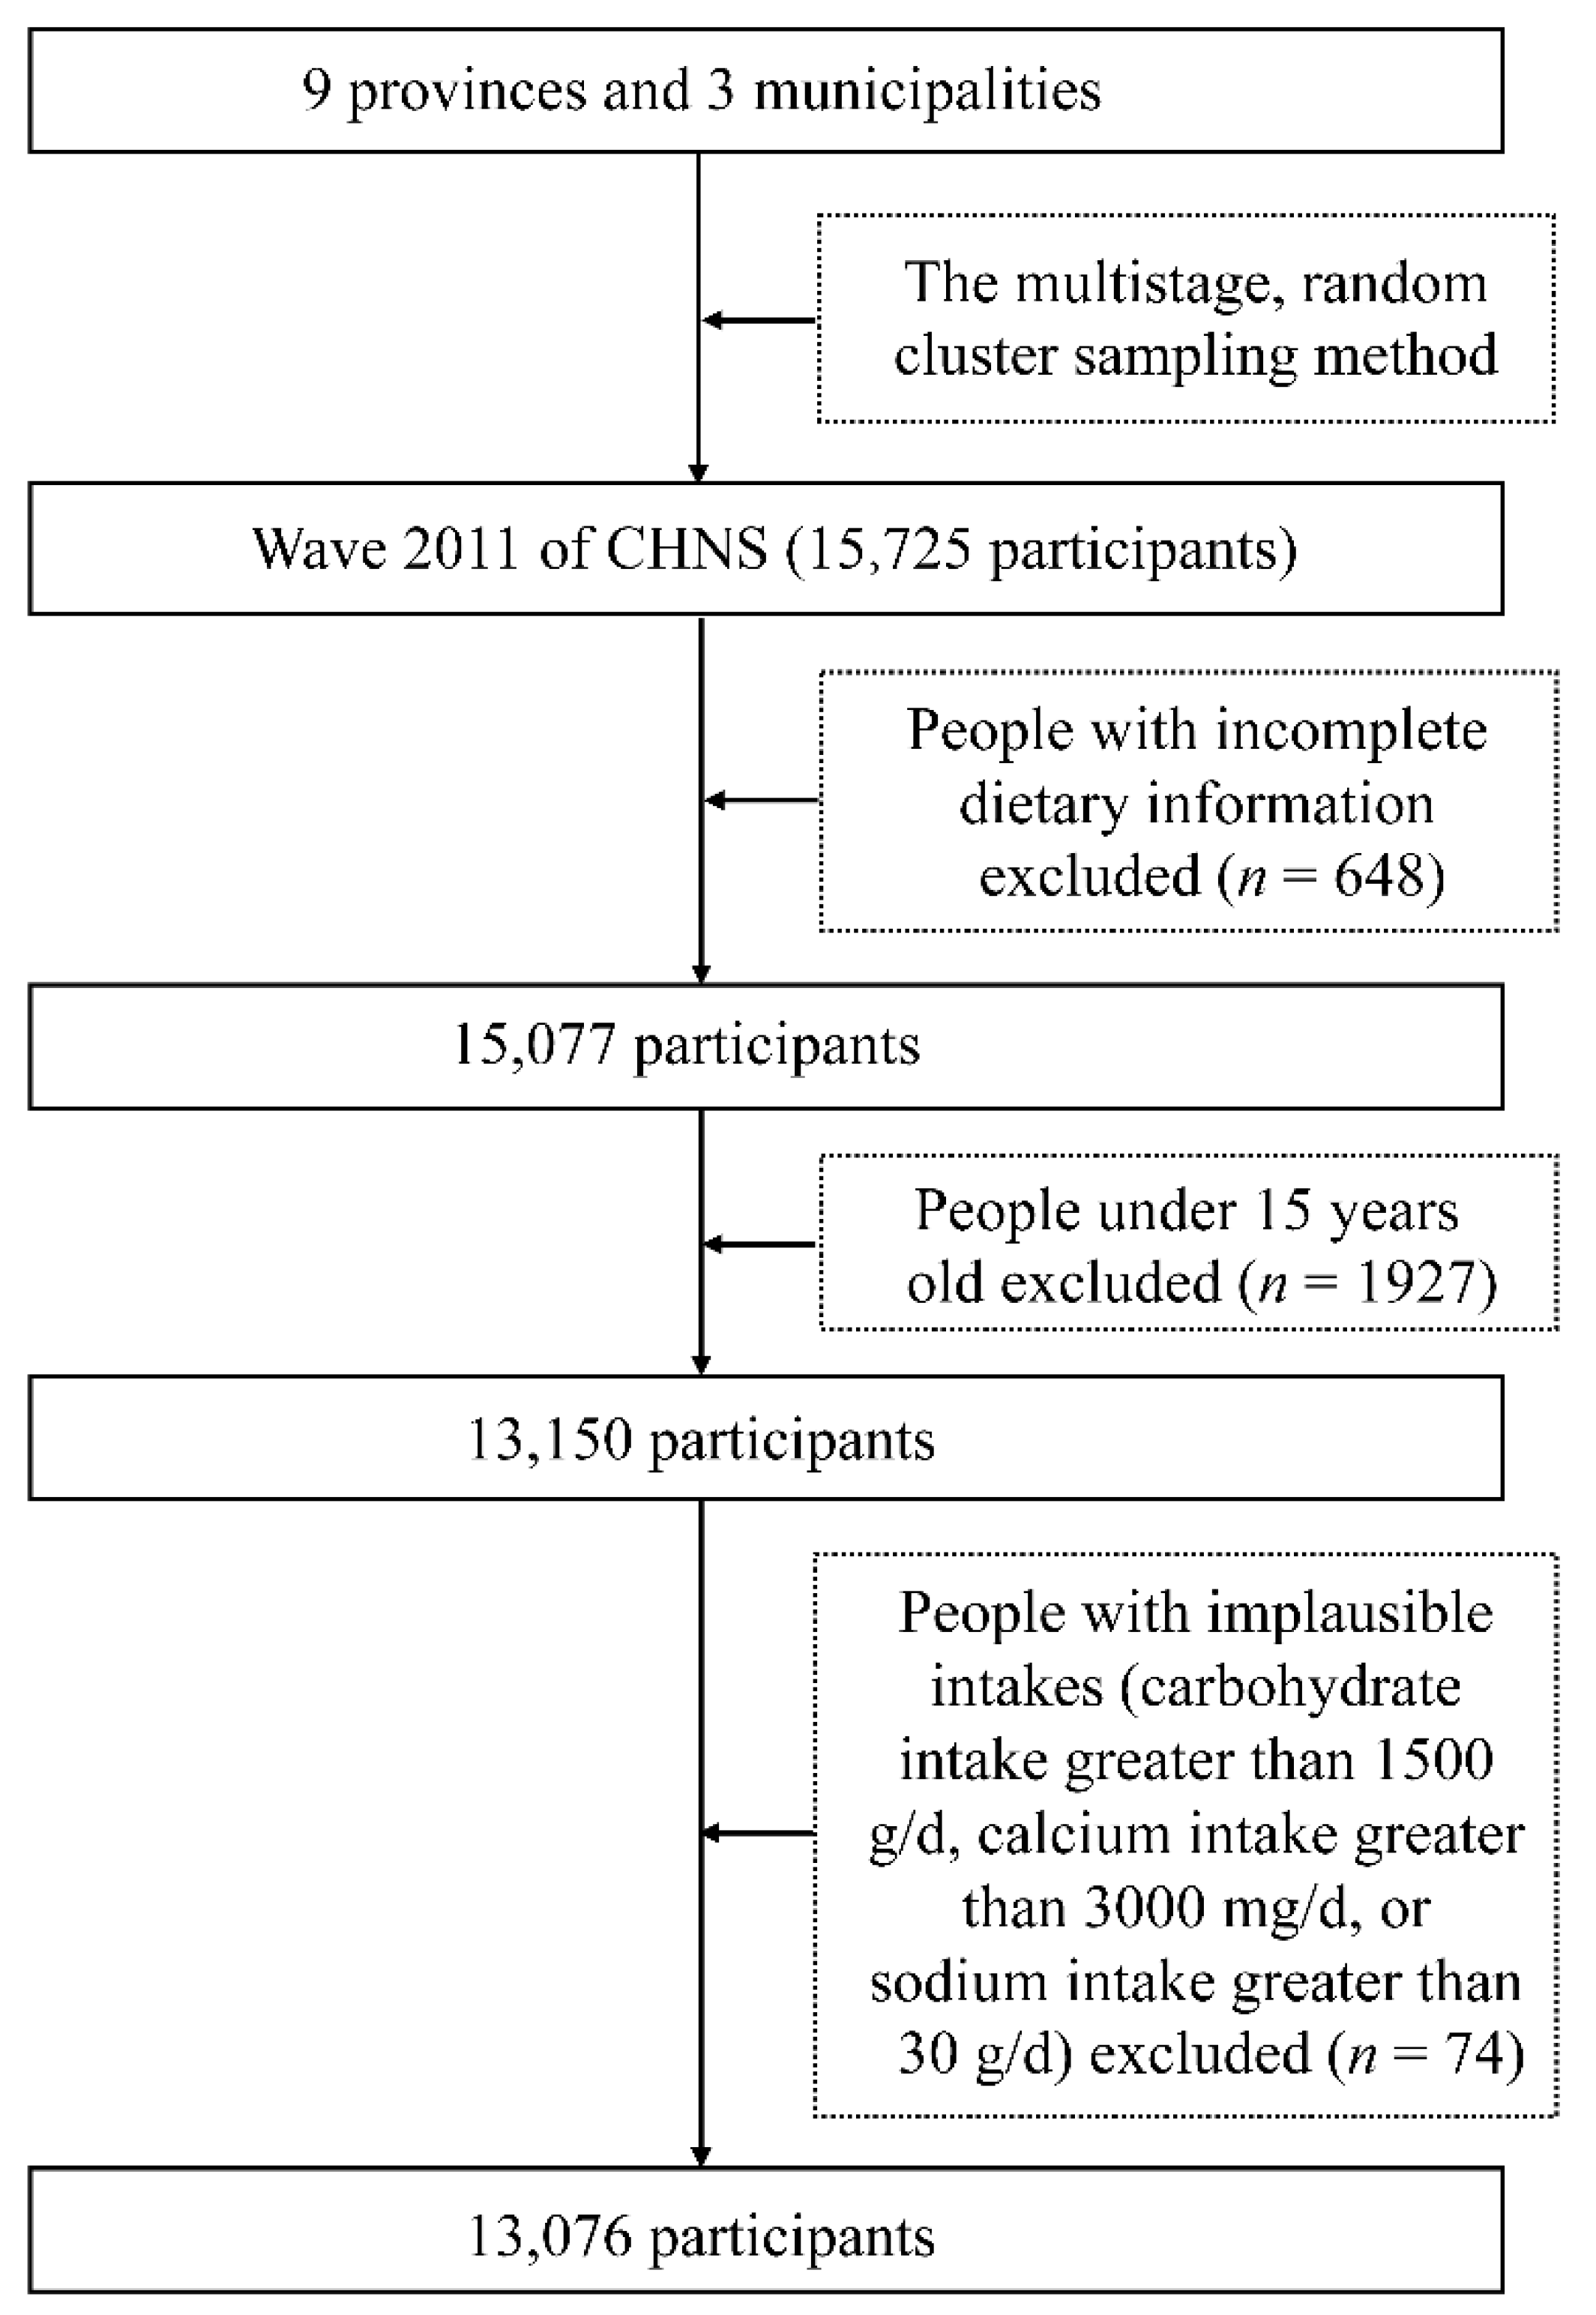
2.1. Quantitative Dietary Data Source
2.2. Qualitative Data Collection
2.3. Data Analysis
3. Results
3.1. General Information
3.2. The DQQ for China
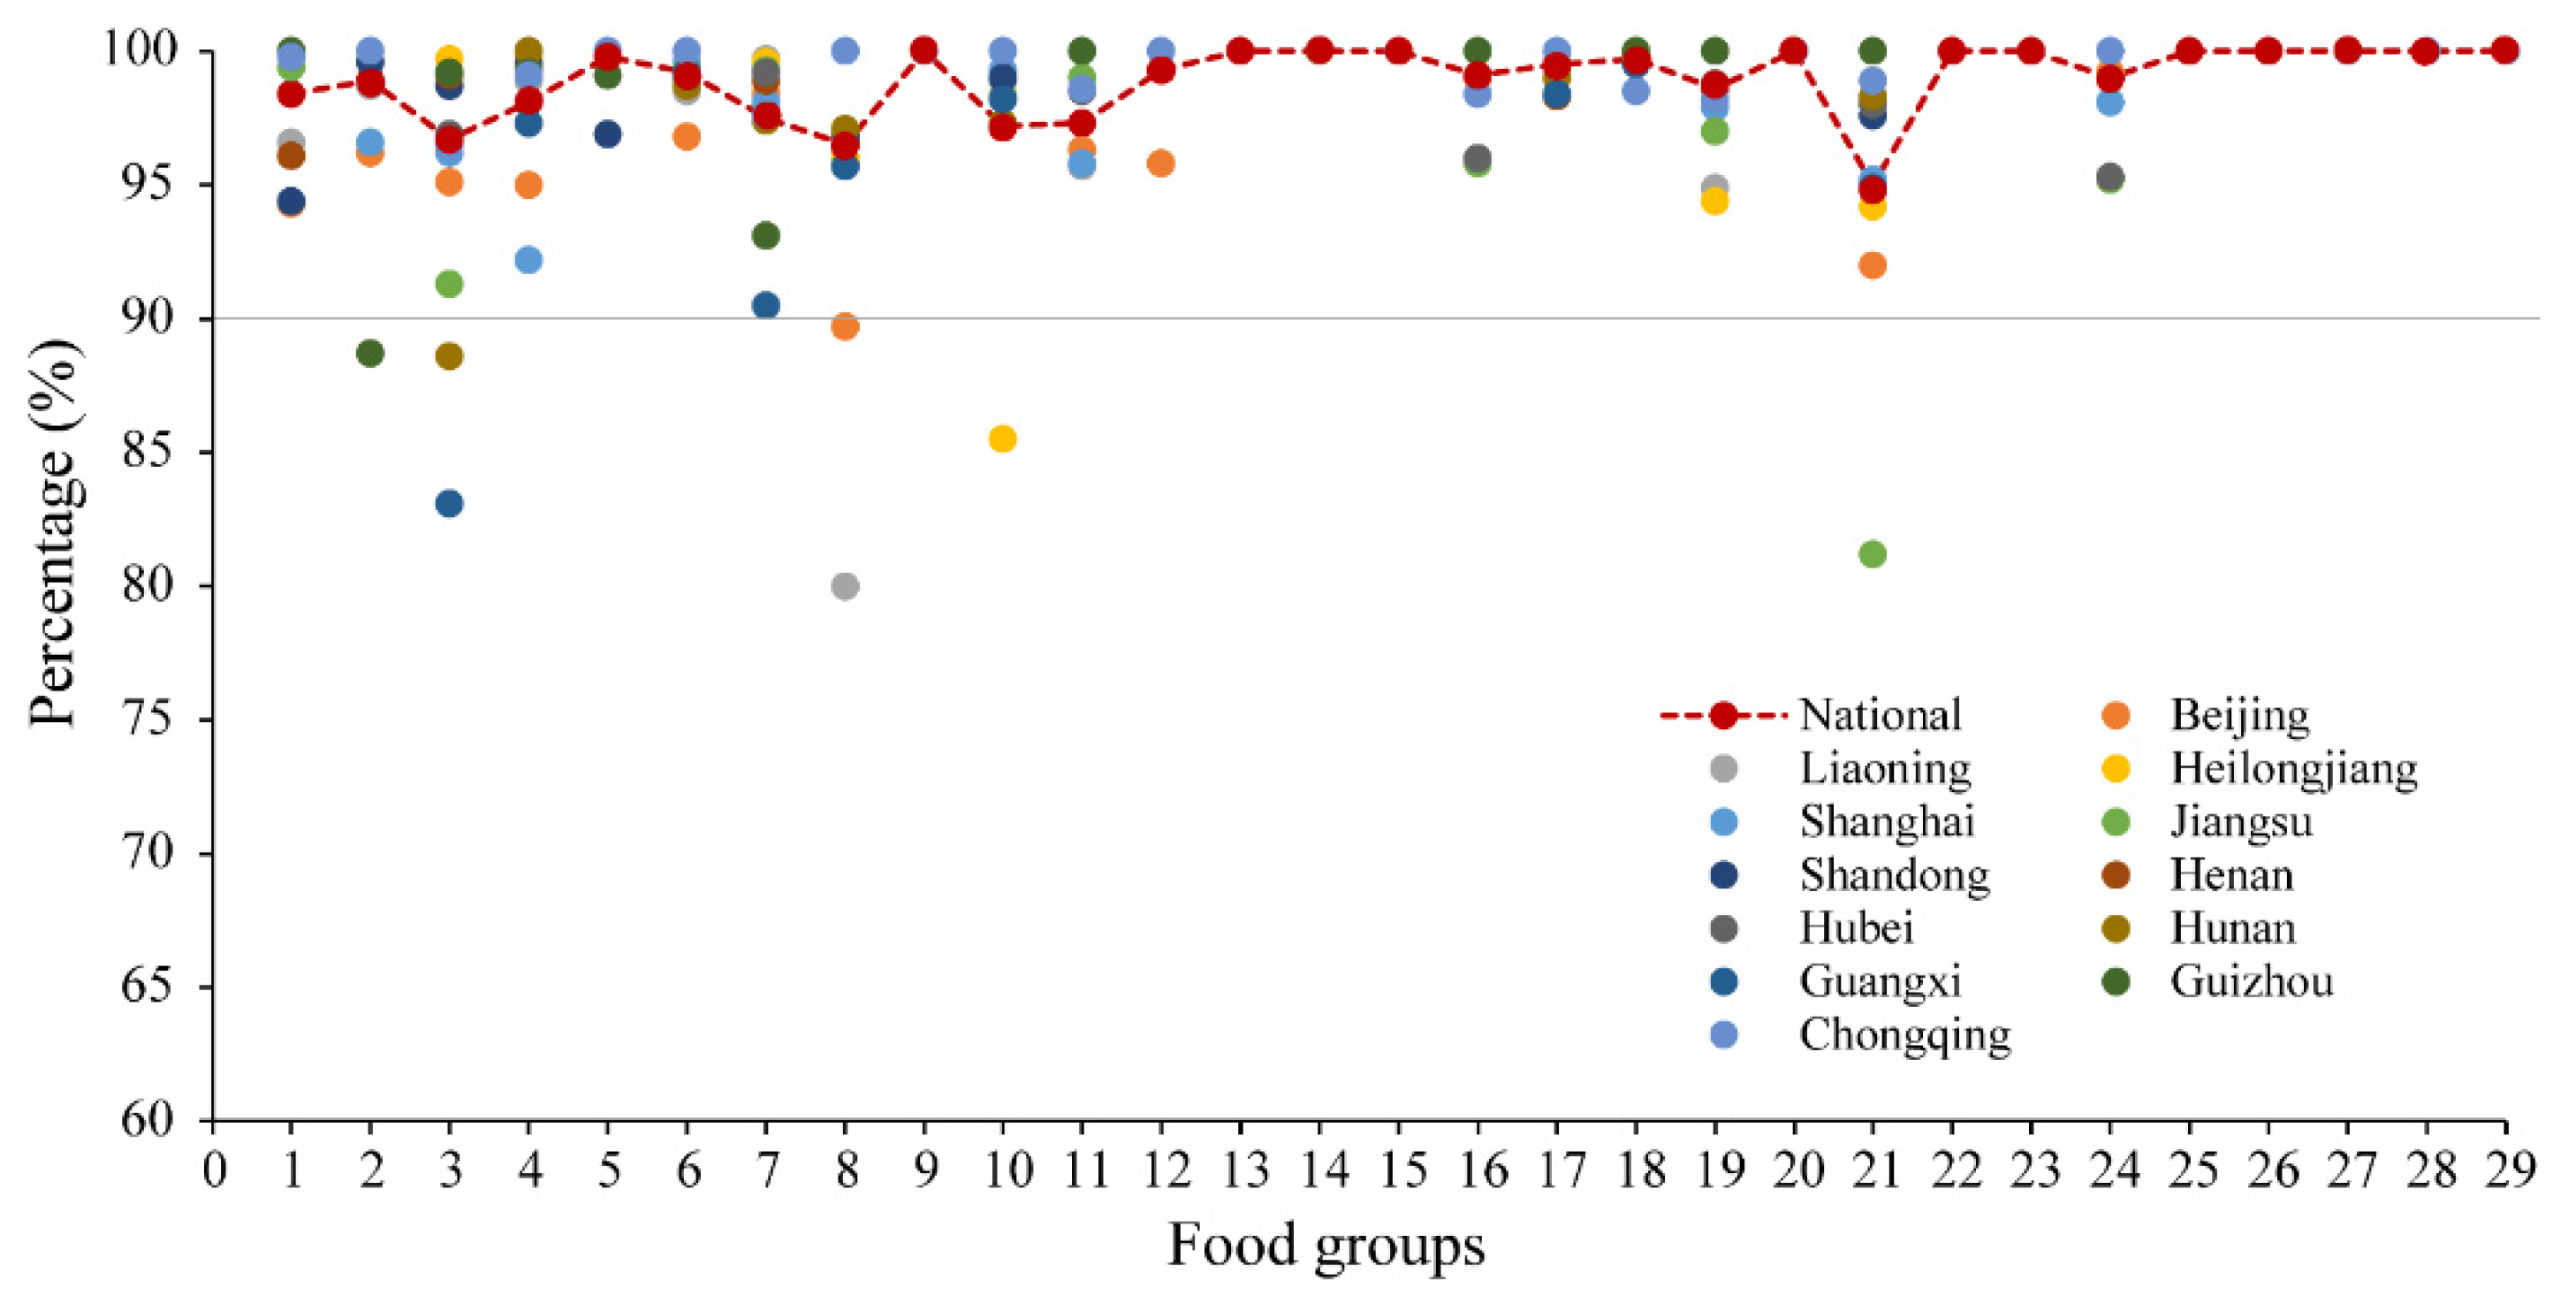
3.3. Sentinel Foods Items and Consumption Proportions for Each Food Group, Nationally and by Province
4. Discussion
5. Conclusions
Supplementary Materials
Author Contributions
Funding
Institutional Review Board Statement
Informed Consent Statement
Data Availability Statement
Acknowledgments
Conflicts of Interest
References
- GBD Risk Factor Collaborators. Health effects of dietary risks in 195 countries, 1990–2017: A systematic analysis for the Global Burden of Disease Study 2017. Lancet 2019, 393, 1958–1972. [Google Scholar] [CrossRef] [Green Version]
- Popkin, B.M.; Corvalan, C.; Grummer-Strawn, L.M. Dynamics of the double burden of malnutrition and the changing nutrition reality. Lancet 2020, 395, 65–74. [Google Scholar] [CrossRef]
- Food and Agriculture Organization of the United Nations (FAO). Minimum Dietary Diversity for Woman; FHI 360; Food and Agriculture Organization of the United Nations: Rome, Italy, 2016. [Google Scholar] [CrossRef]
- Herforth, A.W.; Wiesmann, D.; Steele, E.M.; Andrade, G.; Monteiro, C.A. Introducing a Suite of Low-Burden Diet Quality Indicators That Reflect Healthy Diet Patterns at Population Level. Curr. Dev. Nutr. 2020, 4, nzaa168. [Google Scholar] [CrossRef] [PubMed]
- Trijsburg, L.; Talsma, E.F.; De-Vries, J.H.M.; Kennedy, G.; Kuijsten, A.; Brouwer, I.D. Diet quality indices for research in low- and middle-income countries: A systematic review. Nutr. Rev. 2019, 77, 515–540. [Google Scholar] [CrossRef] [PubMed]
- Gil, A.; De-Victoria, E.M.; Olza, J. Indicators for the evaluation of diet quality. Nutr. Hosp. 2015, 31, 128–144. [Google Scholar] [CrossRef] [PubMed]
- Zhao, W.Z.; Zhang, J.; Zhao, A.; Wang, M.; Wu, W.; Tan, S.J.; Guo, M.F.; Zhang, Y.M. Using an introduced index to assess the association between food diversity and metabolic syndrome and its components in Chinese adults. BMC Cardiovasc. Disord. 2018, 18, 189. [Google Scholar] [CrossRef] [PubMed] [Green Version]
- Jones, A.D.; Hoey, L.; Blesh, J.; Miller, L.; Green, A.; Shapiro, L.F. A Systematic Review of the Measurement of Sustainable Diets. Adv. Nutr. 2016, 7, 641–664. [Google Scholar] [CrossRef] [Green Version]
- Diop, L.; Becquey, E.; Turowska, Z.; Huybregts, L.; Ruel, M.T.; Gelli, A. Standard Minimum Dietary Diversity Indicators for Women or Infants and Young Children Are Good Predictors of Adequate Micronutrient Intakes in 24–59-Month-Old Children and Their Nonpregnant Nonbreastfeeding Mothers in Rural Burkina Faso. Nutr. J. 2021, 151, 412–422. [Google Scholar] [CrossRef]
- World Health Organization. Global Nutrition Monitoring Framework: Operational Guidance for Tracking Progress in Meeting Targets for 2025; World Health Organization: Geneva, Switzerland, 2017; ISBN 9789241513609. [Google Scholar]
- Martin-Prével, Y.; Arimond, M.; Allemand, P.; Wiesmann, D.; Ballard, T.J.; Deitchler, M.; Dop, M.C.; Kennedy, G.; Lartey, A.; Lee, W.; et al. Development of a Dichotomous Indicator for Population-Level Assessment of Dietary Diversity in Women of Reproductive Age. Curr. Dev. Nutr. 2017, 1, cdn.117.001701. [Google Scholar] [CrossRef] [Green Version]
- Monteiro, C.A.; Cannon, G.; Levy, R.B.; Moubarac, J.C.; Louzada, M.L.; Rauber, F.; Khandpur, N.; Cediel, G.; Neri, D.; Martinez-Steele, E.; et al. Ultra-processed foods: What they are and how to identify them. Public Health Nutr. 2019, 22, 936–941. [Google Scholar] [CrossRef]
- Beckerman-Hsu, J.P.; Kim, R.; Sharma, S.; Subramanian, S.V. Dietary Variation among Children Meeting and Not Meeting Minimum Dietary Diversity: An Empirical Investigation of Food Group Consumption Patterns among 73,036 Children in India. Nutr. J. 2020, 150, 2818–2824. [Google Scholar] [CrossRef]
- Herforth, A.; Steele, E.M.; Galixto, G.; Sattamini, I.; Olarte, D.; Ballard, T.; Monteiro, C. Development of a Diet Quality Questionnaire for Improved Measurement of Dietary Diversity and Other Diet Quality Indicators (P13-018-19). Curr. Dev. Nutr. 2019, 3 (Suppl. S1), nzz036-P13. [Google Scholar] [CrossRef]
- Zhang, B.; Zhai, F.Y.; Du, S.F.; Popkin, B.M. The China Health and Nutrition Survey, 1989–2011. Obes. Rev. 2014, 15, 2–7. [Google Scholar] [CrossRef] [Green Version]
- Popkin, B.M.; Du, S.; Zhai, F.; Zhang, B. Cohort Profile: The China Health and Nutrition Survey—Monitoring and understanding socio-economic and health change in China, 1989–2011. Int. J. Epidemiol. 2010, 39, 1435–1440. [Google Scholar] [CrossRef] [PubMed] [Green Version]
- Arimond, M.; Wiesmann, D.; Ramirez, S.R.; Levy, T.S.; Ma, S.; Zou, Z.Y.; Herforth, A.; Beal, T. Food Group Diversity and Nutrient Adequacy: Dietary Diversity as a Proxy for Micronutrient Adequacy for Different Age and Sex Groups in Mexico and China; Discussion Paper #9; Global Alliance for Improved Nutrition (GAIN): Geneva, Switzerland, 2021. [Google Scholar] [CrossRef]
- Meng, L.P.; Wang, Y.; Li, T.; Loo-Bouwman, C.A.V.; Zhang, Y.M.; Szeto, I.M.Y. Dietary Diversity and Food Variety in Chinese Children Aged 3–17 Years: Are They Negatively Associated with Dietary Micronutrient Inadequacy? Nutr. J. 2018, 10, 1674. [Google Scholar] [CrossRef] [PubMed] [Green Version]
- China Health and Nutrition Survey. Available online: https://www.cpc.unc.edu/projects/china/about/design/datacoll (accessed on 19 February 2022).
- Wang, H.; Wang, D.; Ouyang, Y.; Huang, F.; Ding, G.; Zhang, B. Do Chinese Children Get Enough Micronutrients? Nutr. J. 2017, 9, 397. [Google Scholar] [CrossRef] [PubMed]
- English, L.K.; Ard, J.D.; Bailey, R.L.; Bates, M.; Bazzano, L.A.; Boushey, C.J.; Brown, C.; Butera, G.; Callahan, E.H.; De-Jesus, J.; et al. Evaluation of Dietary Patterns and All-Cause Mortality: A Systematic Review. JAMA Netw. Open 2021, 4, e22277. [Google Scholar] [CrossRef] [PubMed]
- Nguyen, P.H.; Huybregts, L.; Sanghvi, T.G.; Tran, L.M.; Frongillo, E.A.; Menon, P.; Ruel, M.T. Dietary Diversity Predicts the Adequacy of Micronutrient Intake in Pregnant Adolescent Girls and Women in Bangladesh, but Use of the 5-Group Cutoff Poorly Identifies Individuals with Inadequate Intake. Nutr. J. 2018, 148, 790–797. [Google Scholar] [CrossRef] [PubMed] [Green Version]

| Characteristics | National | Beijing | Liaoning | Heilongjiang | Shanghai | Jiangsu | Shandong | Henan | Hubei | Hunan | Guangxi | Guizhou | Chongqing |
|---|---|---|---|---|---|---|---|---|---|---|---|---|---|
| No. of participants | 13,076 | 1098 | 978 | 960 | 1284 | 1143 | 1035 | 1099 | 983 | 1098 | 1344 | 1033 | 1021 |
| Gender, % | |||||||||||||
| Male | 47.1 | 47.5 | 47.0 | 47.7 | 46.9 | 46.8 | 47.0 | 46.8 | 46.2 | 47.0 | 48.0 | 47.4 | 46.2 |
| Female | 52.9 | 52.5 | 53.0 | 52.3 | 53.1 | 53.2 | 53.0 | 53.2 | 53.8 | 53.0 | 52.0 | 52.6 | 53.8 |
| Location, % | |||||||||||||
| Urban | 42.2 | 79.6 | 28.0 | 32.0 | 80.5 | 33.4 | 32.4 | 35.0 | 32.8 | 36.1 | 29.6 | 30.8 | 47.7 |
| Rural | 57.8 | 20.4 | 72.0 | 68.0 | 19.5 | 66.6 | 67.6 | 65.0 | 67.2 | 63.9 | 70.4 | 69.2 | 52.3 |
| Age, yrs | 49.7 ± 16.0 | 44.8 ± 14.9 | 52.4 ± 14.7 | 48.5 ± 14.0 | 48.7 ± 15.9 | 51.8 ± 16.7 | 52.1 ± 15.5 | 49.0 ± 16.4 | 51.3 ± 15.0 | 50.5 ± 15.9 | 48.1 ± 17.6 | 51.4 ± 17.1 | 49.4 ± 14.9 |
| BMI, kg/m2 | 22.8 ± 6.3 | 24.7 ± 4.6 | 24.4 ± 5.6 | 24.1 ± 5.4 | 24.0 ± 3.9 | 23.0 ± 5.3 | 24.9 ± 4.6 | 20.7 ± 9.2 | 22.4 ± 6.3 | 23.1 ± 4.8 | 18.3 ± 8.9 | 22.0 ± 5.0 | 23.3 ± 4.6 |
| Energy, kcal | 1929.1 ± 790.2 | 1661.2 ± 713.2 | 1926.6 ± 712.7 | 2071.7 ± 760.8 | 1771.7 ± 652.6 | 2160.3 ± 828.5 | 1941.4 ± 821.9 | 1833.9 ± 799.3 | 2265.4 ± 1181.5 | 2159.8 ± 682.4 | 1814.1 ± 644.9 | 1961.0 ± 742.1 | 1661.6 ± 773.9 |
| Carbohydrate, g | 273.6 ± 130.8 | 231.4 ± 102.6 | 271.3 ± 112.2 | 302.4 ± 133.1 | 212.1 ± 94.8 | 290.5 ± 132.8 | 301.3 ± 141.9 | 309.0 ± 123.6 | 356.9 ± 196.5 | 266.8 ± 101.4 | 301.9 ± 121.9 | 259.2 ± 99.4 | 191.0 ± 94.5 |
| Protein, g | 69.2 ± 34.9 | 66.7 ± 35.2 | 65.6 ± 34.0 | 66.5 ± 31.5 | 78.5 ± 35.9 | 84.0 ± 41.9 | 70.6 ± 31.6 | 59.5 ± 26.8 | 79.6 ± 44.4 | 72.8 ± 33.3 | 68.9 ± 27.1 | 59.7 ± 28.5 | 54.9 ± 33.2 |
| Fat, g | 66.1 ± 45.9 | 56.6 ± 38.7 | 67.6 ± 40.1 | 71.7 ± 37.3 | 72.0 ± 37.8 | 77.7 ± 45.6 | 53.7 ± 36.6 | 45.8 ± 43.8 | 61.4 ± 46.1 | 92.2 ± 47.1 | 41.7 ± 28.4 | 79.8 ± 54.0 | 79.2 ± 60.5 |
| DIET QUALITY QUESTIONNAIRE: CHINA | ||||||||||
| Read: Now I’d like to ask you some yes-or-no questions about foods and drinks that you consumed yesterday during the day or night, whether you had it at home or somewhere else. First, I would like you to think about yesterday, from the time you woke up through the night. Think to yourself about the first thing you ate or drank after you woke up in the morning. Think about where you were when you had any food or drink in the middle of the day. Think about where you were when you had any evening meal, and any food or drink you may have had in the evening or late-night, and any other snacks or drinks you may have had between meals throughout the day or night. I am interested in whether you had the food items I will mention even if they were combined with other foods. Please listen to the list of foods and drinks, and if you ate or drank ANY ONE OF THEM, say yes. | ||||||||||
| (Do not read food group names) | Yesterday, did you eat any of the following foods? | (circle answer) | ||||||||
| 01 Staple foods made from grains | Global definition | rice | noodles | steamed bun | bread | YES or NO | ||||
| Suggested translation | 米饭 | 面条 | 馒头 | 面包 | ||||||
| 02 Whole grains | Global definition | corn | cornmeal | oats | millet | barley | brown rice | black rice | whole wheat bread | |
| Suggested translation | 玉米(鲜) | 玉米面 | 燕麦片 | 小米 | 大麦/糌粑 | 糙米 | 黑米 | 全麦面包 | ||
| 03 White roots/tubers | Global definition | potatoe | lotus root | starch noodles | yam | taro | turnip | YES or NO | ||
| Suggested translation | 马铃薯 | 藕(莲藕) | 粉丝/粉条 | 山药 | 芋头 | 大头菜 | ||||
| 04 Legumes | Global definition | bean curd or tofu | bean curd sheet | soybean milk | soybeans | other dried beans | YES or NO | |||
| Suggested translation | 豆腐 | 豆腐皮 | 豆浆 | 黄豆 | 其他干豆类 | |||||
| Yesterday, did you eat any of the following vegetables? | ||||||||||
| 05 Vitamin A-rich orange vegetables | Global definition | carrots | pumpkin or butternut squash | sweet potatoes that are orange inside | YES or NO | |||||
| Suggested translation | 胡萝卜 | 南瓜 | 红薯 | |||||||
| 06.1 Dark green leafy vegetables | Global definition | Chinese cabbage | water spinach | Chinese spinach | rape | bok choy | sweet potato leaves | broccoli | YES or NO | |
| Suggested translation | 大白菜 | 空心菜 | 菠菜 | 油菜 | 小白菜 | 番薯叶 | 西兰花 | |||
| 06.2 Dark green leafy vegetables | Global definition | mustard leaves | chrysanthemum leaves | radish leaves | amaranth leaves | beet leaves | watercress | YES or NO | ||
| Suggested translation | 芥菜 | 茼蒿 | 萝卜叶 | 苋菜 | 甜菜叶 | 西洋菜 | ||||
| 07.1 Other vegetables | Global definition | cabbage | tomatoes | eggplant | loofah | green bean | local celery | cucumber | YES or NO | |
| Suggested translation | 包菜/圆白菜 | 番茄 | 茄子 | 丝瓜 | 四季豆 | 芹菜 | 黄瓜 | |||
| 07.2 Other vegetables | Global definition | mushrooms | lettuce | radish | cauliflower | seaweed | bamboo shoots | bell pepper | bean sprouts | YES or NO |
| Suggested translation | 蘑菇 | 生菜 | 萝卜 | 菜花 | 紫菜 | 笋 | 甜椒/柿子椒 | 豆芽 | ||
| Yesterday, did you eat any of the following fruits? | ||||||||||
| 08 Vitamin A-rich fruits | Global definition | persimmon | cantaloupe | ripe mango | passion fruit | fresh or dried apricot | papaya | YES or NO | ||
| Suggested translation | 柿子 | 哈蜜瓜 | 芒果 | 百香果 | 杏或杏干 | 木瓜 | ||||
| 09 Citrus | Global definition | orange | tangerines | pomelo | grapefruit | kumquat | YES or NO | |||
| Suggested translation | 橙 | 橘子/柑橘 | 柚子 | 西柚 | 金桔 | |||||
| 10.1 Other fruits | Global definition | apple | pear | watermelon | banana | grapes | kiwi | dragonfruit | YES or NO | |
| Suggested translation | 苹果 | 梨 | 西瓜 | 香蕉 | 葡萄 | 猕猴桃 | 火龙果 | |||
| 10.2 Other fruits | Global definition | jujube | longan | wampee | lychee | pomegranate | cherry | peaches | YES or NO | |
| Suggested translation | 枣子 | 龙眼 | 黄皮果 | 荔枝 | 石榴 | 樱桃 | 桃 | |||
| Yesterday, did you eat any of the following sweets? | ||||||||||
| 11 Baked sweets | Global definition | cakes | cookies | sweet pastries | mooncake | rice dumplings | egg tarts | YES or NO | ||
| Suggested translation | 蛋糕 | 甜饼干 | 甜糕点 | 月饼 | 甜粽子/汤圆 | 蛋挞 | ||||
| 12 Other sweets | Global definition | candy | chocolates | jelly pudding | ice cream | popsicles | YES or NO | |||
| Suggested translation | 糖果 | 巧克力 | 果冻 | 冰淇淋 | 棒冰 | |||||
| Yesterday, did you eat any of the following foods of animal origin? | ||||||||||
| 13 Eggs | Global definition | chicken eggs | preserved duck eggs | quail eggs | pigeon eggs | goose eggs | YES or NO | |||
| Suggested translation | 鸡蛋 | 咸鸭蛋 (白), 松花蛋 (黑) | 鹌鹑蛋 | 鸽子蛋 | 鹅蛋 | |||||
| 14 Cheese | Global definition | cheese | YES or NO | |||||||
| Suggested translation | 奶酪 | |||||||||
| 15 Yogurt | Global definition | yogurt | YES or NO | |||||||
| Suggested translation | 酸奶 | |||||||||
| 16 Processed meat | Global definition | sausages | bacon | ham | larou | luncheon meat | beef jerky | processed beef product | pork jerk | YES or NO |
| Suggested translation | 腊肠 | 培根 | 火腿 | 腊肉 | 午餐肉 | 牛肉干 | 酱牛肉 | 猪肉脯 | ||
| 17 Unprocessed red meat (ruminant) | Global definition | beef | lamb sheep or goat | donkey | horse | organs from these animals | YES or NO | |||
| Suggested translation | 牛肉 | 羊肉 | 驴肉 | 马肉 | 内脏 (牛羊驴马) | |||||
| 18 Unprocessed red meat (non-ruminant) | Global definition | pork | pork organs | YES or NO | ||||||
| Suggested translation | 猪肉 | 猪内脏 | ||||||||
| 19 Poultry | Global definition | chicken | duck | goose | pigeon | chicken gizzard | YES or NO | |||
| Suggested translation | 鸡 | 鸭 | 鹅 | 鸽子 | 鸡胗 | |||||
| 20 Fish & seafood | Global definition | fish | seafood | YES or NO | ||||||
| Suggested translation | 鱼 | 海鲜 | ||||||||
| Yesterday, did you eat any of the following other foods? | ||||||||||
| 21 Nuts & seeds | Global definition | sunflower seeds | pumpkin seeds | watermelon seeds | peanut | chestnut | walnuts | almonds | sesame paste | YES or NO |
| Suggested translation | 葵花子 | 南瓜子 | 西瓜子 | 花生 | 栗子 | 核桃 | 杏仁 | 芝麻酱 | ||
| 22 Ultra-processed packaged salty snacks | Global definition | chips such as Lays, Pringles | Doritos | shrimp chips | macaroni crisp | spicy strip | YES or NO | |||
| Suggested translation | 薯片(乐事, 品客) | 立体脆 | 虾条 | 通心脆 | 辣条 | |||||
| 23 Instant noodles | Global definition | instant noodles | instant rice noodles | YES or NO | ||||||
| Suggested translation | 方便面 | 速食米粉 | ||||||||
| 24 Deep fried foods | Global definition | French fries | fried bread stick | fried pancake | fried dough twist | fried glutinous rice ball | fried bean curd | chicken nuggets | deep fried meet | YES or NO |
| Suggested translation | 薯条 | 油条 | 油饼 | 麻花 | 炸糕 | 炸豆腐 | 鸡块 | 炸肉 | ||
| Yesterday, did you have any of the following beverages? | ||||||||||
| 25 Fluid milk | Global definition | milk | milk powder | YES or NO | ||||||
| Suggested translation | 牛奶 | 奶粉 | ||||||||
| 26 Sweetened tea/coffee/milk drinks | Global definition | flavored milks | milk tea/bubble tea | nutri-Express | yakult | bottled tea beverage | coffee with sugar | YES or NO | ||
| Suggested translation | 果味奶 | 奶茶/珍珠奶茶 | 营养快线 | 酸乳饮料 | 瓶装茶饮料 | 咖啡加糖 | ||||
| 27 Fruit juice | Global definition | fruit juice | fruit juice beverage | YES or NO | ||||||
| Suggested translation | 果汁 | 果汁饮料 | ||||||||
| 28 SSBs (sodas) | Global definition | soft drinks such as Coca cola, Pepsi, Fanta, Sprite | sports drink | energy drink | YES or NO | |||||
| Suggested translation | 软饮料, 如可口可乐, 百事可乐, 芬达, 雪碧 | 运动饮料 | 能量饮料 | |||||||
| Yesterday, did you get food from any place like? | ||||||||||
| 29 Fast food | Global definition | KFC | McDonald’s | Pizza Hut | Burger King | Subway | Dicos | YES or NO | ||
| Suggested translation | 肯德基 | 麦当劳 | 必胜客 | 汉堡王 | 赛百味 | 德克士 | ||||
| Sentinel Foods | National | Beijing | Liaoning | Heilongjiang | Shanghai | Jiangsu | Shandong | Henan | Hubei | Hunan | Guangxi | Guizhou | Chongqing |
| Staple foods made from grains (group 1) | |||||||||||||
| rice | X | X | X | X | X | X | X | X | X | X | X | X | |
| noodles | X | X | X | X | X | X· | |||||||
| steamed buns | X | X | X | X | X | ||||||||
| bread | X | X | X | X | X | ||||||||
| pancake ** in Beijing and Shandong | X | X | |||||||||||
| Whole grain (group 2) | |||||||||||||
| millet | X | X | X | X | X | X | X | X | X | X | X | X | |
| cornmeal | X | X | X | X | X | X | X | X | X | X | X | ||
| corn | X | X | X | X | X | X | X | X | X | X | X | X | |
| whole wheat bread | X | X | X | X | X | X | X | X | X | ||||
| oats | X | X | X | X | X | X | |||||||
| barley | X | X | X | X | |||||||||
| black rice | X | X | |||||||||||
| buckwheat * in Guizhou | X | ||||||||||||
| White root/tubers (group 3) | |||||||||||||
| potato | X | X | X | X | X | X | X | X | X | X | X | X | X |
| lotus root | X | X | X | X | X | X | X | ||||||
| starch noodles | X | X | X | X | X | X | X | ||||||
| turnip | X | X | X | X | X | X | X | ||||||
| yam | X | X | X | X | X | X | |||||||
| taro | X | X | X | X | X | X | X | ||||||
| plantain ** in Jiangsu | X | ||||||||||||
| plantain * in Guangxi | X | ||||||||||||
| jicama * in Hunan | X | ||||||||||||
| Legumes (group 4) | |||||||||||||
| bean curd or tofu | X | X | X | X | X | X | X | X | X | X | X | X | X |
| bean curd sheet | X | X | X | X | X | X | |||||||
| soybean milk | X | X | X | X | X | X | X | X | X | X | |||
| soybeans | X | X | X | X | X | X | X | X | X | X | X | ||
| other dried beans | X | X | X | X | X | X | X | X | X | X | X | X | |
| soy meat ** in Shanghai | X | ||||||||||||
| Vitamin A-rich orange vegetables (group 5) | |||||||||||||
| carrots | X | X | X | X | X | X | X | X | X | X | X | X | X |
| pumpkin or butternut squash | X | X | X | X | X | X | X | X | X | X | X | X | |
| sweet potatoes that are orange inside | X | X | X | X | X | X | X | X | X | ||||
| Dark green leafy vegetables (group 6) | |||||||||||||
| Chinese cabbage | X | X | X | X | X | X | X | X | X | X | X | X | X |
| water spinach | X | X | X | X | X | ||||||||
| Chinses spinach | X | X | X | X | X | X | X | X | X | X | |||
| rape | X | X | X | X | X | X | X | X | |||||
| bok choy | X | X | X | X | X | X | X | X | X | X | X | ||
| sweet potato leaves | X | X | X | ||||||||||
| broccoli | X | X | X | X | |||||||||
| mustard leaves | X | X | X | ||||||||||
| chrysanthemum leaves | X | X | |||||||||||
| radish leaves | X | X | X | ||||||||||
| amaranth leaves | X | X | X | ||||||||||
| Other vegetables (group 7) | |||||||||||||
| cabbage | X | X | X | X | X | X | X | X | X | X | X | X | X |
| tomatoes | X | X | X | X | X | X | X | X | X | X | X | X | X |
| eggplant | X | X | X | X | X | X | X | X | X | X | X | X | |
| loofah | X | X | X | X | X | X | X | X | X | X | |||
| cucumber | X | X | X | X | X | X | X | X | X | X | |||
| local celery | X | X | X | X | X | X | X | X | X | X | |||
| mushrooms | X | X | X | X | X | X | X | X | X | X | |||
| lettuce | X | X | X | X | X | X | |||||||
| radish | X | X | X | X | X | X | X | X | X | ||||
| bean sprouts | X | X | X | X | X | X | X | X | |||||
| cauliflower | X | X | X | X | X | ||||||||
| bamboo shoot | X | X | X | X | |||||||||
| bell pepper | X | X | X | ||||||||||
| seaweed | X | X | |||||||||||
| green beans | X | X | X | X | X | X | X | X | X | X | |||
| bitter melon ** in Guangxi and Guizhou | X | X | |||||||||||
| zucchini ** in Guangxi | X | ||||||||||||
| chayote ** in Guizhou | X | ||||||||||||
| Vitamin A-rich fruits (group 8) | |||||||||||||
| persimmon | X | X | X | X | X | X | X | X | X | X | X | X | |
| cantaloupe | X | X | X | X | X | X | X | ||||||
| ripe mango | X | X | X | ||||||||||
| papaya | X | X | X | ||||||||||
| hawthorn berry * in Beijing and Liaoning | X | X | |||||||||||
| Citrus (group 9) | |||||||||||||
| orange | X | X | X | X | X | X | X | X | X | X | X | X | X |
| tangerines | X | X | X | X | X | X | |||||||
| pomelo | X | X | X | X | X | X | X | X | |||||
| grapefruit | X | X | |||||||||||
| kumquat | X | X | |||||||||||
| Other fruits (group 10) | |||||||||||||
| apple | X | X | X | X | X | X | X | X | X | X | X | X | X |
| pear | X | X | X | X | X | X | X | X | X | X | X | X | |
| watermelon | X | X | X | X | X | ||||||||
| banana | X | X | X | X | X | X | X | X | X | X | X | ||
| grapes | X | X | X | X | X | X | X | X | X | X | X | ||
| kiwi | X | X | X | ||||||||||
| dragonfruit | X | X | X | ||||||||||
| jujube | X | X | X | X | X | X | X | X | |||||
| longan | X | X | X | ||||||||||
| wampee | X | X | |||||||||||
| pomegranate | X | X | |||||||||||
| lychee | X | X | |||||||||||
| cherry | X | X | |||||||||||
| peaches | X | X | X | X | X | X | X | X | |||||
| honeydew melon * in Heilongjiang | X | ||||||||||||
| Grain-based sweets (group 11) | |||||||||||||
| cakes | X | X | X | X | X | X | X | X | X | X | X | X | |
| cookies | X | X | X | X | X | X | X | X | X | X | X | X | |
| sweet pastries | X | X | X | X | X | X | X | X | X | X | |||
| mooncake | X | X | X | X | X | X | X | X | |||||
| rice dumplings | X | X | X | ||||||||||
| egg tart | X | X | |||||||||||
| Other sweets (group 12) | |||||||||||||
| candy | X | X | X | X | X | X | X | ||||||
| chocolates | X | X | X | X | X | X | |||||||
| popsicles | X | X | X | X | X | X | X | X | |||||
| ice cream | X | X | X | X | X | ||||||||
| Jelly pudding | X | X | X | X | X | X | X | ||||||
| Eggs (group 13) | |||||||||||||
| eggs | X | X | X | X | X | X | X | X | X | X | X | X | X |
| Cheese (group 14) | |||||||||||||
| cheese | X | X | X | X | |||||||||
| Yogurt (group 15) | |||||||||||||
| yogurt | X | X | X | X | X | X | X | X | X | X | X | X | X |
| Processed meats (group 16) | |||||||||||||
| ham | X | X | X | X | X | X | X | X | X | X | X | ||
| bacon or larou | X | X | X | X | X | X | X | X | |||||
| sausages | X | X | X | X | X | X | X | X | X | X | X | ||
| beef jerky | X | X | |||||||||||
| processed beef product | X | X | X | X | X | ||||||||
| pork jerky | X | X | X | X | X | X | X | X | X | ||||
| Unprocessed red meat (ruminant) (group 17) | |||||||||||||
| beef | X | X | X | X | X | X | X | X | X | X | X | X | X |
| lamb sheep or goat | X | X | X | X | X | X | X | X | X | ||||
| donkey | X | X | X | ||||||||||
| organs from these animals | X | X | X | X | X | X | |||||||
| Unprocessed red meat (non-ruminant) (group 18) | |||||||||||||
| pork | X | X | X | X | X | X | X | X | X | X | X | X | X |
| pork organs | X | X | X | ||||||||||
| Poultry (group 19) | |||||||||||||
| chicken | X | X | X | X | X | X | X | X | X | X | X | X | X |
| duck | X | X | X | X | X | X | X | X | X | X | |||
| goose | X | X | X | ||||||||||
| pigeon | X | X | X | ||||||||||
| chicken gizzard | X | X | |||||||||||
| chicken heart ** in Liaoning | X | ||||||||||||
| chicken liver ** in Heilongjiang | X | ||||||||||||
| Fish and seafood (group 20) | |||||||||||||
| fish | X | X | X | X | X | X | X | X | X | X | X | X | X |
| seafood | X | X | X | X | X | X | X | X | X | X | X | ||
| Nuts and seeds (group 21) | |||||||||||||
| peanuts | X | X | X | X | X | X | X | X | X | X | X | X | X |
| sunflower seeds | X | X | X | X | X | X | X | X | X | X | |||
| chestnuts | X | X | X | X | X | X | X | X | X | X | |||
| walnuts | X | X | X | X | X | X | X | X | X | ||||
| sesame paste | X | X | X | X | X | X | |||||||
| almonds | X | X | X | X | X | ||||||||
| watermelon seeds | X | X | X | X | |||||||||
| pumpkin seeds | X | X | X | ||||||||||
| seeds of Euryale ferox ** in Beijing | X | ||||||||||||
| seeds of Euryale ferox * in Jiangsu | X | ||||||||||||
| hazelnut ** in Liaoning | X | ||||||||||||
| pine nut ** in Heilongjiang | X | ||||||||||||
| pine nut * in Jiangsu | X | ||||||||||||
| lotus seeds ** in Guangxi | X | ||||||||||||
| Packaged ultra-processed salty snacks (group 22) | |||||||||||||
| chips | X | X | X | X | X | X | X | ||||||
| shrimp chips | X | X | |||||||||||
| Instant noodles (group 23) | |||||||||||||
| instant noodles | X | X | X | X | X | X | X | X | X | X | X | X | X |
| Deep fried foods (group 24) | |||||||||||||
| fried bread stick | X | X | X | X | X | X | X | X | X | X | X | X | X |
| fried pancake | X | X | X | X | X | X | X | X | X | X | X | X | |
| fried bean curd | X | X | X | X | X | X | |||||||
| fried glutinous rice ball | X | X | X | ||||||||||
| chicken nugget | X | X | X | ||||||||||
| Fluid milk (group 25) | |||||||||||||
| milk | X | X | X | X | X | X | X | X | X | X | X | X | X |
| milk powder | X | X | X | X | X | X | |||||||
| Sweet tea/coffee/milk drinks (group 26) | |||||||||||||
| flavored milk | X | X | X | X | X | X | X | X | X | X | X | ||
| Yakult | X | X | X | X | X | X | X | X | X | X | |||
| Nutri-Express | X | X | X | ||||||||||
| bottled tea beverage | X | X | |||||||||||
| Fruit juice (group 27) | |||||||||||||
| fruit juice | X | X | X | X | X | X | X | X | X | X | X | X | X |
| fruit juice beverage | X | X | X | X | |||||||||
| SSBs (sodas) (group 28) | |||||||||||||
| soft drink | X | X | X | X | X | X | X | X | X | X | X | X | |
| sports drink | X | X | X | X | |||||||||
| energy drink | X | X | |||||||||||
| Fast food (group 29) | |||||||||||||
| KFC | X | X | X | X | X | X | |||||||
| burger | X | X | X | X | X | X | |||||||
| sandwich/sub | X | X | X | ||||||||||
| pizza | X | X | X | ||||||||||
Publisher’s Note: MDPI stays neutral with regard to jurisdictional claims in published maps and institutional affiliations. |
© 2022 by the authors. Licensee MDPI, Basel, Switzerland. This article is an open access article distributed under the terms and conditions of the Creative Commons Attribution (CC BY) license (https://creativecommons.org/licenses/by/4.0/).
Share and Cite
Ma, S.; Herforth, A.W.; Vogliano, C.; Zou, Z. Most Commonly-Consumed Food Items by Food Group, and by Province, in China: Implications for Diet Quality Monitoring. Nutrients 2022, 14, 1754. https://doi.org/10.3390/nu14091754
Ma S, Herforth AW, Vogliano C, Zou Z. Most Commonly-Consumed Food Items by Food Group, and by Province, in China: Implications for Diet Quality Monitoring. Nutrients. 2022; 14(9):1754. https://doi.org/10.3390/nu14091754
Chicago/Turabian StyleMa, Sheng, Anna W. Herforth, Chris Vogliano, and Zhiyong Zou. 2022. "Most Commonly-Consumed Food Items by Food Group, and by Province, in China: Implications for Diet Quality Monitoring" Nutrients 14, no. 9: 1754. https://doi.org/10.3390/nu14091754
APA StyleMa, S., Herforth, A. W., Vogliano, C., & Zou, Z. (2022). Most Commonly-Consumed Food Items by Food Group, and by Province, in China: Implications for Diet Quality Monitoring. Nutrients, 14(9), 1754. https://doi.org/10.3390/nu14091754