Abstract
The Visible and Infrared Imaging Radiometer Suite (VIIRS) onboard the Joint Polar Satellite System (JPSS)/Suomi National Polar-Orbiting Partnership (SNPP) satellite provide sensor data records for the retrievals of many environment data records. It is critical to monitor the VIIRS long-term calibration stability to ensure quality EDR retrieval. This study investigates the radiometric calibration stability of the NOAA operational SNPP VIIRS Reflective Solar Bands (RSB) and Day-Night-Band (DNB) using Deep Convective Clouds (DCC). Monthly and semi-monthly DCC time series for 10 moderate resolution bands (M-bands, M1–M5 and M7–M11, March 2013–September 2015), DNB (March 2013–September 2015, low gain stage), and three imagery resolution bands (I-bands, I1–I3, January 2014–September 2015) were developed and analyzed for long-term radiometric calibration stability monitoring. Monthly DCC time series show that M5 and M7 are generally stable, with a stability of 0.4%. DNB has also been stable since May 2013, after its relative response function update, with a stability of 0.5%. The stabilities of M1–M4 are 0.6%–0.8%. Large fluctuations in M1–M4 DCC reflectance were observed since early 2014, correlated with F-factor (calibration coefficients) trend changes during the same period. The stabilities of M8-M11 are from 1.0% to 3.1%, comparable to the natural DCC variability at the shortwave infrared spectrum. DCC mean band ratio time series show that the calibration stabilities of I1–I3 follow closely with M5, M7, and M10. Relative calibration changes were observed in M1/M4 and M5/M7 DCC mean band ratio time series. The DCC time series are generally consistent with results from the VIIRS validation sites and VIIRS/MODIS (the Moderate-resolution Imaging Spectroradiometer) simultaneous nadir overpass time series. Semi-monthly DCC time series for RSB M-bands and DNB were compared with monthly DCC time series. The results indicate that semi-monthly DCC time series are useful for stability monitoring at higher temporal resolution.
1. Introduction
The Visible and Infrared Imaging Radiometer Suite (VIIRS) onboard the Joint Polar Satellite System (JPSS)/Suomi National Polar-Orbiting Partnership (SNPP) satellite has 22 spectral bands, with 14 Reflective Solar Bands (RSB), 7 Thermal Emissive Bands (TEB) and 1 Day-Night-Band (DNB) [1,2]. VIIRS RSBs are calibrated using a full-aperture Solar Diffuser (SD) and the degradation of SD is monitored by a Solar Diffuser Stability Monitor (SDSM). Significant SD, SDSM detectors, and Rotating Telescope Assembly (RTA) mirror degradations were observed, especially early after launch. The rate of RTA mirror and SD degradations has decreased since mid-2013 and early 2014, respectively. Their impacts on the instrument performance are negligible (at 0.1% level) due to weekly updates of RSB calibration coefficients (F-factor) Look-Up Table (LUT) [3,4]. However, larger F-factor fluctuations have been observed since early 2014 in some shorter wavelength bands, with band M1 fluctuating the most (~3%). The underlying cause for the F-factor anomalies has not been identified so far. VIIRS RSB Sensor Data Records (SDR) provide input data for the retrieval of many Environment Data Records (EDR) products, such as ocean color, vegetation, cloud, and surface albedo. It is therefore critical to monitor the long-term stability of VIIRS RSBs to ensure quality EDR products.
VIIRS DNB is a panchromatic imagery band (0.5–0.9 µm) with dynamic range of approximately seven orders of magnitude [5]. It has three gain stages: the Low Gain Stage (LGS, daytime), the Medium Gain Stage (MGS, twilight) and the High Gain Stage (HGS, nighttime). The onboard calibration of DNB LGS is similar to that for RSBs, with LGS gain derived using SD/SDSM data. DNB MGS and HGS are calibrated using LGS gain and MGS/LGS and HGS/LGS gain ratios estimated using Earth View (EV) data at the terminator orbit where EV observations at the three gain stages co-exist. VIIRS DNB is originally designed as an imagery band to continue the night observation heritage of the Operational Linescan System (OLS) onboard the Defense Meteorological Satellite Program (DMSP). DNB nighttime observations have been widely used in many areas such as detecting power outrage, monitoring city lights, urban expansion and fishing boats, as well as studying air glow, aurora, and lightning. Due to its superior spatial and radiometric performance, quantitative applications of the VIIRS DNB band have been developed or are under development, such as estimating population and economic output [6,7] and nighttime aerosol retrieval [8].
The JPSS Interface Data Processing Segment (IDPS) ground processing team has produced nearly four years of NOAA operational VIIRS SDRs to date, with several major calibration changes applied since launch. The JPSS program is currently planning to reprocess the entire VIIRS SDR products. To better facilitate quantitative applications and the future reprocessing of the VIIRS RSB and DNB SDRs, it is important to use independent validation time series to evaluate their long-term post-launch calibration stability. Many efforts have been devoted to characterize the long-term stability of the NOAA operational VIIRS RSBs and DNB (HGS). Uprety et al. [9] and Uprety and Cao [10] investigated the VIIRS onboard RSB radiometric performance using the extended Simultaneous Nadir Overpass (SNO-x) approach over desert sites, and the Antarctica Dome C site. Wang and Cao [11] provided a preliminary assessment of the VIIRS bands M1–M5 and M7 calibration stability using monthly Deep Convective Clouds (DCC) time series. Liao et al. [5] evaluated DNB HGS radiometric calibration accuracy using vicarious calibration under lunar illumination. Ma et al. [12] investigated the DNB HGS calibration accuracy by comparing the observed VIIRS DCC radiance with nighttime DCC radiances simulated using a radiative transfer model. Cao and Bai [13] investigated the feasibility of using point light sources for monitoring DNB HGS calibration stability.
The purpose of this study is to investigate the NOAA operational VIIRS RSB and DNB (LGS) long-term radiometric calibration stabilities using the DCC technique. It extends the previous study [11], which provides preliminary results for the moderate resolution visible and near infrared (VIS/NIR) bands (M-bands) only, by using longer time series and analyzing more bands, including DNB, shortwave infrared bands (SWIR) and imagery resolution bands (I-bands). Moreover, semi-monthly DCC time series were also developed and analyzed for stability monitoring at higher temporal resolution. In this study, the DCC technique was applied to all RSB bands, including 10 M-bands and 3 I-bands. Stable DNB LGS radiometric calibration is a prerequisite for quality DNB nighttime calibration to support quantitative applications of DNB data. Previous studies have focused on characterizing HGS data directly, but the radiometric calibration stability of DNB LGS has not been well studied so far. This paper is organized as follows. Section 2 introduces VIIRS SDR products used in this study. Section 3 presents the DCC technique for RSBs and DNB. Section 4 presents and discusses monthly and semi-monthly DCC time series for calibration change and long-term stability monitoring. Finally Section 5 summarizes the findings of the study.
2. VIIRS SDR Products Used
VIIRS has 11 RSB M-bands (M1–M11, 750 m) and 3 RSB I-bands (I1–I3, 375 m). M6 saturates over DCCs, therefore it was excluded from this study. TEB band M15 (10.763 µm) provides brightness temperature measurements that are required to identify DCC pixels for RSB M-bands and DNB. I1–I3 DCCs are identified using I5 (11.469 µm) brightness temperature. The center wavelength, spatial, and radiometric characteristics of all bands used in this study are summarized in Table 1. Figure 1 presents the Relative Spectral Response (RSR) functions for these bands.

Table 1.
Spectral, spatial, and radiometric characteristics of Visible and Infrared Imaging Radiometer Suite (VIIRS) spectral bands used in this study. M1–M5 and M7 SNRs at low gain stage and typical scene radiances are listed because Deep Convective Clouds (DCCs) are highly reflective; band M15 and I5 NEdTs is estimated at 205 K scene temperature.
| Band | Center Wavelength (µm) | Spatial Resolution at Nadir (m) | SNR/NEdT (Spec) | SNR/NEdT (On-Orbit) | |
|---|---|---|---|---|---|
| VIS/NIR | M1 | 0.411 | 750 | 316 | 1045 |
| M2 | 0.444 | 750 | 409 | 1010 | |
| M3 | 0.486 | 750 | 414 | 988 | |
| M4 | 0.551 | 750 | 315 | 856 | |
| M5 | 0.672 | 750 | 360 | 631 | |
| I1 | 0.639 | 375 | 119 | 214 | |
| M7 | 0.862 | 750 | 340 | 631 | |
| I2 | 0.862 | 375 | 150 | 264 | |
| SWIR | M8 | 1.238 | 750 | 74 | 221 |
| M9 | 1.375 | 750 | 83 | 227 | |
| M10 | 1.602 | 750 | 342 | 586 | |
| I3 | 1.602 | 375 | 6 | 149 | |
| M11 | 2.257 | 750 | 10 | 22 | |
| DNB | DNB | 0.700 | 750 | ≥6@Lmin | >9 across scan after degradation |
| TEB | M15 | 10.729 | 750 | 0.26 K | 0.10 K |
| I5 | 11.469 | 375 | 1.7 K | 0.43 K |
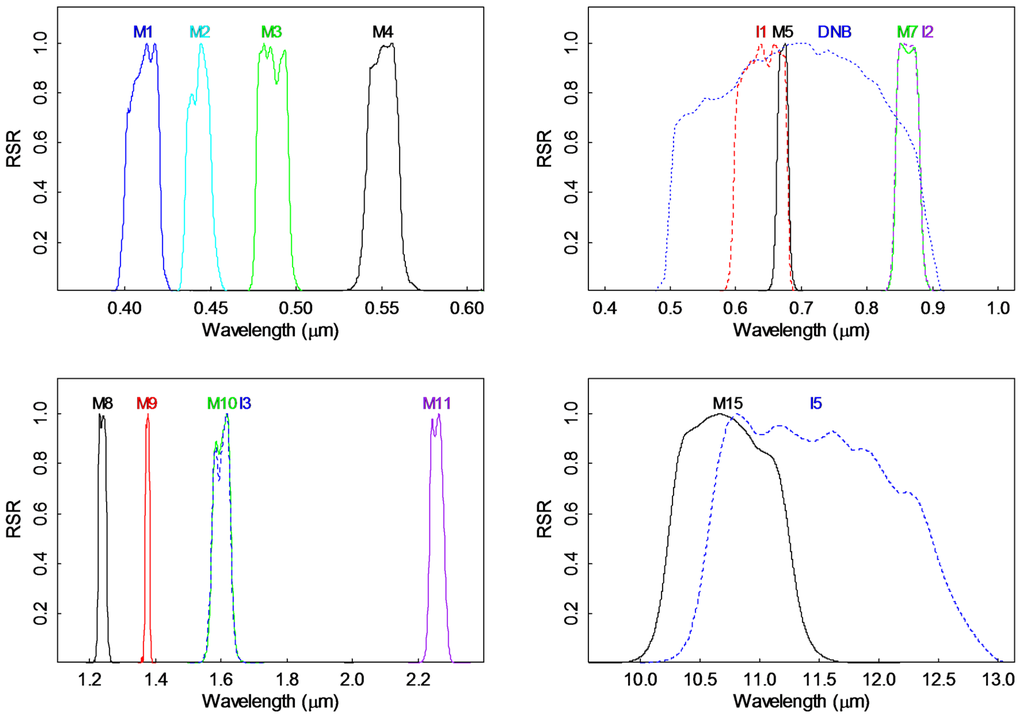
Figure 1.
Relative spectral response functions (RSR) of all VIIRS bands used in this study.
The area of interests of this study is a region defined as 25°S to 25°N and 150°W to 60°W. This area covers a portion of the InterTropical Convergence Zone (ITCZ) over the western end of tropical Pacific Ocean and its adjacent South America Continent. DCCs over the same region were also used in previous studies [11,14]. VIIRS daytime Top of Atmosphere (TOA) reflectance/brightness temperature, and radiance were downloaded from the NOAA’s Comprehensive Large Array-data Stewardship System (CLASS), the NOAA/NESDIS/STAR Central Data Repository (a 4 months revolving mirror site of CLASS for SNPP data), and the NASA Atmosphere Science Investigator-led Processing Systems (SIPS). All VIIRS SDR products used in this study are generated by the NOAA operational ground processing unit at the JPSS IDPS. It is worth noting that no vicarious calibration is applied to the IDPS version of VIIRS RSB and DNB SDR products.
3. The DCC Technique for VIIRS
DCCs are extremely cold clouds above which the absorptions due to water vapor and other gases are minimal in the VIS/NIR spectrum. DCCs are abundant over the ITCZ and can be simply identified using a single longwave infrared (LWIR) channel centered at ~11 µm brightness temperature (TB11 hereafter). Hu et al. [15] first demonstrated that DCCs have a constant mean albedo over the lifetime of the Clouds and the Earth’s Radiant Energy System (CERES) on board the Tropical Rainfall Measuring Mission (TRMM) satellite. The DCC technique outlined by Hu et al. [15] was further improved through various studies such as Doelling et al. [16,17], Minnis et al. [18], and Fougnie and Bach [19]. It has been widely used for post-launch calibration and stability monitoring in the solar reflective spectrum during the past decade [11,16,17,18,19,20,21]. The DCC technique generally consists of the following steps: (1) collecting satellite data over an area of interest; (2) identifying DCC pixels; (3) correcting for the anisotropic effect in DCC reflectance; (4) calculating monthly DCC probability distribution functions (PDF); (5) generating and analyzing monthly DCC mean and mode time series. It is a statistical-based vicarious calibration method; therefore sufficient DCC samples need to be collected to ensure robust statistical analysis results.
In this study, VIIRS DCC pixels are identified using the Wang and Cao [11,14] method, which is similar to those described in Minnis et al. [18] and Doelling et al. [17]. The criteria for identifying VIIRS M-bands DCC pixels are summarized as follow: (1) M15 brightness temperature is less than 205 K; (2) standard deviation of TB11 of the subject pixel and eight adjacent pixels is less than 1 K; (3) standard deviation of TOA reflectance of the subject pixel and eight adjacent pixels is less than 3% relative to the mean reflectance of the nine pixels; (4) solar zenith angle is less than 40°; (5) sensor view zenith angle is less than 35°.
The identifications of DNB and I-bands DCCs are similar to that for M-bands. DNB radiances were mapped to M15 lat/lons and converted to TOA reflectance before DCC pixels were identified using band M15 brightness temperatures. Band I5 brightness temperatures were used for the I-band DCC identifications. Wang and Cao [14] found that the mode and mean of DCC reflectance is a function of spatial resolution but not sensitive to brightness temperature difference on the order of 0.5 K. In this study, I1–I3 TOA reflectance and I5 brightness temperatures were down-sampled to M-band resolution before DCCs are identified to facilitate inter-comparison of DCC time series between M-bands and I-bands. Though different TB11 bands were used for M-bands/DNB and I-bands DCC identifications, the mean M15 brightness temperature is only ~0.2 K higher than the mean I5 brightness temperatures for the down-sampled I-bands DCCs, therefore its impact can be ignored.
RSB M-bands and DNB DCC TOA reflectance as well as TB11 brightness temperature datasets over the area of interest were generated using the DCC identification criteria described above from March 2012 to September 2015. The study period for RSB I-bands is from January 2014 to September 2015. Though DCCs have nearly Lambertian behavior, the anisotropic effect still exists in the DCC TOA reflectance and Angular Distribution Models (ADM) were developed to account for the effect [15,17,22]. For each DCC pixel, the ADM-adjusted DCC reflectance datasets were also generated using an ADM developed by Hu et al. [15]. Monthly PDFs, as well as their means and modes, were calculated for the DCC TOA reflectance and the ADM-adjusted DCC reflectance (DCC reflectance hereafter) with a 0.003 increment (in reflectance) [14]. Figure 2 shows examples of monthly PDFs for bands M1, M7, M9, and DNB ADM-adjusted DCC reflectance. Standard deviations (sd), minimum (Min), maximum (Max), and range (Max−Min) were calculated using DCC datasets for the selected months. Monthly DCC statistics for all bands during the entire study period are summarized in Table 2 (before the ADM adjustment) and Table 3 (after the ADM adjustment).
The monthly DCC statistics derived from this study are generally consistent with previous studies in the VIS/NIR spectrum. The averaged monthly DCC TOA reflectance is larger than 0.94 for all VIS/NIR bands and DNB, confirming that DCCs are highly reflective [15,17,19]. The range of band M5 monthly DCC mean TOA reflectance is ~2.8% (see Table 2), smaller then the ±2% range reported by Fougnie et al. [19]. The ADM-adjusted DCC reflectance is more invariant compared to the DCC TOA reflectance (see Table 2 and Table 3). The range of band M5 monthly DCC reflectance is further reduced after the ADM-adjustment, agreeing with the results from Doeling et al. [17]. Therefore, the ADM-adjusted monthly DCC reflectance (DCC reflectance hereafter) was used to analyze VIIRS VIS/NIR and DNB radiometric calibration stabilities. Detailed analysis of VIIRA VIS/NIR bands and DNB DCC time series are presented in Section 4.1, Section 4.2, and Section 4.4.
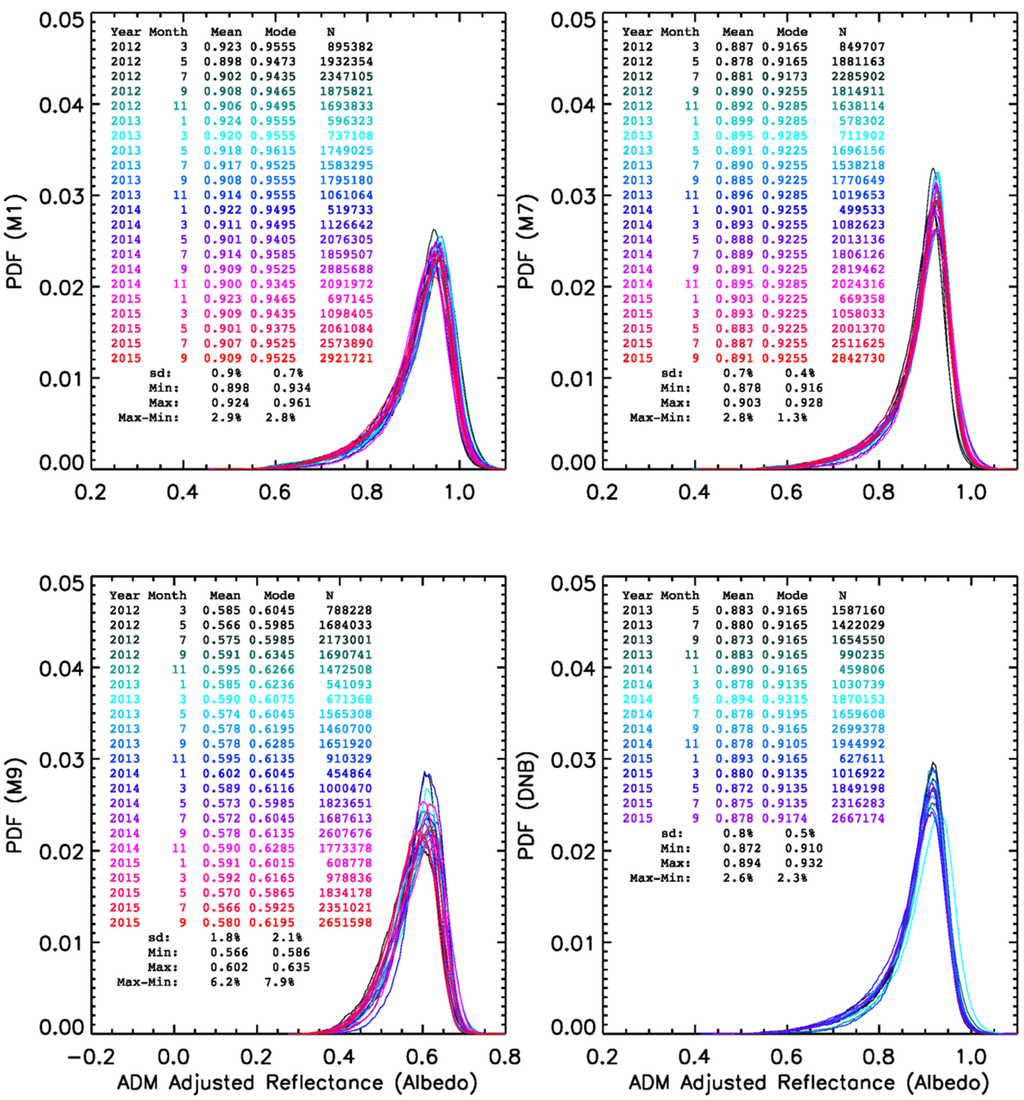
Figure 2.
Probability distribution functions of VIIRS bands M1, M7, M9, and Day-Night-Band (DNB) Angular Distribution Models (ADM)-adjusted monthly DCC reflectance. Standard deviation (sd), minimum (Min), maximum (Max), and range (Max−Min) were calculated using DCC data from selected months.
Table 2.
Statistics of monthly DCC Top of Atmosphere (TOA) reflectance (before the ADM adjustment) mean and mode time series for Reflective Solar Bands (RSB) M-bands (M1–M5, M7–M11, March 2012–September 2015), DNB (May 2013–September 2015), and RSB I-bands (I1–I3, January 2014–September 2015).
| Band | DCC Mode | DCC Mean | |||||
|---|---|---|---|---|---|---|---|
| Avg | sd (%) | Max−Min (%) | Avg | sd (%) | Max−Min (%) | ||
| VIS/NIR | M1 | 1.018 | 1.0 | 4.124 | 0.977 | 1.0 | 3.825 |
| M2 | 1.009 | 1.1 | 4.461 | 0.967 | 1.1 | 5.107 | |
| M3 | 1.005 | 1.0 | 4.178 | 0.963 | 1.0 | 4.187 | |
| M4 | 0.973 | 0.9 | 4.009 | 0.931 | 0.9 | 3.534 | |
| M5 | 1.002 | 0.8 | 3.294 | 0.959 | 0.7 | 2.804 | |
| I1 | 0.963 | 0.8 | 3.740 | 0.919 | 0.9 | 3.544 | |
| M7 | 0.991 | 0.6 | 2.725 | 0.955 | 0.7 | 2.637 | |
| I2 | 0.991 | 0.6 | 1.816 | 0.954 | 0.8 | 3.355 | |
| SWIR | M8 | 0.704 | 1.0 | 3.834 | 0.698 | 1.0 | 3.250 |
| M9 | 0.655 | 1.7 | 6.387 | 0.625 | 1.7 | 6.777 | |
| M10 | 0.230 | 3.1 | 14.332 | 0.232 | 3.1 | 10.342 | |
| I3 | 0.230 | 3.2 | 13.930 | 0.232 | 3.1 | 10.050 | |
| M11 | 0.371 | 2.2 | 8.398 | 0.371 | 2.2 | 7.199 | |
| DNB | DNB | 0.982 | 0.8 | 3.361 | 0.944 | 0.9 | 3.110 |
Table 3.
Statistics of monthly DCC reflectance (after the ADM adjustment) mean and mode time series for all RSB M-bands (M1–M5, M7–M11, March 2012–September 2015), DNB (May 2013–September 2015), and RSB I-bands (I1–I3, January 2014–September 2015).
| Band | DCC Mode | DCC Mean | |||||
|---|---|---|---|---|---|---|---|
| Avg | sd (%) | Max−Min (%) | Avg | sd (%) | Max−Min (%) | ||
| VIS/NIR | M1 | 0.950 | 0.8 | 3.157 | 0.911 | 0.8 | 2.961 |
| M2 | 0.942 | 0.8 | 4.461 | 0.902 | 1.0 | 4.782 | |
| M3 | 0.938 | 0.8 | 4.158 | 0.897 | 0.9 | 4.232 | |
| M4 | 0.908 | 0.6 | 2.972 | 0.868 | 0.7 | 3.606 | |
| M5 | 0.936 | 0.4 | 1.924 | 0.894 | 0.6 | 2.756 | |
| I1 | 0.898 | 0.5 | 2.004 | 0.856 | 0.8 | 3.407 | |
| M7 | 0.924 | 0.4 | 1.299 | 0.891 | 0.7 | 2.803 | |
| I2 | 0.924 | 0.4 | 1.624 | 0.889 | 0.8 | 3.227 | |
| SWIR | M8 | 0.656 | 1.1 | 3.938 | 0.650 | 1.1 | 3.378 |
| M9 | 0.611 | 1.9 | 7.860 | 0.582 | 1.8 | 6.628 | |
| M10 | 0.214 | 3.5 | 14.478 | 0.216 | 3.3 | 10.862 | |
| I3 | 0.214 | 3.3 | 14.037 | 0.216 | 3.3 | 11.024 | |
| M11 | 0.345 | 2.6 | 10.427 | 0.346 | 2.5 | 8.065 | |
| DNB | DNB | 0.917 | 0.5 | 2.291 | 0.881 | 0.8 | 3.701 |
The monthly DCC statistics derived from this study also generally agree with previous studies in the SWIR spectrum [17,20]. DCCs are less reflective in the SWIR spectrum, with the averaged monthly DCC mean reflectance ranging from ~0.2 to ~0.7 for VIIRS band M8–M11 and I3. DCCs are also less stable in the SWIR spectrum. The standard deviations of ranges of SWIR bands monthly mean and mode of DCC TOA reflectance are much larger than those for the VIS/NIR bands in majority of cases (see Table 2). Our results indicate that the Hu et al. [15] ADM used in this study is ineffective for the SWIR bands. The ADM-adjusted DCC reflectance has larger variance than the DCC TOA reflectance before the ADM adjustment (see Table 2 and Table 3). Therefore, the DCC TOA reflectance without ADM adjustment was used to characterize the VIIRS SWIR bands calibration stability. More effort is needed to develop ADM for the SWIR bands in the future. In-depth analysis of VIIRS SWIR bands DCC time series are presented in Section 4.3 and Section 4.4.
4. Results and Discussions
4.1. Calibration Stability for VIS/NIR M-Bands
4.1.1. Monthly VIS/NIR DCC Time Series
The DCC technique uses the mean and mode of the monthly DCC PDFs as the two important indices for calibration stability monitoring. Doelling et al. [17] shows that the mode of monthly DCC reflectance in the VIS/NIR spectrum is more stable than the mean in terms of TB11 threshold, spatial uniformity thresholds, and the choice of ADMs, as well as regional and temporal variations. Wang and Cao’s [14] DCC radiometric sensitivity studies based on VIIRS bands M5, M7, and I2 DCCs indicated that the mode of DCC reflectance is also more stable in terms of spatial resolution, TB11 threshold and calibration bias, and DCC cluster size. Therefore we used the mode method for monitoring the calibration stability of individual VIS/NIR bands. It is worth noting the accuracy of the mode method is restricted by the the 0.003 increment used in this study.
Figure 3 shows monthly DCC mode time series for M1–M5 and M7 from March 2012 to September 2015. DCC mean time series are illustrated in Figure 4 for comparison purposes. The DCC mean time series exhibit similar patterns, however, with noticeable seasonal variations compared to the mode time series. Table 3 summarizes the statistics of monthly DCC time series for all individual VIS/NIR bands discussed in this subsection and the following subsections. The DCC mode time series reveal that the stabilities (calculated as the standard deviations of time series) are ~0.8% or less, with ranges less than 4.5% for all VIS/NIR M-bands investigated. Similar to our previous study for the time period from March 2013 to August 2014 [11], the calibration of bands M5 and M7 continue to be more stable than the other four VIS/NIR bands, with a stability of 0.4% and ranges of 1.9% and 1.3%, respectively. However, band M7 shows an obvious calibration jump (~1%) around September 2012; an M5 calibration anomaly was observed in February of 2015, similar to bands M1–M4. The calibrations of bands M1–M4 are less stable. The standard deviations for these four bands are 0.6% to 0.8% and ranges are from ~3.0% to 4.5%. Moreover, noticeable degradations can be observed in M2–M4 DCC mode time series, with M2 showing the most degradation (0.45%/year from May 2012 to September 2015). 95% confidence intervals shown in Figure 3 indicate the downward trends are robust for these 3 bands. Uprety and Cao [10] investigated the radiometric calibration stability of the NOAA operational calibrated VIIRS RSB bands. The bands M1 and M5 trends derived from this study are generally consistent with their findings based on normalized Bidirectional Reflectance Distribution Function (BRDF) time series over desert and Dome C sites. However, the results for bands M2–M4 and M7 from this study disagree with the results reported by Uprety and Cao’s [10].
Several major VIIRS calibration change events [23] are clearly shown in these time series. The April 2012 IDPS code and LUT changes and the October 2013 calibration changes due to the misalignment of SDSM with VIIRS instrument [24] are obvious in M2–M4 DCC mode time series. The F-factor trend changes since February 2014 and the switching of VIIRS operational H-Factor in the RSB calibration to the high fidelity version on 22 May 2014, have the most significant impacts on bands M1–M4. M1–M4 monthly DCC reflectance for June 2014 jumped by ~2.3%, 1.8%, 1.8%, and 0.9%, respectively, compared to the previous two months (see Figure 3).
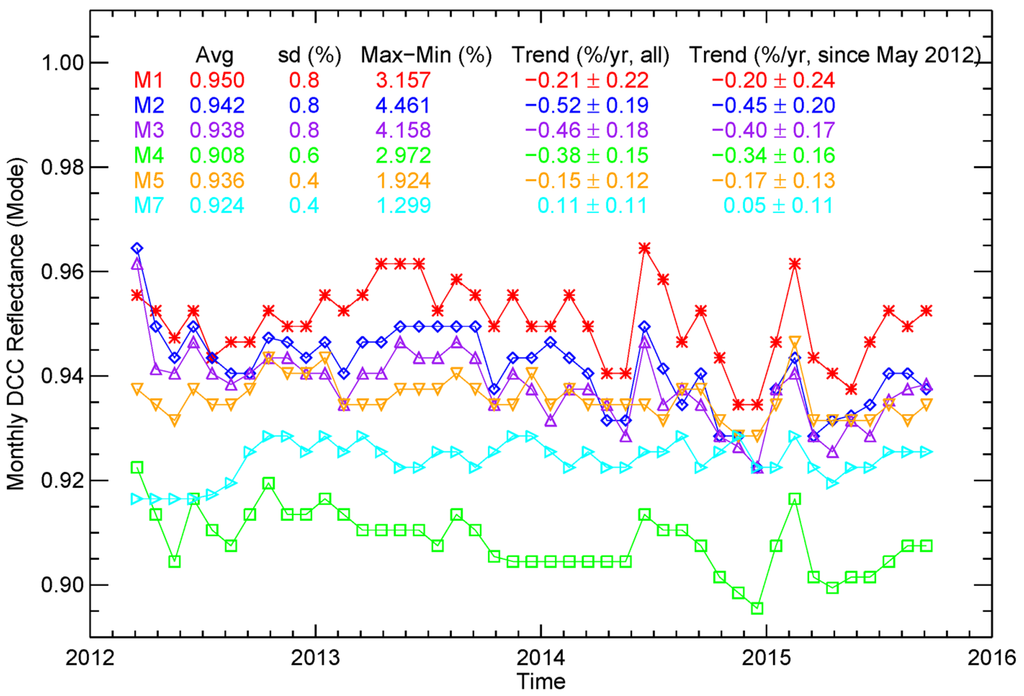
Figure 3.
Monthly DCC mode time series for bands M1–M5 and M7 (March 2012–September 2015).
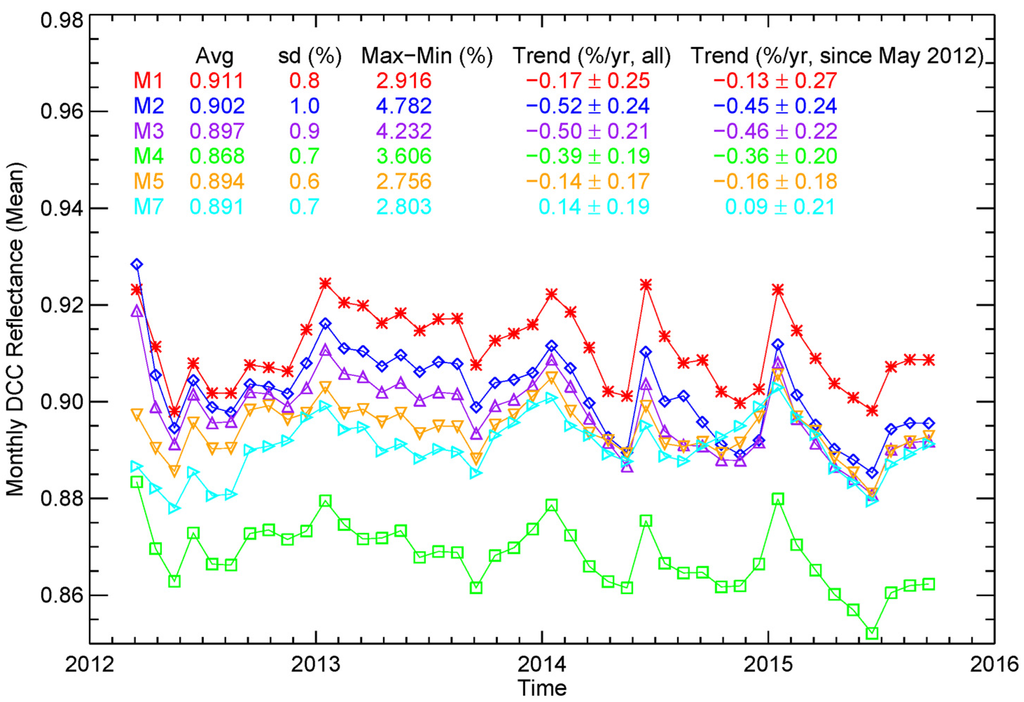
Figure 4.
Monthly DCC mean time series for bands M1–M5 and M7 (March 2012–September 2015).
Figure 5 compares M1–M4 DCC mode time series and the corresponding IDPS F-factor time series. Our results indicate that the VIS/NIR DCC reflectance variations are correlated with IDPS F-factor changes, with correlation coefficients (R) ranging from 0.35 to 0.54. Larger fluctuations in the band M1–M4 monthly DCC reflectance observed since early 2014 are generally consistent with IDPS F-factor trend changes during this period. The coincidence of changes in monthly DCC reflectance and F-factor time series further supports that the DCC technique is valuable for VIIRS RSB calibration monitoring.
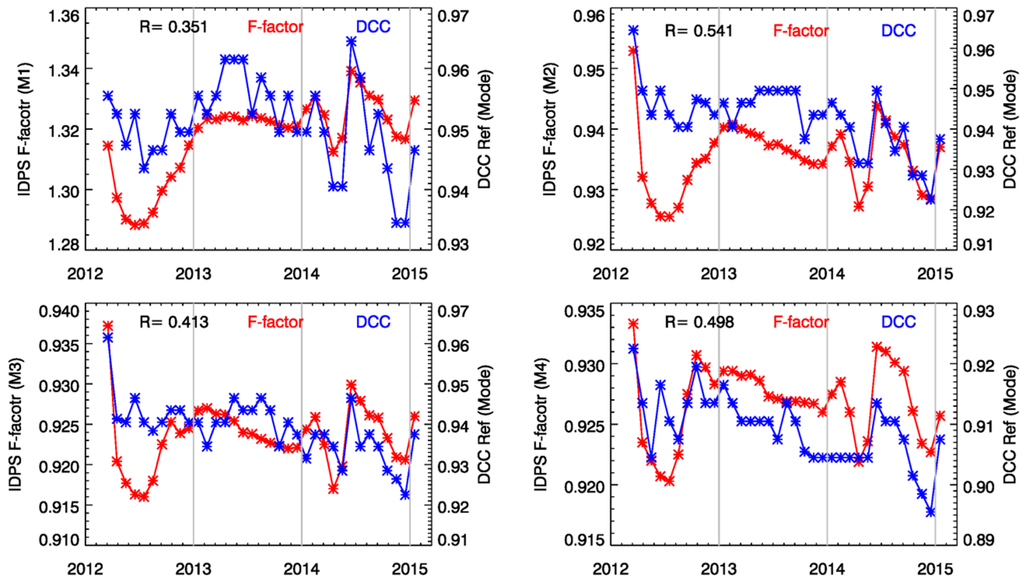
Figure 5.
Comparison of DCC mode and IDPS F-factor time series for bands M1–M4 (R represents correlation coefficient).
4.1.2. Semi-Monthly VIS/NIR DCC Time Series
The number of monthly DCC pixels over the study area varies from ~0.5 to ~3 million. DCCs are more abundant during late spring, summer, and fall (see Figure 2). We investigated the feasibility of splitting monthly DCC datasets to monitor the VIIRS calibration stability at a higher temporal resolution from April to November, while monthly DCCs are continued to be used for the remaining months. The mean and mode were calculated independently for each semi-monthly DCC dataset using the same method as the monthly DCCs. Figure 6 compares monthly and semi-monthly DCC mode time series for M1, M4, and M7. Semi-monthly DCC time series show similar stability statistics as those from monthly DCC time series. The major calibration changes (see Section 4.1.1) occurred during the DCC abundant months can be observed clearly in semi-monthly DCC time series. However, the semi-monthly time series are noisier, especially for M1 and M4, which experience larger calibration changes. On the other hand, for M7 for which the calibration is relatively stable, the semi-monthly and monthly time series are very close to each other. Semi-monthly DCC may better capture calibration fluctuations because IDPS F-factors are updated weekly.
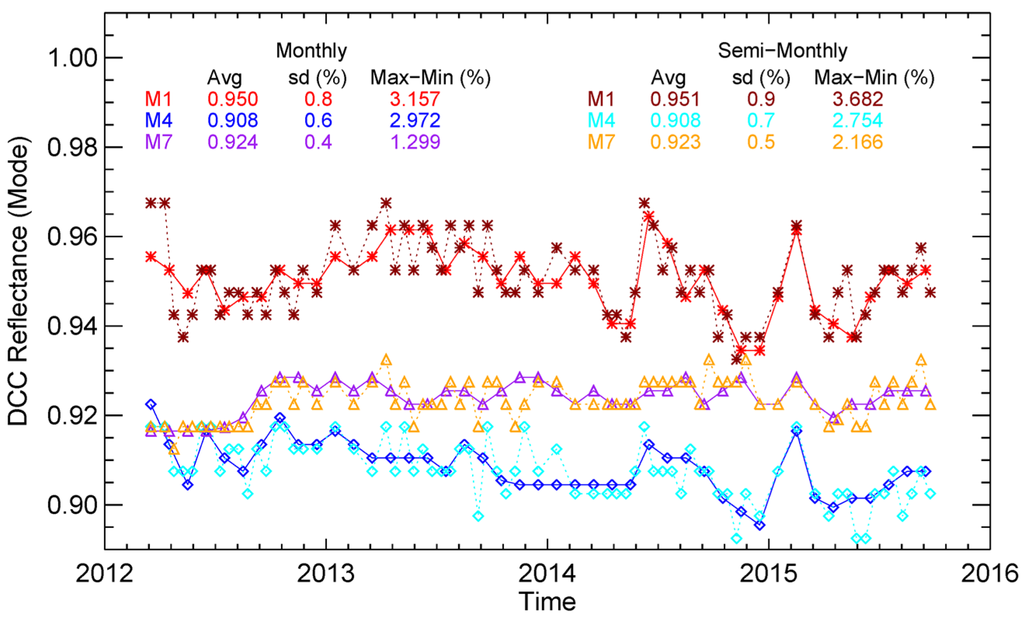
Figure 6.
Comparison of monthly and semi-monthly DCC mode time series for M1, M4, and M7.
4.1.3. DCC Mean Band Ratio Times Series
VIS/NIR DCC spectral ratio is insensitive to solar and viewing geometries, cloud optical thickness, and cloud particle type [19] in the VIS/NIR spectrum. Previous studies found that DCC mean ratio time series is generally more stable than the mode time series for inter-channel relative calibration using the DCC technique [14,19]. Fougnie et al. [19] indicated that the accuracy of DCC mean band ratio time series is ~0.2% if the reference band is perfectly characterized. Figure 7 shows the DCC band ratio time series for M1/M4 and M5/M7, with the mean ratio time series plotted in blue and the mode ratio time series plotted in gray. The statistics of DCC band ratio time series, including average, standard deviation, range, and trend with 95% confidence interval, are also shown for each time series. It can be observed that the mode and mean band ratio time series are generally consistent with each other. However, the mean ratio time series are smoother than the mode ratio time series. As a result, the mean band ratio time series were used for relative calibration stability monitoring in this study.
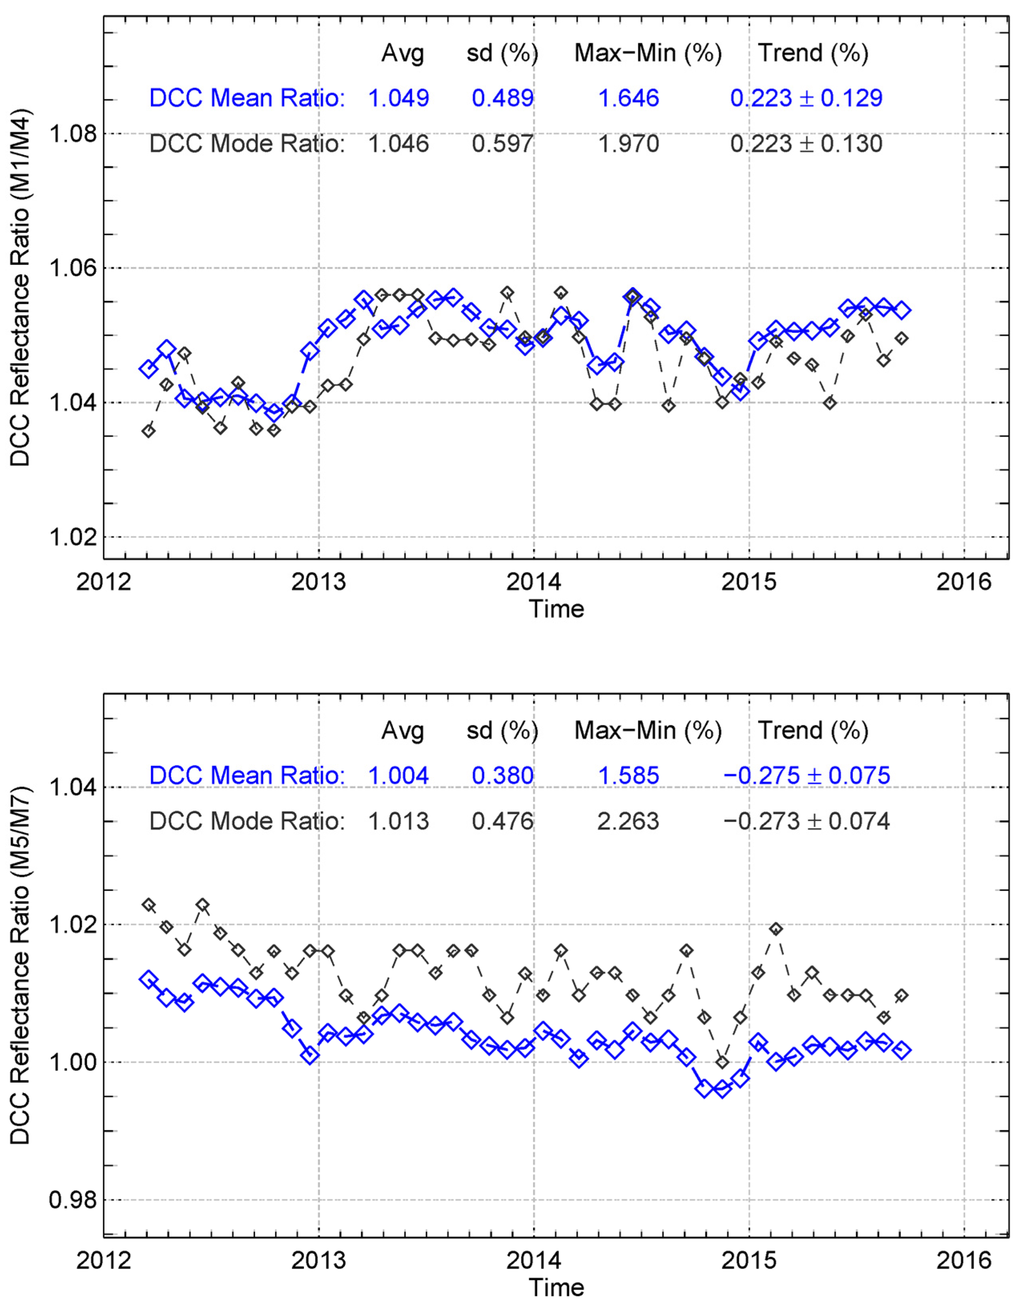
Figure 7.
Monthly DCC band ratio time series for M1/M4 and M5/M7.
DCC mean band ratio time series reveals relative calibration changes that is not obvious in the time series for individual bands. Band M4 has been used as reference by the ocean color EDR retrievals. M1/M4 DCC band ratio time series reveal a ~1.5% relative calibration change between 2012 and 2013 due to the November 2012 SD processing parameter change [23]. It generally agrees with vicarious calibration results reported by the NOAA STAR ocean color group based on the MOBY Hawaii in situ observations [25]. M5/M7 band ratio time series decreases by ~1.0% from March 2012 to September 2015, which may negatively impact the green vegetation and ocean color EDR long-term trends studies if these calibration issues are not properly addressed. 95% confidence intervals indicate that the M1/M4 and M5/M7 band ratio changes are significant. Figure 8 compares IDPS F-factor ratio time series and DCC mean band ratio time series. DCC band ratio time series are correlated with F-factor band ratio time series, especially for M1/M4. The DCC technique also has uncertainty associated with it. However, our results indicate that the DCC band ratio changes are at least partially caused by the imperfect IDPS F-factor calculations.
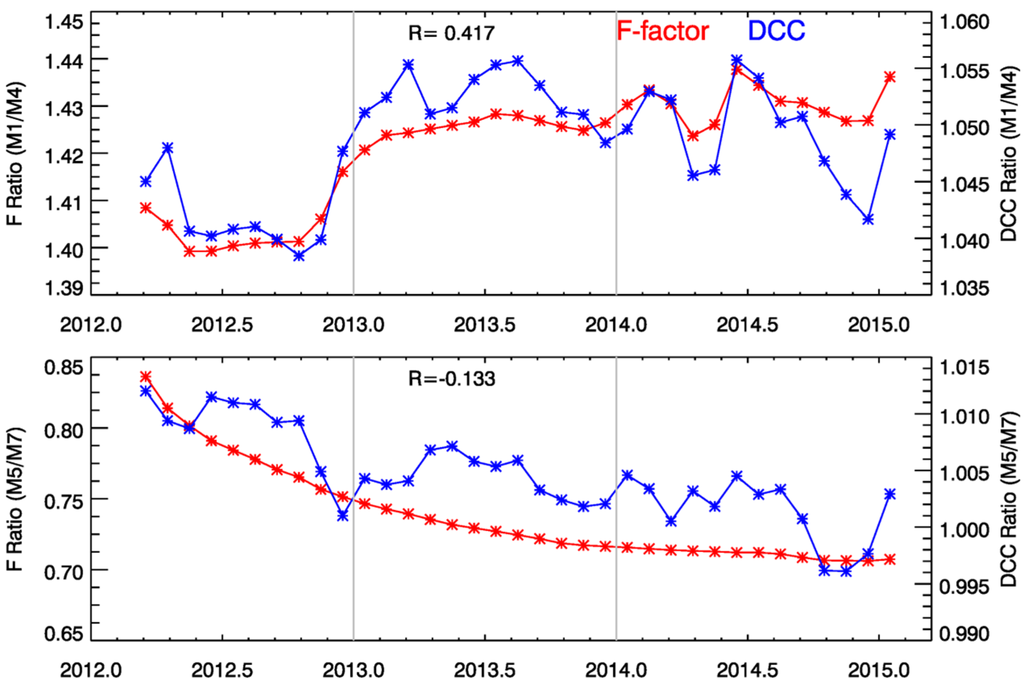
Figure 8.
Comparison of IDPS F-factor and DCC mean band ratio time series for M1/M4 and M5/M7.
4.1.4. Comparing DCC Time Series with MODIS/VIIRS SNO-x Time Series
The radiometric calibration stability was previously studied using VIIRS and MODIS (the Moderate-resolution Imaging Spectroradiometer) Aqua SNO-x time series [9]. We compared the VIS/NIR VIIRS DCC mean and mode time series with the VIIRS-MODIS SNO-x time series using two years of data (March 2012 to February 2014). Three time series are plotted for each band using different colors in Figure 9: DCC mode (blue), DCC mean (dark gray), and SNO-x (red) time series. To facilitate visual comparison, the DCC mean time series were adjusted using constant offsets to match the DCC mode time series. The correlation coefficients between the SNO-x and the DCC mean time series were calculated using the un-adjusted values. Assuming the radiometric calibration of MODIS Aqua bands is stable, SNO-x time series indicate that M5 and M7 are more stable than bands M1–M4, same as the results from DCC time series (see Section 4.1.1). Interestingly, DCC mean time series have stronger correlations with the SNO-x time series for bands M1–M4, the calibration of which are less stable. However, DCC mode time series are closer to the SNO-x time series for bands M5 and M7, the radiometric calibration of which are relatively stable.
Another feature that can be observed is that DCC time series are more invariant compared to the SNO-x time series for all VIS/NIR bands. Previous studies indicated that the accuracy of the SNO method is affected by difference in solar geometry between SNO match-ups and imperfect cloud screening [9]. The DCC technique is not affected by cloud screening. Moreover, it is also less sensitive to solar geometry due to the fact that DCCs over tropics were used and the anisotropic effect is mostly accounted for. In addition, the statistics from the DCC technique are more robust because large number of DCC samples is available each month, while the number of SNO match ups is limited by satellite orbits, clouds, and solar geometry.
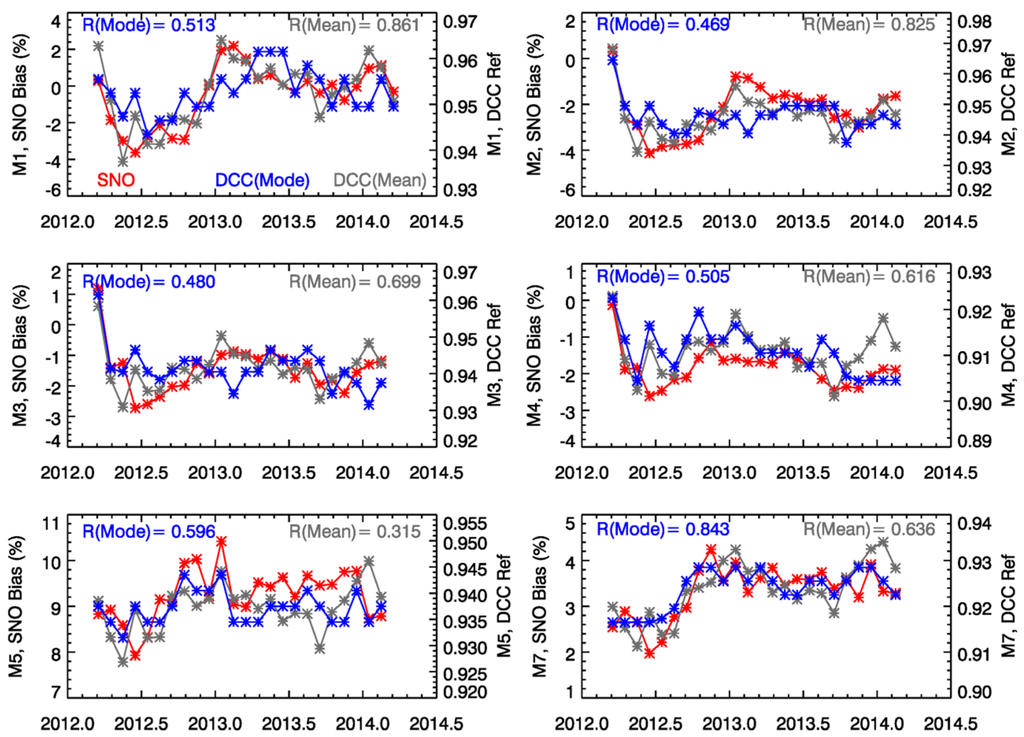
Figure 9.
Comparison of DCC mode and mean time series and SNO-x bias time series (the DCC mean time series were adjusted using constant offsets to match the DCC mode time series to facilitate visual comparison).
4.2. Calibration Stability for DNB LGS
DNB LGS gain characterization is indispensable for the calibration of DNB HGS (nighttime) observations that have attracted much attention from the DNB user community. While the DNB RSR was carefully characterized prelaunch, it was found the DNB RSR shifted toward the blue spectra after launch due to the VIIRS RTA mirror degradation with UV exposure. As a result of the degradation, the on-orbit spectral bandpass shifted slightly towards the blue and the full-width half maximum decreased slightly [5]. In this study, DNB TOA radiances were converted to TOA reflectance using the model-predicted RSR at orbit 6557 (February 2013) [5,26] that was implemented in operations in April 2014.
Figure 10 shows monthly and semi-monthly DCC mode time series for DNB daytime observations from April 2012 to September 2015. March 2012 DNB data was not used because of bad calibration. Though the RSR used in this study should be effective for DNB observations since February 2013, the monthly DNB DCC reflectance is not stable until May 2013. The mode of monthly DNB DCC reflectance increases from ~0.83 to ~0.92 from April 2012 to May 2015, at least partially due to LGS gain estimation errors caused by RSR shifts and the mismatch between DNB TOA radiance and RSR used to convert TOA radiance to TOA reflectance. This issue will be studied in the future after more RSRs for observations prior to May 2013 become available. DNB monthly DCC reflectance becomes generally stable since May 2013, with standard deviation of 0.5% and variation of 2.3%. Since the DNB RSR update, the DNB radiometric calibration performance is consistent with those for bands M5 and M7, the RSRs of which overlap partially with that for DNB (see Figure 1).
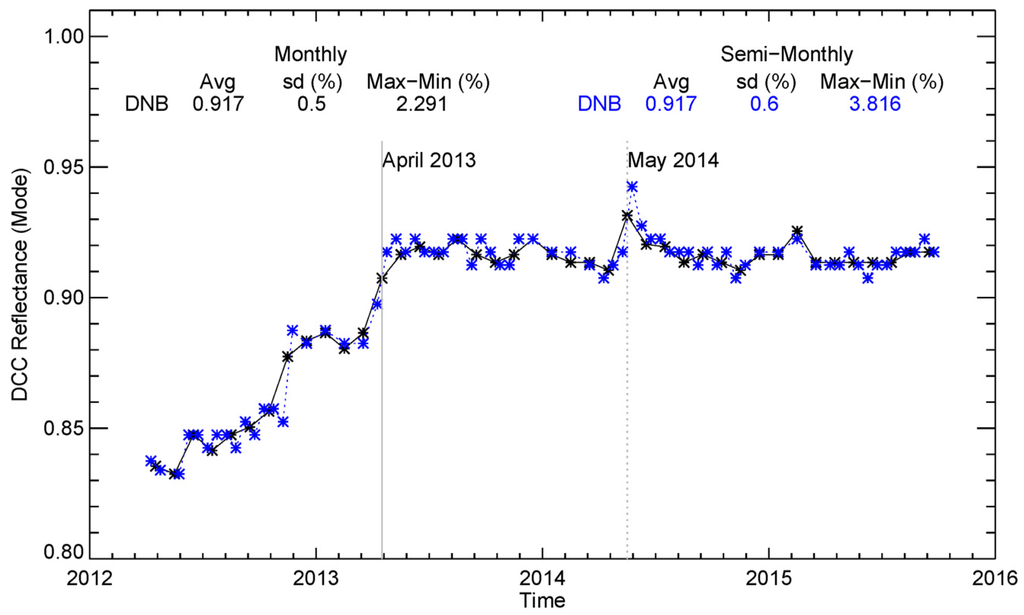
Figure 10.
Monthly (black solid line) and semi-monthly (blue dash line) DNB DCC mode time series (April 2012–September 2015).
While similar patterns were observed in the semi-monthly DNB DCC mean time series, the May 2014 DNB calibration anomaly is better captured by the semi-monthly time series. Because of a rare solar eclipse event on 29 April 2014 over the Antarctica region, the 9 May 2014 IDPS operational DNB LGS LUT was updated using the contaminated SD data. This error affected the DNB calibration during 9–15 May 2014 before the next LGS LUT update. As a result, monthly DNB DCC reflectance increased by ~2% in May 2014. This calibration normally is more clearly seen in the semi-monthly DCC time series, with the DNB DCC reflectance during the first half of May significantly higher than the average. Moreover, the semi-monthly time series show that the calibration of DNB becomes stable since the second half of April 2013, instead of May 2013 indicated by the monthly time series.
4.3. Calibration Stability for SWIR M-Bands
Figure 11 shows monthly DCC mode and mean time series for VIIRS SWIR M-bands from March 2012 to September 2015. DCC mean time series are represented by black color and DCC mode time series are represented by blue color. DCC mean and mode time series statistics, including averaged DCC TOA reflectance, standard deviation, and range, also are compared in Table 2. It is worth noting that the DCC TOA reflectance (without ADM adjustment) was used for SWIR bands stability monitoring due to the fact that the ADM adjustment is ineffective for the SWIR bands (see Section 3). Moreover, compared to VIS/NIR M-bands and DNB, DCC mean time series are slightly more stable than mode time series in the SWIR spectrum in most cases. Similar results was reported by Doelling et al. [17] based on MODIS Aqua DCCs and by Bhatt et al. [20] using the NASA Land Product Evaluation and Analysis Tool Elements (PEATE) version AS3100 VIIRS DCCs. Therefore, DCC mean time series are used for calibration stability monitoring for individual SWIR bands in this study. However, the difference in standard deviation between the mode and mean time series are small in the SWIR spectrum.
Monthly and semi-monthly DCC mean time series for SWIR M-bands are illustrated in Figure 12. M8–M11 calibration stability derived from monthly and semi-monthly DCC mean time series are very close to each other in all cases, similar to those for the stable VIS/NIR bands M5 and M7. However, DCCs are less invariant in the SWIR spectrum. Nearly constant annual cycles can be observed in the M8–M11 DCC mode and mean time series, which is different from the fact that no obvious annual cycles exist in the VIS/NIR DCC mode time series. DCC reflectance is mainly influenced by cloud particle type/size in SWIR spectrum [19,27]. For the area of interest of this study, Wang and Cao [14] found that DCCs mostly occur over the land during winter and over ocean during summer. The annual cycles may be due to the differences in cloud particle type/size over land and ocean. Similar annual cycles were observed in the MODIS Terra and Aqua DCC time series in the SWIR spectrum [20].
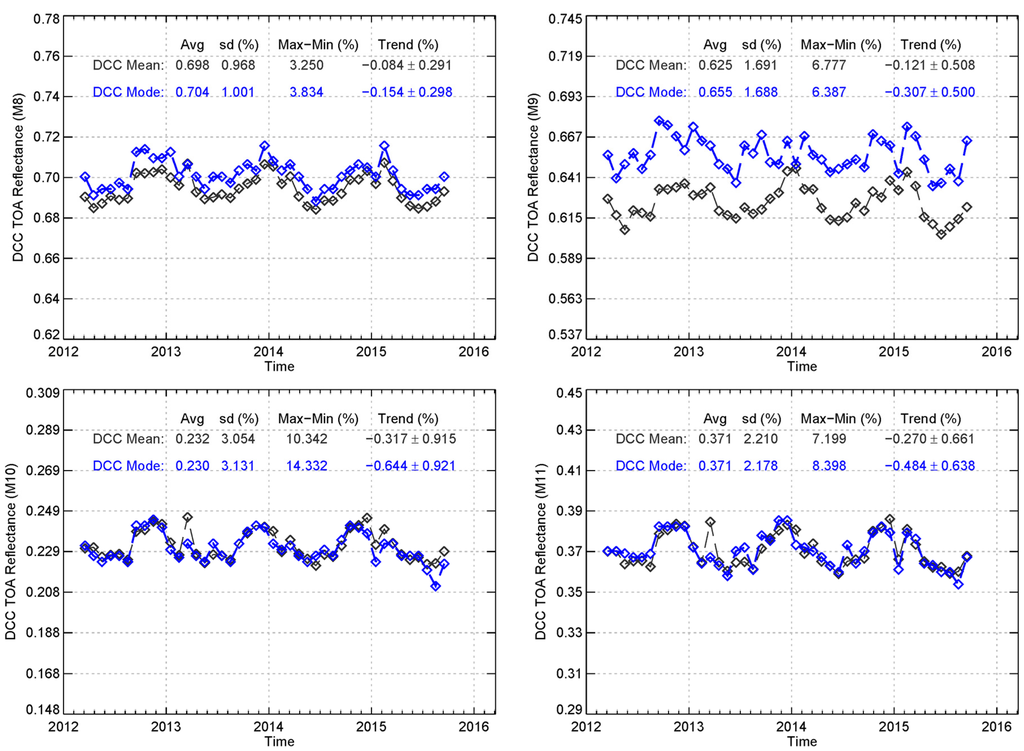
Figure 11.
Monthly DCC mode and mean time series for SWIR bands (M8–M11).
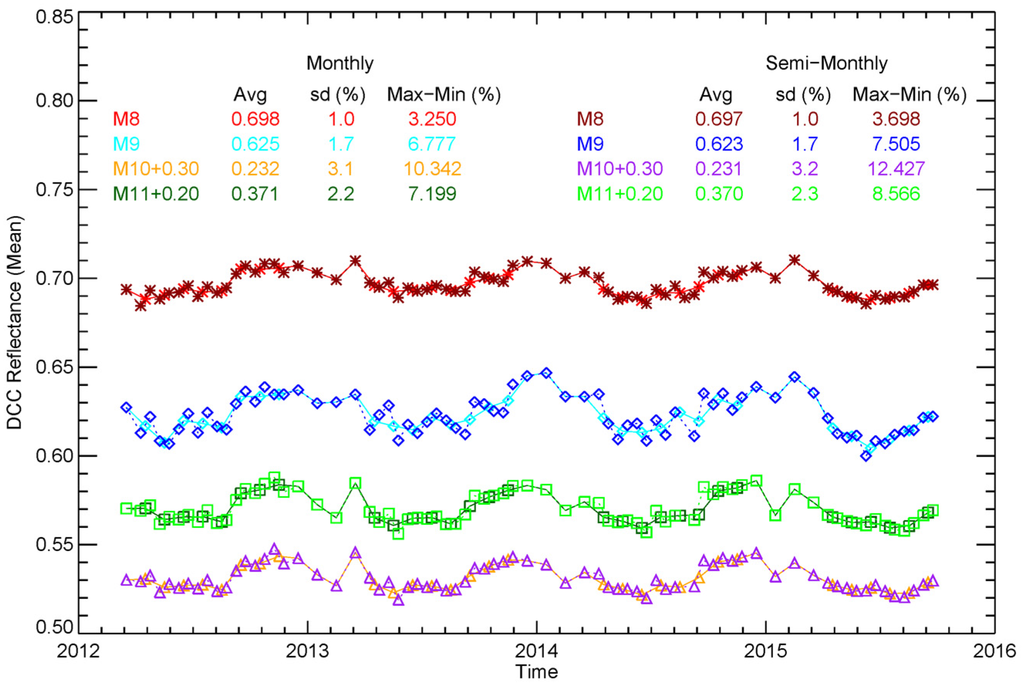
Figure 12.
Comparison of monthly and semi-monthly DCC mean time series for SWIR bands M8-M11 (monthly DCC TOA reflectance mean time series were used).
The stabilities of bands M8 to M11 DCC mean time series (see Figure 11) are ~1.0%, 1.7%, 3.1%, and 2.2%, respectively, much larger than those for VIS/NIR M-bands (see Figure 3). The ranges of SWIR bands DCC mean time series are also larger, ranging from 3.3% to 10.3%. However, no obvious degradation (trend) can be observed in all SWIR bands DCC time series. Uprety and Cao [10] also indicated that there are no significant trends in bands M8 and M11 normalized BRDF time series over deserts; however, a trend is observed in their band M10 time series. The DCC statistics for M8 (1.238 µm) are consistent with the natural DCC temporal variability derived from MODIS band B5 (1.24 µm) [17], indicating the calibration of M8 is likely to be stable. VIIRS band M9 (1.375 µm) has slightly larger variations than band M8, but still comparable with the natural variability derived from its MODIS counterpart (B26, 1.37 µm). The RSR of band M9 lies in a water absorption region. Though atmosphere absorption is generally negligible over DCCs, water vapor absorption may have a larger impact on M9 DCC reflectance. The standard deviation of band M11 is ~2.2%, slightly higher than the 1.8% natural DCC temporal visibility observed by MODIS band B6 (2.12 µm). The standard deviation of VIIRS M10 (1.602 µm) is the highest (3.1%) among all SWIR bands. The stabilities of the NOAA operational version M10 and M11 derived from this study are slightly worse than those for the NASA Land PEATE version [20], however, the later covers a shorter time period compared to this study.
4.4. Calibration Stability for RSB I-Bands
Monthly DCC time series for RSB I-bands (I1–I3) are presented in Figure 13 (January 2014–September 2015). The central wavelengths of I1–I3 are comparable to those for M5, M7, and M10, respectively (see Figure 1). DCC time series for the equivalent M-bands are also plotted in the background for comparison purpose. Moreover, DCC mode time series (with ADM-adjustment) were used for the VIS/NIR bands I1 (M5) and I2 (M7); while DCC mean time series (without ADM-adjustment) were used for the SWIR band I3 (M10). Statistics of RSB I-bands DCC mode and mean time series are available in Table 2 and Table 3. It can be observed that I-bands DCC time series follow closely their equivalent M-bands. The nearly constant DCC reflectance difference between M5 and I1 is due to RSR differences between the two bands.
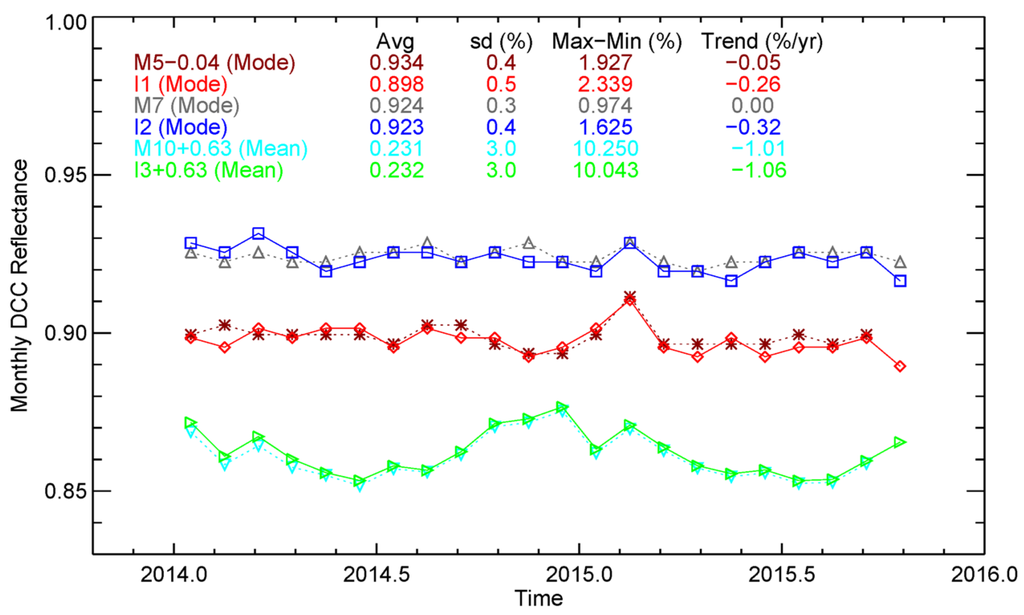
Figure 13.
Monthly DCC time series for bands I1–I3 and their equivalent M-bands (ADM-adjusted monthly DCC reflectance mode time series were used for I1,I2, M5, and M7; monthly DCC TOA reflectance mean time series were used for I3 and M10).
Figure 14 compares the I1/M5, I2/M7, and I3/M10 DCC mean ratio time series and the band ratio time series over 4 desert sites, including Libyan4, Egypt3, Sonoran Desert, and Mali1 [28,29]. The vertical line in each panel marks the 1 May 2014 C0 = 0 calibration change. This calibration change has little impact on I1 and M5. I1/M5 band ratio time series show the two bands are relatively stable to each other, though the absolute TOA reflectance over deserts and DCCs are different. I2/M7 also generally agree with each other based on DCC mean ratio time series, consistent with desert sites band ratio time series and results from granule level bands I2 and M7 radiance measurements comparisons [23]. The C0 = 0 calibration change is clearly observable in band I2/M7 DCC and desert band ratio time series. The calibration change can also be observed in I3/M10 validation sites and DCC band ratio time series. Compared to I2 and M7, I3 and M10 have a slightly larger RSR difference. Before the calibration change, I3 and M10 differ by ~2% over deserts and ~1% over DCCs. The difference between the two bands is significantly reduced after the 1 May 2014, calibration change. Results from this study are potentially useful for JPSS program, which is currently investigating the feasibility of replacing band M10 with a water vapor band for VIIRS onboard the future JPSS satellites to support column water vapor retrieval.
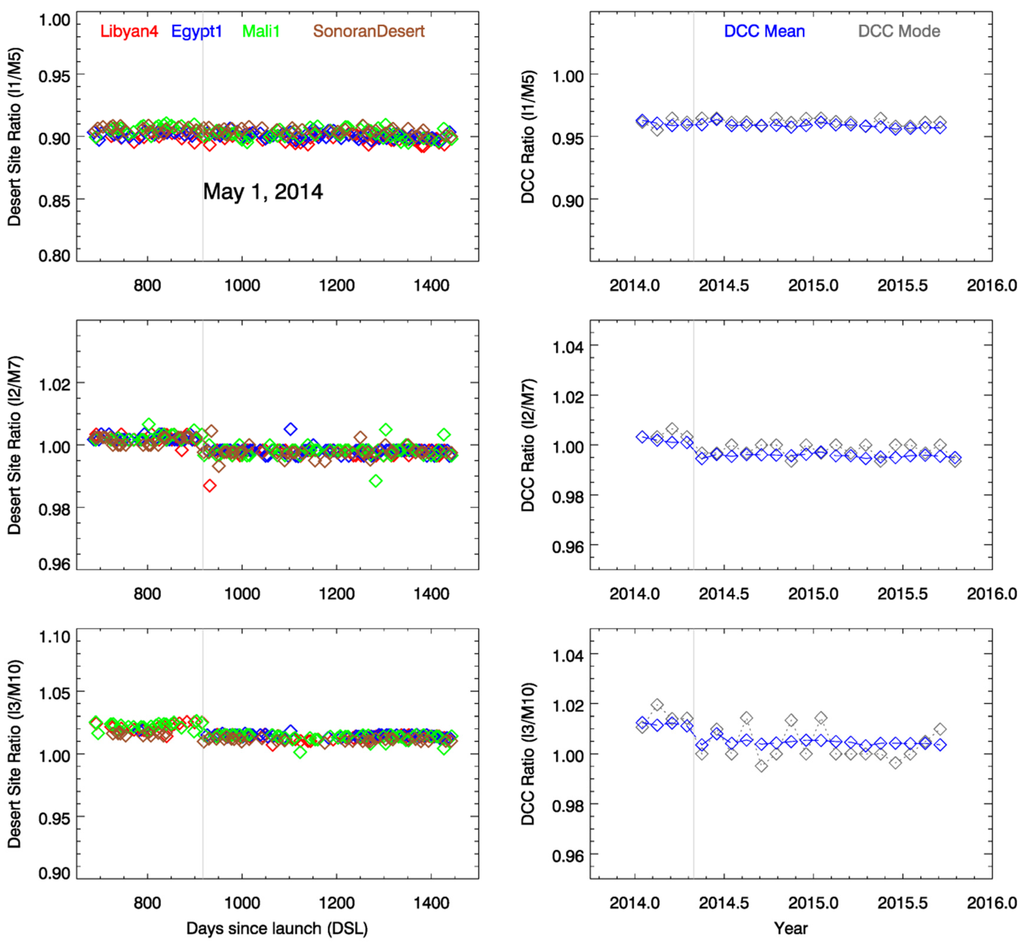
Figure 14.
Comparison of DCC mean band ratio and validation site band ratio time series for I1/M5, I2/M7 and M10/I3. The vertical lines in the plots mark 1 May 2015.
5. Summary and Conclusions
The NOAA operational VIIRS RSBs and DNB calibration stability using the DCC technique is demonstrated in this study. Monthly DCC time series for bands M1–M5, M7–M11, DNB, I1-I3 were developed and extensively analyzed. The mode of monthly DCC reflectance (after ADM-adjustment) was used for calibration stability monitoring for the VIS/NIR bands and DNB. Our results show that the NOAA operational radiometric calibration for bands M5 and M7 are generally stable, with stabilities of 0.4% and ranges less than 1.9% during the entire time period. The stabilities of bands M1–M4 are 0.6%–0.8%, with ranges of 3.0%–4.5%. Large fluctuations in bands M1-M4 monthly DCC reflectance were observed since early 2014, correlated with F-factor trend changes during this period. DNB is stable since May 2013 (after the RSR update), similar to bands M5 and M7. The calibration stability of DNB is 0.5% from May 2014 to September 2015. The mean of monthly DCC TOA reflectance (without ADM adjustment) was used for the SWIR bands calibration stabiwality monitoring. The calibration stabilities for M8–M11 are from 1.0% to 3.1%, similar to the natural DCC temporal variability at the SWIR spectrum. The calibration stabilities of I1-I3 are very close to those of their spectral equivalent M-bands (M5, M7, and M10).
VIIRS RSBs inter-channel relative calibration stability was analyzed using DCC mean band ratio time series. I1/M5, I2/M7, and I3/M10 bands ratio time series show consistent calibrations for the 3 band pairs from January 2014 to September 2015. The May 2014 C0 = 0 calibration change is clearly observable in the I2/M7 and I3/M10 band ratio time series. Band ratio time series reveal relative calibration changes for M1/M4 and M5/M7, which may have negative impacts on long-term trend analyses for ocean color and vegetation EDRs if the calibration changes are not accounted for.
The DCC time series were also compared with the IDPS F-factor time series, VIIRS validation site time series, and the VIIRS-MODIS SNO-x time series. Comparison results further support that the DCC time series are capable of detecting sub-percent calibration changes in VIIRS VIS/NIR RSB and DNB bands. Semi-monthly DCC time series were also developed and our results show the monthly and semi-monthly DCC time series generally agree with each other. The semi-monthly time series are slightly noisier than the monthly time series, especially for bands M1–M4, in which large F-factor and DCC reflectance fluctuations exist but the DCC reflectance are known to be more invariant. Our results indicate that semi-monthly DCC time series are useful for stability monitoring at higher temporal resolution. The VIIRS DCC time series developed in this study may contribute to the EDR long-term trend studies and the future SNPP VIIRS SDR reprocessing. The monthly DCC time series used in this study are updated each month and available online [29].
Acknowledgments
This work is funded by the JPSS program office. The authors thank Slawomir Blonski for providing IDPS F-factor time series and Sirish Uprety for providing VIIRS-MODIS SNO-x time series. The authors would also like to thank GSICS vis/nir sub-group for kindly providing the Hu et al, (2004) Angular Distribution Model. The manuscript contents are solely the opinions of the authors and do not constitute a statement of policy, decision, or position on behalf of NOAA or the U.S. government.
Author Contributions
Wenhui Wang designed the study, developed methodology and software code, performed the analysis and wrote the manuscript. Changyong Cao contributed to the design of the study and provided technical oversight of the project.
Conflicts of Interest
The authors declare no conflict of interest.
References
- Cao, C.; de Luccia, F.J.; Xiong, X.; Wolfe, R.; Weng, F. Early on-orbit performance of the Visible Infrared Imaging Radiometer Suite onboard the Suomi National Polar-Orbiting Partnership (S-NPP) satellite. IEEE Trans. Geosci. Remote Sens. 2014, 52, 1142–1156. [Google Scholar] [CrossRef]
- Cao, C.; Xiong, J.; Blonski, S.; Liu, Q.; Uprety, S.; Shao, X.; Bai, Y.; Weng, F. Suomi NPP VIIRS sensor data record verification, validation, and long-term performance monitoring. J. Geophys. Res. Atmos. 2013. [Google Scholar] [CrossRef]
- Cardema, J.C.; Rausch, K.W.; Lei, N.; Moyer, D.I.; de Luccia, F.J. Operational calibration of VIIRS reflective solar band sensor data records. Proc. SPIE 2012, 8510. [Google Scholar]
- Moy, G.; Rausch, K.; Haas, E.; Wilkinson, T.; Cardema, J.; de Luccia, F. Mission history of reflective solar band calibration performance of VIIRS. Proc. SPIE 2015, 9607. [Google Scholar]
- Liao, L.B.; Weiss, S.; Mills, S.; Hauss, B. Suomi NPP VIIRS day-night band on-orbit performance. J. Geophys. Res. Atmos. 2013, 118. [Google Scholar] [CrossRef]
- Chen, X.; Nordhaus, W. A test of the new VIIRS lights data set: Population and economic output in Africa. Remote Sens. 2015, 7, 4937. [Google Scholar] [CrossRef]
- Shi, K.; Yu, B.; Huang, Y.; Hu, Y.; Yin, B.; Chen, Z.; Chen, L.; Wu, J. Evaluating the ability of NPP-VIIRS nighttime light data to estimate the gross domestic product and the electric power consumption of China at multiple scales: A comparison with DMSP-OLS data. Remote Sens. 2014, 6, 1705. [Google Scholar] [CrossRef]
- Johnson, R.S.; Zhang, J.; Hyer, E.J.; Miller, S.D.; Reid, J.S. Preliminary investigations toward nighttime aerosol optical depth retrievals from the VIIRS Day/Night Band. Atmos. Meas. Technol. 2013, 6, 1245–1255. [Google Scholar] [CrossRef]
- Uprety, S.; Cao, C.; Xiong, X.; Blonski, S.; Wu, A.; Shao, X. Radiometric inter-comparison between Suomi NPP VIIRS and Aqua MODIS reflective solar bands using simultaneous nadir overpass in the low latitudes. J. Atmos. Ocean. Technol. 2013, 30, 2720–2736. [Google Scholar] [CrossRef]
- Uprety, S.; Cao, C. Suomi NPP VIIRS reflective solar band on-orbit radiometric stability and accuracy assessment using desert and Antarctica Dome C sites. Remote Sens. Environ. 2015, 166, 106–115. [Google Scholar] [CrossRef]
- Wang, W.; Cao, C. Assessing the VIIRS RSB calibration stability using deep convective clouds. Proc. SPIE 2014, 9264. [Google Scholar]
- Ma, S.; Yan, W.; Huang, Y.-X.; Ai, W.-H.; Zhao, X. Vicarious calibration of S-NPP/VIIRS day-night band using deep convective clouds. Remote Sens. Environ. 2015, 158, 42–55. [Google Scholar] [CrossRef]
- Cao, C.; Bai, Y. Quantitative analysis of VIIRS DNB nightlight point source for light power estimation and stability monitoring. Remote Sens. 2014, 6, 11915–11935. [Google Scholar] [CrossRef]
- Wang, W.; Cao, C. DCC radiometric sensitivity to spatial resolution, cluster size, and LWIR calibration bias sased on VIIRS observations. J. Atmos. Ocean. Technol. 2015, 32, 48–60. [Google Scholar] [CrossRef]
- Hu, Y.; Wielicki, B.A.; Ping, Y.; Stackhouse, P.W., Jr.; Lin, B.; Young, D.F. Application of deep convective cloud albedo observation to satellite-based study of the terrestrial atmosphere: Monitoring the stability of spaceborne measurements and assessing absorption anomaly. IEEE Trans. Geosci. Remote Sens. 2004, 42, 2594–2599. [Google Scholar]
- Doelling, D.R.; Minnis, P.; Nguyen, L. On the use of deep convective clouds to calibrate AVHRR data. In Proceedings of the International Symposium on Optical Science and Technology SPIE 49th Annual Meeting, Denver, CO, USA, 2–6 August 2004.
- Doelling, D.R.; Morstad, D.; Scarino, B.R.; Bhatt, R.; Gopalan, A. The characterization of deep convective clouds as an invariant calibration target and as a visible calibration technique. IEEE Trans. Geosci. Remote Sens. 2013, 51, 1147–1159. [Google Scholar] [CrossRef]
- Minnis, P.; Doelling, D.R.; Nguyen, L.; Miller, W.F.; Chakrapani, V. Assessment of the visible channel calibrations of the VIRS on TRMM and MODIS on Aqua and Terra. J. Atmos. Ocean. Technol. 2008, 25, 385–400. [Google Scholar] [CrossRef]
- Fougnie, B.; Bach, R. Monitoring of radiometric sensitivity changes of space sensors using deep convective clouds: Operational application to PARASOL. IEEE Trans. Geosci. Remote Sens. 2009, 47, 851–861. [Google Scholar] [CrossRef]
- Bhatt, R.; Doelling, D.; Wu, A.; Xiong, X.; Scarino, B.; Haney, C.; Gopalan, A. Initial stability assessment of S-NPP VIIRS reflective solar band calibration using invariant desert and deep convective cloud targets. Remote Sens. 2014, 6, 2809. [Google Scholar] [CrossRef]
- Aumann, H.H.; Pagano, T.; Hofstadter, M. Observations of deep convective clouds as stable reflected light standard for climate research: AIRS evaluation. SPIE 2007, 6684. [Google Scholar]
- Loeb, N.G.; Kato, S.; Loukachine, K.; Manalo-Smith, N. Angular distribution models for top-of-atmosphere radiative flux estimation from the Clouds and the Earth’s Radiant Energy System instrument on the Terra satellite part I: Methodology. J. Atmos. Ocean. Technol. 2005, 22, 338–351. [Google Scholar] [CrossRef]
- Blonski, S.; Cao, C.; Shao, X.; Uprety, S. VIIRS reflective solar bands calibration changes and potential impacts on ocean color applications. Proc. SPIE 2014, 9111. [Google Scholar]
- Fulbright, J.P.; Lei, N.; McIntire, J.; Efremova, B.; Chen, X.; Xiong, X. Improving the characterization and performance of the Suomi-NPP VIIRS solar diffuser stability monitor. Proc. SPIE 2013, 8866. [Google Scholar]
- Wang, M.; Liu, X.; Tan, L.; Jiang, L.; Son, S.; Shi, W.; Rausch, K.; Voss, K. Impacts of VIIRS SDR performance on ocean color products. J. Geophys. Res. Atmos. 2013, 118, 10347–10360. [Google Scholar] [CrossRef]
- Lei, N.; Wang, Z.; Guenther, B.; Xiong, X.; Gleason, J. Modeling the detector radiometric response gains of the Suomi NPP VIIRS reflective solar bands. Proc. SPIE 2012, 8533. [Google Scholar]
- Minnis, P.; Hong, G.; Ayers, J.K.; Smith, W.L.; Yost, C.R.; Heymsfield, A.J.; Heymsfield, G.M.; Hlavka, D.L.; King, M.D.; Korn, E.; et al. Simulations of infrared radiances over a deep convective cloud system observed during TC4: Potential for enhancing nocturnal ice cloud retrievals. Remote Sens. 2012, 4, 3022. [Google Scholar] [CrossRef]
- Wang, W.; Cao, C.; Uprety, S.; Bai, Y.; Padula, F.; Shao, X. Developing an automated global validation site time series system for VIIRS. Proc. SPIE 2014, 9218. [Google Scholar]
- SNPP VIIRS Validation Site Time Series. Available online: http://ncc.nesdis.noaa.gov/VIIRS/VSTS.php (accessed on 30 October 2015).
© 2016 by the authors; licensee MDPI, Basel, Switzerland. This article is an open access article distributed under the terms and conditions of the Creative Commons by Attribution (CC-BY) license (http://creativecommons.org/licenses/by/4.0/).