Abstract
The paper investigates the value of using distinct vegetation indices to quantify and characterize agricultural crop characteristics at different growth stages. Research was conducted on four crops (corn, soybean, wheat, and canola) over eight years grown under different tillage practices and nitrogen management practices that varied rate and timing. Six different vegetation indices were found most useful, depending on crop phenology and management practices: (a) simple ratio for biomass, (b) NDVI for intercepted PAR, (c) SAVI for early stages of LAI, (d) EVI for later stages of LAI, (e) CIgreen for leaf chlorophyll, (f) NPCI for chlorophyll during later stages, and (g) PSRI to quantify plant senescence. There were differences among varieties of corn and soybean for the vegetation indices during the growing season and these differences were a function of growth stage and vegetative index. These results clearly imply the need to use multiple vegetation indices to best capture agricultural crop characteristics.
1. Introduction
Remote sensing of agricultural canopies has provided valuable insights into various agronomic parameters. The advantage of remote sensing methods is the ability to provide repeated measures from a field without destructive sampling of the crop, which can provide valuable information for precision agriculture applications. Assessment of the impact of agriculture decisions could be enhanced through the use of field-scale monitoring to help evaluate the changes that have occurred within fields as a result of applied practices or to help guide the decisions that translate into differential applications that affect plant growth. There continue to be advances in the use of remote sensing methods because of the introduction of narrow band or hyperspectral sensors and increased spatial resolution of aircraft or satellite mounted sensors. One of the remaining challenges is to evaluate the seasonal patterns in the various indices that are typically used for agronomic evaluations.
Vegetative indices (VIs) have been developed as the combination of various wavebands and related to various canopy parameters. These have been summarized in [1,2]. The purpose of VIs is to enhance the vegetation signal while minimizing the solar irradiance and soil background effects [3]. The first VI was the near-infrared (NIR)/Red ratio proposed by [4] who related this index to leaf area index (LAI). The normalized vegetative difference index (NDVI) defined as the ratio of (RNIR – RRED)/(RNIR + RRED) proposed by [5] as an estimator of LAI in canopies is one of the most used VIs. More recent studies have shown that NDVI is a better estimator of light interception by canopies since the NDVI values saturate during the season [6,7,8].
Soil background has presented a problem in the application of VIs and to adjust for soil background a soil-adjusted vegetative index (SAVI) was described by [9] as SAVI = (RNIR − Rred)(1 + L)/(RNIR + Rred + L), where L is an adjustment parameter and typically 0.5. This index was further refined to derive an enhanced vegetative index (EVI) as EVI = 2.5(RNIR − Rred)/(RNIR + 6Rred − 7.5Rblue + 1) which added reflectance in the blue region of the spectrum to help differentiate soil from vegetation at low amounts of ground cover [3]. Both of these indices were developed to help remove soil background problems with reflectance data.
Assessment of the chlorophyll content of crop canopies has included the normalized pigment chlorophyll ratio index (NPCI) defined as (red660 − blue460)/(red660 + blue460) [10]. The form of this index is similar to the NDVI. Other chlorophyll indices include the CIgreen = (RNIR/Rgreen) − 1 and CIred edge = (RNIR/Rred edge) – 1 proposed by [11,12]. Another index introduced by [13] is the plant senescence reflectance index (PSRI) defined as (red660 − green510) / NIR760. This index was proposed as being sensitive to the senescence phase of plant development. The pigment specific normalized difference vegetation index has been proposed as another method to estimate LAI [14].
Remote sensing of plant canopies has utilized these indices to assess various plant parameters, e.g., leaf area, ground cover, biomass, leaf chlorophyll content, residue cover. These relationships have been summarized in [1,2,15]. Time series analyses of different VIs in relation to cotton (Gossypium hirsutum L.) yield have been conducted by [15] and they found the modified chlorophyll reflectance index (MCARI) provided the most sensitive indicator of cotton yield at the late preharvest stage where other indices, renormalized difference vegetative index (RDVI), modified triangular vegetation index (MTVI), and optimized soil-adjusted vegetation index (OSAVI) showed the best relationship to within field differences and yield at the early growth stages. The MCARI defined as [(R700 − R670) − 0.2 × (R700 − R550)] × (R700/R670) as defined by [16]. The RDVI is computed as RDVI = (R800 − R670)/(R800 + R670)1/2 as developed by [17]. The MTVI was developed by [13] and the OSAVI by [13]. These various indices require wavelengths that may not be available with some of the current sensors because of the requirement for wavelengths above 0.8 µm in the equations. Studies to compare the temporal changes in these indices and their variability within fields are critical to evaluate field-scale variation. There have been a series of recent applications of various indices for use in assessing nitrogen (N) management with infrared aerial photography in wheat (Triticum aestivum L) [18], NDVI for corn (Zea mays L.) [19], and single wavelength of 0.735 µm in rice (Oryza sativa L.) [20]. To fully utilize this type of approach there is a need for a strip containing a high rate of N fertilizer within the field to serve as a calibration point. There have been approaches that have used the green normalized vegetative difference index (GNDVI), expressed as (RNIR − RGREEN)/(RNIR + RGREEN), during the midgrain filling period in corn to estimate the spatial variation of grain yield within fields [21]. They suggested that this approach could be used to map yield variation across fields and potentially replace combine yield monitors. Assessment of crop phenology during the growing season has been assessed using a comparison of the NDVI with a visible atmospherically resistant index expressed either as VARIGREEN = (RGREEN − RRED)/(RGREEN + RRED − RBLUE) or VARIRED EDGE = (RRED EDGE − 1.7 × RRED + 0.7 × RBLUE)/(RRED EDGE + 2.3 × RRED − 1.3 × RBLUE) [22]. These studies showed that the VARI indices showed a linear relationship to green vegetation fraction than NDVI and was more sensitive to the onset of senescence than NDVI [22]. The different indices that have been applied to agronomic assessment have been summarized in [2].
Evaluation of agricultural decisions can be constructed around utilizing the spatial and temporal variation within fields. Remote sensing through the various VIs can provide important information to enhance field-scale assessment of different agronomic parameters. Although these indices have been developed there have been limited efforts to evaluate their temporal trends to determine the limits of effectiveness or any precautions in their application to field-scale assessments. This study was designed to evaluate the temporal patterns of reflectance and different VIs observed over multiple crops and to compare the differences among VIs.
1.1. Materials and Methods
Observations of various agronomic studies have been collected since 2000 with ground-based radiometers. These have included the Exotech [29] with four wavebands (0.455–0.514, 0.528–0.597, 0.629–0.689, and 0.778–0.893 μm) and the CropScan [29] radiometer with eight wavelengths (0.46, 0.51, 0.56, 0.61, 0.66, 0.71, 0.76, and 0.81 μm). Data collection using these instruments followed the same procedure throughout the experiments. Observation times were constrained to sun angles greater than 45° or between 1,000 and 1,400 CST on clear days or when there was a minimal amount of cirrus clouds. The Exotech instrument was mounted on a tractor-mounted boom to obtain a height of 2 m above the canopy. The CropScan unit was mounted on a pole to position the instrument at a minimum of 2 m above the surface. This allowed for a pixel size of 1.5 m over the surface. Reflectance readings were collected from in the same location in each treatment by marking an area for the measurements with flags that were located with a GPS unit so the exact location could be established in each treatment. Five observation sites were established in each treatment to obtain a within treatment variance of the VIs and within each sample location 30 individual scans were collected with the unit held in a fixed position and automatically stored as an average in the sensor. This was done to ensure that the readings represented an average over a short period of time rather than a single observation. Each replicate within a treatment was the average of 150 individual reflectance values and presented as a single value for each replicate. Prior to and immediately after the observations, reflectance readings were collected with the unit in the dark and over a reflectance panel. The dark readings were subtracted from the observations and the reflectance panel was used to evaluate the reflectance values for each waveband. A similar number of readings was collected over the reflectance panel to ensure stability in the values observed. Vegetative indices were computed from these wavelengths and for this study are shown in Table 1.

Table 1.
Vegetative indices evaluated in this study and the crop parameter proposed by the original study.
| Index | Wavebands | Application | References |
|---|---|---|---|
| Ratio | RNIR/Rred | Biomass, LAI, cover | 4 |
| Normalized Difference Vegetative Indices | |||
| Red NDVI | (RNIR − Rred)/(RNIR + Rred) | LAI, Intercepted PAR | 5 |
| Green NDVI | (RNIR − Rgreen)/(RNIR + Rgreen) | LAI, Intercepted PAR | 11 |
| Red Edge NDVI | (RNIR − Rred edge)/(RNIR + Rred edge) | LAI, Intercepted PAR | 11 |
| Soil Adjusted Vegetation Index | |||
| SAVI | (RNIR − Rred)(1 + L)/(RNIR + Rred + L) | LAI | 9 |
| Enhanced Vegetation Index | |||
| EVI | 2.5(RNIR − Rred)/(RNIR + 6Rred – 7.5Rblue + 1) | LAI | 3 |
| Normalized Pigment Chlorophyll Ratio Index | |||
| NPCI | (Red660 − Blue460)/(Red660 + Blue460) | Leaf chlorophyll | 10 |
| Chlorophyll Indices | |||
| CIgreen | (RNIR/Rgreen) − 1 | Leaf chlorophyll | 11,12 |
| CIred edge | (RNIR/Rred edge) − 1 | Leaf chlorophyll | 11,12 |
| Plant Senescence Reflectance Index | |||
| PSRI | (Red660 − Green510)/NIR760 | Plant senescence | 20 |
A series of experiments was conducted from 2000 through 2007 and involved different tillage systems, fall-chisel plow, fall strip, and spring strip tillage, on corn (Zea mays L.) and soybean (Glycine max (L.) Merr.). These experiments included multiple corn hybrids and soybean varieties to determine the differences among genetic material in their reflectance values. The hybrids used in the corn experiment were Asgrow RX634YG, Asgrow RX730RR/YG, HSX1120, Pioneer 34B23, Pioneer 35P17, Pioneer 33P67, Pioneer 34M93, and Pioneer 34B24. Soybean varieties included Agrow A2553, Asgrow AG2703, Asgrow A2869, Asgrow AG2905, Asgrow AG2801, Dekalb DK26-52, Midwest G2380, Pioneer 92M70, Stine S2342-4, Stine S2302-4, and Stine S2116-4. These hybrids and varieties were selected based on their use in central Iowa and not to the inclusion of other genetic materials. Each treatment was replicated three times and plot sizes were 27 m × 50 m. Row direction was north-south in all years. Within the tillage treatments there was a difference in N rate applied that ranged from 135 kg N ha−1 to 190 kg N ha−1. Nitrogen was applied either in the fall with the fall chisel system or in the spring as a combination of starter and sidedress application in the strip tillage system.
Observations were also collected over canola (Brassica juncea var. juncea) and this crop was grown with planting in the spring and harvest in mid-summer each year. An additional crop in these observations was wheat that was planted in the fall, harvested in the early summer and then replanted to soybean as part of a double crop experiment.
All of the plot areas were located on Clarion loam (Fine-loamy, mixed, mesic, Typic Hapludolls), Canisteo clay loam (Fine-loamy, mixed (calcareous), mesic, Typic Haplaquolls), and Storden loam (Fine-loamy, mixed (calcareous), mesic Urdorthents) soils. Plot areas were located over the field and covered different soils within the treatment area. All sampling locations were located with GPS equipment to link the reflectance observations with soil types within the field. Additional observations made within each treatment included leaf chlorophyll readings, crop yield, crop phenology, and residue cover after harvest.
These studies were designed as randomized complete block experiments in which tillage systems were blocks. Analysis of the means and standard deviations for each VI and analysis of variance for the VIs was made with ANOVA and GLM procedures using SAS packages [23].
2. Results and Discussion
Seasonal Changes in Reflectance
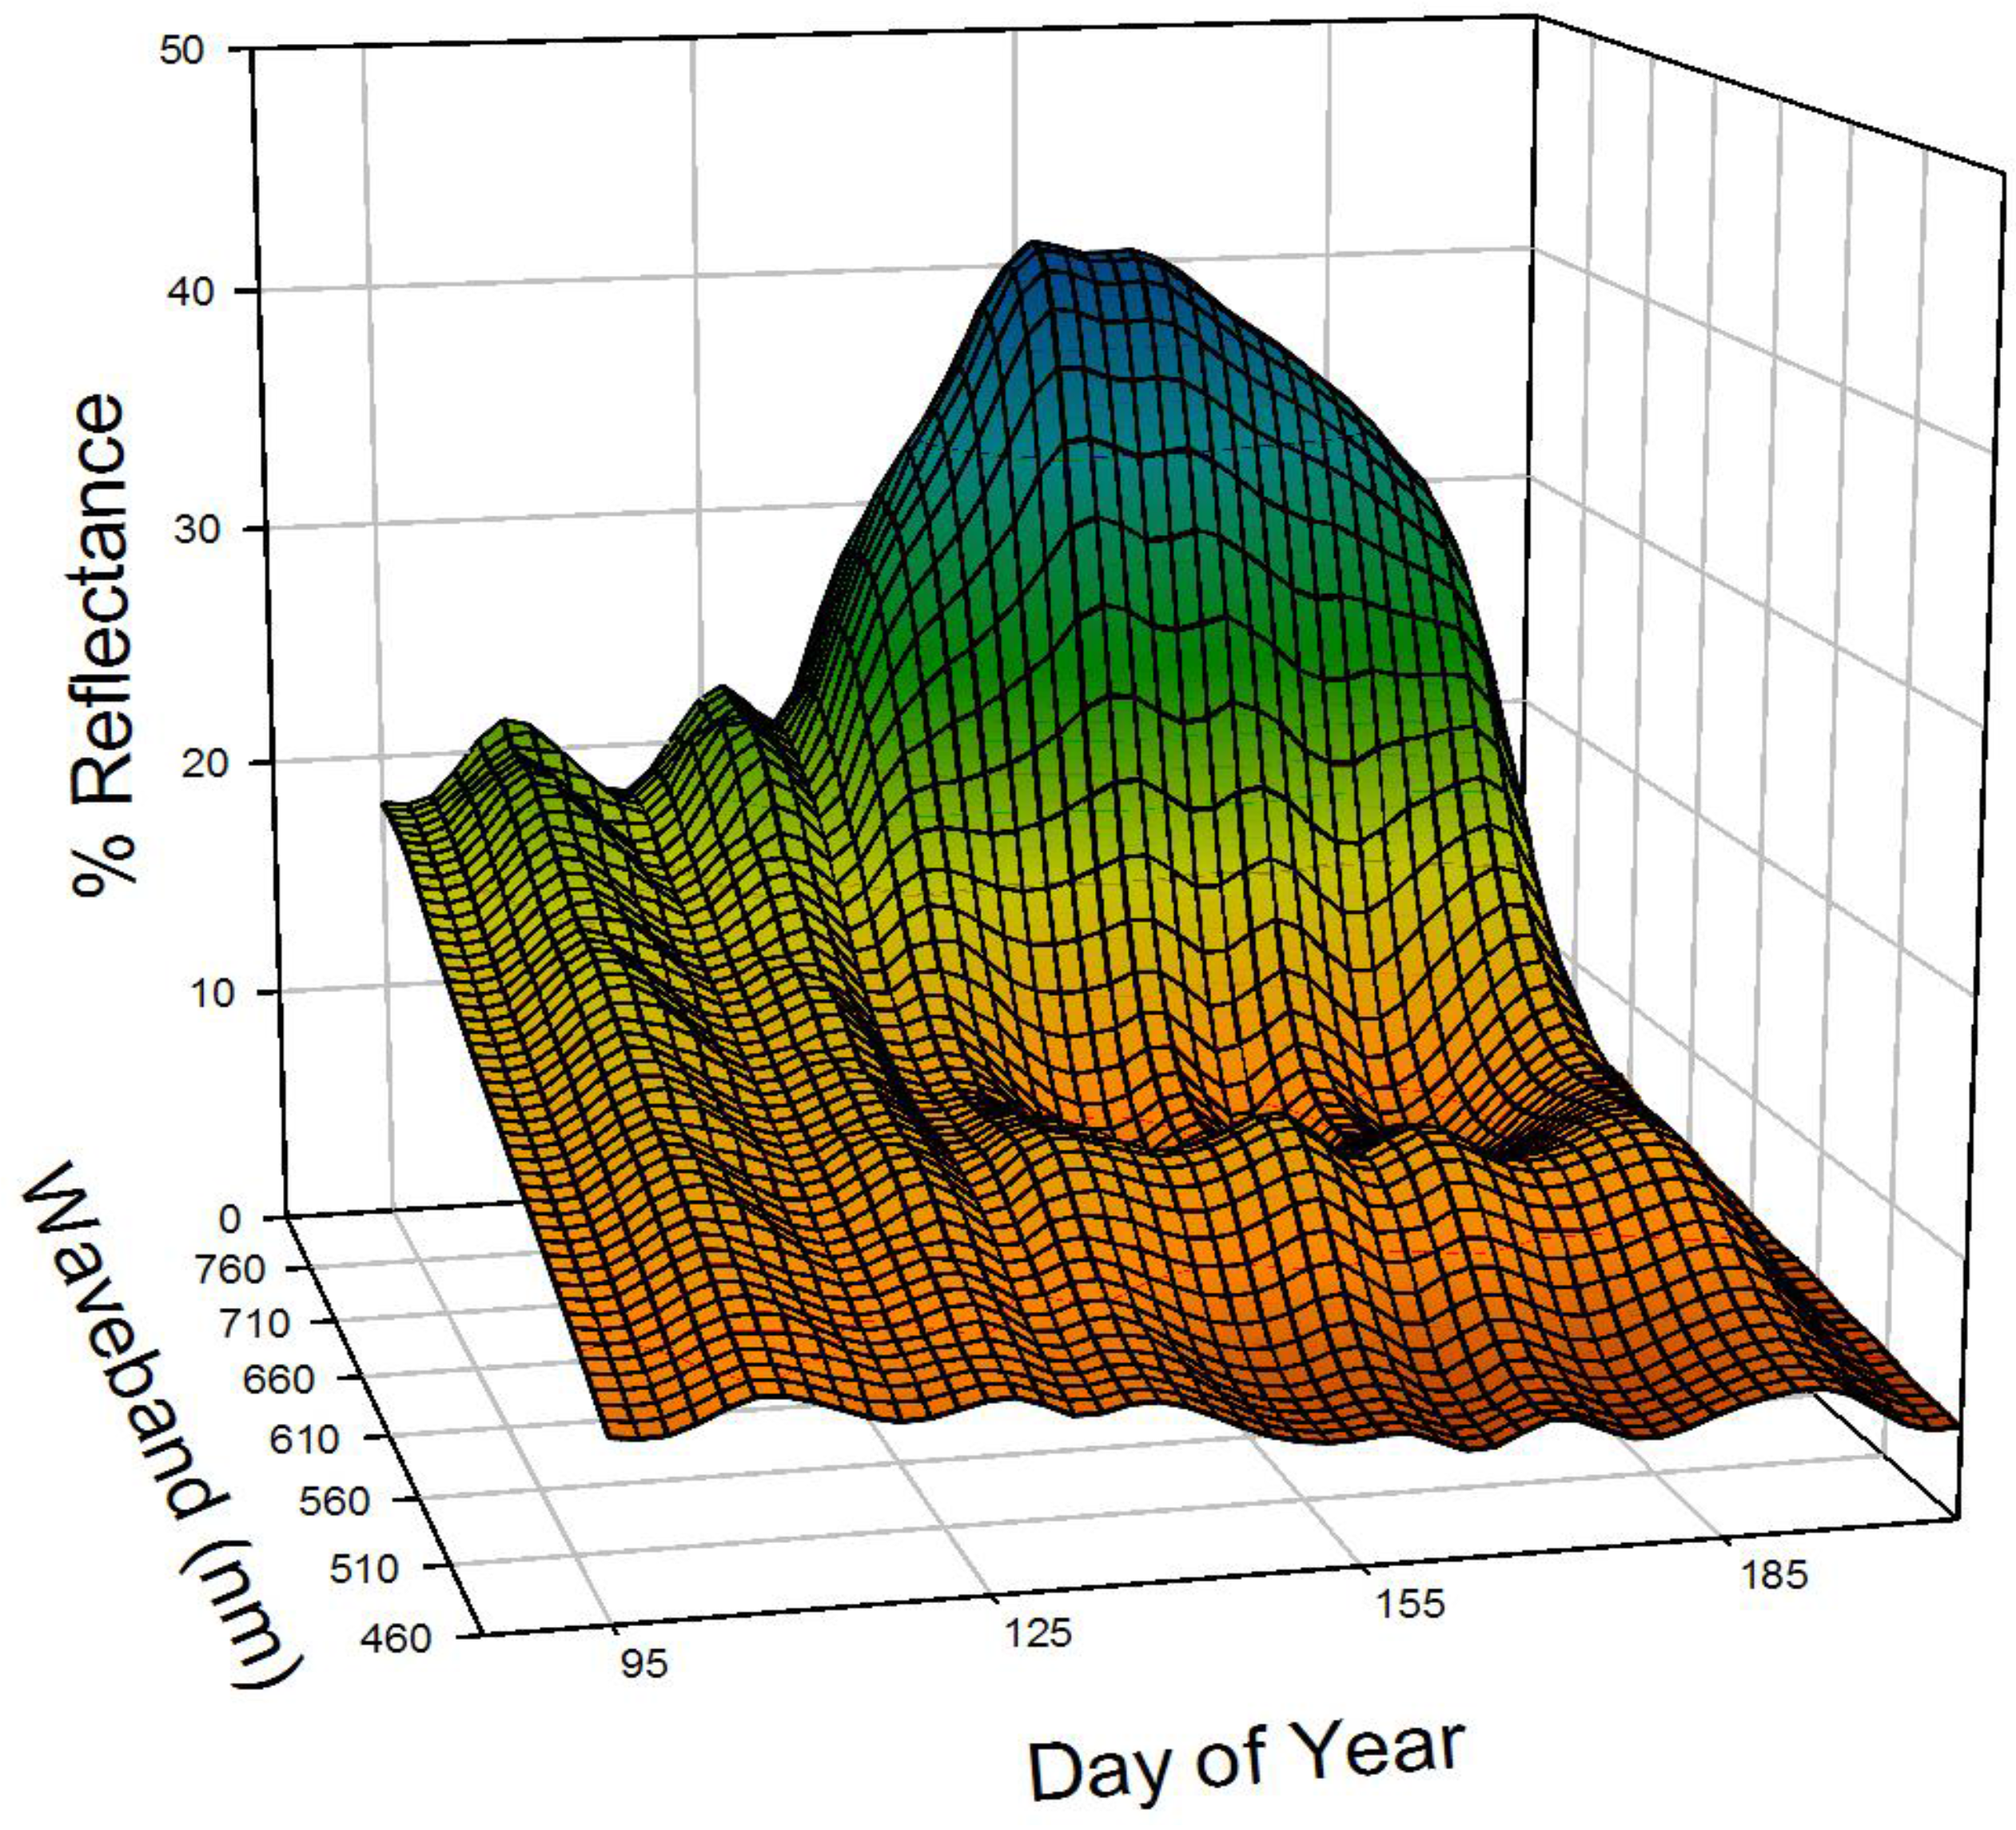
Reflectance patterns throughout the growing season reveal a large amount of information about the changes in the visible and near-infrared (NIR) wavelengths. Understanding these patterns is critical to the interpretation of the seasonal patterns in VIs. These wavelengths are used in various VIs; however, it is important to examine their changes throughout the year and especially during the growing season. There are general trends in changes within a crop and also differences among crops. There are similar features in terms of the general response of the blue, red, and green wavelengths during the growing season and the near-infrared increasing and the following reflectance patterns are typical of the different crops throughout each year. Throughout the complete year from harvest of the preceding crop until after harvest of the next crop there were changes over the fall and winter period; however, these affected the bare soil reflectance values. An example of the changes in the reflectance values for corn throughout the growing season is shown in Figure 1. There is a rapid increase in the NIR values as soon as the crop begins to develop while the changes in the visible wavebands change more slowly and throughout the growing season the NIR wavelengths are more dynamic than the visible wavelengths (Figure 1). This is due in part the reflectance values for bare soil being closer to the visible reflectances than NIR values (Figure 1). The bare soil line remained fairly constant across wavelengths throughout the non-growing season period and changes from day to day were affected more by soil water content and disturbance of the soil surface with tillage which in turn affects the distribution of the crop residue or the roughness of the soil surface (Figure 2). An interesting feature in the corn reflectance values during the growing season is the increase the NIR values when tassels emerge at the upper canopy. Changes in the major phenological stages and agronomic practices for the corn crop are shown in Figure 3. The sharp change in the visible and NIR patterns during the growing season create the changes that make the VIs a valuable assessment tool for detection of crop changes,
A cropping sequence of wheat followed by soybean within the same growing season reveals the dynamics of the vegetation development of these two crops (Figure 4). A unique feature in these patterns was found with a increase in reflectance observed in the seasonal trends from Day of Year (DOY) 180 until 200 created by the presence of weeds within the soybean crop that was removed through herbicide application. The reflectance values were similar to wheat and soybean in terms of the visible and NIR wavelengths but occurred very quickly in development and then disappeared after the weeds were removed. These patterns were similar to corn with very stable red and green reflectance compared to the change in NIR wavelengths. There was a noticeable and significant decline in the NIR reflectance over the wheat canopy following the presence of the panicles at the top of the canopy. In wheat, these morphological structures reduce the NIR reflectance values compared to the leaves of the canopy (Figure 4). As the soybean crop began to develop the same pattern in reflectance change appeared with reflectances in the visible wavelengths decreasing and the NIR increasing (Figure 4).
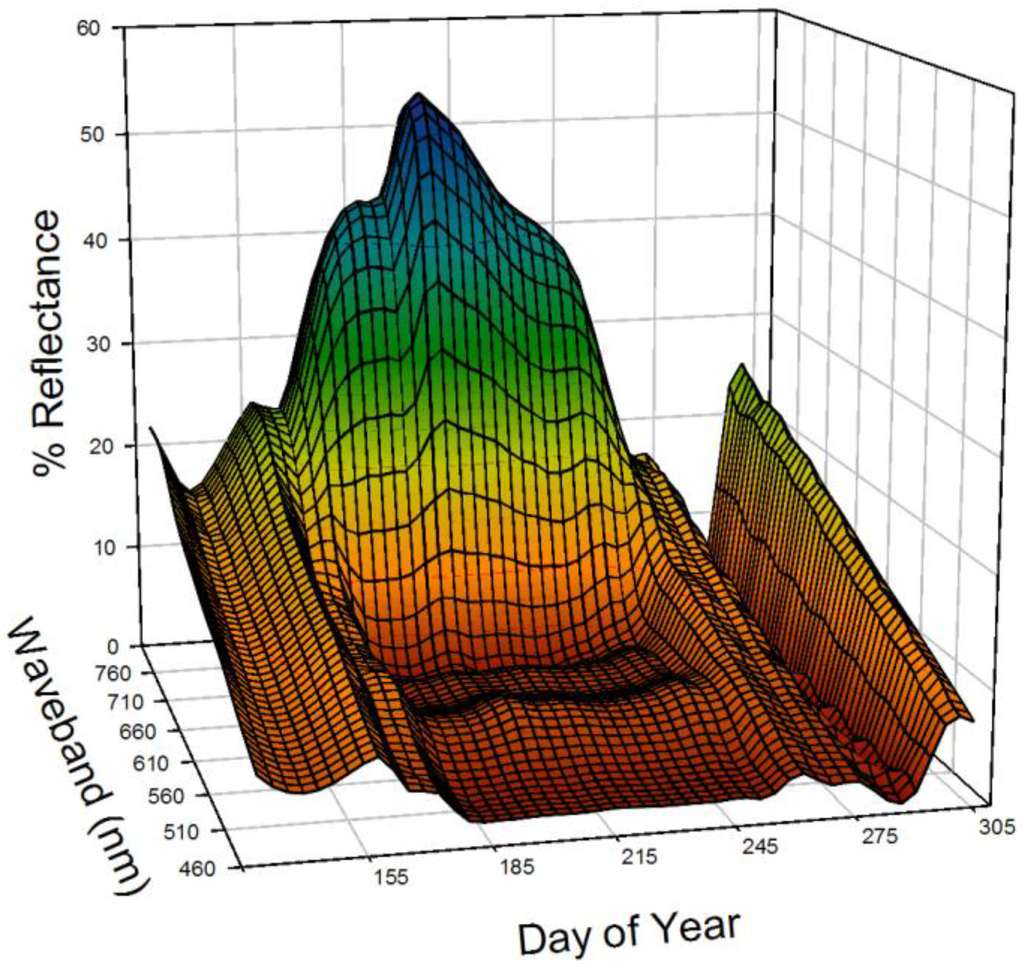
Figure 1.
Reflectance over corn obtained throughout the growing season with a CropScan eight-band radiometer over a spring strip tillage system in 2007.
Figure 1.
Reflectance over corn obtained throughout the growing season with a CropScan eight-band radiometer over a spring strip tillage system in 2007.

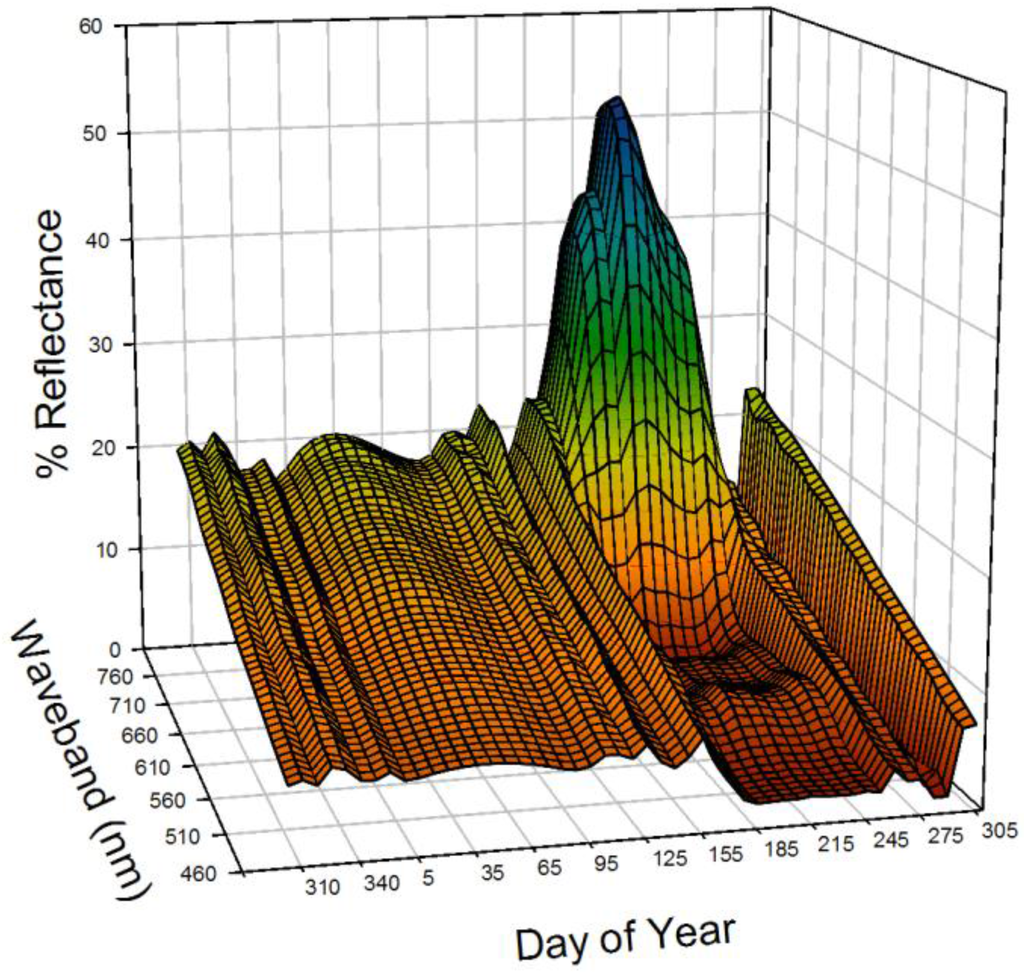
Figure 2.
Reflectance over corn obtained throughout the year with a CropScan eight-band radiometer over a spring strip tillage system in 2007.
Figure 2.
Reflectance over corn obtained throughout the year with a CropScan eight-band radiometer over a spring strip tillage system in 2007.

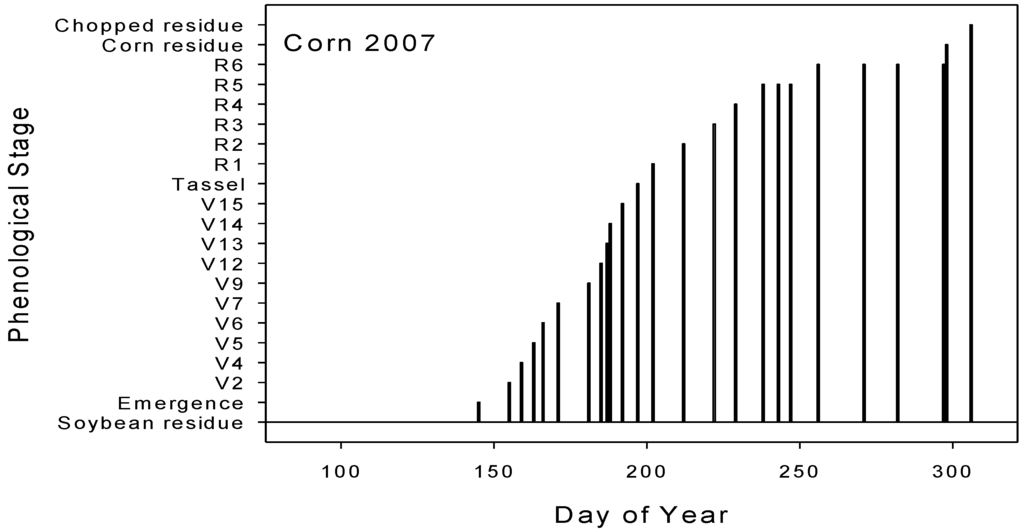
Figure 3.
Sequence of agronomic practices and phenological [24]stages of the corn crop for the 2007 cropping season.
Figure 3.
Sequence of agronomic practices and phenological [24]stages of the corn crop for the 2007 cropping season.

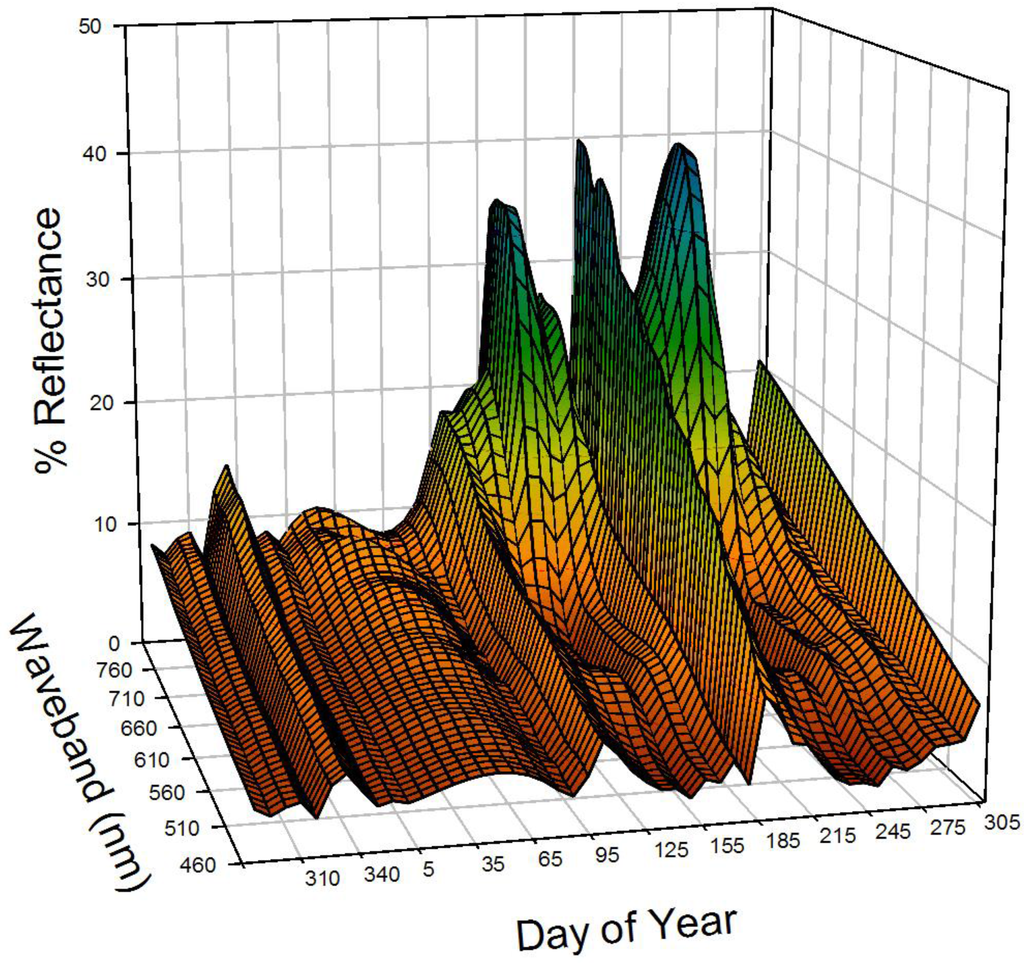
Figure 4.
Reflectance over wheat (until DOY 180) and soybean (DOY 180 and greater) obtained throughout the 2006–2007 year with a CropScan eight-band radiometer.
Figure 4.
Reflectance over wheat (until DOY 180) and soybean (DOY 180 and greater) obtained throughout the 2006–2007 year with a CropScan eight-band radiometer.

Observations over the canola canopy had a different temporal pattern because of the early season development and maturity and harvest in mid-summer (Figure 5). Patterns of reflectance are similar to the other crops observed in the study with the largest temporal change in the NIR wavelengths; however, the NIR values showed a broader peak throughout the season compared to other crops (Figure 5). Reflectance values in the red region were often less than 0.05 during the growing season while NIR values ranged from 0.2 to 0.4 (Figure 5). In these four canopies the changes in the reflectances across the wavelengths show the dynamic nature of the reflectance values observed over agronomic crops and indicate that for accurate development of VIs there is a need for frequent observations during the growing season while during the off-season there is little change. The patterns among years were very similar; however, the rapid changes within the season demonstrate the need for frequent measurements to capture the dynamics of cropping systems within a field. Observations of canopies within fields for precision agriculture applications will have to recognize these temporal patterns in reflectance. Changes in the visible and near-infrared wavelengths provide information about the canopy level response that forms the foundation for assessing differences in crop growth or response to different practices applied within a field.

Figure 5.
Reflectance over canola during the 2007 growing season obtained with a CropScan eight-band radiometer.
Figure 5.
Reflectance over canola during the 2007 growing season obtained with a CropScan eight-band radiometer.
Seasonal changes in VIs
Seasonal changes in the VIs showed patterns indicative of the seasonal patterns in the wavebands as shown in Figure 1, Figure 2, Figure 4, and Figure 5. Values for NDVI showed a bare soil value near 0.15 and increased to 0.9 during the period of maximum vegetative growth with this value maintained for a long period until the crop began to senesce (Figure 6). The values of NDVI in these studies saturated when the LAI approached a value of 4 and then remained high until midway through the reproductive phase of development. The seasonal patterns of NDVI reveal the long period of the season when the values are above 0.9 even though leaf area is changing in the canopies. This pattern is evident in NDVI data collected over corn, canola, soybean, or wheat canopies over the course of this study. This pattern for NDVI was found for all of the seasons we examined in this study and the results are very consistent among years. To evaluate NDVI patterns over the years we conducted an ANOVA on the complete set of observations across the tillage systems for the corn and soybean crops. This was conducted for seven years of observations at four different periods during the growing season with the results shown in Table 2. There was a significant effect of years on NDVI at the mid-vegetative stages (approximately V6 to V7 in corn, Figure 3), while crop and tillage was significant only at the mid-vegetative stage. The reason for this is very clear given the patterns shown in Figure 6 where the variation is most evident in the early stages and then little variation after the NDVI values saturate in the end of the season. This is similar to tillage systems which were significantly different at planting and at mid-vegetative stages because of the differences in rates of plant development.
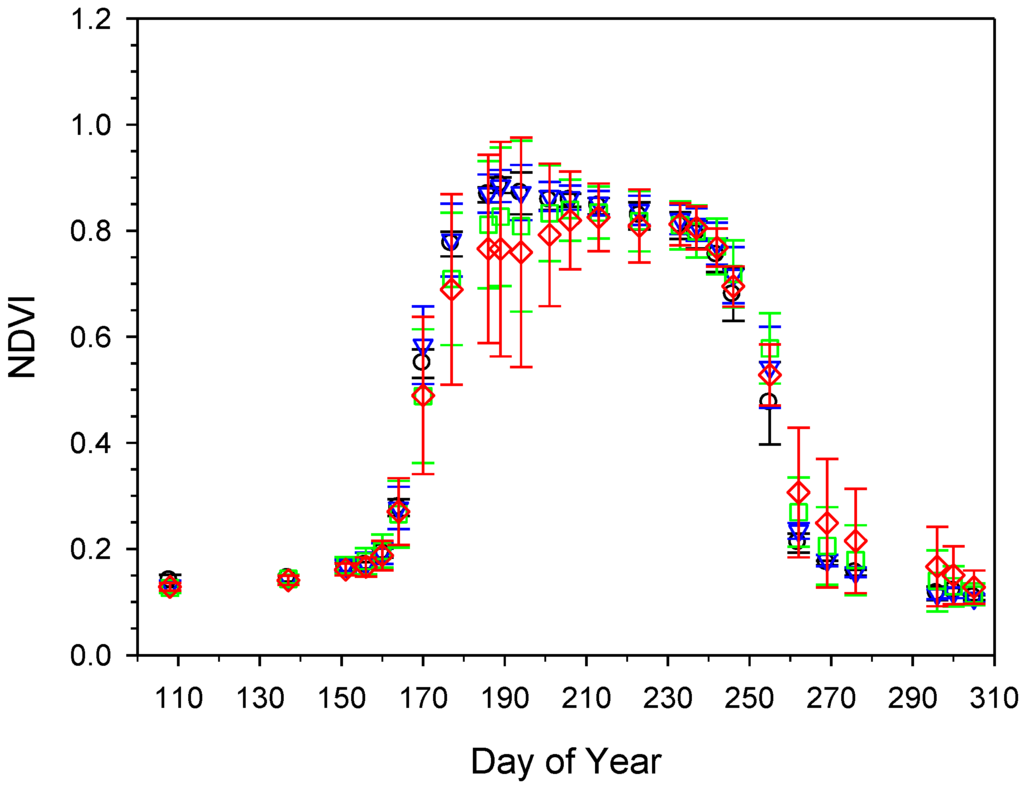
Figure 6.
Values for NDVI and standard deviation for three tillage systems for corn grown in 2007.
Figure 6.
Values for NDVI and standard deviation for three tillage systems for corn grown in 2007.

Table 2.
Mean values of NDVI observations over corn and soybean crops grown in four tillage systems for the period from 2002 to 2006 for four development periods and the ANOVA for the comparison of the treatments and interactions.
| Factor | Degrees of Freedom | Development Stage | |||
|---|---|---|---|---|---|
| Planting | Mid-Vegetative | Reproductive Onset | Mid-grain Fill | ||
| Year | 4 | 0.12ns1 | 0.80* | 0.94ns | 0.85ns |
| Crop | 1 | 0.12ns | 0.81* | 0.93ns | 0.85ns |
| Tillage | 3 | 0.13* | 0.83* | 0.93ns | 0.84ns |
| Year × Crop | 4 | 0.12ns | 0.81ns | 0.94ns | 0.85ns |
| Year × Tillage | 3 | 0.12ns | 0.82ns | 0.94ns | 0.84ns |
| Crop × Tillage | 3 | 0.12* | 0.83* | 0.93** | 0.86** |
| Year × Crop × Tillage | 12 | 0.13ns | 0.82ns | 0.93ns | 0.85ns |
1 ns—nonsignificant, * significant at p < 0.10, ** significant at p < 0.05.
The tillage term was significant because of the effect of the different tillage systems on the residue remaining on the soil surface. The only interaction term that was significant was the crop × tillage interaction caused by the effect of the tillage system on crop response that was detected in the NDVI values (Table 2). There has been extensive use of the NDVI approach to estimate yield potential in corn [19] and our results would support this approach since the most sensitive period to detect differences is in the vegetative stage.
The analysis was extended to examine the differences among corn hybrids grown with a fall strip versus a spring strip tillage system for NDVI values for the same four development stages (Table 3). There was no effect of years and hybrids were significantly different at all times except at the planting observation. Tillage was significant at only the planting and mid-vegetative stage because of the effect of the tillage practice on the crop residue that was remaining on the soil surface. The only other significant effect was the hybrid x tillage interaction for the mid-grain fill period. This was caused by the tillage systems interacting with hybrids in terms of the senescence of the crop (Table 3).
Table 3.
Mean values of NDVI observations over six corn hybrids grown in two tillage systems for the period from 2002 to 2004 for four development periods and the ANOVA for the comparison of the treatments and interactions.
| Factor | Degrees of Freedom | Development Stage | |||
|---|---|---|---|---|---|
| Planting | Mid-Vegetative | Reproductive Onset | Mid-grain Fill | ||
| Year | 2 | 0.15ns1 | 0.84ns | 0.92ns | 0.84ns |
| Hybrid | 5 | 0.14ns | 0.83* | 0.93ns | 0.85* |
| Tillage | 1 | 0.13* | 0.84* | 0.92ns | 0.84ns |
| Year × Hybrid | 10 | 0.14ns | 0.84ns | 0.92ns | 0.83ns |
| Year × Tillage | 2 | 0.15ns | 0.84ns | 0.93ns | 0.84ns |
| Hybrid × Tillage | 5 | 0.14ns | 0.83ns | 0.91ns | 0.85* |
| Year × Hybrid × Tillage | 10 | 0.14ns | 0.85ns | 0.93ns | 0.84ns |
1 ns—nonsignificant, * significant at p < 0.10, ** significant at p < 0.05.
One of the applications of NDVI is the estimation of intercepted Photosynthetically Active Radiation (iPAR) as shown by [6]. In both corn and soybean canopies we were able to use iPAR derived from the NDVI values to predict the seasonal changes in the canopies in intercepted PAR (Figure 7 and Figure 8).

Figure 7.
Cumulative intercepted solar radiation for corn in two tillage systems, fall strip and spring strip with two different N treatments in 2007.
Figure 7.
Cumulative intercepted solar radiation for corn in two tillage systems, fall strip and spring strip with two different N treatments in 2007.
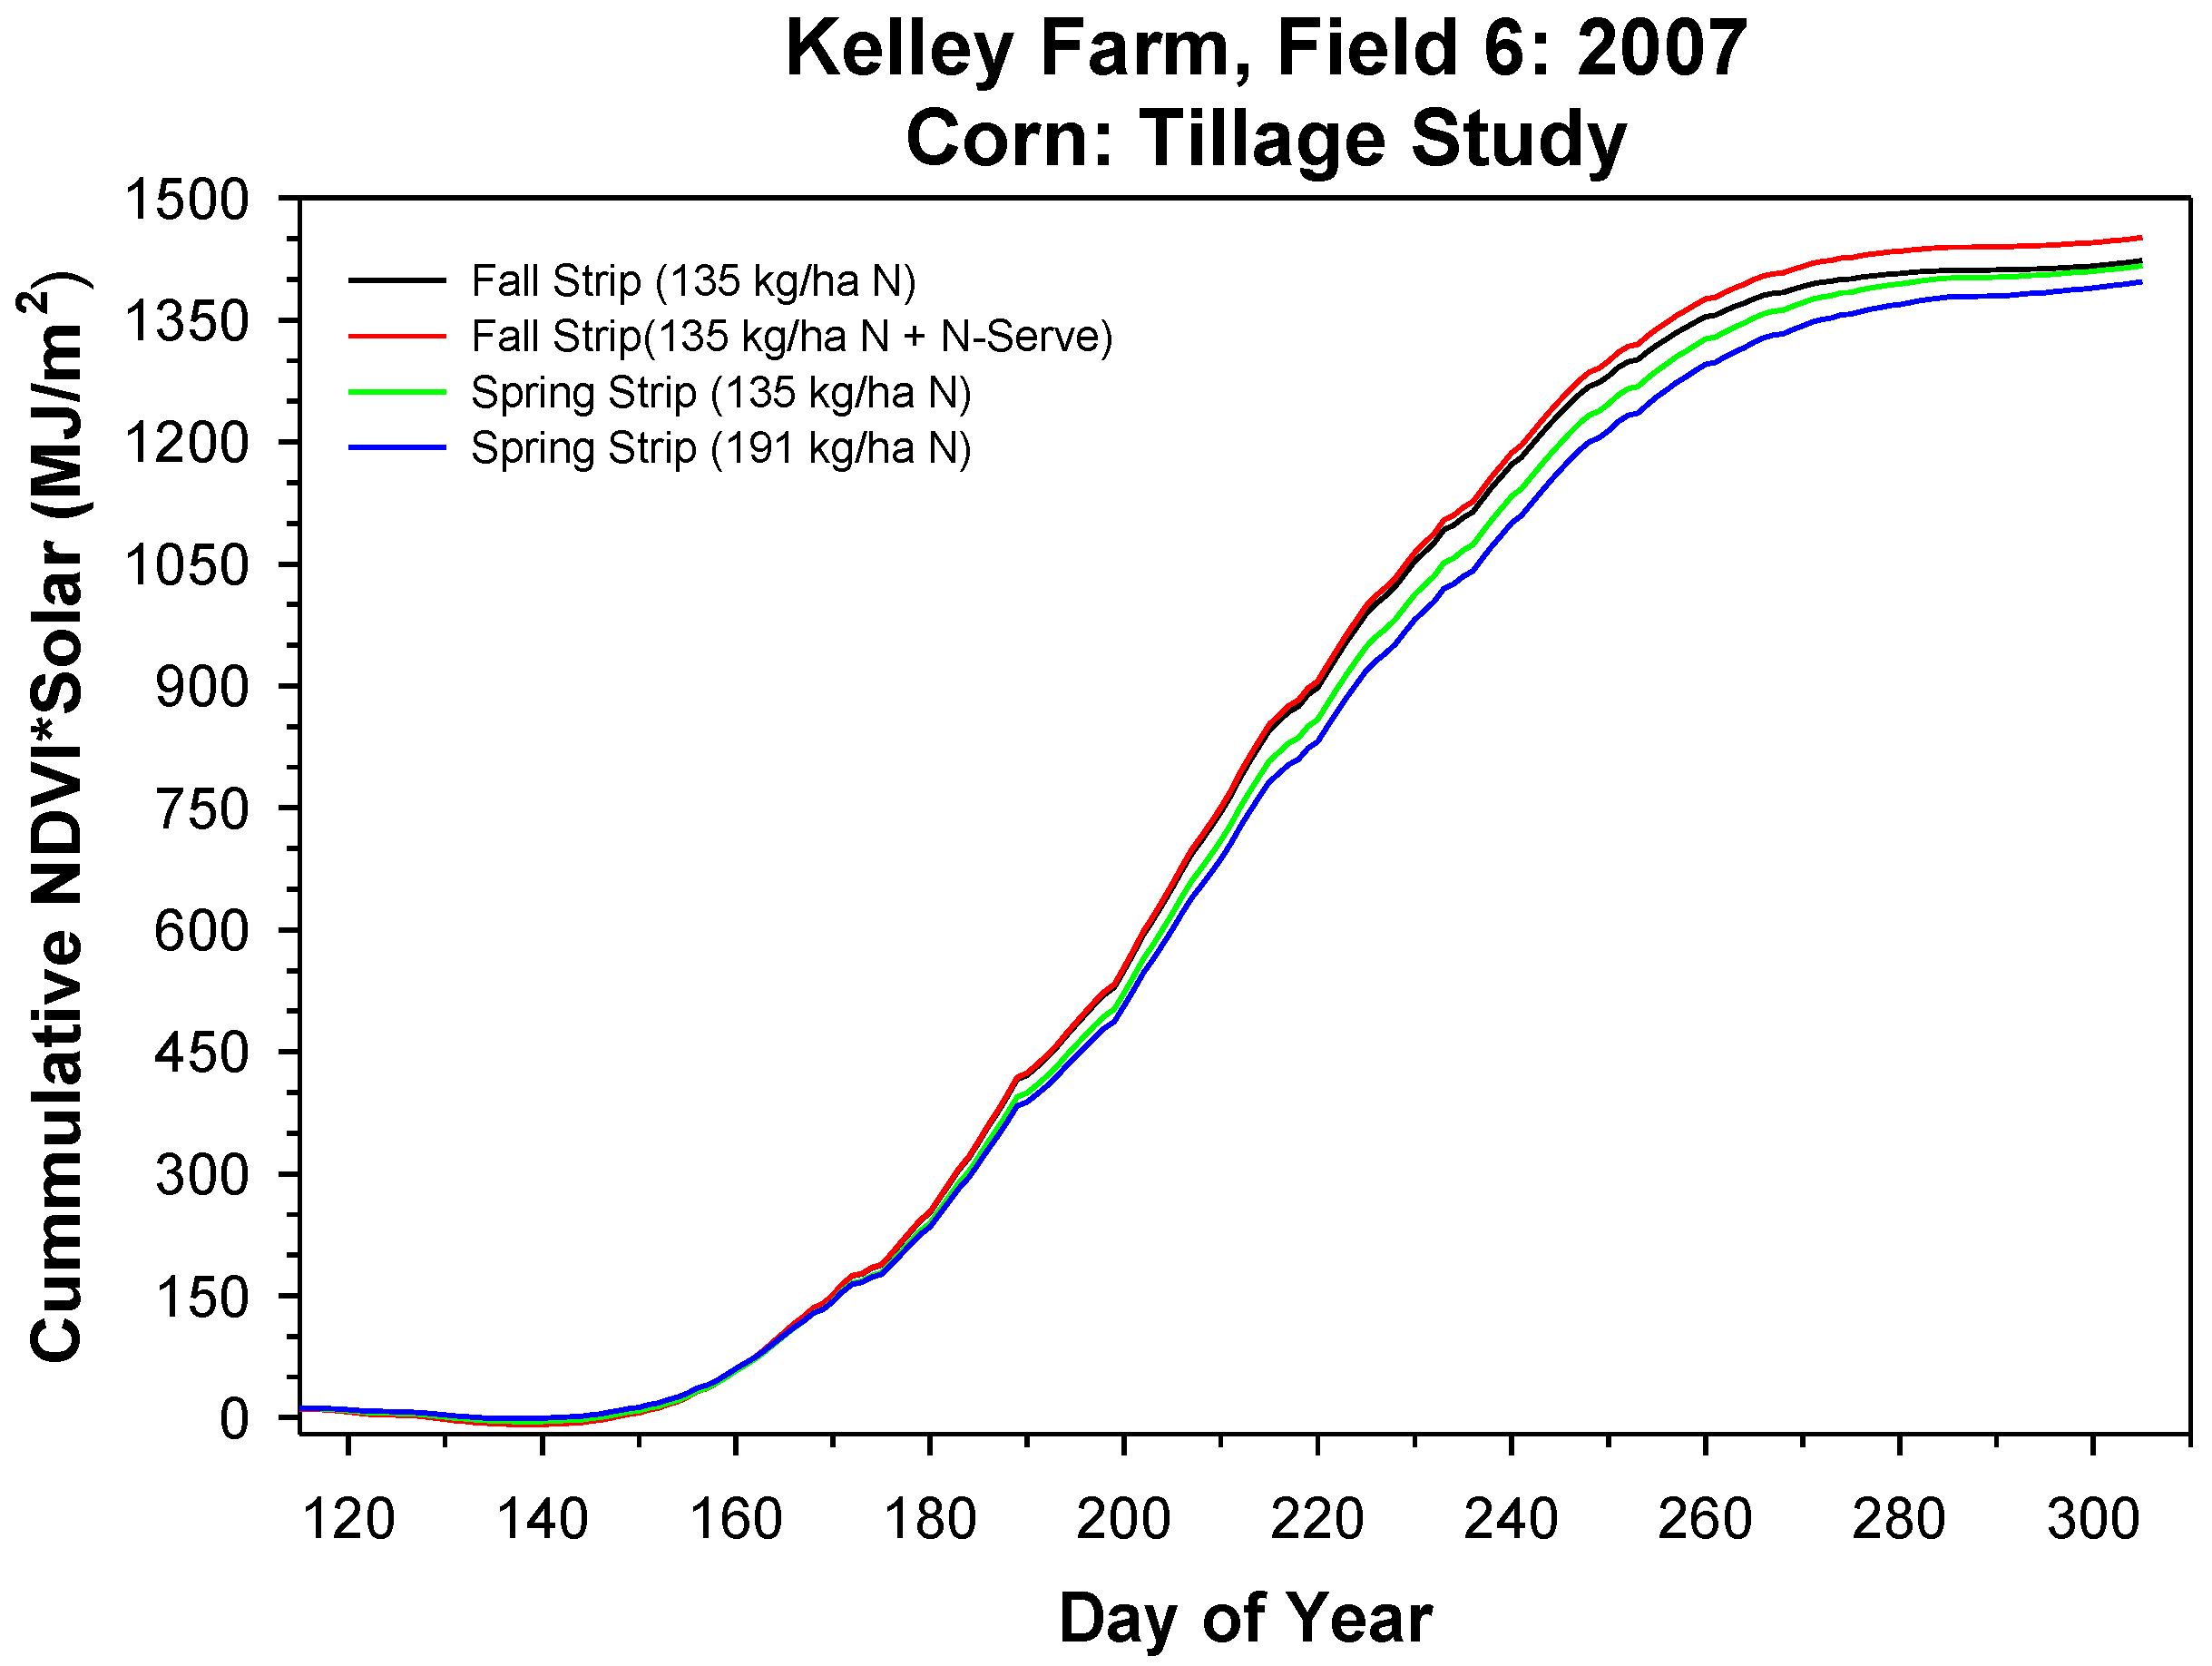
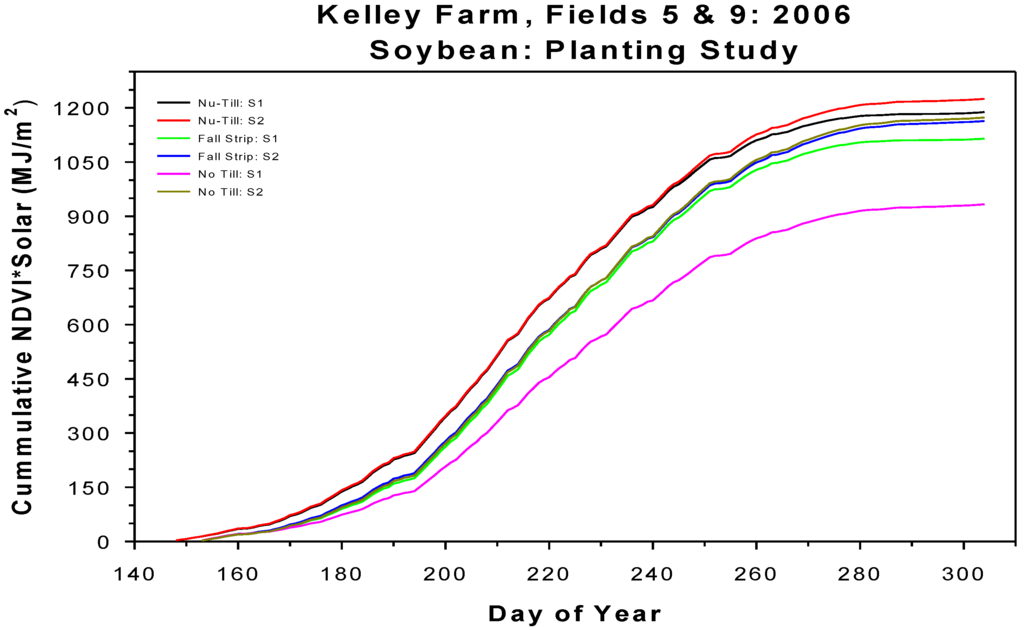
Figure 8.
Cumulative intercepted solar radiation for two varieties of soybean in three tillage systems, nu-till, fall strip and no-till in 2006.
Figure 8.
Cumulative intercepted solar radiation for two varieties of soybean in three tillage systems, nu-till, fall strip and no-till in 2006.
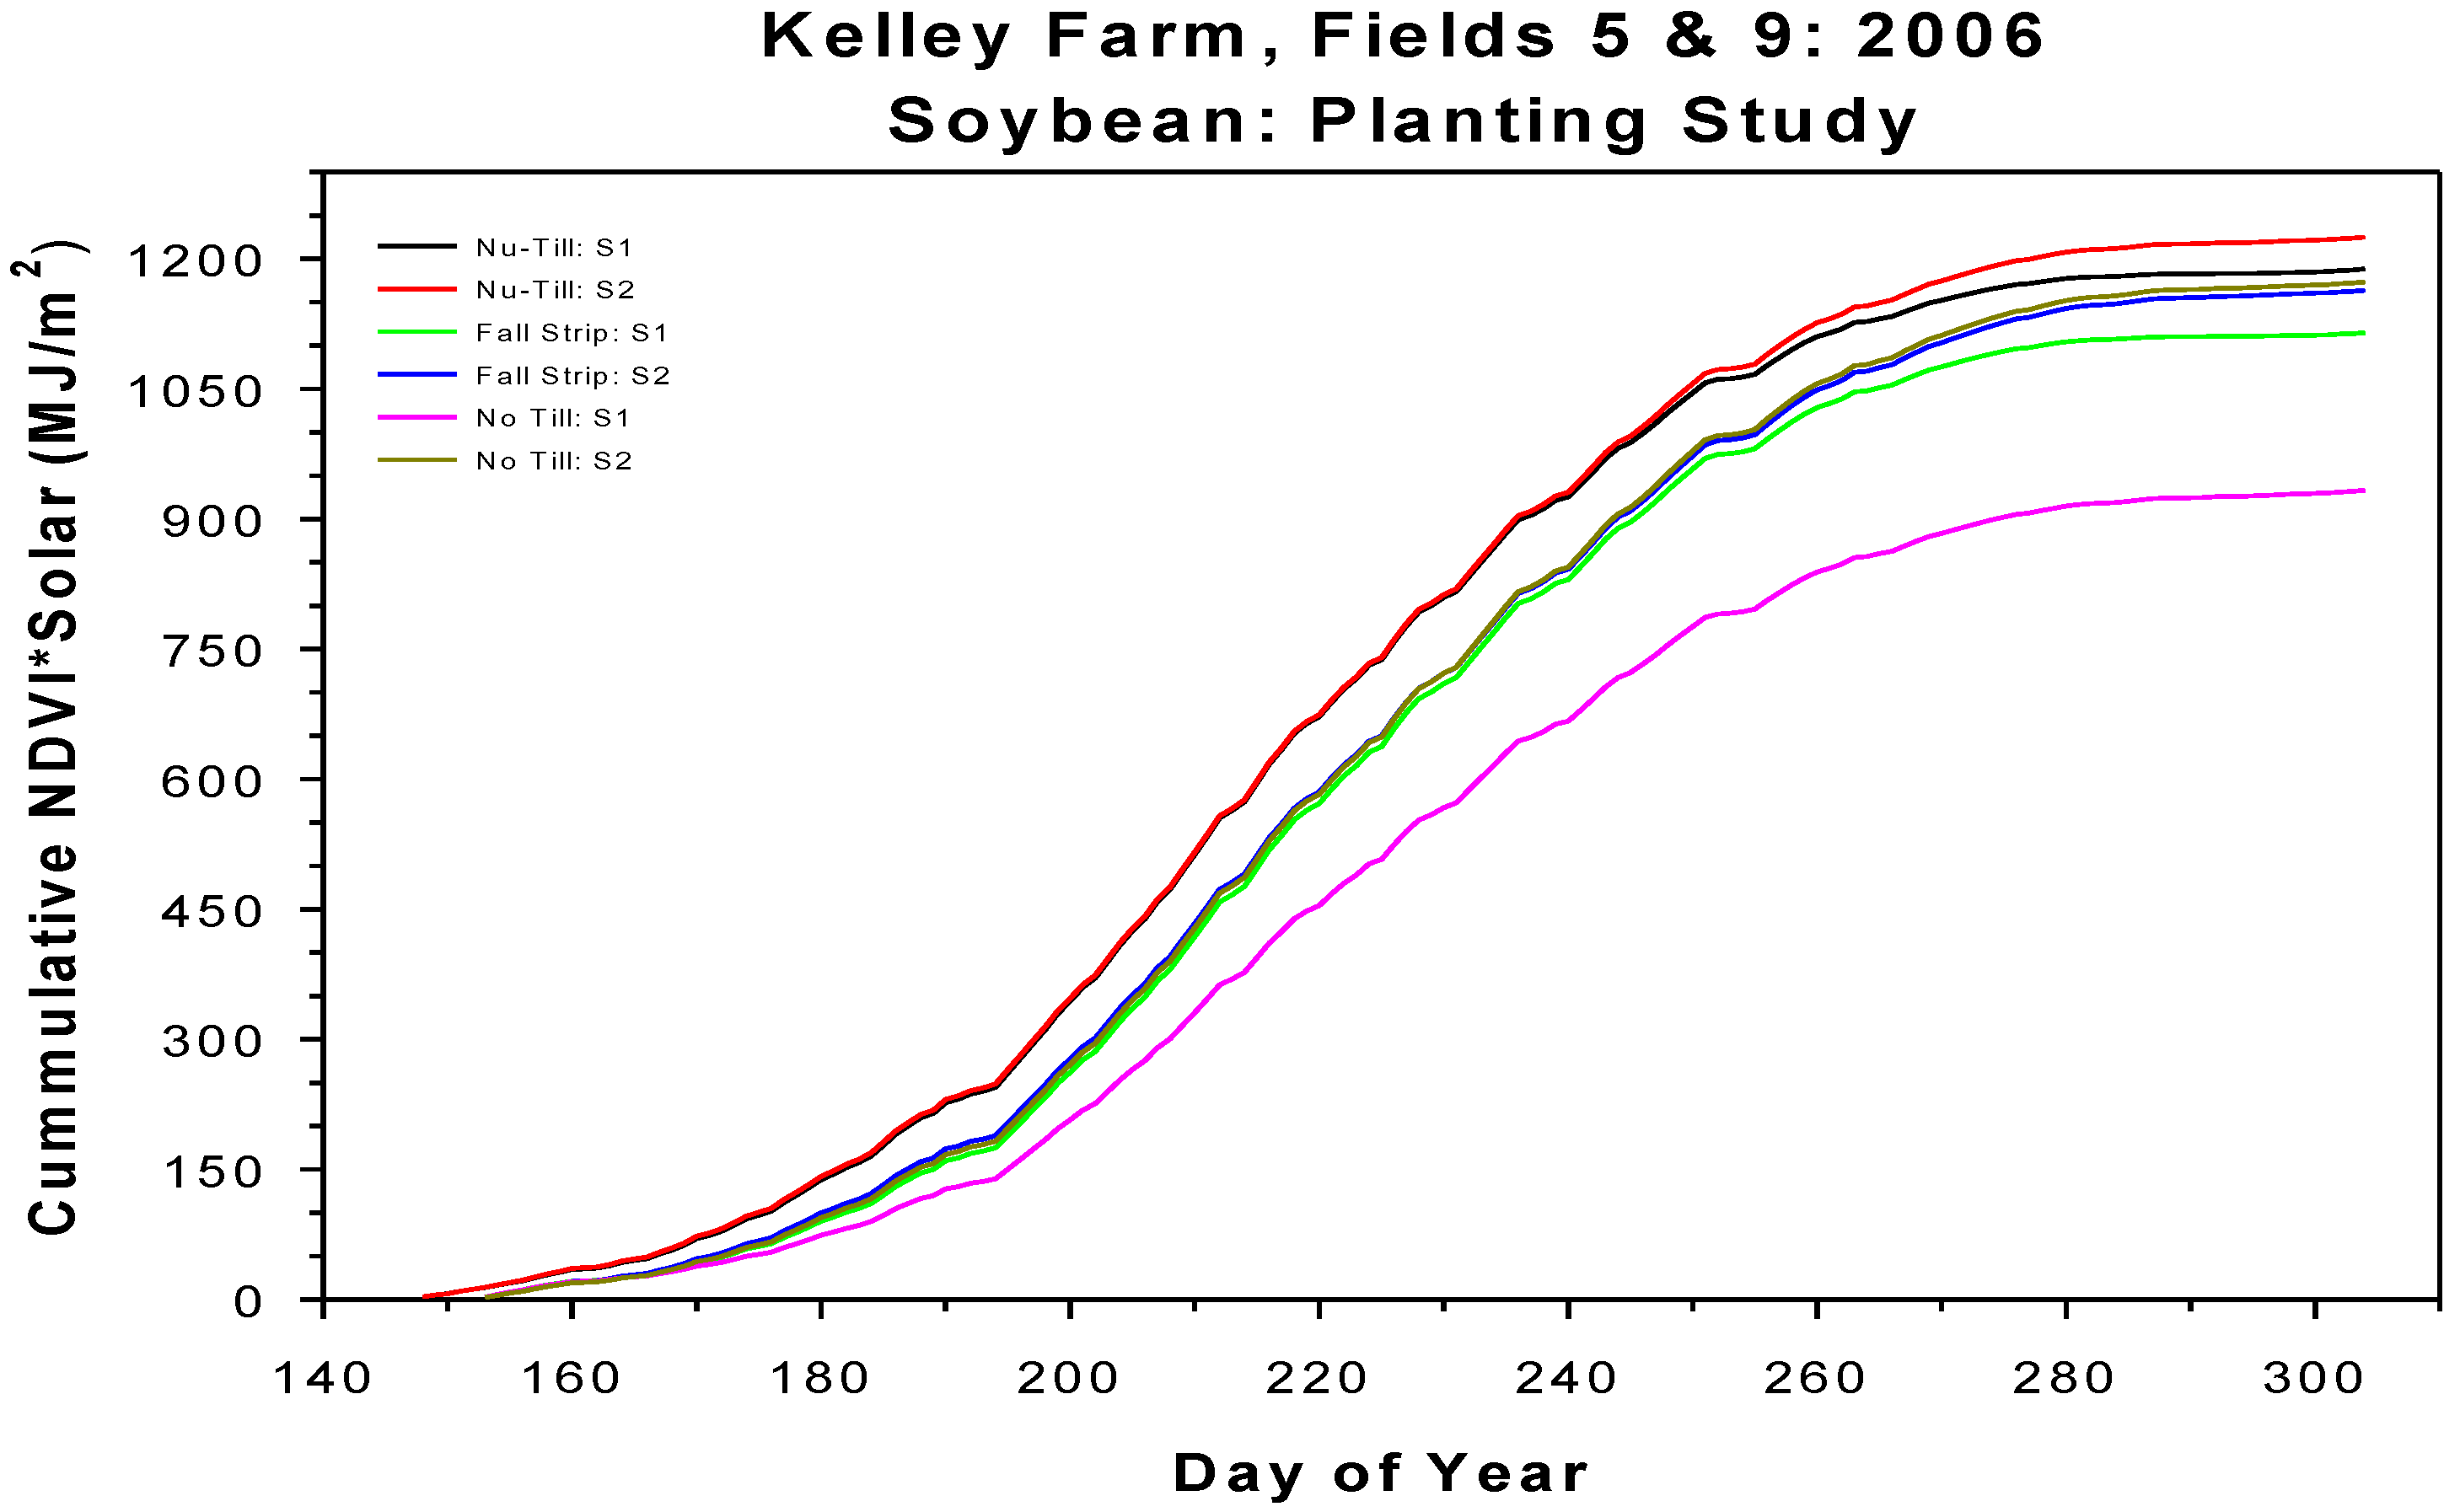
For the corn canopies there was no significant difference in the seasonal NDVI values for the growing season in these systems (Figure 7) as would be expected from the lack of significance among tillage systems (Table 2). For the soybean canopies there were significant differences in the cumulative iPAR interception values with the no-till practice showing the lowest cumulative value and also the lowest grain yield (Figure 8). The use of the iPAR values derived from NDVI provides a stable measure of crop growth among years and can be easily derived from NDVI values and consistently shows differences among agronomic practices related to crop yield. Utilization of the iPAR values derived from NDVI offers a valuable method for assessing differences among different systems.
Temporal patterns of other VIs showed different seasonal trends than did NDVI. This is to be expected since each of the VIs has their own unique combination of wavebands that have been related to a specific canopy parameter. It is not possible to show all of the different VIs that are available for crop assessment. However, the concern about improved N management based on chlorophyll content of leaves draws attention to indices with the ability to estimate chlorophyll content. One of those indices is the NPCI and patterns for the NPCI index showed a slight but significant change in the early season and then an increase as the crop matured when leave color began to change. This seasonal pattern is interesting since the NPCI increased when the canopy was in the senescence phase and losing chlorophyll and the NPCI was more sensitive to changes in chlorophyll in the later season when N decisions are not longer needed as compared to the early season when N rates could be adjusted. These difficulties in using independent measures of VIs for N management is the reason why high N rates strips are placed within fields as a direct comparison within the field between a high rate and the area to be managed. Thus, this index has the ability to detect leaf chlorophyll differences in canopies. Ratios of NIR/green or NIR/red edge have been proposed as chlorophyll indices [25]. An ANOVA analysis for the corn hybrids for the two tillage systems showed a difference in the development periods in which there were significant differences (Table 4).
Table 4.
Mean values of Chlorophyll Index (CI) observations over six corn hybrids grown in two tillage systems for the period from 2002 to 2004 for four development periods and the ANOVA for the comparison of the treatments and interactions.
| Factor | Degrees of Freedom | Development Stage | |||
|---|---|---|---|---|---|
| Planting | Mid-Vegetative | Reproductive Onset | Mid-grain Fill | ||
| Year | 2 | 0.80ns1 | 6.5ns | 9.5* | 7.7* |
| Hybrid | 5 | 0.79ns | 6.7* | 9.6* | 7.6** |
| Tillage | 1 | 0.82ns | 6.3* | 9.7* | 7.5* |
| Year × Hybrid | 10 | 0.83ns | 6.4ns | 9.5ns | 7.6ns |
| Year × Tillage | 2 | 0.78ns | 6.6ns | 9.5ns | 7.7ns |
| Hybrid × Tillage | 5 | 0.79ns | 6.5* | 9.8** | 7.6** |
| Year × Hybrid × Tillage | 10 | 0.80ns | 6.6ns | 9.5ns | 7.6ns |
1 ns—nonsignificant, * significant at p < 0.10, ** significant at p < 0.05.
There significant differences among the years for the reproductive stages because the years were different in their growth patterns that were evident during these growth stages. Hybrids and tillage systems were significantly different at all stages (Table 4). The hybrid × tillage term was also significant across the vegetative, reproductive onset, and mid-grain filling periods which indicates that hybrids reacted differently to the nitrogen associated with a particular tillage system and the CI is able to detect those responses. The CI is effective at assessing nitrogen status in corn leaves. There were no significant differences in any of the factors for the CI when this analysis was applied to the soybean varieties. This is expected since soybean canopies obtain their nitrogen from fixation. The use of simple ratios of wavebands early in the growing season will create indices with a large amount of variation. If an index like CI is used to estimate the shortage of N in a crop canopy then these results will have to be used with caution. Simple ratio indices are responding to changes in either one of the wavebands and early in the season are affected by the soil background. The transformation of this ratio as suggested by [12] did not affect the standard deviation and we did not find this degree of variation in the individual leaf chlorophyll readings collected in these treatments; however, the leaf chlorophyll readings are collected on individual leaves and don’t have the spatial variation of canopies. When the NPCI was compared for soybean canopies there was no significant difference and a minimum standard deviation among the four tillage systems. This is expected since there are no expected differences in chlorophyll content of the soybean canopies.
The temporal pattern of VIs depends upon the phenological stage or plant parameters to which the index is most closely related. An example of this change throughout the season related to a different sequence is the PSRI which is related to the senescence of the canopies [13]. We evaluated the PSRI for the six corn hybrids grown in two tillage systems using an ANOVA on the different effects similar to the analysis for the other VIs. There were no significant differences for the PSRI until the onset of the reproductive period and mid-grain fill. The differences at the onset of the reproductive stage can be attributed to the change in leaf color induced by late season N stress which created a change in the reflectance in the canopies. This was found to be significant in the hybrid × tillage interaction term (Table 5).
Table 5.
Mean values of PSRI observations over six corn hybrids grown in two tillage systems for the period from 2002–2004 for four development periods and the ANOVA for the comparison of the treatments and interactions.
| Factor | Degrees of Freedom | Development Stage | |||
|---|---|---|---|---|---|
| Planting | Mid-Vegetative | Reproductive Onset | Mid-grain Fill | ||
| Year | 2 | 0.22ns1 | 0.02ns | 0.01* | 0.32* |
| Hybrid | 5 | 0.23ns | 0.02ns | 0.03* | 0.33** |
| Tillage | 1 | 0.21ns | 0.02ns | 0.02ns | 0.32ns |
| Year x Hybrid | 10 | 0.22ns | 0.01ns | 0.02ns | 0.35** |
| Year x Tillage | 2 | 0.22ns | 0.02ns | 0.02ns | 0.33ns |
| Hybrid x Tillage | 5 | 0.23ns | 0.02ns | 0.03* | 0.35** |
| Year x Hybrid x Tillage | 10 | 0.23ns | 0.02ns | 0.02ns | 0.33ns |
1ns—nonsignificant, * significant at p < 0.10, ** significant at p < 0.05
This was similar to the observations from the soybean canopies in which there were significant differences among tillage systems only after DOY 250 (data not shown) in which there was beginning leaf drop and yellowing of the leaves. The utility of this index is to provide a VI to detect differences in plant senescence across fields. This index is most sensitive to the senescence phase in being able to differentiate among treatments. This index pattern can be used to determine the rate of senescence in different crops by comparing the rate of change from a green canopy to a senesced canopy. Combination of the different indices throughout the growing season can be used to define the points at which the indices can be most useful in their comparison.
Other plant parameters that can be derived from remote sensing data are LAI and plant biomass. Leaf area index was derived from the EVI as proposed by [13] and for the corn canopies there was a significant difference among the treatments (Figure 9).
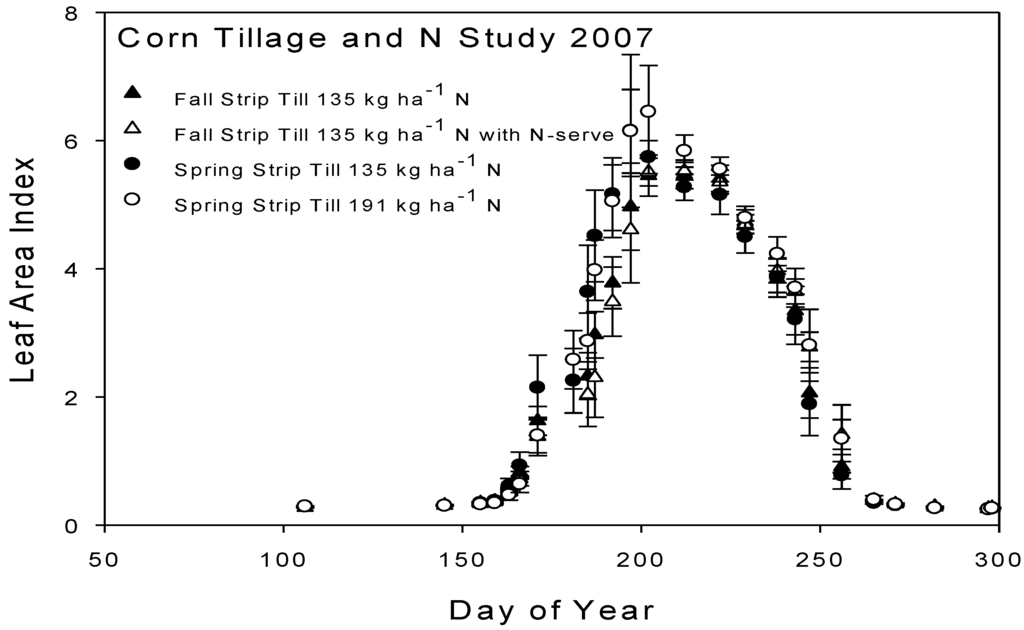
Figure 9.
Values for LAI derived from an Enhanced Vegetative Index (EVI) and the standard deviation over the treatment means throughout the growing season for corn in 2007 for combinations of tillage and nitrogen fertilizer systems.
Figure 9.
Values for LAI derived from an Enhanced Vegetative Index (EVI) and the standard deviation over the treatment means throughout the growing season for corn in 2007 for combinations of tillage and nitrogen fertilizer systems.

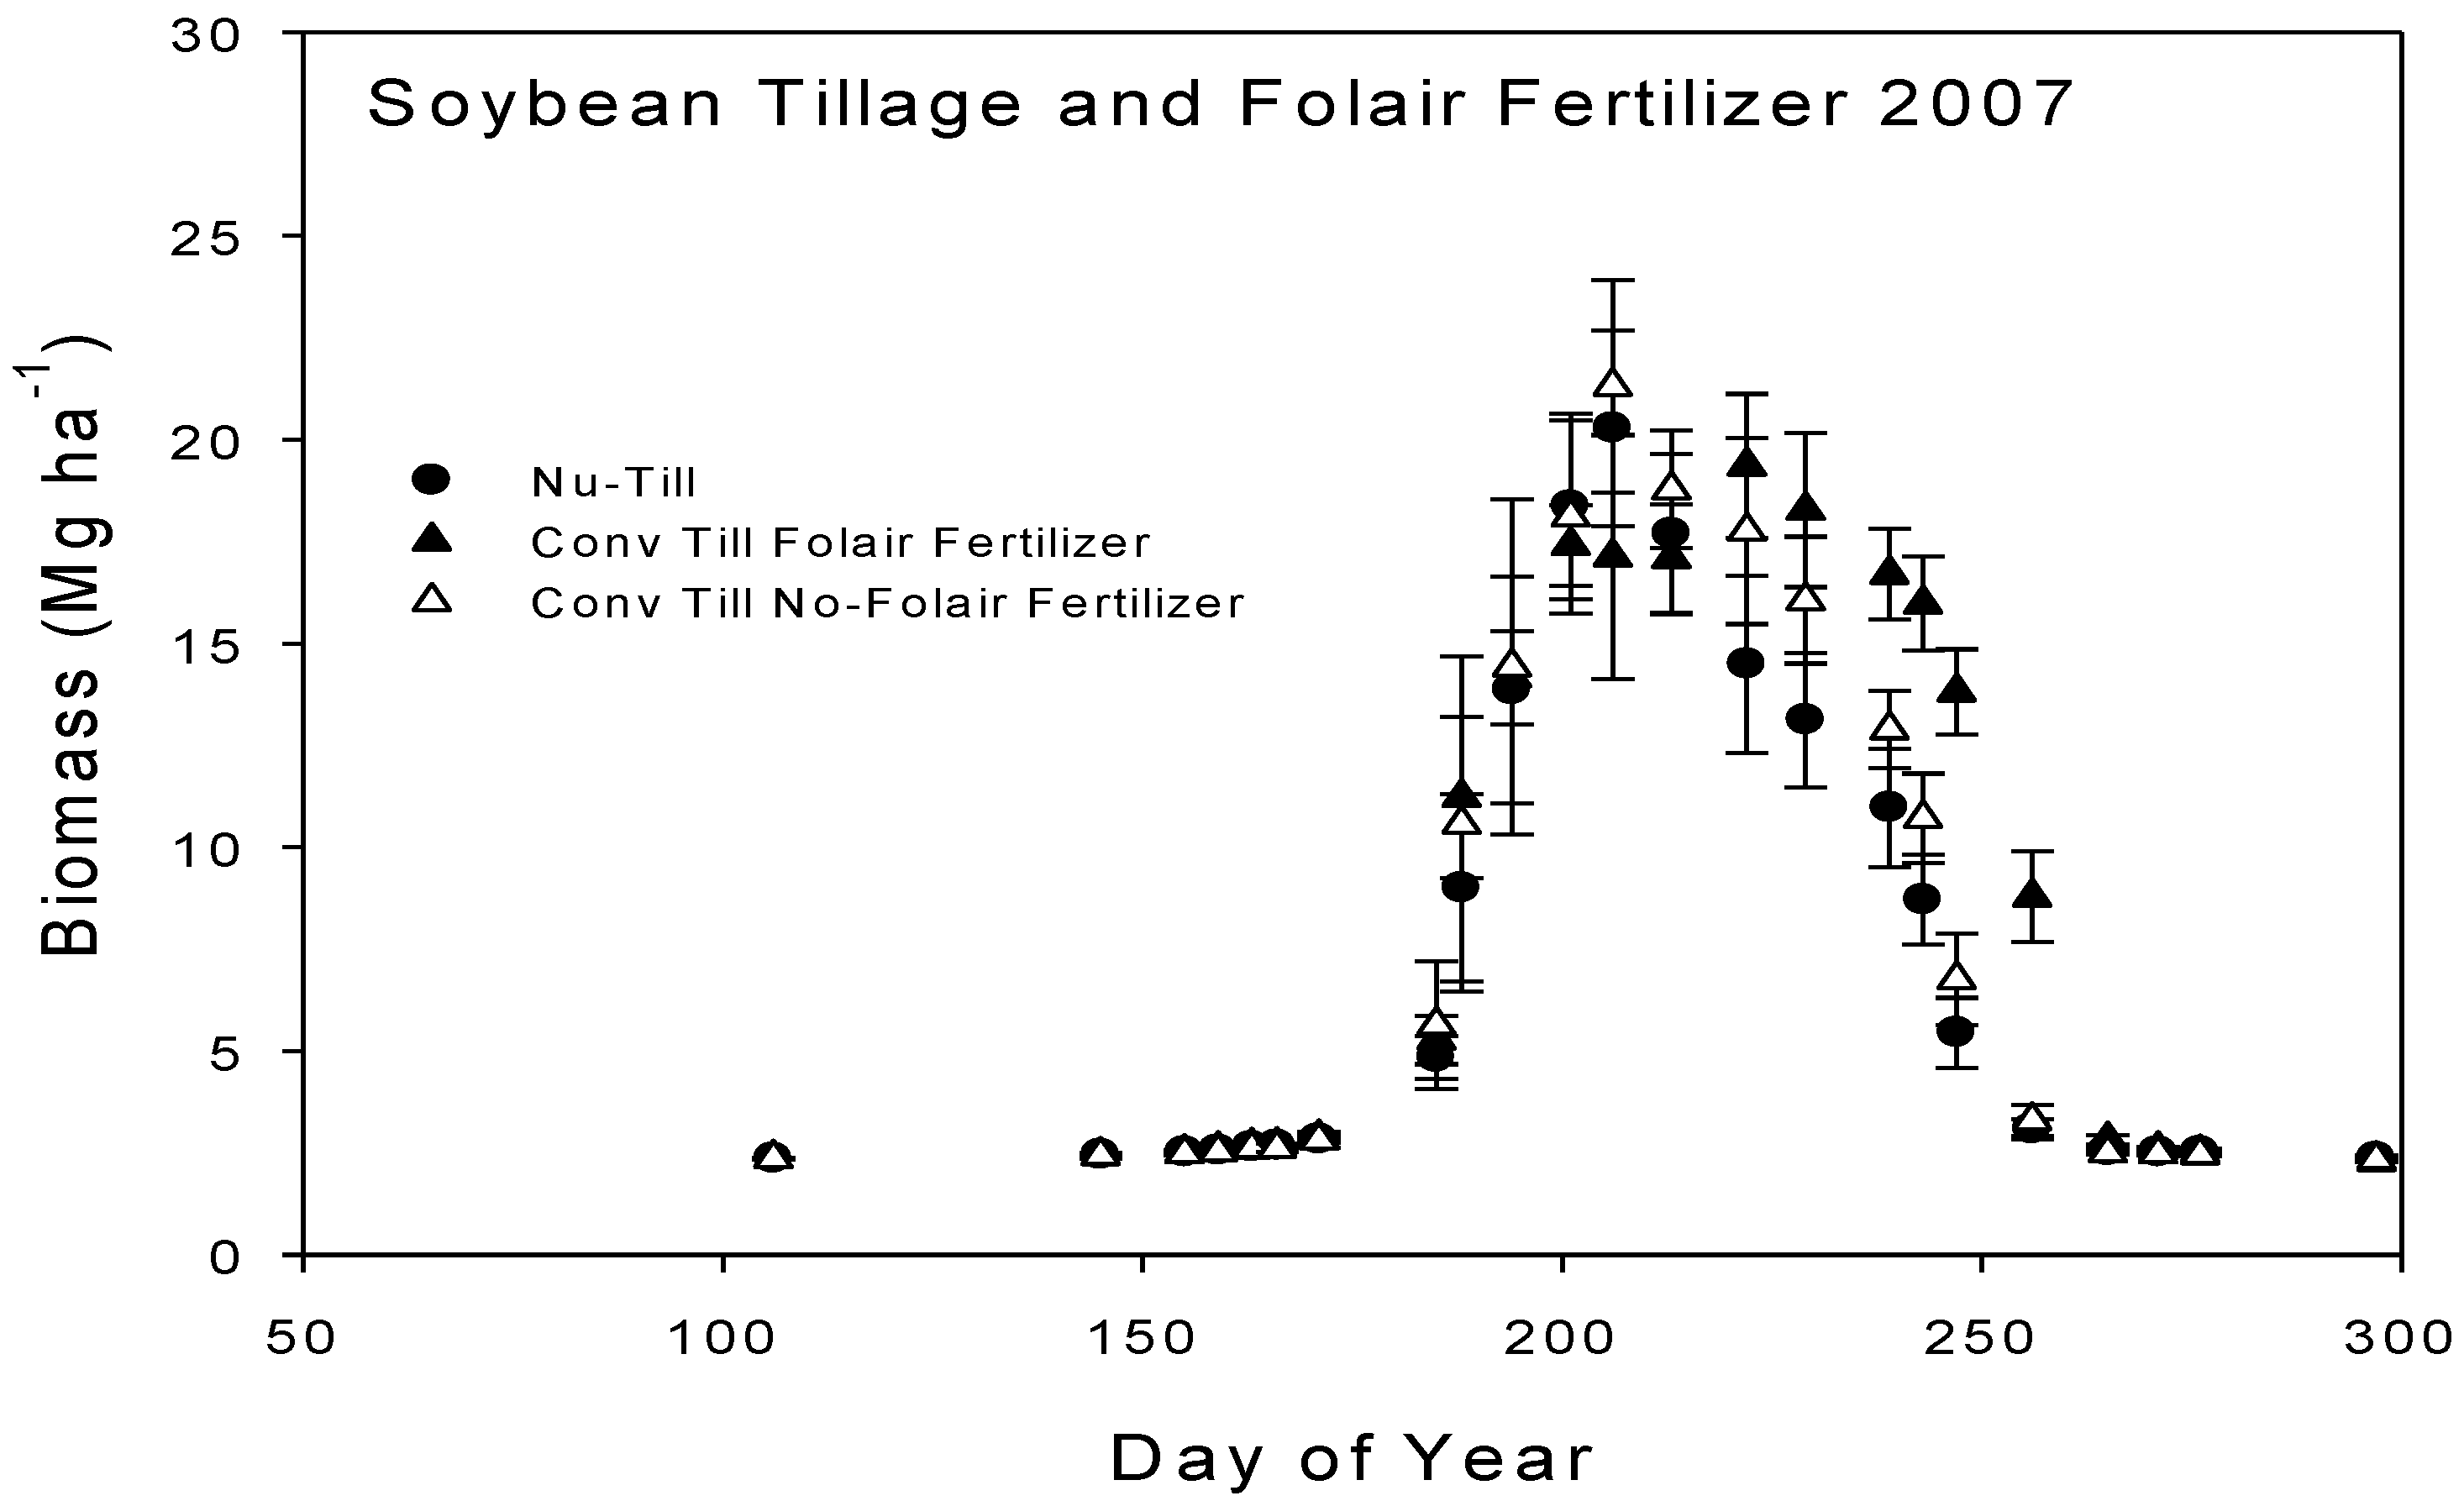
The ability to estimate LAI provides a useful tool for crop assessment and the variation seen in this figure is not different than direct observations collected with either destructive or non-destructive leaf area meters. In this analysis, we were able to detect differences in LAI induced by the increase in N addition to the plants (191 vs. 135 kg ha−1N) which were detectable with the EVI values and significantly different (Figure 9). These patterns are typical of the different cropping seasons demonstrating the potential utility of this type of approach. Biomass patterns showed even a larger difference during the growing season and the differences shown in Figure 10 demonstrate the ability to detect treatment differences in green biomass for soybean. It is encouraging that we can detect the differences in green biomass throughout the growing season and the comparison between these values derived from the remote sensing, using the NIR/Red ratio, and the destructive sampling were correlated with a value of r2 = 0.93. There were differences in biomass throughout the season that were induced by the different management practices and these were detectable using the VI (Figure 10).

Figure 10.
Values for above ground biomass derived from the nir/red ratio and the standard deviation over the treatment means throughout the growing season for soybean in 2007 for combinations of tillage and folair fertilizer application.
Figure 10.
Values for above ground biomass derived from the nir/red ratio and the standard deviation over the treatment means throughout the growing season for soybean in 2007 for combinations of tillage and folair fertilizer application.
Similar observations were found in corn canopies in which we could detect significant differences among treatments that affected green biomass accumulation. Plant parameters can be detected with remote sensing with sufficient accuracy to provide an indication of the growth patterns of crops. The seasonal variation does provide a measure of the variation which exists within treatments that is often missed by destructive sampling because of the limitations imposed by the time and human resources required for intensive sampling. The use of remote sensing methods allows for more frequent and less costly methods for obtaining LAI and biomass values across more treatments and within fields.
3. Conclusions
Remote sensing methods provide valuable tools for crop canopy assessment and these tools will provide improved information for agriculture applications [26,27,28]. Utilization of VIs for application to agricultural problems can be tailored to obtain information about the variation within a field at a particular portion of the growing season. The use of different indices enhances our understanding of the effects of management practices. The temporal dynamics of VIs enhances the information content required for improved management decisions. A summary of the different indices and their application to specific crop parameters and phenological stages are shown in Table 6.
Table 6.
Vegetative indices and their application to specific crop parameters and phenological stages of crop development.
| Index | Crop Parameter | Phenological Stage |
|---|---|---|
| Ratio | Biomass | Green biomass changes during season |
| NDVI | Intercepted PAR | Seasonal cumulative totals |
| SAVI | LAI | Responsive in early season to changes in LAI |
| EVI | LAI | Seasonal changes in LAI |
| NPCI | Leaf chlorophyll | Sensitive in later stages of crop development |
| CIgreen | Leaf chlorophyll | Sensitive in early stages |
| PSRI | Plant senescence | Sensitive during later stages of crop development |
Observations of reflectance throughout the year over corn, soybean, wheat, and canola revealed similar characteristics. Without the presence of a crop the reflectance pattern across the spectrum from visible through the near-infrared was a linear relationship which varied by the soil water content in the surface. As the canopy began to develop there were rapid changes in the reflectance across the different wavebands. The most rapid change was in the near-infrared wavebands which increased above the bare soil line for all crops (Figure 1, Figure 2, Figure 4, and Figure 5). Visible wavelengths decreased relative to the bare soil line. The data sets assembled over a period of eight years provide insights into the stability of the different VIs and we found that a particular VI behaves the same across years and there was no year affect in an analysis of the different VIs at the different growth stages. This provides confidence that we can use VIs across years to observe a specific plant parameter.
Different VIs provide information about specific plant parameters (Table 6). For example, we found that the seasonal patterns in NDVI had bare soil values near 0.15 and then had nearly consistent values above 0.9 for period when the canopies had leaf area indices above four, which were maintained for long periods during the season in all of the canopies studied. There were significant differences among crops and management practices in NDVI so that this index could reliably be used to estimate seasonal cumulative values of intercepted photosynthetically active radiation. This allows for a comparison of management practices on a plant process that is related to the ability of the canopy to intercept light for growth. Conversely, we found that the PSRI was sensitive to changes in leaf area during the senescence phase and we were able to detect differences among treatments that caused more rapid loss of leaf area. This index could provide valuable information in detecting agronomic problems that are related to premature loss of green leaf area and productive capacity. The effects of management practices on biomass were evident in simple ratios of near-infrared/red reflectance values and provided estimates of biomass that were comparable to destructive sampling, hence, we can effectively utilize VIs to obtain crop parameters more efficiently and over the same location within a field throughout the growing season.
Each of the different VIs has a unique combination of wavebands that can be related to specific crop parameters. When using these VIs care needs to be taken to ensure that the information being generated from the VI is appropriate for the specific part of the growing season. The observations we collected over the eight years of this study give us confidence that the indices can be used to detect specific crop parameters; however, these may be only be applicable for portions of the growing season. We would urge that users of these indices to carefully evaluate the most appropriate VI for a specific crop parameter.
Acknowledgements
The support of the Risk Management Agency and especially Virginia Guzman and Dave Fulk are greatly acknowledged and this research is under the agreement 07-IA-0831-0210. This effort would not be possible without the capable support of Wolf Oesterreich and Bert Swalla in their efforts to collect and process the data from the field experiments.
References and Notes
- Hatfield, J.L.; Prueger, J.H.; Kustas, W.P. Remote sensing of dryland crops. In Remote Sensing for Natural Resource Management and Environmental Monitoring, Manual of Remote Sensing, 3rd ed.; Ustin, S.L., Ed.; John Wiley: Hoboken, NJ, USA, 2004; pp. 531–568. [Google Scholar]
- Hatfield, J.L.; Gitelson, A.A.; Schepers, J.S.; Walthall, C. Application of spectral remote sensing for agronomic decisions. Agron. J. 2008, 100, S-117–S-131. [Google Scholar] [CrossRef]
- Huete, A.; Didan, K.; Miura, T.; Rodriguez, E.P.; Gao, X.; Ferreira, L.G. Overview of the radiometric and biophysical performance of the MODIS vegetation indices. Remote Sens. Environ. 2002, 83, 195–213. [Google Scholar] [CrossRef]
- Jordan, C.F. Derivation of leaf area index from quality of light on the forest floor. Ecology 1969, 50, 663–666. [Google Scholar] [CrossRef]
- Deering, D.W. Rangeland reflectance characteristics measured by aircraft and spacecraft sensors. Ph.D. Dissertation, Texas A & M University, College Station, TX, USA, 1978; p. 338. [Google Scholar]
- Hatfield, J.L.; Asrar, G.; Kanemasu, E.T. Intercepted photosynthetically active radiation estimated by spectral reflectance. Remote Sens. Environ. 1984, 14, 65–75. [Google Scholar] [CrossRef]
- Wiegand, C.L.; Maas, S.J.; Aase, J.K.; Hatfield, J.L.; Pinter, P.J., Jr.; Jackson, R.D.; Kanemasu, E.T.; Lapitan, R.L. Multisite analyses of spectral-biophysical data for wheat. Remote Sens. Environ. 1992, 42, 1–21. [Google Scholar] [CrossRef]
- Wiegand, C.L.; Gerbermann, A.H.; Gallo, K.P.; Blad, B.L.; Dusek, D. Multisite analyses of spectral-biophysical data for corn. Remote Sens. Environ. 1990, 33, 1–16. [Google Scholar] [CrossRef]
- Huete, A.R. A soil-adjusted vegetative index (SAVI). Remote Sens. Environ. 1988, 25, 295–309. [Google Scholar] [CrossRef]
- Merzlyak, M.N.; Gitelson, A.A.; Chivkunova, O.B.; Rakitin, V.Y. Non-destructive optical detection of leaf senescence and fruit ripening. Physiol. Plant. 1999, 106, 135–141. [Google Scholar] [CrossRef]
- Gitelson, A.A.; Gritz, U.; Merzlyak, M.N. Relationships between leaf chlorophyll content and spectral reflectance and algorithms for non-destructive chlorophyll assessment in higher plant leaves. J. Plant Physiol. 2003, 160, 271–282. [Google Scholar] [CrossRef] [PubMed]
- Gitelson, A.A.; Viña, A.; Rundquist, D.C.; Ciganda, V.; Arkebauer, T.J. Remote estimation of canopy chlorophyll content in crops. Geophys. Res. Lett. 2005, 32. [Google Scholar] [CrossRef]
- Peñuelas, J.; Gamon, J.A.; Fredeen, A.L.; Merino, J.; Field, C.B. Reflectance indices associated with physiological changes in nitrogen- and water-limited sunflower leaves. Remote Sens. Environ. 1994, 48, 135–146. [Google Scholar] [CrossRef]
- Blackburn, G.A. Quantifying chlorophylls and carotenoids at leaf and canopy scales: an evaluation of some hyperspectral approaches. Remote Sens. Environ. 1998, 66, 273–285. [Google Scholar] [CrossRef]
- Zarco-Tejada, P.J.; Ustin, S.L.; Whiting, M.L. Temporal and spatial relationships between within-field yield variability in cotton and high-spatial hyperspectral remote sensing imagery. Agron. J. 2005, 97, 641–653. [Google Scholar] [CrossRef]
- Daughtry, C.S.T.; Walthall, C.L.; Kim, M.S.; de Colstrum, E.B.; McMurtrey, J.E., III. Estimating corn leaf chlorophyll concentration from leaf and canopy reflectance. Remote Sens. Environ. 2000, 74, 229–239. [Google Scholar] [CrossRef]
- Rougean, J.-L.; Breon, F.M. Estimating PAR absorbed by vegetation from bidirectional reflectance measurements. Remote Sens. Environ. 1995, 51, 375–384. [Google Scholar] [CrossRef]
- Sripada, R.P.; Farrer, D.C.; Weisz, R.; Heninger, R.W.; White, J.G. Aerial color infrared photography to optiminze in-season nitrogen fertilizer recommendations in winter wheat. Agron. J. 2007, 99, 1424–1435. [Google Scholar] [CrossRef]
- Teal, R.K.; Tubana, B.; Girma, K.; Freeman, K.W.; Arnall, D.B.; Walsh, O.; Ruan, W.R. In-season prediction of corn grain yield potential using nomrlaized difference vegetation index. Agron. J. 2006, 98, 1488–1494. [Google Scholar] [CrossRef]
- Lee, Y.; Yang, C.; Chang, K.; Shen, Y. A simple spectral index using reflectance of 735 nm to assess nitrogen status of rice canopy. Agron. J. 2008, 100, 202–212. [Google Scholar] [CrossRef]
- Shanahan, J.F.; Schepers, J.S.; Francis, D.D.; Varvel, G.E.; Wilhelm, W.W.; Tringe, J.M.; Schlemmer, M.R.; Major, D.J. Use of remote-sensing imagery to estimate corn grain yield. Agron. J. 2001, 93, 583–589. [Google Scholar] [CrossRef]
- Vina, A.; Gitelson, A.A.; Rundquist, D.C.; Keydan, G.; Leavitt, B.; Schepers, J. Monitoring maize (Zea mays L.) phenology with remote sensing. Agron. J. 2004, 96, 1139–1147. [Google Scholar] [CrossRef]
- User’s Guide Statistics, Version 6; SAS Institute: Cary, NC, USA, 1996.
- Ritchie, S.W.; Hanway, J.J. How a Corn Plant Develops, Special Report 48; Iowa State University of Science and Technology Cooperative Extension Service: Ames, IA, USA, 1982.
- Gitelson, A.A.; Kaufman, Y.J.; Stark, R.; Rundquist, D. Novel algorithms for remote estimation of vegetation fraction. Remote Sens. Environ. 2002, 80, 76–87. [Google Scholar] [CrossRef]
- Haboudane, D.; Miller, J.R.; Pattey, E.; Zarco-Tejada, P.J.; Strachan, I. Hyperspectral vegetation indices and novel algorithms for predicting green LAI of crop canopies: modeling and validation in the context of application to precision agriculture. Remote Sens. Environ. 2004, 90, 337–352. [Google Scholar] [CrossRef]
- Jackson, R.D.; Huete, A.R. Interpreting vegetation indices. Prev. Vet. Med. 1991, 11, 185–200. [Google Scholar] [CrossRef]
- Rondeaux, G.; Steven, M.; Baret, F. Optimization of soil-adjusted vegetation indices. Remote Sens. Environ. 1996, 55, 95–107. [Google Scholar] [CrossRef]
- Mention of a specific tradename, product, or manufacturer does not imply endorsement or preferential treatment by USDA-ARS.
© 2010 by the authors; licensee Molecular Diversity Preservation International, Basel, Switzerland. This article is an open-access article distributed under the terms and conditions of the Creative Commons Attribution license (http://creativecommons.org/licenses/by/3.0/).