Highlights
What are the main findings?
- A rice canopy nitrogen inversion model based on multi-angle polarization hyperspectral data was constructed, and the test set R2 reached 0.8274.
What are the implications of the main findings?
- Compared with single-angle observations, the provided remote sensing method monitors rice nitrogen content more accurately.
Abstract
Nitrogen is one of the essential nutrient elements that affect rice growth, yield, and quality formation. Accurate and timely estimation of rice nitrogen status is fundamental for precision fertilization in agricultural fields. Hyperspectral remote sensing technology provides a promising approach for rapid and accurate acquisition of nitrogen status of rice in the field. However, traditional single-angle hyperspectral observations are easily disturbed by factors such as canopy structure, light direction, and background reflection, limiting their inversion accuracy and stability. This study is based on multi-angle polarimetric hyperspectral data obtained from an unmanned aerial vehicle platform. It extracts features from multi-angle polarimetric spectra based on three algorithms: successive projections algorithm (SPA), competitive adaptive reweighted sampling, and relevant features. The input weight and hidden layer bias of the extreme learning machine (ELM) model were optimized by the whale optimization algorithm (WOA) and caterpillar fungus optimization algorithm (CFO), taking the sensitive band of optimal viewing angle as input. Finally, an inversion model of rice canopy nitrogen content (CNC) based on multi-angle polarization hyperspectral data was established. The results demonstrate that the inversion results of the combination of SPA-(30°) + SPA-(45°) observation angles and feature selection methods are optimal, and multi-angle fusion significantly improves the model’s ability to characterize CNC, with higher stability and accuracy than single-angle modeling. The R2 of CFO-ELM on the training set and test set reach 0.8553 and 0.8274, respectively, which is significantly better than the original ELM and WOA-ELM, becoming the optimal CNC inversion model in this study. The rice CNC inversion model based on multi-angle polarimetric hyperspectral data constructed in this study provides a specific reference for the rapid detection of rice CNC.
1. Introduction
Rice, as one of the globally important food crops, accounts for about one-fourth of the total area of food crops planted in China, and its yield accounts for more than one-third of the total national grain output, making it the first major staple crop in China [1]. Nitrogen is a fundamental constituent in the composition of rice leaf chlorophyll, proteins, and other substances, and its availability directly influences the photosynthetic efficiency, dry matter accumulation, and transport process of rice [2]. Consequently, achieving precise management of rice nitrogen nutrition is the core link to achieving high yield and quality goals and has a decisive role in the final yield and quality formation.
Traditional nitrogen diagnosis relies on field sampling coupled with chemical analysis. However, this approach is inherently destructive; hysteresis and limited representativeness of sampling points make it difficult to meet the high timeliness monitoring requirements of large-scale rice production [3]. Unmanned aerial vehicle (UAV) remote sensing technology, with its macroscopic, dynamic, and non-contact detection advantages, provides a feasible way to solve this problem [4]. Among them, hyperspectral remote sensing technology, with its ‘integration of spectrum and image’ and high hyperspectral resolution characteristics, can capture the subtle spectral response caused by changes in the biochemical component content of crops, showing great potential in the field of rice nitrogen monitoring [5]. However, due to the unique flooding environment during the rice growth period, the canopy UAV remote sensing monitoring faces a complex water body background, and the shallow water surface of the paddy field is prone to producing strong, mirror-like reflection phenomena, with high brightness values that easily overwhelm relatively weak vegetation spectral characteristics [6]. In particular, the rice canopy is a three-dimensional scene with a complex spatial structure. The dynamic changes in rice leaf orientation, row structure, and sun–sensor geometric relationships lead to significant anisotropy in the intensity of reflected light. Traditional single-perspective observation is easily affected by hot spot effects or shadow occlusion, making it difficult to fully characterize the actual state of the rice canopy [7].
Polarized spectral technology is an advanced new spectral measurement method. Its core purpose is to measure the polarization characteristics of light waves, effectively stripping the mirror-reflection component from the reflected spectrum, thereby obtaining more representative spectral information of the rice canopy material composition, providing a promising pathway to improving the accuracy of nitrogen inversion [8]. However, the canopy structure of rice is complex, and there are significant differences in the spectral and polarization responses under different observation geometries, making it difficult for a single observation angle to fully characterize the optical properties of the canopy. UAV multi-angle polarization observation, by obtaining the polarization spectral information of the rice canopy from multiple measurement perspectives (such as forward, backward, and nadir), can fully describe the directional characteristics of the canopy hyperspectral reflectance during the key growth stages of rice [9]. This multi-dimensional data helps to construct a bidirectional reflectance distribution function (BRDF) model with stronger physical constraints, correct the influence of the angle effect on the inversion results, and enhance the robustness and universality of the UAV remote sensing rice nitrogen estimation model [10]. Therefore, the UAV remote sensing technology integrating polarization characteristics and multi-angle observation is one of the essential methods for reducing the dual challenges of special water-body background interference and complex canopy structure in rice fields and achieving accurate remote sensing inversion of rice nitrogen.
This study aims to improve the inversion accuracy of rice canopy nitrogen content (CNC) by combining UAV hyperspectral remote sensing technology with polarimetric measurement technology. Multi-angle observations are adopted to obtain polarimetric hyperspectral reflectance after separating mirror-reflection information from hyperspectral data. Based on polarimetric hyperspectral data from different angles, various feature-extraction algorithms are used to select feature wavelengths, and multiple machine learning models are constructed by integrating feature wavelengths. The best model combination is chosen to build a rice CNC inversion model in order to provide a theoretical basis for the rapid detection of rice CNC.
2. Materials and Methods
2.1. Design of Rice Field Experiments
This study experiment was conducted over three years (2023, 2024, and 2025), with trials conducted from June to September 2023 and 2024 at the Haicheng Training Base of Shenyang Agricultural University in Gengzhuang Town, Haicheng City, Liaoning Province (40°58′45.39″N, 122°43′47.0064″E). Trials were also conducted from June to September 2025 at the Rice Research Institute in Sujiatun District, Shenyang City, Liaoning Province (123°18′27.09″E, 41°38′28.11″N). The rice was transplanted mechanically with a uniform planting pattern of 30 cm row spacing and 16–18 cm plant spacing, which represents the typical cultivation practice in the region and ensures a consistent canopy structure for UAV-based remote sensing observations. During all experimental periods, the paddy fields were maintained under flooded conditions with a consistent shallow water layer of approximately 3–5 cm, following the standard local agronomic practices for the tillering and jointing stages of rice. This approach minimizes the influence of variable water background reflectance on the canopy spectra.
The rice variety used in the 2023 and 2024 experiments was ‘Shennong 9816’, which has a total growth duration of approximately 157 days from sowing to maturity. The main agronomic traits of this variety include a plant height of approximately 100 cm, a spike grain number of 139.1 grains, and a 1000-grain weight of 22.6 g. A total of 15 sampling fields (numbered from small 1 to small 15) were set up, as shown in Figure 1. No nitrogen fertilizer gradient was set in the entire field. The nitrogen fertilizer application scheme was base fertilizer 110.3 kg/ha, tillering fertilizer 66.2 kg/ha, and ear fertilizer 44.1 kg/ha. Application rates of phosphorus and potassium fertilizers followed the local standards of 144 kg/hm2 and 192 kg/hm2, respectively. All phosphorus and potassium fertilizers were applied as base fertilizers at one time, and phosphorus and potassium fertilizers were not applied later. The 2024 experiment selected ‘Jindaoxiang 103’ as the test variety, with sampling areas in field 7 and field 8. The experiment also did not set a nitrogen fertilizer gradient, with nitrogen fertilizer application rates of 137.8 kg/ha for base fertilizer, 82.7 kg/ha for tillering fertilizer, and 55.1 kg/ha for ear fertilizer. The field management measures in each plot were kept consistent, and phosphorus and potassium fertilizers were applied according to local standards. The key regulation period of nitrogen nutrition in rice is mainly concentrated in the vegetative growth period and the early reproductive growth period. From the tillering stage to the heading stage, it covers the complete key process of nitrogen absorption, accumulation and transport in rice, and it is the best period to construct a physiologically significant nitrogen inversion model [11]. In the main growth stage of rice, canopy nitrogen content usually does not suddenly change drastically in a short period of time, and the 7-day interval is sufficient to capture the trend of nitrogen dynamic change [12]. Therefore, field sampling was conducted from the tillering stage to the heading stage, with sampling every 7 days. During each sampling, 3 representative rice plants were selected from each test plot, and their nitrogen content was measured. The average of the three samples taken from each plot was used as the nitrogen content of that plot. A systematic random sampling method was employed during sample selection. In each cell, five sampling points were set at equal distances along the diagonal direction to ensure the spatial variation in the covered cell. A total of 5 candidate plants were obtained by randomly selecting one plant within 1 m near each sampling point. From these five candidate plants, three plants were randomly selected as final samples for nitrogen content determination.
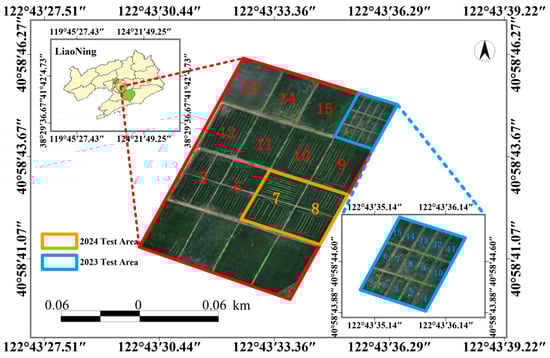
Figure 1.
Design of the Haicheng experimental rice field area. Different numbers in the red line represent the cell number of Haicheng Experimental Area. The fields used in this study were No. 7 and No. 8 in 2024, and the area divided by the blue box line in 2023, divided into 15 small fields.
In the 2025 experiment, ‘Liao Geng 327’ and ‘Liao You 2868’ were selected as research materials, with the distribution of the experimental plots shown in Figure 2. The individual plot of AN1–5 had an area of 555 m2; each plot of BN1–5 had an area of 600 m2. A gradient of five nitrogen (N) application rates was established, with treatment N3 (220 kg·hm−2) representing the locally recommended standard fertilization rate. The other four treatments were set at −40%, −20%, +20%, and +40% relative to N3, representing low, medium-low, medium-high, and high nitrogen levels, respectively. The specific nitrogen application rates for each treatment were as follows: N1 = 132 kg·hm−2, N2 = 176 kg·hm−2, N3 = 220 kg·hm−2, N4 = 264 kg·hm−2, and N5 = 308 kg·hm−2. For all treatments, the ratio of base fertilizer, tillering fertilizer, and panicle fertilizer was consistently maintained at 5:3:2. In addition to the nitrogen fertilizer gradient, the application amounts of phosphorus fertilizer and potassium fertilizer in each plot were the same. They were applied during the regreening and tillering stages. The field management strategies for all experimental plots were consistent. Table 1 summarizes the division of rice growth stages and UAV data collection time during the annual experiment period. Although the three-year experiment was carried out in two different bases, the growth process was consistent, following the typical growth law of a single-cropping rice area in Northeast China. UAV multi-angle polarization hyperspectral data were collected at key growth stages, such as the tillering stage, the jointing stage and the heading stage, to capture the dynamic changes in rice canopy nitrogen content.
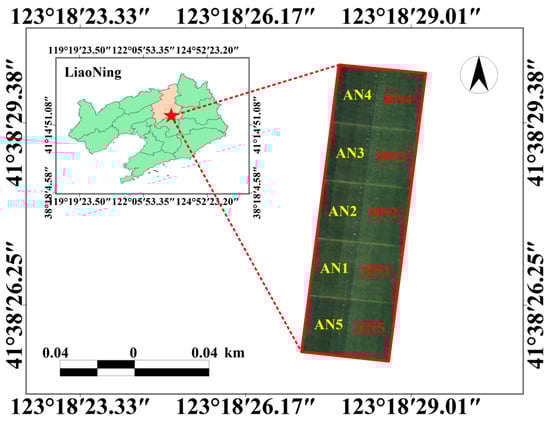
Figure 2.
Design of the Sujiatun experimental rice field area.

Table 1.
Rice growth stages and UAV data acquisition dates during the 2023–2025 experimental periods.
2.2. Data Collection
2.2.1. Unmanned Aerial Vehicle Multi-Angle Polarized Spectral Measurement
The UAV platform employed in this study was a M600 PRO hexacopter (Shenzhen DJI Innovations, Shenzhen, China) equipped with a hyperspectral imaging system. The flight altitude was set to 100 m, the platform was equipped with a Nais circular polarizing filter, and 9 different hyperspectral remote sensing system observation angles were selected (−90°, ±75°, ±60°, ±45°, and ±30°, where ‘−’ indicates the backward scattering direction, ‘0°’ represents the vertical direction, and ‘+’ represents the forward scattering direction), respectively obtaining hyperspectral reflectance information and polarized hyperspectral reflectance information were obtained. To ensure the stability of the camera attitude during multi-angle observation and to eliminate the influence of changes in the flight attitude of the UAV on the observation angle, the camera was connected to the UAV through the pan/tilt, as shown in Figure 3. The control accuracy of the tripod could reach within 0.1°, which fully meets the requirements of multi-angle hyperspectral data acquisition for angular stability. The spectral range of the hyperspectral camera was 400–1000 nm, with a total of 176 bands. As shown in Figure 4, the measurement of two spectral reflectance values must be completed within 0.5 h. The relatively stable weather conditions, superior lighting conditions and smaller wind speed at noon ensured both the stability of lighting and the stability of the drone’s flight. At noon, the solar altitude angle is high and the lighting conditions are stable, which can effectively reduce the interference of canopy shadow on spectral measurement. According to the latitude and longitude of the test site and the specific date and time of each flight, it can be calculated that the approximate range of the solar zenith angle is 25–40°, and the corresponding solar altitude angle is 50–65°. Therefore, the time period from 10 a.m. to 11 a.m. was used as the spectral data collection time for the drone. Using the ENVI5.3 software tool, the spectral images collected were extracted. To ensure that the extracted data could more accurately reflect the spectral reflectance information of the rice canopy, the average spectral reflectance near each plot label was calculated as a characterization.
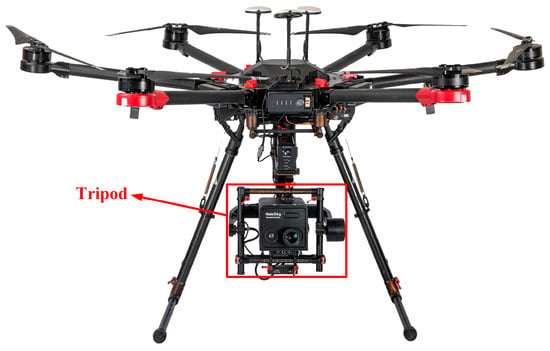
Figure 3.
UAV platform integration with hyperspectral camera and tripod system.
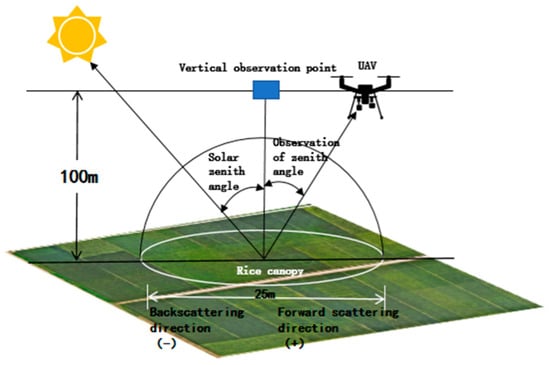
Figure 4.
Schematic diagram of multi-angle observation of rice canopy based on drones.
2.2.2. Spectral Data Preprocessing
Due to the limitations of the equipment itself, the hyperspectral reflectivity data obtained by the UAV was often not band data with an interval of 1 nm. Therefore, in order to facilitate subsequent calculations, the hyperspectral data was first resampled with a sampling interval of 1 nm. Considering the complex environment of rice field features, the spectral reflectivity of the rice canopy collected by drones is affected by various factors such as ground features and water background, resulting in varying degrees of data noise. The raw spectral data contain a large amount of redundancy, repetition, and information that is overly sensitive to the research objectives. These characteristics can interfere with subsequent data processing and reduce the accuracy of the inversion model. Therefore, in order to improve the quality of spectral data, it was necessary to smooth and reduce the noise of the obtained hyperspectral reflectance of the UAV, thereby reducing the interference of irrelevant information on the spectral reflectance and improving the quality of the spectral data. In this study, Savitzky–Golay (SG) smoothing was used to smooth the hyperspectral reflectance, eliminate the influence of background noise on the target information, maximize the mining of hyperspectral data information, and improve prediction accuracy. The formula of the SG convolution smoothing algorithm is shown in Equation (1). The spectra before and after SG smoothing are shown in Figure 5. In Figure 5, m is set to 4, and l in from −4 to 4 consists of a total of 9 coefficients, .
where is the spectral data after SG smoothing, m is the number of iterations, is the original data, is the filter coefficient, and N is the normalization index.
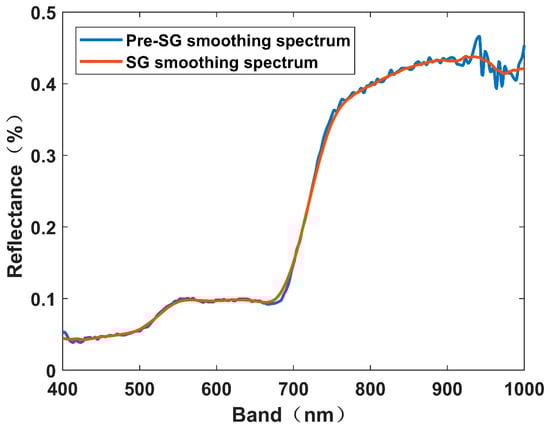
Figure 5.
Comparison of reflectivity spectra before and after Savitzky–Golay smoothing.
The first derivative transform and the second derivative transform were used to eliminate the noise influence of environmental background on rice canopy spectrum and to amplify the spectral difference in the visible light region:
where is the reflectance value at wavelength band and is the difference between adjacent wavelength bands.
2.2.3. Nitrogen Concentration Measurement
At each sampling point within the experimental plots, destructive sampling was performed by collecting all plants from an entire rice hill to obtain a representative sample for nitrogen content analysis. All fresh leaf samples were immediately placed in an oven at 105 °C for 30 min to deactivate enzymes, followed by drying at 80 °C to a constant weight. Based on the ground powder, the rice CNC (mg/g) was detected using the Kjeldahl nitrogen method. The measurement procedure was as follows:
Weigh approximately 2 g (accurate to 0.0001 g) of the leaf sample, which has been dried, pulverized and passed through a 0.5 mm sieve, and place it in a Kjeldahl digestion tube. Sequentially, 0.4 g of copper sulfate and 6 g of potassium sulfate were added to increase the boiling point of the digestion solution, and 20 mL of sulfuric acid was added slowly. The digestion pipe was placed on the digestion furnace, and the digestion was performed by heating in the fume hood. The digestion tube was placed obliquely and heated slowly in the initial stage until the sample was completely carbonized to avoid large foam spillage. After the foam in the digestion liquid disappeared, the temperature was raised to a slightly boiling state, and the heating was continued until the digestion liquid became a clear blue-green. Heating was continued for 30–60 min to ensure complete conversion of organic nitrogen to ammonium sulfate. The whole digestion process took about 2–3 h. After the digestion was cooled, 20 mL of water was added and poured into a 100 mL volumetric flask. Small glass beads, methyl red ethanol solution and dilute sulfuric acid (pH < 7) were added to the steam generator and heated to produce full water vapor. Then, 10 mL of boric acid solution was added to the receiving bottle, the end of the condenser tube was immersed in boric acid, and 10 mL of the digestion solution was sucked into the reaction chamber. Next, 10 mL of 40% NaOH solution was added, tightly sealed and distilled for 10 min. The end of the condenser tube and the liquid surface were then separated and distilled for another 1 min. Finally, the receiving bottle was removed, the lower end of the condenser tube was cleaned, and the cleaning solution was combined and titrated with an automatic potentiometric titrator while a blank experiment was conducted. The rice CNC was explicitly calculated according to the following formula:
where represents the volume of sulfuric acid solution in the blank test, represents the volume of sulfuric acid solution in the sample, N represents the concentration of the sulfuric acid solution, and represents the mass of the sample.
Through field experiments in three consecutive growing seasons in 2023, 2024, and 2025, a total of 420 rice CNC samples were collected. Prior to modeling, all samples and their corresponding hyperspectral data were subjected to rigorous quality control. Samples were discarded if they exhibited any of the following issues: (1) physical damage during sampling; (2) negative reflectance values in the simultaneously acquired hyperspectral data; (3) distorted spectral curves; or (4) significant inconsistencies between spectral measurements and field records. Following this screening, 15 samples were excluded, leaving 405 valid samples for subsequent analysis. Based on this data, the Kennard–Stone algorithm was used to divide the samples into training and test sets in a ratio of 7:3. This algorithm is a uniform sampling method of sample space based on Euclidean distance. The core idea is to select the samples with the most uniform distribution in the feature space as the training set to ensure that the training samples cover the entire sample space to the maximum extent, thereby improving the generalization ability of the model. The study was divided according to the ratio of 7:3, i.e., 70% of the sample was used for model construction and parameter optimization and 30% of the sample was used for independent verification of model performance. The statistical results of the rice CNC are shown in Table 2.
Table 2.
Statistical results of rice canopy nitrogen content.
2.3. Solar Angle Correction of Spectral Data
Within the 30 min flight window, the change of the solar zenith angle can be calculated by:
where is the time interval (minutes) and is the local latitude.
To correct for the BRDF effect caused by this change, we used a modified empirical BRDF normalization model to normalize the spectral reflectance acquired at different moments to the reference solar zenith angle (θref = 45°). The correction formula is as follows:
Among them, is the original observed reflectance, is the corrected reflectance, and is the BRDF normalization factor, which is obtained by fitting the measured multi-angle observation data.
In view of the difference in the solar angle during data collection in different years and different growth periods from 2023 to 2025, we used the cosine value () of the solar zenith angle as an auxiliary feature and input it into the machine learning model together with spectral features, allowing the model to automatically learn and absorb the nonlinear effects caused by changes in the solar angle.
2.4. Feature Selection Methods
To reduce the dimensionality of UAV polarimetric hyperspectral data, eliminate the interference of redundant information, and enhance the modeling efficiency, this study adopted the successive projections algorithm (SPA), competitive adaptive reweighted sampling (CARS), and relevant features (Relief) to select the characteristic wavelengths of polarimetric hyperspectral data at various angles to reduce wavelengths while eliminating redundant information.
SPA aims to minimize collinearity in the vector space and preliminarily compress high-dimensional spectral information through a forward band selection strategy [13]. Then, it carefully selects the contribution values of different bands to CNC, removes wavelengths without sensitivity, and simplifies the complexity of data processing. This algorithm can choose the unique features of all bands, effectively reduce the high correlation between variables, establish a relatively concise and non-redundant combination of wavelengths, achieve dimensionality compression of data, and thus significantly reduce the number of bands required for model construction [14]. Principal component analysis (PCA) was also considered for feature extraction in this study. However, the principal components generated by PCA are linear combinations of the original spectral bands, which lose the physical interpretability of specific wavelengths [15]. In contrast, SPA selects actual wavelengths, preserving their physiological relevance to rice nitrogen content. Therefore, this study finally selected SPA as one of the feature selection methods.
CARS is an efficient feature extraction algorithm that simulates the ‘competition’ and ‘adaptation’ mechanisms in the process of biological evolution, performs adaptive evaluation and selection of features, effectively removes redundant and irrelevant features, and improves the predictive performance of the model [16]. CARS has the advantages of simple operation and stable and reliable results and provides a favorable tool for the processing and analysis of complex data.
Relief is a method for calculating the size of feature weight values, which is usually based on two-class problems for feature selection, assigning different weight values to each feature according to their importance for classification. Its main idea is to determine feature weights based on the ability to distinguish adjacent samples [17].
This study selected characteristic bands of CNC under different angles using the above three algorithms for the construction of subsequent CNC inversion models.
2.5. Inversion Model Construction
Extreme learning machine (ELM) is a learning algorithm used to solve single-hidden-layer feedforward neural networks. Compared with traditional machine learning methods, the ELM model has a faster learning speed and significant advantages in dealing with high-dimensional nonlinear problems. Its core idea lies in randomly initializing the connection weights between the input layer and the hidden layer, as well as the bias of the hidden neurons, and adjusting the number of neurons in the hidden layer is only needed during the model training process [18]. This algorithm can be abbreviated as the formula shown in Equation (7):
where is the output of the ELM model, is the number of neurons in the hidden layer, and are the weights from the input layer to the hidden layer and from the hidden layer to the output layer, is the input layer data, is the bias of the k-th neuron, and is the activation function of the hidden layer neurons.
To enhance the accuracy of rice CNC inversion, this study constructed a CNC inversion model based on multi-angle polarization information fusion. Based on the band selection results of different feature selection algorithms, an ELM model was used to build a rice CNC inversion model under a single angle. According to the inversion results of CNC under a single angle, the best three inversion models corresponding to the spectral angles and feature bands were selected for integration to construct a rice CNC inversion model that fuses multi-angle polarization spectral information. The WOA [19] and CFO [20] were used to optimize the rice CNC inversion model with multi-angle polarization spectral information, and the optimal inversion model was selected. The specific optimization process was as follows:
- (1)
- The spectral characteristics of the training set were defined as input X, and the corresponding canopy nitrogen content was taken as output Y.
- (2)
- In the ELM model, the input weight and hidden layer threshold were randomly generated, and the output weight was directly calculated.
- (3)
- Taking the input weight and hidden layer threshold of ELM as optimization variables, and aiming at minimizing the prediction error of the training set, the WOA and CFO algorithms were used to search for the optimal parameter combination, respectively.
- (4)
- The optimized model parameters were obtained, and the final inversion model was established on the training set.
To further evaluate the stability of the model, 5-fold cross-validation was performed within the training set: the training set was randomly divided into 5 parts, with 4 of them used for training and 1 for verification in turn. Five iterations were performed. The cross-validation results were used to guide model selection and parameter optimization.
2.6. Model Evaluation Indicators
To evaluate the fitting accuracy and estimation ability of the inversion model, the inversion model for rice CNC was evaluated according to the values of the coefficient of determination (R2) and the root mean square error (RMSE). R2 was used to assess the fitting degree between the actual value and the predicted value, with a value range of [0, 1]. The closer the value was to 1, the better the fitting effect of the model. Generally speaking, 0~0.09 indicated no correlation, 0.1~0.3 indicated a weak correlation, 0.3~0.5 indicated a moderate correlation, and 0.5~1.0 indicated a strong correlation. RMSE was used to quantify the deviation between the actual value and the predicted value, and the smaller the value, the better the fitting effect of the model. The formulas for calculating R2 and RMSE are shown in Equations (8) and (9):
where and denote the simulated value and actual value, respectively; represents the average value of the actual value; n represents the sample size; and SD represents the standard deviation of the actual value. The larger the RPD value, the better the model prediction results.
3. Results
3.1. Spectral Reflectance Characteristics of Rice Canopy Under Different Observation Angles
In order to visually show the spectral characteristics of rice canopy at different observation angles, the average reflectance spectra were calculated using all 405 valid samples collected from the 2023–2025 growing seasons. These samples encompassed three key growth stages (tillering, jointing, and heading) and all nitrogen application rates. The spectra presented in Figure 6 have been processed with Savitzky–Golay smoothing. It can be seen from Figure 6 that the spectral curves at all observation angles show typical vegetation spectral characteristics. In the visible band (400–700 nm), due to the strong absorption of chlorophyll, the reflectivity is low, and a small “green peak” appears near 550 nm. In the near-infrared band (700–1000 nm), the reflectivity increases significantly due to multiple scattering from the internal structure of the blade, forming a steep rising region of “red edge”. With the observation zenith angle changing from −90° to −75°, −60° and other inclination angles, the reflectivity of the visible light band gradually decreases, while that of the near-infrared band gradually increases. This is mainly because oblique observation increases the penetration path of light rays inside the canopy and enhances the detection of canopy structure information.
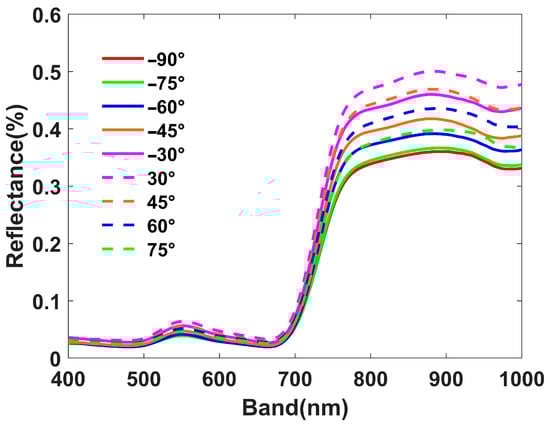
Figure 6.
Average reflectance spectra of rice canopy at different angles.
3.2. Selection Results of Nitrogen Spectral Characteristics Under Different Angles
3.2.1. Polarized Hyperspectral Wavelength Selection for Rice Canopy Nitrogen Content Based on SPA
Based on hyperspectral data observed from different angles, the SPA algorithm was applied to screen the feature wavelength variable subset to determine the optimal number of feature wavelength combinations, as shown in Figure 7. It can be seen that when the number of variables was five, RMSE = 0.555 mg/g reached the minimum and tended to stabilize during observation at −90° (zenith direction); therefore, the number of variables corresponding to RMSE = 0.555 mg/g was selected as the optimal wavelength combination for observation at −90°. When observed at −75°, when the number of variables was seven, RMSE = 0.452 mg/g reached the minimum and tended to stabilize; therefore, the number of variables corresponding to RMSE = 0.452 mg/g was selected as the optimal wavelength combination for observation at −75°. Finally, this section determined the optimal feature wavelength combinations for nine observation angles, as shown in Table 3.
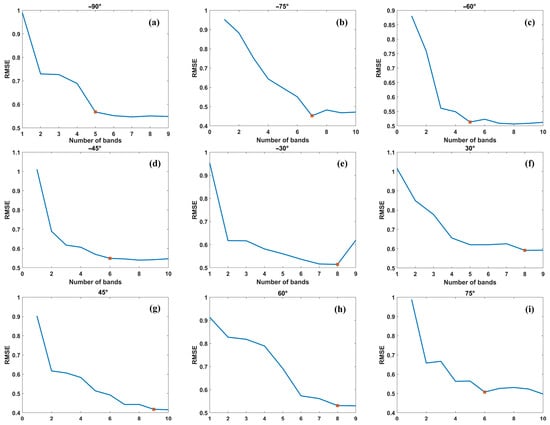
Figure 7.
Number of hyperspectral feature bands selected from different angles based on successive projection algorithm. (a) Number of spectral characteristic bands at −90°; (b) Number of spectral characteristic bands at −75°; (c) Number of spectral characteristic bands at −60°; (d) Number of spectral characteristic bands at −45°; (e) Number of spectral characteristic bands at −30°; (f) Number of spectral characteristic bands at 30°; (g) Number of spectral characteristic bands at 45°; (h) Number of spectral characteristic bands at 60°; (i) Number of spectral characteristic bands at 75°.
Table 3.
Feature wavelength selection results under different observation angles based on successive projections algorithm.
3.2.2. Polarized Hyperspectral Wavelength Selection of Rice Canopy Nitrogen Content Based on Competitive Adaptive Reweighted Sampling
The CARS algorithm was employed to extract characteristic wavelengths from the polarized hyperspectral data. The number of Monte Carlo samplings in the CARS algorithm was set to 200, and the 5-fold cross-validation method was applied to evaluate the selection process. The polarized hyperspectral characteristic wavelengths were extracted according to the RMSE of the cross-validation (RMSECV) value of each CARS algorithm operation result and the variable regression coefficient. Figure 8 shows the result of extracting characteristic wavelengths using the CARS algorithm at an observation angle of −90 degrees. It can be seen that when the number of samplings reaches 58, the RMSECV of the model reaches the minimum value, thus extracting nine characteristic wavelengths of rice canopy polarized hyperspectral. The first figure of Figure 8 shows the variation law of the number of sampling variables, which presents an obvious exponential decay law with the number of runs. The second figure of Figure 8 shows the variation law of the residual RMSECV after the interaction test, reflecting that the RMSECV value first decreases and then increases with the increase in the number of sampling runs. As the RMSECV value gradually decreases, redundant information in the polarized hyperspectral data is effectively removed; conversely, key information in the polarized hyperspectral data is removed during the screening process. The third figure of Figure 8 shows the variation in each variable’s regression coefficient with the number of iterations during the RMSECV minimization process. The vertical line in the figure indicates that the sampling run time is 58 when the RMSECV reaches the minimum value. Considering the slight differences in the calculation results of the algorithm each time, to achieve the construction of the polarized hyperspectral vegetation index and the establishment of the inversion model of rice CNC in the subsequent research, this study used the CARS algorithm to extract characteristic wavelengths of polarized hyperspectral data, ran a total of 30 times, and sorted the characteristic wavelengths extracted from each result according to the number of repetitions. Finally, nine characteristic wavelengths with a high repetition rate were selected for subsequent calculations. By this method, we finally obtained nine characteristic wavelengths under different observation angles, as shown in Table 4.
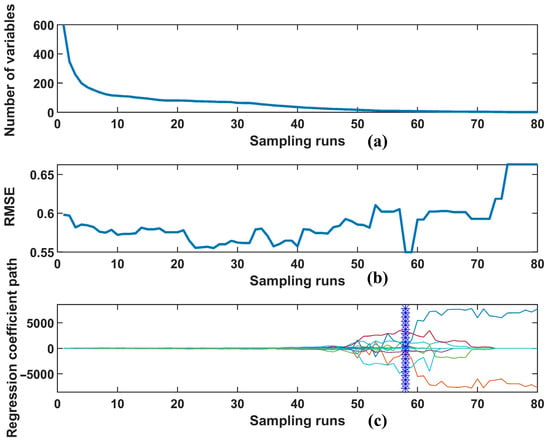
Figure 8.
Feature wavelength extraction results of competitive adaptive reweighted sampling under −90° angle. (a) Variation of the number of variables with the sampling runs; (b) Variation of the RMSE with the sampling runs; (c) Variation of the regression coefficient path with the sampling runs.
Table 4.
Feature wavelength selection results under different observation angles based on the competitive adaptive reweighted sampling algorithm.
3.2.3. Polarized Hyperspectral Feature Wavelength Selection Based on Relief for Rice Canopy Nitrogen Content
To obtain the weight coefficient map of wavelengths using the Relief algorithm, the hyperspectral reflectance of rice samples collected at different angles and the corresponding CNC were input into the Relief algorithm to obtain the weight coefficients of each band, as shown in Figure 9. It is noteworthy that to eliminate data redundancy, the local maximum values in the weight coefficient map of spectral reflectance bands were selected as the characteristic bands for inversion of CNC, so that the chosen bands contain not only features favorable for CNC inversion but also more information [21]. We determined the characteristic bands selected at each angle based on the weight coefficients in Figure 9, as shown in Table 5. It can be seen that there are differences in the selection of characteristic bands at different angles.
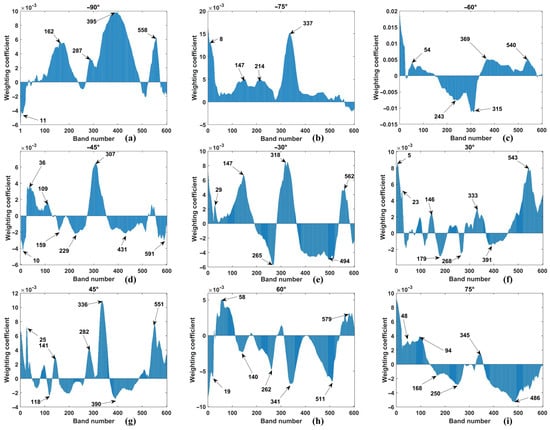
Figure 9.
Weight coefficients of hyperspectral under different angles. (a) Weighting coefficients at −90°; (b) Weighting coefficients at −75°; (c) Weighting coefficients at −60°; (d) Weighting coefficients at −45°; (e) Weighting coefficients at −30°; (f) Weighting coefficients at 30°; (g) Weighting coefficients at 45°; (h) Weighting coefficients at 60°; (i) Weighting coefficients at 75°.
Table 5.
Feature wavelength selection results under different observation angles based on the Relief algorithm.
3.3. Comparison and Analysis of Rice Nitrogen Content Inversion Models Based on Single-Angle Polarized Hyperspectral Data
In this study, three different feature selection algorithms were employed to reduce the dimensionality of polarized hyperspectral data under nine different observation angles (−90°, −75°, −60°, −45°, −30°, 30°, 45°, 60°, and 75°), forming a total of 27 groups of modeling data for rice CNC. The sample data were split into training and test sets in a ratio of 7:3. The inversion results of rice CNC based on ELM under the 27 groups of single-angle polarimetric hyperspectral samples are shown in Figure 10 and Figure 11. Overall, there are significant differences in the fitting effects of rice CNC between different observation angles and different feature selection methods, which preliminarily prove that selecting an appropriate observation angle and the feature bands after dimensionality reduction are the key to improving the inversion accuracy of rice CNC [22].
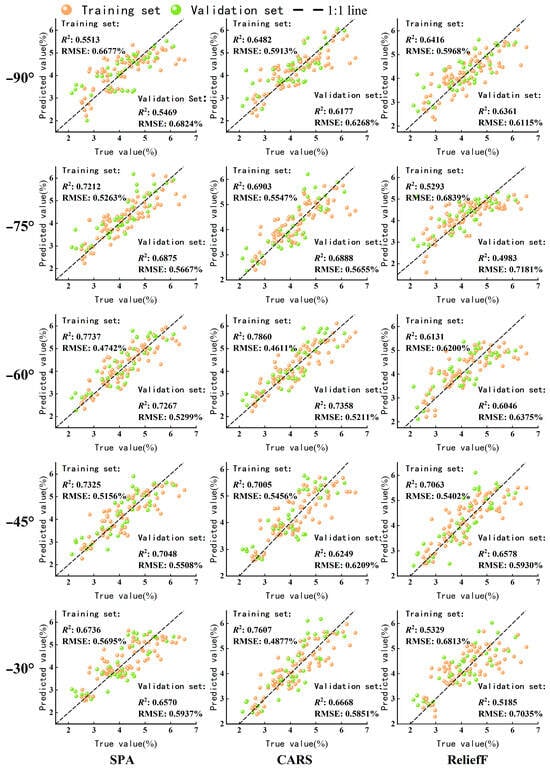
Figure 10.
Inversion results of the first five angles corresponding to three feature selection methods.
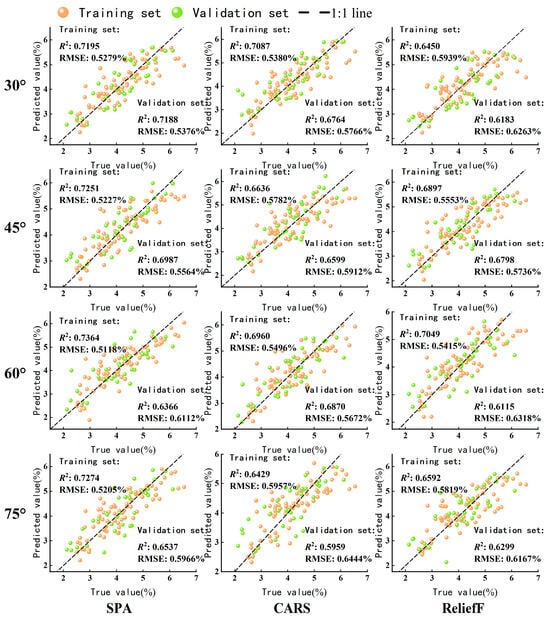
Figure 11.
Inversion results of three feature selection methods corresponding to the remaining four angles.
From the prediction results of the 27 rice CNC inversion models shown in Figure 10 and Figure 11, it can be seen that the SPA method achieved good inversion results under most single observation angles. Specifically, among the nine observation angles, the inversion results of polarized hyperspectral rice CNC based on the five angles of −75°, −60°, −45°, 30°, and 45° were better, especially at the optimal viewing angles of −60° and 30°, with test set R2 values of 0.7267 and 0.7188, respectively. This indicates that the SPA method can effectively screen out the spectral feature band combinations with the highest correlation to rice CNC and the lowest redundancy from the high-dimensional spectral feature space [23]. Although the CARS method has better inversion accuracy than SPA at −60°, the test set R2 is above 0.7 only at −60°, and its stability is slightly lower than that of SPA. This may be due to the unique ‘survival of the fittest’ rule of its algorithm, which makes its feature dimensionality reduction results sensitive to data distribution [24]. In contrast to the performance of the SPA and CARS methods, the Relief method performs relatively poorly. This may be because the method does not handle the multicollinearity problem between spectral bands well, leading to certain information redundancy in the selected spectral feature set, thereby affecting the final fitting effect of rice CNC [25].
The average inversion results of multi-feature selection methods under different observation angles are shown in Table 6. The results in the table show that −60°, 30°, and 45° are the three optimal angles among the nine observation angles that are beneficial for the inversion results of rice CNC. The R2 values of the inversion results in the training set are 0.7243, 0.6911, and 0.6928, respectively, and the RMSE values are 0.5185%, 0.5533%, and 0.5521%, respectively; the R2 values of the test set are 0.6890, 0.6712, and 0.6795, respectively, and the RMSE values are 0.5628%, 0.5802%, and 0.5737%, respectively. The above results can effectively indicate that when using different angle-polarized hyperspectral data for multi-angle feature information fusion, −60°, 30°, and 45° can provide direct data support for angle selection.
Table 6.
Average inversion results of multi-feature selection methods under different observation angles.
3.4. Construction of a Rice Nitrogen Content Inversion Model Based on Multi-Angle Polarization Spectral Information Fusion
Observation angle is a key factor affecting the inversion results of rice CNC, and there is no universally optimal angle. By constructing a single-angle polarized hyperspectral rice CNC inversion model in Section 3.3, it was found that −60°, 30°, and 45° are optimal viewing angles with outstanding inversion capabilities. The SPA method is optimal in most cases, and the inversion performance of CNC is relatively stable. In contrast, the CARS method performs exceptionally well at −60°, and other angles are inferior compared to SPA. By combining the optimal angles with the best feature selection method, the combination of CARS-(−60°), SPA-(30°), and SPA-(45°) is selected for multi-angle feature fusion processing, respectively, representing the combination of the CARS method with the −60° observation angle (abbreviated as CARS-(−60°)), the SPA method with the 30° observation angle (abbreviated as SPA-(30°)), and the SPA method with the 45° observation angle (abbreviated as SPA-(45°)).
This study lists all possible four-angle combinations of the above three observation angles for merging, covering dual-angle and triple-angle polarization spectral information, forming a new feature set containing multi-angle polarization spectral information to serve as input for the ELM model. The four-angle combination forms include CARS-(−60°) + SPA-(30°), CARS-(−60°) + SPA-(45°), SPA-(30°) + SPA-(45°), and CARS-(−60°) + SPA-(30°) + SPA-(45°). Under the four multi-angle polarization spectral information fusion sample data, the inversion results of rice CNC based on ELM are shown in Figure 12. Overall, the fusion inversion of multi-angle polarization spectral information has a certain improvement in the fitting effect on rice CNC.
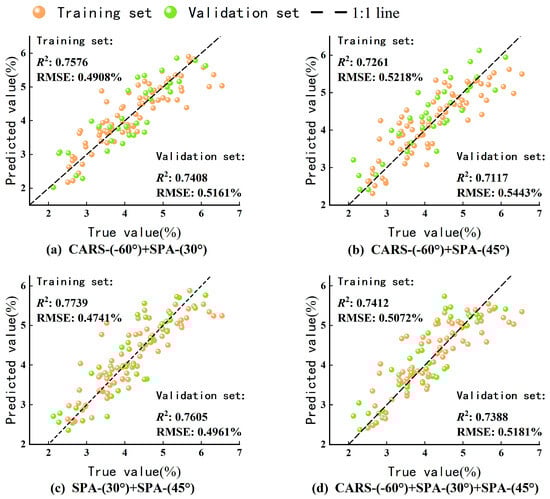
Figure 12.
Inversion results of rice nitrogen content based on multi-angle polarized hyperspectral data.
3.5. Optimization of a Multi-Angle Polarized Spectral Rice Nitrogen Content Inversion Model Based on Intelligent Optimization Algorithms
From Figure 12, it can be seen that the combination of SPA-(30°) + SPA-(45°) observation angles and feature selection methods has a better inversion result, which can be used to optimize the inversion model. Therefore, the WOA and CFO intelligent optimization algorithms are adopted to optimize the multi-angle inversion model.
The number of neurons in the ELM hidden layer was set to [2:2:14], the WOA population quantity parameter was [20:20:100], and the maximum number of iterations was set to 50. Multiple parameter combinations for the WOA-ELM model were constructed and evaluated in an iterative loop. For each iteration, the RMSE between the predicted and observed values on the test set was calculated and used as the fitness value. The parameter combination corresponding to the global minimum fitness value was identified, and the optimal connection weights between the ELM input layer and hidden layer, as well as the biases of the hidden neurons, were subsequently determined. The inversion results of the CNC of rice based on multi-angle polarized spectral WOA-ELM are shown in Figure 13. To reflect the comparison of the combination of observation angles SPA-(30°) + SPA-(45°) and feature selection methods based on WOA-ELM and basic ELM inversion results, the inversion results of the CNC of rice based on basic ELM are also plotted in Figure 13. From the results, the inversion results of WOA-ELM are better than those of basic ELM, with R2 values of 0.8076 and 0.8001 for the training set and test set, respectively; RMSE values of 0.4373% and 0.4532%, demonstrating its optimization ability for the inversion model of CNC of rice based on multi-angle polarized spectral information.
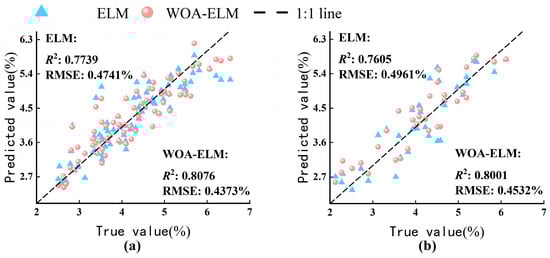
Figure 13.
Retrieval results of rice nitrogen content based on multi-angle polarized spectral inversion using WOA-ELM. (a) Inversion result of the training set; (b) Inversion result of the validation set.
The optimization process was the same as that of WOA-ELM, setting the number of ELM hidden layer neurons to [2:2:14], the CFO population quantity parameter to [20:20:100], and the maximum number of iterations to 50. Multiple groups of CFO-ELM parameter combinations for cyclic processing were constructed to optimize the connection weights between the ELM input layer and hidden layer, as well as the bias of the hidden neurons. The inversion results of rice CNC based on CFO-ELM multi-angle polarization spectral data are shown in Figure 14. Figure 14 also simultaneously plots the inversion results of the basic ELM under the combination of SPA-(30°) + SPA-(45°) observation angles and feature selection methods. The inversion results of CFO-ELM are better than those of the basic ELM, with R2 values of 0.8553 and 0.8374 and RMSE values of 0.3792% and 0.4211% for the training set and test set, respectively, demonstrating the optimization ability of this algorithm for the inversion model of rice CNC based on multi-angle polarization spectral information.
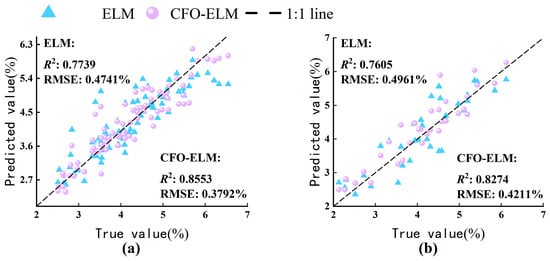
Figure 14.
Results of inversion of rice nitrogen content based on multi-angle polarization spectral CFO-ELM. (a) Inversion result of the training set; (b) Inversion result of the validation set.
4. Discussion
4.1. The Influence of Different Feature Selection Methods on the Inversion Results
The average inversion results of rice CNC models under nine different observation angles are shown in Table 7. From the results in the table, it can be seen that after using three different feature selection methods (SPA, CARS, and Relief) to reduce the dimensionality of polarized hyperspectral data at different observation angles, the R2 values of the inversion results of CNC in the training set are 0.7068, 0.6997, and 0.6358, respectively, and the RMSE values are 0.5374%, 0.5447%, and 0.5994%, respectively; the R2 values of the test set are 0.6701, 0.6615, and 0.6061, respectively, and the RMSE values are 0.5806%, 0.5888%, and 0.6374%, respectively. Overall, the spectral feature subset selected by the SPA feature selection algorithm has a good fitting effect when used to invert the CNC of rice. This indicates that the information contained in the spectral feature bands selected by this method is more strongly correlated with CNC.
Table 7.
Average inversion results under different feature selections for nine observation angles.
The core of SPA is to minimize collinearity between bands, filtering out the feature subset with the lowest information redundancy. In models like ELM, collinearity is a key factor leading to model instability and poor generalization ability. Therefore, the advantage of SPA lies in constructing a set of independent feature combinations that exhibit more robust performance on both training and test sets [26]. CARS combines exponential decay and competitive mechanisms, simulating ‘survival of the fittest.’ Its performance is slightly lower than SPA, possibly because, although it can effectively focus on essential variables during the iterative process, there may still be some collinearity between the selected bands, leading to slightly lower stability of the subset [27]. Relief is a filtering method that mainly sorts features based on their weights for samples. Its performance is relatively weak, possibly because spectral features strongly related to CNC are not necessarily the most discriminative features for distinguishing different CNC levels. Relief focuses more on classifiability, while the inversion of continuous values in regression problems may require a more refined spectral response relationship [28].
4.2. The Influence of Multi-Angle Spectral Information Fusion on Inversion Results
To clearly compare the inversion results of rice CNC under multi-angle polarization spectral information fusion, the inversion results are organized and summarized in Table 8. From the data in the table, it can be seen that compared with the inversion model of rice CNC under a single angle, the test set R2 of the rice CNC inversion model with multi-angle combination is greater than 0.7. Under the combination of SPA-(30°) + SPA-(45°), the R2 of the inversion model in the training set and test set are 0.7739 and 0.7605, respectively; the RMSEs are 0.4741% and 0.4961%, respectively, which are significantly better than the best-performing single-angle inversion model (CARS-(−60°)). This indicates that 30° and 45° have strong complementarity in spectral information, effectively proving that the fusion of multi-angle polarization spectral information can integrate spectral information from different angles, enhancing the fitting effect of the model on rice CNC [29]. Li et al. [30] proposed that the model based on multi-angle composite vegetation index is expected to effectively improve the accuracy of nitrogen content estimation in winter wheat. This is similar to the research results presented in this paper.
Table 8.
Retrieval results of rice nitrogen content based on multi-angle polarized spectral information fusion.
However, increasing the angle does not necessarily improve the model. For example, the angle combination of CARS-(−60°) + SPA-(45°), although its test set R2 is greater than 0.7, is slightly lower than the inversion result of the single-angle CARS-(−60°); the three-angle combination CARS-(−60°) + SPA-(30°) + SPA-(45°), although it integrates the polarization spectral information of three angles, does not produce a better inversion result than the angle combination of SPA-(30°) + SPA-(45°). This result indicates that integrating multi-angle polarization spectral information should focus on angle complementarity rather than quantity; excessive angle integration may introduce noise or feature redundancy [31]. The current research focuses on verifying the feasibility of multi-angle polarization hyperspectral technology combined with an optimization algorithm under a single eco-logical condition and preliminarily exploring the characteristic response law of different observation angles. In future studies, the model’s ability to migrate across regions should be evaluated. In addition, future studies should add more trials, include more varieties, and build more diverse data sets. Furthermore, they should systematically evaluate the migration ability of the model across regions, varieties and years; compare the similarities and differences in optimal feature selection results under different fields; and explore which observation angles and wavelength bands are universal under different conditions.
Although the multi-angle spectral characteristics improved the inversion accuracy of CNC, this study did not determine the soil base fertility of the test field before sowing. This limits the in-depth analysis of the effect of nitrogen inversion. Although the effects of soil spatial variation were minimized by measures such as historical consistency of experimental fields and repeatability of nitrogen treatment, the contribution of soil background nitrogen to rice CNC could not be completely ruled out. Future studies should systematically determine the soil basal nutrient status prior to the start of the experiment and include it as a covariate in the model analysis.
4.3. Selection of Intelligent Optimization Algorithms
This study investigated the inversion results of rice CNC using different optimization algorithms, including ELM, WOA-ELM, and CFO-ELM, under the SPA-(30°) + SPA-(45°) combination, as shown in Table 9. From the results in the table, it can be seen that the ELM models optimized by the intelligent optimization algorithms WOA and CFO achieved a certain degree of improvement in the inversion results of rice CNC. This indicates that the way of optimizing the ELM model by intelligent optimization algorithms to determine the connection weights between the input layer and the hidden layer as well as the bias of the hidden neurons can effectively enhance the model’s nonlinear fitting ability between multi-angle polarized spectral data and rice CNC [32]. By comparing the inversion results, it can be found that although the optimization of ELM did not significantly increase the degree of improvement in the inversion accuracy of rice CNC, all optimization algorithms showed apparent improvement effects, indicating that their optimization mechanisms are effective in practical applications [33]. Especially the CFO algorithm, with its simulated Cordyceps sinensis exploration and parasitic mechanism, had stronger global search and local development capabilities, which could find a better combination of ELM network parameters. Therefore, the CFO-ELM optimization model achieved the best inversion results of rice CNC under the information fusion of SPA-(30°) + SPA-(45°) multi-angle polarized spectral data.
Table 9.
Retrieval results of rice nitrogen content based on multi-angle polarized spectral inversion with different optimization methods.
4.4. Analysis on the Mechanism of Improving Inversion Accuracy by Polarization Measurement Technology
In order to evaluate the value-added effect of polarimetry technology on the inversion of rice canopy nitrogen content, this study compared the accuracy of the ELM inversion model based on polarimetric hyperspectral data and original hyperspectral data. Table 10 summarizes the model inversion accuracy of the two data sources at different observation angles. The results show that the model based on polarization hyperspectral data exhibits better inversion performance at all observation angles. This improvement is mainly attributed to the following: First, the spectral reflectance information of rice canopy consists of two parts. One is the bulk scattering component that reflects the information of biochemical components of leaves; the second is the specular reflection component produced by the interface between the blade surface and the water body in the canopy. Specular reflection mainly carries light-source information and surface physical characteristics and has a weak correlation with canopy biochemical parameters, but it will interfere with the extraction of real nitrogen information. Secondly, the polarimetry technology adopted in this study effectively stripped off the specular reflection components generated by the water background and blade surface by obtaining spectral information under different polarization states combined with the specular reflection separation algorithm based on polarization difference. To sum up, the results of this study quantitatively verify the advantages of polarization hyperspectral technology compared with traditional hyperspectral technology and provide a more reliable technical means for accurate monitoring of rice nitrogen.
Table 10.
Model inversion accuracy of two data sources under different observation angles.
5. Conclusions
This study is based on multi-angle polarimetric hyperspectral data obtained from drones, using SPA, CARS, and Relief for feature selection. It performs comprehensive feature extraction on polarimetric hyperspectral data from nine observation angles. By comparing the stability and band selection differences in different algorithms, the combination of CARS-(−60°), SPA-(30°), and SPA-(45°) is selected for subsequent multi-angle feature fusion processing. The multi-angle polarimetric feature fusion model significantly improves the stability and prediction accuracy of CNC inversion compared to single-angle models. The WOA and CFO are introduced to intelligently optimize the ELM model, effectively solving the performance instability problem caused by the random initialization of traditional ELM parameters. The CFO-ELM model achieves the highest R2 and the lowest RMSE on both the training set and test set (training set R2 = 0.8553, test set R2 = 0.8274), performing significantly better than the basic ELM and WOA-ELM models and indicating that CFO has stronger global search and parameter optimization capabilities. Finally, CFO-ELM was determined to be the optimal CNC inversion model in this study. The multi-angle CNC inversion model constructed in this study can provide a theoretical basis for the rapid monitoring of rice CNC and also provide a reference for the inversion of physical and chemical parameters of other crops.
Author Contributions
C.X.: Methodology, Data Curation, Writing—Original Draft Preparation. S.X.: Conceptualization, Validation. N.W.: Investigation, Software, Visualization. F.Y.: Funding acquisition, Writing—Review and Editing. Z.G.: Supervision. All authors have read and agreed to the published version of the manuscript.
Funding
This research was funded by the Liaoning Provincial Department of Education Platform Project, grant number JYTPT2024002.
Data Availability Statement
The raw data supporting the conclusions of this article will be made available by the authors on request.
Acknowledgments
We would like to thank the editors and reviewers for their professional advice on this manuscript.
Conflicts of Interest
The authors declare no conflicts of interest.
References
- Priyadarshani, C.; Laik, R.; Sow, S.; Mirriam, A.; Gitari, H.I. Influence of soil properties for improving productivity and grain quality of rainfed rice. Arch. Agron. Soil Sci. 2026, 72, 1–19. [Google Scholar] [CrossRef]
- Chen, Z.K.; Wang, J.Y.; Xu, X.Y.; Yuan, W.Q.; Yang, Z.Y.; Sun, Y.J.; Ma, J.; Batchelor, W.D.; Li, X.F. Controlled-release nitrogen in paddies: Bridging food security and carbon neutrality through carbon-nitrogen coupling. Field Crops Res. 2026, 335, 110197. [Google Scholar] [CrossRef]
- Ye, C.; Tao, Y.; Xiao, D.S.; Xu, Y.N.; Xu, C.M.; Liu, Y.H.; Yu, K.; Wang, D.Y. Effects of soil textures on N mineralization, uptake and utilization in paddy rice. Field Crops Res. 2026, 338, 110281. [Google Scholar] [CrossRef]
- Yang, M.D.; Hsu, Y.C.; Chen, Y.H.; Yang, C.Y.; Li, K.Y. Precision monitoring of rice nitrogen fertilizer levels based on machine learning and UAV multispectral imagery☆. Comput. Electron. Agric. 2025, 237, 110523. [Google Scholar] [CrossRef]
- Zhu, G.G.; Wang, Q.H.; Zhang, S.M.; Guo, T.Y.; Liu, S.S.; Lu, J.W. A meta-analysis of crop leaf nitrogen, phosphorus and potassium content estimation based on hyperspectral and multispectral remote sensing techniques. Field Crops Res. 2025, 329, 109961. [Google Scholar] [CrossRef]
- Pan, Y.Y.; Zhou, R.H.; Zhang, J.Y.; Guo, W.T.; Yu, M.L.; Guo, C.L.; Yao, X.; Cheng, T.; Zhu, Y.; Cao, W.X.; et al. A new spectral index for estimation of wheat canopy chlorophyll density: Considering background interference and view zenith angle effect. Precis. Agric. 2023, 24, 2098–2125. [Google Scholar] [CrossRef]
- Jing, L.L.; Wei, X.H.; Song, Q.; Wang, F. Study on the movement mechanism of rice stem under the action of canopy-opening device based on explicit dynamics simulation. Front. Plant Sci. 2023, 14, 1252247. [Google Scholar] [CrossRef]
- Takács, P.; Tibiássy, A.; Bernáth, B.; Gotthard, V.; Horváth, G. Reflection-Polarization Characteristics of Greenhouses Studied by Drone-Polarimetry Focusing on Polarized Light Pollution of Glass Surfaces. Remote Sens. 2024, 16, 2568. [Google Scholar] [CrossRef]
- Zhou, Y.Y.; Ma, Y.T.; Ata-Ul-Karim, S.T.; Wang, S.; Ciampitti, I.; Antoniuk, V.; Wu, C.C.; Andersen, M.N.; Cammarano, D. Integrating multi-angle and multi-scale remote sensing for precision nitrogen management in agriculture: A review. Comput. Electron. Agric. 2025, 230, 109829. [Google Scholar] [CrossRef]
- Gong, J.L.; Zhong, X.; Zhu, R.F.; Xu, Z.X.; Wang, D.; Yin, J. An Angle Effect Correction Method for High-Resolution Satellite Side-View Imaging Data to Improve Crop Monitoring Accuracy. Remote Sens. 2024, 16, 2172. [Google Scholar] [CrossRef]
- Zhang, Y.H.; Sun, T.; Ru, Y.; Su, T.; Zhang, H.C.; Zhu, J.Y.; Hu, J.L.; Xiong, Q.Q.; Zhou, N.B. Response of Nitrogen Use Efficiency and Nitrogen Metabolism Characteristics to Nitrogen Fertilizer in Different Yield-Type Rice Varieties. Food Energy Secur. 2025, 14. [Google Scholar] [CrossRef]
- Din, M.; Ming, J.; Hussain, S.; Ata-Ul-Karim, S.T.; Rashid, M.; Tahir, M.N.; Hua, S.Z.; Wang, S.Q. Estimation of Dynamic Canopy Variables Using Hyperspectral Derived Vegetation Indices Under Varying N Rates at Diverse Phenological Stages of Rice. Front. Plant Sci. 2019, 9, 1883. [Google Scholar] [CrossRef]
- Zhang, H.L.; Luo, W.; Liu, X.M.; He, Y. Measurement of Soil Organic Matter with Near Infrared Spectroscopy Combined with Genetic Algorithm and Successive Projection Algorithm. Spectrosc. Spectr. Anal. 2017, 37, 584–587. [Google Scholar]
- Sun, X.G.; Zhang, B.Y.; Zhang, Z.Y.; Jing, C.J.; Gu, L.M.; Zhen, W.C.; Gu, X.H. Coupling decision of water and nitrogen application in winter wheat via UAV hyperspectral imaging. Field Crop. Res. 2025, 334, 110159. [Google Scholar] [CrossRef]
- Li, Y.Z.; Guo, Y.B.; Wang, Z.M.; Dong, X.D.; Cao, G.Y.; Yang, X.E.W.; Han, D.Y.; Meng, Z.Q.; Qi, F. Prediction of baicalin concentration within scutellaria based on terahertz spectroscopy by analyzing aligned principal component. Anal. Sci. 2025, 41, 1051–1059. [Google Scholar] [CrossRef] [PubMed]
- Li, Y.M.; Yang, X.W. Quantitative analysis of near infrared spectroscopic data based on dual-band transformation and competitive adaptive reweighted sampling. Spectroc. Acta Pt. A-Molec. Biomolec. Spectr. 2023, 285, 121924. [Google Scholar] [CrossRef]
- Xiang, S.Y.; Xu, Z.H.; Zhang, Y.W.; Zhang, Q.; Zhou, X.; Yu, H.; Li, B.; Li, Y.F. Construction and Application of ReliefF-RFE Feature Selection Algorithm for Hyperspectral Image Classification. Spectrosc. Spectr. Anal. 2022, 42, 3283–3290. [Google Scholar]
- Song, L.; Wang, L.Y.; Yang, Z.Q.; He, L.; Feng, Z.H.; Duan, J.Z.; Feng, W.; Guo, T.C. Comparison of algorithms for monitoring wheat powdery mildew using multi-angular remote sensing data. Crop J. 2022, 10, 1312–1322. [Google Scholar] [CrossRef]
- Mirjalili, S.; Lewis, A. The Whale Optimization Algorithm. Adv. Eng. Softw. 2016, 95, 51–67. [Google Scholar] [CrossRef]
- Yang, B.; Liang, B.X.; Zhou, S.; Qian, Y.C.; Zheng, R.Y.; Shu, H.C.; He, P.; Wang, J.B.; Jiang, L.; Sang, Y.Y.; et al. A novel bio-inspired caterpillar fungus (Ophiocordyceps sinensis) optimizer for SOFC parameter identification via GRNN. Renew. Energy 2026, 256, 123995. [Google Scholar] [CrossRef]
- Zhang, C.J.; Ye, M.C.; Lei, L.; Qian, Y.T. Feature Selection for Cross-Scene Hyperspectral Image Classification Using Cross-Domain I-ReliefF. IEEE J. Sel. Top. Appl. Earth Observ. Remote Sens. 2021, 14, 5932–5949. [Google Scholar] [CrossRef]
- Bai, J.; Zhu, S.Y.; Hao, Y.C.; Li, X.Z.; Yang, C.B.; Wang, C.; Qiao, X.X.; Feng, M.C.; Xiao, L.J.; Song, X.Y.; et al. Comparative analysis of the effects of different dimensionality reduction algorithms on hyperspectral estimation of total nitrogen content in wheat soils. Eur. J. Agron. 2025, 168, 127660. [Google Scholar] [CrossRef]
- Cao, C.L.; Wang, T.L.; Gao, M.F.; Li, Y.; Li, D.D.; Zhang, H.J. Hyperspectral inversion of nitrogen content in maize leaves based on different dimensionality reduction algorithms. Comput. Electron. Agric. 2021, 190, 106461. [Google Scholar] [CrossRef]
- Wang, Y.; Chen, S.C.; Hong, Y.S.; Hu, B.F.; Peng, J.; Shi, Z. A comparison of multiple deep learning methods for predicting soil organic carbon in Southern Xinjiang, China. Comput. Electron. Agric. 2023, 212, 108067. [Google Scholar] [CrossRef]
- Ren, J.S.; Wang, R.X.; Liu, G.; Feng, R.Y.; Wang, Y.N.; Wu, W. Partitioned Relief-F Method for Dimensionality Reduction of Hyperspectral Images. Remote Sens. 2020, 12, 1104. [Google Scholar] [CrossRef]
- Mesquita, D.P.P.; Gomes, J.P.P.; Rodrigues, L.R.; Galvao, R.K.H. Pruning Extreme Learning Machines Using the Successive Projections Algorithm. IEEE Latin Am. Trans. 2015, 13, 3974–3979. [Google Scholar] [CrossRef]
- Guo, Y.; Guo, J.X.; Shi, Y.; Li, X.L.; Huang, H.; Liu, Y.C. Estimation of Leaf Moisture Content in Cantaloupe Canopy Based on SiPLS-CARS and GA-ELM. Spectrosc. Spectr. Anal. 2022, 42, 2565–2571. [Google Scholar]
- Li, J.C.; Zhang, S.Z.; Liu, C.L.; Yin, Y.Q.; Sun, X.R.; Wu, J.Z. Characterization of ash content in wheat flour using data fusion. Infrared Phys. Technol. 2023, 133, 104792. [Google Scholar] [CrossRef]
- Roosjen, P.P.J.; Brede, B.; Suomalainen, J.M.; Bartholomeus, H.M.; Kooistra, L.; Clevers, J. Improved estimation of leaf area index and leaf chlorophyll content of a potato crop using multi-angle spectral data—Potential of unmanned aerial vehicle imagery. Int. J. Appl. Earth Obs. Geoinf. 2018, 66, 14–26. [Google Scholar] [CrossRef]
- Li, T.S.; Zhu, Z.; Cui, J.; Chen, J.H.; Shi, X.Y.; Zhao, X.; Jiang, M.H.; Zhang, Y.T.; Wang, W.J.; Wang, H.J. Monitoring of leaf nitrogen content of winter wheat using multi-angle hyperspectral data. Int. J. Remote Sens. 2021, 42, 4676–4696. [Google Scholar] [CrossRef]
- Fan, A.X.; Xu, T.F.; Teng, G.; Wang, X.; Xu, C.; Zhang, Y.H.; Li, J.N. Multi-angle and full-Stokes polarization multispectral images using quarter-wave plate and tunable filter. Sci. Data 2024, 11, 1401. [Google Scholar] [CrossRef] [PubMed]
- Liu, Y.X.; Sun, H.; Zhao, C.Y.; Ai, C.K.; Bian, X.H. Extreme Learning Machine Combined with Whale Optimization Algorithm for Spectral Quantitative Analysis of Complex Samples. J. Chemometr. 2024, 38, e3590. [Google Scholar] [CrossRef]
- Xiang, S.; Wang, S.K.; Guo, Z.H.; Wang, N.; Jin, Z.Y.; Yu, F.H.; Xu, T.Y. Inversion of nitrogen concentration in crop leaves based on improved radiative transfer model. Comput. Electron. Agric. 2025, 239, 111017. [Google Scholar] [CrossRef]


Disclaimer/Publisher’s Note: The statements, opinions and data contained in all publications are solely those of the individual author(s) and contributor(s) and not of MDPI and/or the editor(s). MDPI and/or the editor(s) disclaim responsibility for any injury to people or property resulting from any ideas, methods, instructions or products referred to in the content. |
© 2026 by the authors. Licensee MDPI, Basel, Switzerland. This article is an open access article distributed under the terms and conditions of the Creative Commons Attribution (CC BY) license.