Highlights
What are the main findings?
- A ~32-year aridity cycle is detected across China through Fourier spectrum analysis of 1950–2022 aridity data.
- An arid–humid climate divide is revealed by entropy-based climate stability indicators.
- Recent remote sensing data show a nationwide expansion of surface water bodies and localized groundwater recovery.
What are the implications of the main findings?
- The identified ~32-year aridity cycle provides a basis for anticipating future dry–wet transitions and improving long-term climate adaptation planning in China.
- The contrasting response times of surface water and groundwater indicate that surface water responds rapidly to climatic wetting, whereas groundwater shows delayed and regionally heterogeneous responses.
Abstract
Global warming profoundly affects hydrological processes and regional aridity. However, the shifts in the arid–humid transition zone and its relationship to divergent surface and subsurface hydrological responses remain not fully understood. This study investigates the spatiotemporal aridity changes in China using hydroclimate datasets (1950–2022) and examines associated hydrological responses via remote sensing (RS) since the early 2000s. The results reveal that: (1) a pronounced ~32-year oscillatory pattern governs both the expansion and contraction of drylands and non-drylands, with China currently in a wetting phase; (2) a distinct climatic transitional zone is identified, and a distinct boundary emerges separating drylands and non-drylands, here referred to as China’s Arid–Humid Divide, reflecting the climatic equilibrium shaped by multiple monsoon systems and local topography; and (3) the nationwide expansion of surface water bodies, following the increase of groundwater storage in partial areas, was detected via recent RS data. These findings provide new insights into the mechanisms driving long-term aridity transitions and support climate adaptation and sustainable land management in China.
1. Introduction
Global warming has become an indisputable reality, accelerating the global water cycle and significantly altering atmospheric circulation patterns [1,2]. Against this backdrop, the arid–humid climate patterns in many regions worldwide have undergone notable adjustments, particularly in the spatial configuration of climate transition zones. These zones, typically located at the margins between drylands and non-drylands, are characterized by sensitive climate conditions and fragile ecosystems, making them critical frontiers of climate change impacts. For instance, the 100th meridian in the central United States has long been recognized as the dividing line between the humid eastern and arid western regions of North America. Recent studies have shown its eastward shift, indicating a strong climatic response to global warming [3,4]. Similarly, the Sahel belt in North Africa has shown pronounced interannual to decadal variability and spatial expansion, influenced by both the West African monsoon and oceanic thermal anomalies [5]. Given that China’s arid–humid transition zone is influenced by the East Asian and South Asian monsoons as well as the mid-latitude westerlies [6,7,8], it remains unclear how this transition zone has responded to recent climate change and whether it shows shifts analogous to the 100th meridian in the United States?
Situated in a typical monsoon climate region, China is highly sensitive to global climate change [9]. Its vast territory and complex topography create a pronounced spatial gradient, from the humid southeast coastal regions to the hyper-arid northwest interior. Within this range, China’s arid–humid transition zone exhibits a relatively sharp aridity gradient change to separate drylands and non-drylands [10], reflecting the dominant influence of monsoon systems on the country’s climate structure. Moreover, the transition zone closely overlaps with the ecologically fragile agro-pastoral ecotone, where climate variability can trigger far-reaching socio-environmental chain reactions [11,12].
Under the influence of global warming, aridity patterns across China have exhibited significant but spatially heterogeneous shifts [13,14]. Specifically, Northwest China has experienced a notable transition from warm-dry to warm-wet conditions [15,16], whereas North and Northeast China have predominantly suffered from aridification since the 1980s, although recent evidence suggests a potential moderation or reversal of this drying trend [17,18,19,20,21,22]. In contrast, Southeast China has generally maintained a wetting trend, a pattern further corroborated by GRACE-derived terrestrial water storage anomalies [23,24,25]. Superimposed on these regional trends, prior studies have also identified widespread decadal-scale oscillations (~25–30 years) in China’s aridity variability [26,27]. Despite these extensive regional studies, a unified understanding of how these spatially heterogeneous shifts collectively impact the stability of the arid–humid transition zone remains limited.
Remote sensing enables the systematic, large-scale observation of terrestrial hydrological processes [28,29,30]. The integration of these data provides a powerful means to quantify how hydrological systems respond to climate fluctuations, revealing the impacts of regional aridification and wetting trends on water resources. This is facilitated by long-term satellite missions such as GRACE (Gravity Recovery and Climate Experiment) and Landsat whose products reveal the spatiotemporal dynamics of surface water extent and groundwater storage. Collectively, these datasets deliver a spatially continuous, multi-decadal perspective essential for analyzing continental-scale changes in the hydrological cycle.
However, most conventional investigations have primarily focused on the numerical fluctuations of aridity indices [11,31] or static climatic boundaries based on long-term averages [7,32], often overlooking the intrinsic stability of the transition zone. To address this, we introduce a Shannon entropy-based metric to quantify the stability of the arid–humid transition, enabling a dynamic identification of the ‘Arid–Humid Divide’. Furthermore, we integrate multi-source remote sensing data to reveal the divergent and lagged hydrological responses of surface water and groundwater to aridity changes—a topic that has been less explored in continental-scale assessments. The main contributions of this study are summarized as follows:
A robust ~32-year oscillatory cycle in China’s aridity patterns is identified, providing a new perspective on long-term climate variability.
A distinct ‘Arid–Humid Divide’ is identified using a novel Shannon entropy-based metric, revealing a stable climatic boundary governed by monsoon-driven moisture transport.
We reveal significant divergent hydrological responses, where surface water expands rapidly during the current wetting phase (post-2010), while groundwater recovery lags significantly.
2. Materials and Methods
2.1. Study Area
China is geographically divided into seven major regions (Figure 1): Northeast China (NEC), North China (NC), Central China (CC), East China (EC), South China (SC), Southwest China (SWC), and Northwest China (NWC). China’s terrain features a three-step staircase pattern descending from the Tibetan Plateau in the west to the eastern plains, shaping distinct arid–humid climatic zones. In winter dry seasons, the development and breakdown of the Siberian High and its associated anticyclone drives the westerlies across East Asia, carrying cold, dry air and aeolian dust from high-latitude Asia, resulting in a cold and dry climate in east Asia [33,34,35]. In summer, the northward shift of the westerly belt transports limited moisture to northwestern China, while the East and South Asian summer monsoons carry warm and humid air from the Pacific and Indian Oceans into eastern and southern China, resulting in a markedly humid climate [36,37]. The boundary of monsoon roughly follows the Greater Khingan–Helan–Qilian Mountains and southeastern Tibetan Plateau, forming a transitional zone where arid-humid conditions are sensitive to monsoon variability [36].
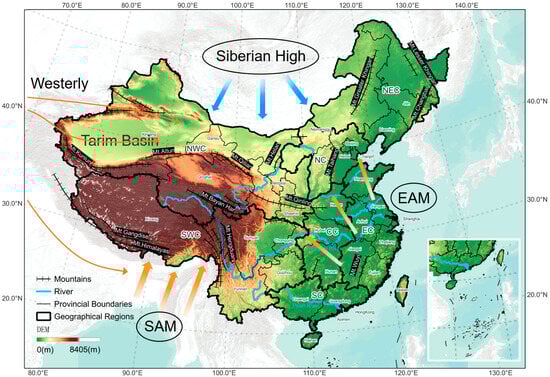
Figure 1.
Geography of China. Thin orange arrows indicate the westerlies, while thick blue and orange arrows represent the winter and summer monsoons, respectively. The positions of the westerlies, Siberian High, East Asian monsoon (EAM), and South Asian monsoon (SAM) are adapted from Yao, et al. [38] and Wang, et al. [39].
2.2. Datasets
To capture fine-scale variations in arid–humid climate patterns, this study used high-resolution monthly data on precipitation (PRE), potential evapotranspiration (PET), and mean temperature (TMP) from the National Tibetan Plateau/Third Pole Environment Data Center (TPDC, http://data.tpdc.ac.cn (accessed on 20 January 2024)). These datasets, downscaled from the CRU product [40,41,42,43], have a spatial resolution of approximately 1 km and cover the period from 1950 to 2022. PET was estimated using the Hargreaves method [40,41]. To assess the robustness of the CRU-based aridity zone classification, we additionally employed PRE and PET data from the TerraClimate dataset for validation [44].
Groundwater storage anomalies (GWSA) were derived from satellite observations of the Gravity Recovery and Climate Experiment and its Follow-On (GRACE/FO) combined with data from the Global Land Data Assimilation System (GLDAS). GWSA represent anomalies relative to the baseline period of 2004–2009. Zhang Gangqiang [45] integrated multiple GRACE-derived products, downscaled the data to a spatial resolution of 0.05°, and filled data gaps to produce a continuous GWSA dataset (2002–2022). The European Commission’s Joint Research Centre (JRC) Global Surface Water body dataset is derived from Landsat 5/7/8 imagery, spanning the period from 1984 to 2022. Given that only Landsat 5 was operational prior to 2000, and considering potential issues in coverage/consistency in that period, we limited our surface water analysis to the 2000s onward to ensure data quality and comparability.
To examine relationships with large-scale climate drivers, we incorporated indices such as the Oceanic Niño Index (ONI), Arctic Oscillation Index (AOI), East Asian Summer Monsoon Index (EASMI), South Asian Summer Monsoon Index (SAMI), North Atlantic Oscillation Index (NAOI), and East Asian Winter Monsoon Index (EAWMI). Most datasets were obtained from National Oceanic and Atmospheric Administration (NOAA) and the repository (http://lijianping.cn (accessed on 19 March 2024)), while the EAWMI was derived from ERA5 following Neng [46]. Among these, the NAOI, which reflects changes in the strength of mid-latitude westerlies, provides a useful indicator for analyzing westerly circulation variability [6].
Additionally, the China desert distribution data used in this study were obtained from the National Glaciers, Frozen Soil, and Desert Data Center of China (http://www.ncdc.ac.cn (accessed on 19 March 2024))
2.3. Methods
2.3.1. Aridity Index
The Aridity Index (AI), a core metric used to characterize the degree of climate dryness or wetness, is defined as the ratio of annual precipitation to potential evapotranspiration [47], comprehensively accounting for precipitation (input) and potential evapotranspiration (output), which are the two key components in the water balance. Unlike standardized indices (e.g., SPEI) designed to detect drought anomalies relative to local history, AI preserves the absolute physical ratio of water supply to demand. Due to its clear physical significance and broad spatiotemporal applicability, AI has been widely adopted in climate zoning and climate change studies [48,49,50].
where denotes the annual precipitation in year , represents the annual potential evapotranspiration in year , and refers to the aridity index in year .
Previous studies analyzing changes in dryland zones often use annual aridity index [7,51,52], which introduces substantial interannual fluctuations and reduce the stability of aridity classification. Some studies have instead applied decadal averages to assess shifts in aridity zone boundaries, achieving greater stability but at the cost of temporal continuity [6,53]. To balance stability and continuity, we adopt a 10-year moving average of the aridity index, ensuring both reliable aridity zone classification and continuous tracking of arid–humid climate type changes. This approach produces a continuous series of aridity maps for China spanning the period from 1959 to 2022.
where, denotes the decadal period index, where , corresponding to 63 decadal periods from 1959 to 2022.
2.3.2. Aridity Zone Classification Using the UNEP Scheme
Following the UNEP aridity zone classification scheme, land surfaces were categorized into two broad climate groups comprising six climate types based on the above average aridity index (Table 1). Regions with ≤ 0.65 are classified as drylands, while those with > 0.65 are considered non-drylands. Among the climate types, the dry subhumid and semi-arid regions are often regarded as arid–humid climate transition zones, where climate conditions are highly sensitive and variable and ecosystems are particularly vulnerable, making them focal areas for climate change research [54,55]. These zones are not only areas where moisture transport gradually weakens but also serve as critical interfaces in the spatial structure of arid-humid climates.

Table 1.
Aridity Zone Classification.
2.3.3. Aridity Zone Stability Measured by Shannon Entropy
The transitional zone between drylands and non-drylands in China largely aligns with the outer margins of monsoon influence, where the advance and retreat of monsoons critically control moisture availability and local climatic conditions. Variations in monsoon intensity directly affect regional wetness or dryness, meaning that shifts in arid–humid climate boundaries often reflect underlying changes in monsoon dynamics.
To evaluate the long-term stability of these aridity zones, we apply Shannon entropy, a widely used measure of complexity and uncertainty in geographical system, to assess the frequency of climate type fluctuations at each location. This entropy measure captures how often a location transitions between different climate types over time, providing an effective indicator of the magnitude and persistence of climate variability. The calculation formulas are as follows:
where denotes the entropy value for a grid cell; represents the total number of climate categories; corresponds to humid, dry subhumid, semi-arid, arid, and hyper-arid climate types, respectively; is the number of years that a location is classified into the t-th climate type during the period 1959–2022 (); and Pt is the empirical probability of occurrence of each climate type. A 10-year moving average was applied, resulting in time steps for entropy estimation.
A lower entropy value () indicates higher climate stability, where a location predominantly remains in the same climate type (e.g., persistently arid). Conversely, the entropy approaches its maximum () when all climate types occur with equal probability, reflecting highly unstable conditions with frequent climate type fluctuations. Consequently, transitional zones between arid and humid regions typically exhibit elevated entropy values, consistent with the fluctuating intensity of monsoon activity along their margins.
2.4. Research Framework
Finally, the overall research framework, including data processing, aridity index calculation, stability assessment, and hydrological response analysis, is summarized in Figure 2. This flowchart illustrates the systematic integration of multi-source datasets and the dual-path analytical approach used to characterize the spatiotemporal evolution of aridity and its hydrological impacts.
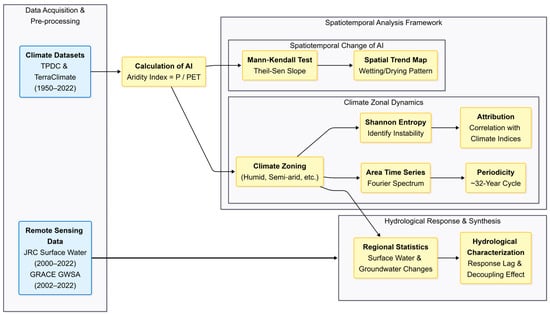
Figure 2.
Schematic workflow of the research methodology. The framework integrates multi-source datasets through a dual-path analytical approach: (1) Spatiotemporal Change of AI, focusing on trend detection and spatial patterns; and (2) Climate Zonal Dynamics, characterizing climatic stability via Shannon entropy and periodicity. These analyses are synthesized to evaluate hydrological responses using remote sensing observations.
3. Results
3.1. Spatiotemporal Variations of the Aridity Index
3.1.1. Area Changes of Aridity Zones
From 1950 to 2022, China’s aridity zones experienced substantial spatial adjustments, displaying a persistent gradient of increasing dryness from the humid southeastern coast toward the arid northwestern interior (Figure 3). The spatial distribution and temporal evolution of these zones align well with previous findings derived from CRU datasets and meteorological station observations [51], confirming the reliability of our high-resolution gridded analysis. Despite these widespread shifts, the Qinling Mountains remained a relatively stable climatic boundary. Owing to their high elevation and east–west orientation, the mountains effectively block the southward intrusion of cold continental air in winter and limit the northward expansion of the East Asian summer monsoon, thereby maintaining a consistent climatic divide even as surrounding regions undergo notable changes.
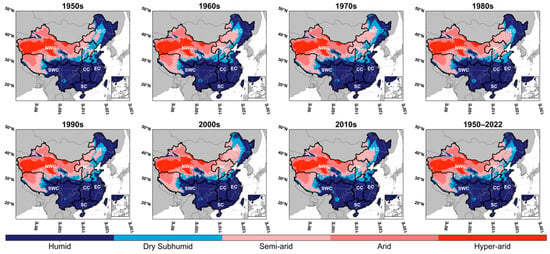
Figure 3.
Climate classification of China across different decades. The final panel shows the distribution of climate zones derived from the average aridity index for the period 1950–2022.
Over the past 73 years, the dry subhumid and semi-arid zones, which act as transitional zones between wet and dry regions, have exhibited the most pronounced interdecadal fluctuations. This pattern is particularly evident in NEC, where two distinct periods (1950s–1970s and 1980s–2000s) were marked by the significant expansion of semi-arid areas and the contraction of humid zones, indicating a regional shift toward aridification. In contrast, the NWC and northwestern parts of the SWC regions, located deeply within the continental interior arid zone and are chronically constrained by water scarcity, showed relatively limited area change.
Fourier spectrum analysis based of decadal aridity zone area sequences (Figure 4) revealed a 32-year periodicity in the area variations across different climate types during the past 73 years. The humid zone experienced three peaks during 1964 (45.9%), 1990 (44.8%), and 2021 (45.6%), while two major troughs occurred in 1979 (41.8%) and 2008 (42.2%). And the other zones displayed similar periodic fluctuations. In addition, the dry subhumid and hyper-arid zones exhibited an evident long-term shrinking trend, while the semi-arid and arid zone showed a significant expansion trend.
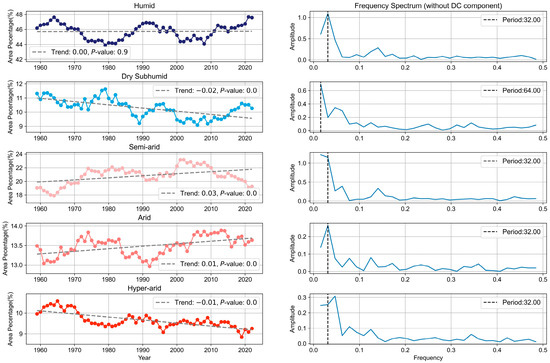
Figure 4.
Area variation of each climate zone and the corresponding Fourier spectral analysis., with the direct current (DC) component removed.
A long-term aridification trend was evident across northern China (including the NWC, NC, and Northeast regions), reflected in the coordinated contraction of dry subhumid zone and the expansion of semi-arid and arid zones. However, in the short term since 2010, all these zones have shown a tendency toward increased wetness. Interestingly, the hyper-arid zone shows a significantly declining trend, consistent with the observed warm-wet shift in Northwest China [15,56].
3.1.2. Temporal Trends in Aridity Index
Over the past 73 years, China’s wet and dry conditions have exhibited significant periodic fluctuations, as reflected in the aridity index across these zones. Based on the approximately 32-year periodicity identified earlier, we therefore applied a half-cycle segmentation scheme (1950–1966, 1966–1982, 1982–1998, and 1998–2014) to conduct Mann–Kendall trend tests for each half-cycle to assess and verify this hypothesis.
The results reveal pronounced spatial differentiation and multiple trend reversals in wetness and dryness across different periods (Figure 5). Regions such as western SWC, CC, SC, and EC, which experienced a drying trend during 1950–1966, shifted to a wetting trend by 1966–1982. In contrast, Yunnan Province in SWC reversed from a wetting trend to a drying trend. The aridification observed in NC, eastern SWC, and NEC from 1982–1998 reversed to a wetting trend during 1998–2014, while regions such as SWC, CC, and EC that had previously shown wetting trends shifted back to drying. These cyclical reversals in aridity index trends confirm the presence of significant interdecadal variability and pronounced periodicity in China’s wet-dry climate patterns.
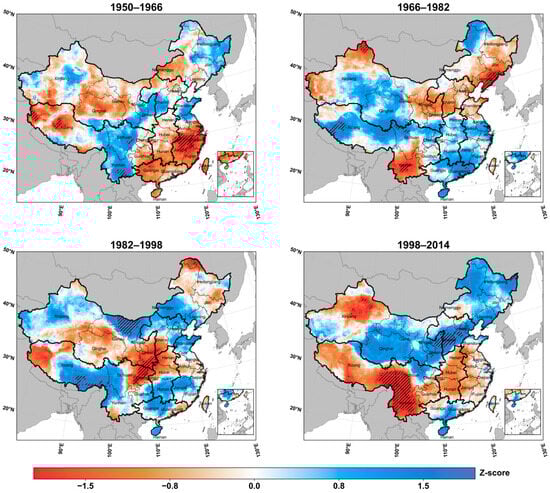
Figure 5.
Mann–Kendall trend test Z-values of the aridity index across different periods. Statistically significant trends (p-value < 0.05) are indicated by hatched areas.
3.2. Aridity Zone Stability in China
3.2.1. Entropy-Based Assessment of Aridity Zone Stability
To assess the stability of aridity zones across China, we calculated the Shannon entropy for each location to quantify the temporal variability of climate types during 1950–2022. First, the frequency of climate type transitions was derived from a time series of decadal aridity zone classification maps generated using Equation (2) from the TPDC dataset. Subsequently, the entropy magnitude for the location was computed from the frequency data using Equation (4), representing the degree of climatic fluctuation at the location. Finally, based on the entropy values, all locations were classified into three categories using a K-means clustering approach: (1) high-variability areas with large entropy values, (2) low-variability areas with low but nonzero entropy values, and (3) unchanged areas where entropy equals zero.
To ensure the robustness of the above results and avoid the impacts of different data sources, we repeated entropy-based analysis using the TerraClimate dataset (1958–2022), finding that the TPDC dataset (Figure 6a) and TerraClimate (Figure 6b) present very similar results.
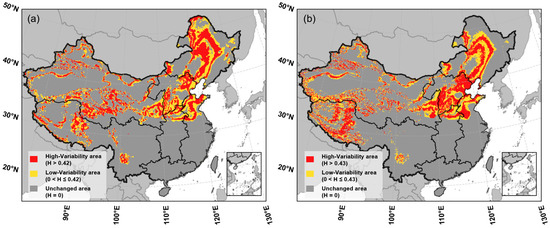
Figure 6.
Classification of Shannon Entropy using the Agglomerative Clustering; (a) TPDC and (b) TerraClimate dataset.
Geographically, the spatial distribution of Shannon entropy reveals a distinct pattern (Figure 6). Overall, high-variability (high-entropy) areas are predominantly distributed along the margins of various aridity zones, reflecting the inherent sensitivity and frequent regime shifts at these climatic boundaries. Compared to the inland arid regions of Northwest China, climate types in Northeast and North China exhibit significantly more frequent transitions. High-variability areas in these regions are predominantly characterized by semi-arid and dry sub-humid climate zones, highlighting their profound sensitivity to climatic fluctuations.
In contrast, low-variability and unchanged areas (low entropy) are primarily concentrated in two regions: the stable hyper-arid area in Northwest China (e.g., the Tarim Basin) and the consistently humid regions in Southeast China. These regions act as stable climatic “cores” that are less prone to regime shifts despite interannual variability.
3.2.2. Arid-Humid Climate Transition Belt
In terms of climate regimes, high-variability areas (representing high entropy) were defined as climatically unstable zones lacking a persistent climate type, whereas low-variability and unchanged areas were classified as climate-stable zones. For unstable areas, the dominant climate type was determined as the category with the highest frequency of occurrence over 73 years, resulting in Figure 7. These unstable zones, which represent transitional climatic regions, appear as narrow belts situated between the subtypes of drylands and non-drylands.
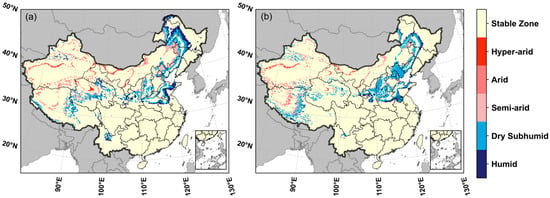
Figure 7.
Spatial distribution of dominant climate types in high-variability zones and climate-stable zones (including unchanged and low-variability areas) across China over the past 70 years, derived from (a) the TPDC dataset and (b) the TerraClimate dataset.
Notably, a narrow yet elongated dry sub-humid belt (cyan color) separates the southeastern oceanic region from the northwestern continental region. Furthermore, within this unstable high-entropy dry sub-humid belt, a locally stable, low-entropy zone is identified, particularly in northeastern China. This dry sub-humid belt likely marks a climatic equilibrium zone formed by the convergence of two opposing air-mass systems: the humid, southeasterly monsoonal air masses advected from the ocean during summer, and the dry, northwesterly continental air masses prevailing in winter. As such, it constitutes a critical transitional corridor that delineates the boundary between the humid and arid continental climates of China.
By overlaying the aridity zone map with the entropy distribution map, an arid–humid climate divide can be identified along the narrow dry sub-humid belt. This divide line almost runs approximately through the center of the dry sub-humid zone (Figure 8a), where it coincides with the lowest entropy values compared with neighboring regions on both sides (Figure 8b). Furthermore, the transects (Figure 8a) reveal a pronounced low-entropy valley within the dry sub-humid zone, indicating the presence of a stable divide within an unstable area, accompanied by a sharp increase in the aridity index from the semi-arid to the humid zone (Figure 8b).
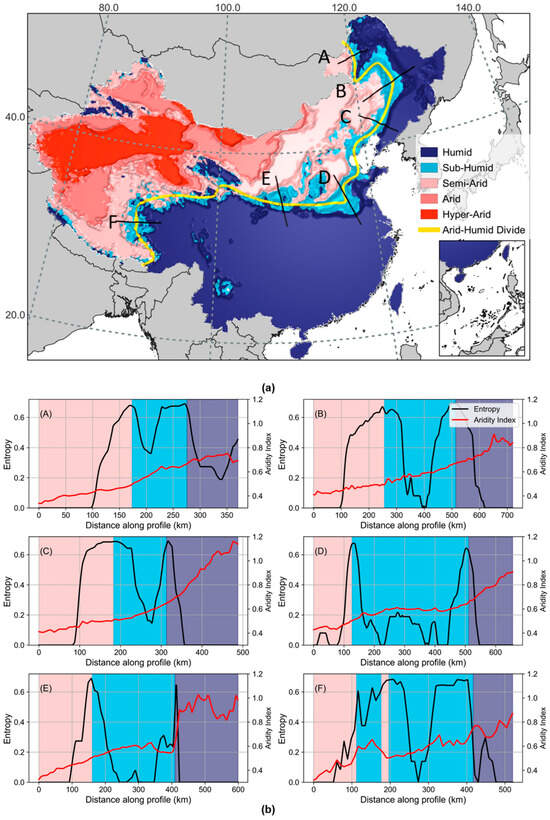
Figure 8.
Arid and humid climatic divide in China. (a) Entropy-weighted aridity zone classification map, where the 3D hillshade effect is rendered using entropy values as the surface elevation to visualize local variability (bright = high entropy, dark = low entropy). (b) Entropy profiles along transects crossing the divide, with transect locations marked by black solid lines (A–F). Colors in (b) represent climate types: pink for semi-arid, blue for dry sub-humid, and purple for humid zones.
3.3. The Arid–Humid Climate Divide in China over the Past 70 Years
3.3.1. Spatial Characteristics of the Arid–Humid Climate Divide
The Hu Line and the 400 mm isohyet are traditionally recognized as sharp arid–humid climate divides in China [10]. However, these boundaries are typically delineated using static threshold-based approaches. Conversely, by employing Shannon entropy to quantify the dynamic variability of climate types, we identified a distinct and stable arid–humid climate divide. The arid–humid climate divide is a low-entropy corridor extending from Northeast to Southwest China within the relatively stable dry sub-humid transition zone. It is contextualized by the average and minimum spatial extents of the East Asian monsoon (EAM) [57], regional topography, desert boundaries, and annual mean precipitation isohyets during 1950–2022 (Figure 9). As with the 100th meridian in North America, this divide marks the ecological and climatic transition from the humid southeast to the arid northwest.
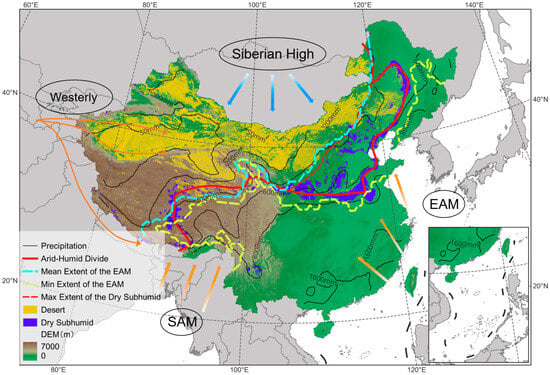
Figure 9.
Characteristics of the arid–humid climate divide in China. EAM and SAM represent the East Asian Monsoon and South Asian Monsoon boundaries, respectively. Thick orange arrows denote the direction of the westerlies, while orange gradient arrows and blue arrows indicate the trajectories of the summer and winter monsoons, respectively.
The divide aligns closely with the entire minimum extent of the East Asian monsoon but is slightly displaced northward, while partially corresponding to the average extent of the monsoon in Southwest China. An interesting spatial feature is that the minimum and average extents of the EAM are widely separated in Northeast and North China, but closely aligned in Southwest China. This contrast can be attributed to the very high elevation terrain of the Tibetan Plateau in the southwest and the relatively low, gently undulating topography in the northeast and north. Notably, the central segment of the divide line follows the west–east orientation of the Qinling Mountains, the well-known natural boundary separating North and Central China. This provides strong evidence that local topography exerts a significant influence on regional climatic patterns, in addition to the dominant control of the monsoon system.
The statistics of major meteorological variables and AI on either side of the arid–humid climate divide reveal a pronounced contrast between the arid northwest and the humid southeast (Figure 10). This imbalance in water input (precipitation) between two sides is a primary driver of China’s north–south aridity gradient. Notably, both temperature and potential evapotranspiration exhibit upward trends across the divide, reflecting the ongoing impacts of global warming.
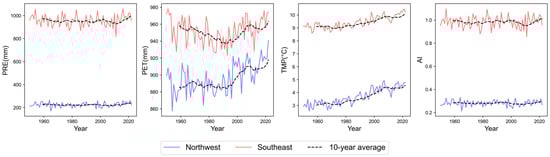
Figure 10.
Statistics of precipitation, potential evapotranspiration, temperature, and aridity index across the arid–humid climate divide in China.
3.3.2. Influence of Climatic Factors on the Divide Fluctuation
The distribution of the arid–humid climate divide shows a strong correlation with monsoonal activity, with the influence of different monsoon systems varying along the divide. To identify the dominant climatic drivers at different location along the divide, we selected three representative regions spanning from northeast to southwest: Northeast China (R1), North China (R2), and Western China (R3, covering Northwest and Southwest) (Figure 11).
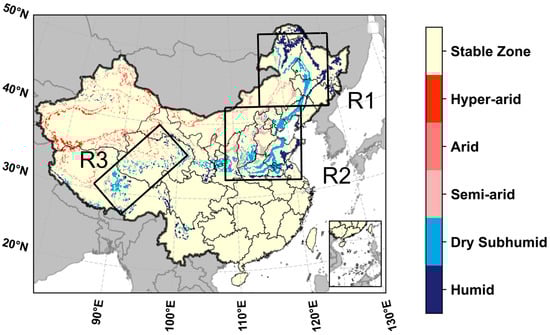
Figure 11.
Sample regions (R1~3) along arid–humid climatic divide for analyzing aridity zone area changes.
The statistics of humid, dry sub-humid and semi-arid areas across the three sample regions over 73 years reveal several noteworthy patterns (Figure 12). Overall, the humid and semi-arid areas display distinctly opposing trends, and all three regions show a general wetting tendency since around 2010. In Northeast China (R1), climatic phases alternate periodically between humid and arid conditions. In North China (R2), a turning point occurred around 2010, when the semi-arid area peaked and has since declined. In Southwest China (R3), particularly on the Tibetan Plateau, a pronounced wetting trend is evident, with humid areas increasing and semi-arid areas decreasing.
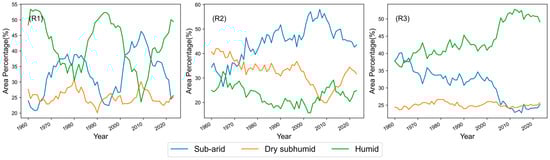
Figure 12.
Changes in climate zone areas over 73 years in three high-variability regions. R1 refers to Northeast China, R2 to North China, and R3 to Southwest China, particularly the Tibetan Plateau.
To investigate how climatic factors impact the divide fluctuations in the space, we performed Spearman correlation analyses between the aridity zone areas of three regions and major climate indices, including ONI (Oceanic Niño Index), EASMI (East Asian Summer Monsoon Index), SASMI (South Asian Summer Monsoon Index), AOI (Arctic Oscillation Index), NAOI (North Atlantic Oscillation Index), and EAWMI (East Asian Winter Monsoon Index). Table 2 and Table 3 reveal significant regional differences in the impacts of these climate drivers on aridity zones along the divide. Notably, the semi-arid and humid zones exhibit distinctly opposite responses to the same climatic factors.
Table 2.
Spearman correlations between humid zone area and major climatic drivers in Northeast, North, and Southwest China.
Table 3.
Spearman correlations between semi-arid zone area and major climatic drivers in Northeast, North, and Southwest China.
In Northeast China (R1), the climatic drivers of wetting and drying is a simple pattern. The ONI is the primary driver of wetting, as evidenced by its strong positive correlation with the humid zone (0.69) and strong negative correlation with the semi-arid zone (−0.70). The East Asian Winter Monsoon contributes to the expansion of semi-arid areas, indicated by a moderate positive correlation with the semi-arid zone (0.41) and a weak negative correlation with the humid zone (−0.27).
In North China (R2), wetting is jointly influenced by the East and South Asian Summer Monsoons (EASMI 0.55, SASMI 0.42), while the semi-arid zone responds negatively (EASMI −0.70, SASMI −0.62). Drying is mainly driven by the East Asian Winter Monsoon, Arctic Oscillation, and North Atlantic Oscillation (semi-arid: EAWMI 0.81, AOI 0.58, NAOI 0.54; humid: EAWMI −0.33, AOI −0.63, NAOI −0.72).
In Southwest China (R3), particularly the Tibetan Plateau, the drivers are more complex. Wetting is influenced by EAWMI, AOI, and NAOI (humid: 0.73, 0.55, 0.43; semi-arid: −0.70, −0.52, −0.40), while drying is predominantly controlled by SASMI, EASMI, and ONI (semi-arid: 0.80, 0.65, 0.53; humid: −0.79, −0.66, −0.43).
3.4. Hydrological Response to Recent Aridity Evolution
3.4.1. Groundwater Storage Anomaly Dynamics
Utilizing GRACE/FO-derived GWSA data from 2002 to 2022, we evaluate the influence of aridity on groundwater storage change across China. The spatial distribution of GWSA (Figure 13a) reveals a pronounced north–south contrast: regions located north of the arid–humid divide generally exhibit negative anomalies relative to the baseline period (2004–2009), whereas much of southern China shows positive anomalies. The Tibetan Plateau also demonstrates consistently notable positive GWSA. Trend analyses (Figure 13b), conducted using the Mann–Kendall test with Trend Free Pre-Whitening (TFPW) to account for serial correlation in the monthly time series, further corroborate these patterns, indicating a long-term shift toward wetter conditions in southern China and the Tibetan Plateau, in contrast to a progressive drying trend across northern China.
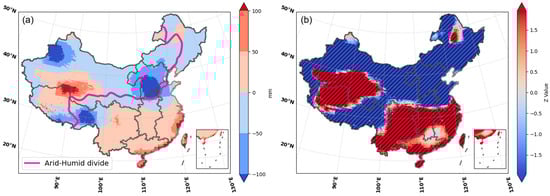
Figure 13.
(a) Multi-year mean GWSA. (b) Mann–Kendall trend of GWSA. The red line in panel (a) denotes the arid–humid boundary, and the hatched areas indicate regions with trends significant at the 0.05 level.
To evaluate GWSA changes across different climatic zones, we applied Seasonal and Trend decomposition using Loess (STL) to the GWSA time series, separating it into trend, seasonal, and residual components. The results (Figure 14) reveal an overall declining trend, accompanied by increasing variability as reflected by the widening interquartile range (25–75%). The trend component indicates a rapid decrease in mean GWSA, even though the Mann–Kendall trend test suggests a spatially general increasing wetness in southern China, highlighting severe groundwater depletion in many regions. The residual component remains within a narrow range, confirming the stability and robustness of the decomposition.
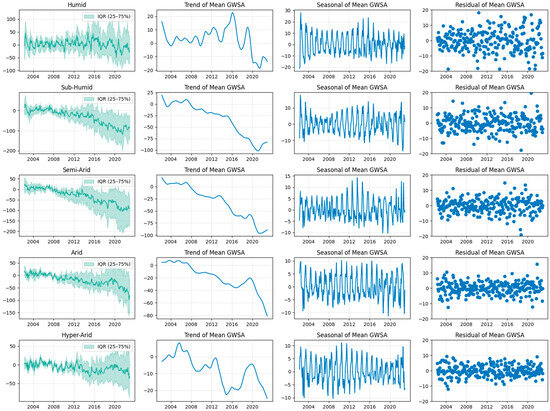
Figure 14.
STL decomposition of GWSA Time Series in Different Aridity Zone.
3.4.2. Surface Water Body Variations
Using monthly surface water area data from the JRC dataset during 2000–2021, we analyzed the spatial distribution and temporal evolution of surface water across China’s aridity zones. Annual maximum surface water extent was derived through data aggregation on Google Earth Engine (GEE). Figure 15 displayed the annual distribution of water bodies over the past 22 years. More than half of China’s surface water is concentrated in humid regions (56.3%). In humid regions, surface water is mainly distributed across eastern and southern China, while in semi-arid and arid regions it is primarily located on the Tibetan Plateau. Liu, et al. [58] have demonstrated that lake levels on the Tibetan Plateau have been rising since 2005. The spatial pattern overall corresponds closely to the gradient of climatic aridity.
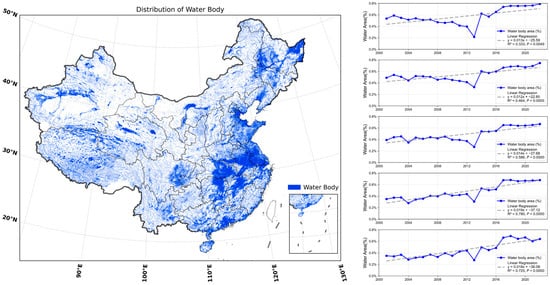
Figure 15.
Spatial distribution of maximum surface water bodies; Annual maxima of surface water area for each aridity zone (humid, sub-humid, semi-arid, arid, hyper-arid), expressed as a fraction of the annual maximum surface water extent observed over the multi-year maximum water extent; panels are ordered from the wettest to the driest zone.
From 2000 to 2021, surface water area increased significantly across all climatic zones, with the most rapid expansion occurring in arid and extremely arid regions, indicating a general trend of increasing surface water availability. All aridity zones exhibited a pronounced minimum in surface water area around 2013. Although this decline can partly be attributed to changes in Landsat data quality during the transition from Landsat 5 to Landsat 8, the distinct downward and upward trends observed before and after 2013–2014 still reflect clear hydro-climatic shifts occurring at that time. The observed minimum in surface water area around 2013 and the subsequent expansion reflect a lagged response to the onset of the recent wetting phase (beginning approximately in 2010) identified in the ~32-year aridity cycle analysis.
4. Discussion
4.1. The 32-Year Period Oscillation of Climate Patterns in China
The analysis of the evolution of humid zone in China from 1950 to 2022 based on the TPDC and TerraClimate datasets reveals a notable ~32-year spatial oscillation in the area of the humid zone. This cycle is slightly longer than the 25–28-year fluctuations reported in previous studies, which were based on the regional average AI [19,26,27], and our area-based statistics, which capture the temporal transitions of climatic zones, likely retain more detailed information than simple metrics derived from the averaged latitude and longitude of the divide lines, which only track changes in their horizontal and vertical positions [26]. Trend analyses of the Aridity Index (AI) across different half-cycles further support a phase-reversal pattern in both spatial and temporal dimensions of China’s arid–humid dynamics (Figure 5), and reveal a general wetting trend since around 2010. This pattern is consistent with observed increases in precipitation and relative humidity [59,60,61] Meanwhile, the hyper-arid zone shows a declining trend, consistent with the observed warm-wet shift in Northwest China [15,56].
Mechanistically, the observed ~32-year periodicity aligns closely with the Pacific Decadal Oscillation (PDO), a dominant mode of oceanic variability [62,63]. The physical connection involves the modulation of the East Asian Summer Monsoon (EASM) via land–sea thermal contrast. During the positive (warm) PDO phase (e.g., 1977–2000s), warmer sea surface temperatures in the tropical Indo-Pacific weaken the land–sea thermal contrast. This induces an anomalous anticyclone (high pressure) over North China, suppressing the EASM and reducing northward moisture transport, which corresponds to the drying trend observed in previous decades [63]. Conversely, the transition toward a negative (cold) PDO phase around the late 2000s enhances the land–sea thermal contrast and strengthens the EASM [64]. This mechanism explains the rapid recovery of the humid zone area and the wetting signal identified in our study since 2010. Thus, the ~32-year aridity cycle is largely a terrestrial response to these PDO-driven atmospheric circulation adjustments.
4.2. China’s Humid–Arid Climate Divide
The divide forms a low entropy-defined boundary separating drylands from non-drylands under the UNEP scheme. It largely coincides with the climatological limit of the East Asian monsoon system [57] and is also influenced by a long-term dynamic equilibrium at the margin of several other monsoon systems.
In Northeast China, climate variability is shaped by ocean–atmosphere coupling, with increased summer precipitation often following El Niño events [65]. In North China, the divide is influenced by the Arctic Oscillation and North Atlantic Oscillation; for examples, anomalies in the Arctic Oscillation can alter the westerlies and East Asian monsoon circulation, leading to reduced precipitation [66], aligning with the fluctuation patterns revealed by the correlation analysis (Table 2 and Table 3). On the Tibetan Plateau of Southwest China, the divide reflects a complex interaction of thermal and dynamic processes, where surface heating over the Tibetan Plateau raises the tropopause in summer, while latent heat release from the South Asian monsoon ascent over the Plateau further enhances upper-level anticyclonic circulation [67], suppressing precipitation in central Tibet.
China’s arid–humid climate divide has remained spatially stable over the past 73 years, despite changes in precipitation and temperature on both sides, distinguishing it from more dynamic climate boundaries elsewhere. For instance, North America’s 100th meridian has shifted markedly eastward in response to global warming [4], while the Sahel region in Africa has undergone rapid spatial expansion [68,69]. In contrast, China’s divide exhibits only moderate interannual fluctuations, maintaining a long-term equilibrium in its spatial position.
4.3. Lag Response of Surface and Groundwater to Aridity Changes
The atmospheric aridity analysis indicates that China has entered the wetting phase of its ~32-year climatic oscillation since around 2010. This shift toward wetter conditions is corroborated by Landsat-derived surface water observations, which reveal an overall expansion of surface water bodies beginning around 2013. This trend is further supported by recent global water-monitoring studies reporting substantial expansion of inland water areas across China was found with total, artificial, and natural surface water systems [70].
In contrast, groundwater storage has followed a more heterogeneous trajectory. While groundwater levels have risen on the Tibetan Plateau and in most southern China, many other regions, particularly northern China, continue to experience persistent depletion. This decline in northern China is attributed largely to intensive human extraction [71]. Such divergence between surface water expansion and groundwater depletion underscores a fundamental difference in hydrological response times: surface water reacts rapidly to precipitation anomalies, whereas groundwater recharge is constrained by infiltration capacity and strong anthropogenic pressures [72,73]. Consequently, atmospheric wetting does not promptly translate into widespread groundwater recovery.
4.4. Limitations and Uncertainties
Several limitations should be noted. First, regarding interpolation uncertainties in the TPDC dataset, we cross-validated our results with the independent TerraClimate dataset (Figure 6). The high consistency between them confirms the robustness of the identified arid–humid transition zone. Second, while the Landsat 5-to-8 transition (~2013) may introduce temporal inconsistencies in surface water data, the sustained and significant expansion observed post-2013 indicates a genuine hydro-climatic wetting signal rather than sensor artifacts. Finally, despite the coarse resolution of GRACE data, the use of integrated multi-solution products reliably captures the regional-scale storage trends necessary to characterize the divergence between surface and subsurface water responses.
Furthermore, considering the inherent complexity of land-surface processes and human water management, the observed short-term hydrological shifts should be interpreted as the combined result of multi-decadal aridity oscillations and anthropogenic interventions, rather than simple linear outcomes of climate change.
5. Conclusions
This study has investigated the spatiotemporal evolution of aridity and hydrological responses across China, integrating multi-source climatic datasets during 1950–2022 and satellite-derived datasets since early 2000s. Three principal conclusions emerge: (1) China is currently experiencing a wetting phase within a ~32-year climatic oscillation, marked by a significant expansion of non-dryland zones since late 2000s. (2) A well-defined arid–humid divide persists within the dry subhumid transition zone, reflecting a stable transition belt from the humid southeastern coast to the arid northwestern interior. (3) Hydrological responses to climatic wetting are divergent: while surface water extent has increased since the early 2010s, groundwater storage has continued to decline in many regions, underscoring a lagged and decoupled subsurface response due to human intervention. These findings highlight the complexity of hydrological feedback under climate oscillations and stress the necessity of distinguishing between surface water availability and groundwater sustainability in national water resource planning and climate adaptation strategies.
Author Contributions
Conceptualization, X.S.; methodology, J.H.; software, J.H.; validation, J.H.; formal analysis, J.H.; investigation, J.H.; resources, J.H.; data curation, J.H.; writing—original draft preparation, J.H.; writing—review and editing, H.N., R.L., L.F., Z.D., Y.H., A.H. and X.S.; visualization, J.H.; supervision, X.S.; project administration, X.S.; funding acquisition, X.S. All authors have read and agreed to the published version of the manuscript.
Funding
This research was funded by the National Key Research and Development Program of China (No. 2023YFF0804304 and No. 2020YFC1807103). In addition, Z.D. is grateful to have received funding from the Crafoord Foundation (No. 20200595 and No. 20210552).
Data Availability Statement
The high-resolution climate data and GWSA data used in this study are available from the National Tibetan Plateau/Third Pole Environment Data Center (http://data.tpdc.ac.cn (accessed on 15 September 2025)). TerraClimate data can be accessed at https://www.climatologylab.org/terraclimate.html (accessed on 15 September 2025). Climate indices (ONI, AOI) were obtained from the NOAA website (https://psl.noaa.gov/enso/dashboard.html (accessed on 19 March 2024)), while EASMI, SAMI, and NAOI were sourced from http://lijianping.cn (accessed on 19 March 2024). Desert distribution data were retrieved from the National Glaciers, Frozen Soil, and Desert Data Center (http://www.ncdc.ac.cn (accessed on 19 March 2024)).
Acknowledgments
We acknowledge the data support from the following sources: The datasets (PRE, PET, and GWSA) are provided by the National Tibetan Plateau/Third Pole Environment Data Center, specifically including the precipitation and potential evapotranspiration datasets developed by Peng [40,41,42,43,74] and the integrated groundwater storage anomalies (GWSA) dataset by Zhang Gangqiang [45]. We also thank the National Cryosphere Desert Data Center for providing the desert distribution dataset by Yan and Wang [75].
Conflicts of Interest
The authors declare no conflicts of interest.
Abbreviations
The following abbreviations are used in this manuscript:
| AI | Aridity Index |
| GWSA | Groundwater Storage Anomalies |
| ONI | Oceanic Niño Index |
| EASMI | East Asian Summer Monsoon Index |
| SASMI | South Asian Summer Monsoon Index |
| AOI | Arctic Oscillation Index |
| NAOI | North Atlantic Oscillation Index |
| EAWMI | East Asian Winter Monsoon Index |
References
- Samset, B.; Zhou, C.; Fuglestvedt, J.; Lund, M.; Marotzke, J.; Zelinka, M. Steady global surface warming from 1973 to 2022 but increased warming rate after 1990. Commun. Earth Environ. 2023, 4, 400. [Google Scholar] [CrossRef]
- Foster, G.; Rahmstorf, S. Global temperature evolution 1979–2010. Environ. Res. Lett. 2011, 6, 044022. [Google Scholar] [CrossRef]
- Zhang, C.C.; Yang, Y.T.; Yang, D.W.; Wang, Z.R.; Wu, X.C.; Zhang, S.L.; Zhang, W.J. Vegetation Response to Elevated CO2 Slows Down the Eastward Movement of the 100th Meridian. Geophys. Res. Lett. 2020, 47, e2020GL089681. [Google Scholar] [CrossRef]
- Seager, R.; Lis, N.; Feldman, J.; Ting, M.F.; Williams, A.P.; Nakamura, J.; Liu, H.B.; Henderson, N. Whither the 100th Meridian? The Once and Future Physical and Human Geography of America’s Arid-Humid Divide. Part I: The Story So Far. Earth Interact. 2018, 22, 1–22. [Google Scholar] [CrossRef]
- Nicholson, S.E. The West African Sahel: A Review of Recent Studies on the Rainfall Regime and Its Interannual Variability. Int. Sch. Res. Not. 2013, 2013, 453521. [Google Scholar] [CrossRef]
- Jianping, Y.; Yongjian, D.; Rensheng, C.; Lianyou, L. The fluctuation of dry and wet climate boundary and its causal analyses in china. Acta Meteorol. Sin. 2003, 61, 363–373. [Google Scholar]
- Yin, Y.; Ma, D.; Wu, S. Enlargement of the semi-arid region in China from 1961 to 2010. Clim. Dyn. 2019, 52, 509–521. [Google Scholar] [CrossRef]
- Zhang, H.; Zhang, Q.; Yue, P.; Zhang, L.; Liu, Q.; Qiao, S.; Yan, P. Aridity over a semiarid zone in northern China and responses to the East Asian summer monsoon. J. Geophys. Res.-Atmos. 2016, 121, 13901–13918. [Google Scholar] [CrossRef]
- Fang, J.; Yu, G.; Liu, L.; Hu, S.; Chapin, F.S., III. Climate change, human impacts, and carbon sequestration in China. Proc. Natl. Acad. Sci. USA 2018, 115, 4015–4020. [Google Scholar] [CrossRef]
- Ruan, F.; Yang, Y.; McVicar, T.R.; Guo, H.; Hou, Y. Historical and future shifts of a sharp zonal aridity gradient: A case study of the Hu Line in China. J. Hydrol. 2022, 614, 128590. [Google Scholar] [CrossRef]
- Liu, L.; Wang, Y.; You, N.; Liang, Z.; Qin, D.; Li, S. Changes in aridity and its driving factors in China during 1961–2016. Int. J. Climatol. 2019, 39, 50–60. [Google Scholar] [CrossRef]
- Wen, M.; Cheng, D.; Song, J.; Zhang, G.; Lai, W.; Jiang, W. Impacts of climate change on aridity index and its spatiotemporal variation in the Loess Plateau of China, from 1961 to 2014. Environ. Earth Sci. 2018, 77, 137. [Google Scholar] [CrossRef]
- Li, C.; Fu, B.; Wang, S.; Stringer, L.C.; Wang, Y.; Li, Z.; Liu, Y.; Zhou, W. Drivers and impacts of changes in China’s drylands. Nat. Rev. Earth Environ. 2021, 2, 858–873. [Google Scholar] [CrossRef]
- Qi, J.G.; Chen, J.Q.; Wan, S.Q.; Ai, L.K. Understanding the coupled natural and human systems in Dryland East Asia. Environ. Res. Lett. 2012, 7, 015202. [Google Scholar] [CrossRef]
- Hu, Z.; Chen, X.; Chen, D.; Li, J.; Wang, S.; Zhou, Q.; Yin, G.; Guo, M. “Dry gets drier, wet gets wetter”: A case study over the arid regions of central Asia. Int. J. Climatol. 2019, 39, 1072–1091. [Google Scholar] [CrossRef]
- Deng, H.; Tang, Q.; Yun, X.; Tang, Y.; Liu, X.; Xu, X.; Sun, S.; Zhao, G.; Zhang, Y.; Zhang, Y. Wetting trend in Northwest China reversed by warmer temperature and drier air. J. Hydrol. 2022, 613, 128435. [Google Scholar] [CrossRef]
- Xu, K.; Yang, D.W.; Yang, H.B.; Li, Z.; Qin, Y.; Shen, Y. Spatio-temporal variation of drought in China during 1961–2012: A climatic perspective. J. Hydrol. 2015, 526, 253–264. [Google Scholar] [CrossRef]
- Zhang, H.; Zhang, Q.; Liu, X. Study on the Main Factors of Aridity in Hetao Area of North China. Clim. Change Res. 2016, 12, 20–27. [Google Scholar]
- Ma, Z.; Fu, C.; Yang, Q.; Zheng, Z.; Lu, M.; Li, M.; Duan, Y.; Chen, L. Drying Trend in Northern China and Its Shift during 1951–2016. Chin. J. Atmos. Sci. 2018, 42, 951–961. [Google Scholar]
- Zhang, Y.; Zhang, Y.; Cheng, L.; Cong, N.; Zheng, Z.; Huang, K.; Zhang, J.; Zhu, Y.; Gao, J.; Sun, Y. Have China’s drylands become wetting in the past 50 years? J. Geogr. Sci. 2023, 33, 99–120. [Google Scholar] [CrossRef]
- Shujie, Z.; Yushu, Z.; Pengshi, C.; Fu, C.A.I.; Jinwen, W.U.; Ruipeng, J.I. Change characteristics of humid index and dry/wet climate boundary in Northeast China. Agric. Res. Arid Areas 2011, 29, 226–232. [Google Scholar]
- Xue, L.; Kappas, M.; Wyss, D.; Putzenlechner, B. Assessing the Drought Variability in Northeast China over Multiple Temporal and Spatial Scales. Atmosphere 2022, 13, 1506. [Google Scholar] [CrossRef]
- Wen, Q.; Chen, H. Changes in drought characteristics over China during 1961–2019. Front. Earth Sci. 2023, 11, 1138795. [Google Scholar] [CrossRef]
- Li, W.; Hou, M.; Chen, H.; Chen, X. Study on drought trend in south China based on standardized precipitation evapotranspiration index. J. Nat. Disasters 2012, 21, 84–90. [Google Scholar]
- Ren, R.; Nemoto, T.; Raghavan, V.; Song, X.; Duan, Z. Analysis of Droughts and Floods Evolution and Teleconnection Factors in the Yangtze River Basin Based on GRACE/GFO. Remote Sens. 2025, 17, 2344. [Google Scholar] [CrossRef]
- Huang, H.; Han, Y.; Cao, M.; Song, J.; Xiao, H. Spatial-Temporal Variation of Aridity Index of China during 1960–2013. Adv. Meteorol. 2016, 2016, 1536135. [Google Scholar] [CrossRef]
- Wang, L.; Wen, M.; Song, J.; Dou, X. Spatial-temporal Variation of Aridity Index during 1961–2014 in China. J. Nat. Resour. 2016, 31, 1488–1498. [Google Scholar]
- Shamsudduha, M.; Taylor, R.G. Groundwater storage dynamics in the world’s large aquifer systems from GRACE: Uncertainty and role of extreme precipitation. Earth Syst. Dyn. 2020, 11, 755–774. [Google Scholar] [CrossRef]
- Arifin, A.; Shamsudduha, M.; Ramdhan, A.M.; Rateb, A.; Scanlon, B.R.; Setiawan, T.; Iman, M.I.; Husna, A.; Taylor, R.G. Plausibility Criteria for GRACE-Derived Groundwater Storage Changes From Aquifers Globally. Geophys. Res. Lett. 2025, 52, e2025GL118580. [Google Scholar] [CrossRef]
- Pekel, J.-F.; Cottam, A.; Gorelick, N.; Belward, A.S. High-resolution mapping of global surface water and its long-term changes. Nature 2016, 540, 418–422. [Google Scholar] [CrossRef]
- Liu, C.; Huang, W.; Feng, S.; Chen, J.; Zhou, A. Spatiotemporal variations of aridity in China during 1961–2015: Decomposition and attribution. Sci. Bull. 2018, 63, 1187–1199. [Google Scholar] [CrossRef] [PubMed]
- Ma, Z.; Fu, C. Decadal variations of arid and semi-arid boundary in China. Chin. J. Geophys. 2005, 48, 574–581. [Google Scholar] [CrossRef]
- An, S.; Joye, S.B. Enhancement of coupled nitrification-denitrification by benthic photosynthesis in shallow estuarine sediments. Limnol. Oceanogr. 2001, 46, 62–74. [Google Scholar] [CrossRef]
- An, Z.; Wu, G.; Li, J.; Sun, Y.; Liu, Y.; Zhou, W.; Cai, Y.; Anmin, D.; Li, L.; Mao, J. Global Monsoon Dynamicsand Climate Change. Annu. Rev. Earth Planet. Sci. 2015, 43, 29–77. [Google Scholar]
- Wang, X.; Dettman, D.L.; Wang, M.; Zhang, J.; Saito, Y.; Quade, J.; Feng, S.; Liu, J.; Chen, F. Seasonal wet-dry variability of the Asian monsoon since the middle Pleistocene. Quat. Sci. Rev. 2020, 247, 106568. [Google Scholar] [CrossRef]
- Li, X.-J.; Zhu, B.-Q. Interaction between the Westerlies and Asian Monsoons in the Middle Latitudes of China: Review and Prospect. Atmosphere 2024, 15, 274. [Google Scholar] [CrossRef]
- Chen, W.; Zhang, R.; Wu, R.; Wen, Z.; Zhou, L.; Wang, L.; Hu, P.; Ma, T.; Piao, J.; Song, L.; et al. Recent Advances in Understanding Multi-scale Climate Variability of the Asian Monsoon. Adv. Atmos. Sci. 2023, 40, 1429–1456. [Google Scholar] [CrossRef] [PubMed]
- Yao, T.; Thompson, L.; Yang, W.; Yu, W.; Gao, Y.; Guo, X.; Yang, X.; Duan, K.; Zhao, H.; Xu, B.; et al. Different glacier status with atmospheric circulations in Tibetan Plateau and surroundings. Nat. Clim. Change 2012, 2, 663–667. [Google Scholar] [CrossRef]
- Wang, J.; Zhang, G.; Zhang, W.; Zhou, X.; Liu, J.; Zhu, Z.; Yang, Y.; Yang, Q.; Zhao, K.; Li, X. Seesaw between the westerlies and Asian monsoon regulates vegetation and climate during the last deglaciation in southern Northeast China. Quat. Sci. Rev. 2024, 344, 109008. [Google Scholar] [CrossRef]
- Peng, S.Z.; Ding, Y.X.; Wen, Z.M.; Chen, Y.M.; Cao, Y.; Ren, J.Y. Spatiotemporal change and trend analysis of potential evapotranspiration over the Loess Plateau of China during 2011–2100. Agric. For. Meteorol. 2017, 233, 183–194. [Google Scholar] [CrossRef]
- Peng, S.; Ding, Y.; Liu, W.; Li, Z. 1 km monthly temperature and precipitation dataset for China from 1901 to 2017. Earth Syst. Sci. Data 2019, 11, 1931–1946. [Google Scholar] [CrossRef]
- Ding, Y.; Peng, S. Spatiotemporal Trends and Attribution of Drought across China from 1901–2100. Sustainability 2020, 12, 477. [Google Scholar] [CrossRef]
- Peng, S.; Gang, C.; Cao, Y.; Chen, Y. Assessment of climate change trends over the Loess Plateau in China from 1901 to 2100. Int. J. Climatol. 2018, 38, 2250–2264. [Google Scholar] [CrossRef]
- Abatzoglou, J.T.; Dobrowski, S.Z.; Parks, S.A.; Hegewisch, K.C. TerraClimate, a high-resolution global dataset of monthly climate and climatic water balance from 1958–2015. Sci. Data 2018, 5, 170191. [Google Scholar] [CrossRef] [PubMed]
- Zhang, G.; Xu, T. Global high-resolution water storage anomaly dataset (2002–2022). Nat. Water 2024, 2, 139–150. [Google Scholar] [CrossRef]
- Neng, S. Features of the East Asian Winter Monsoon Intensity on Multiple Time Scale in Recent 40 Years and Their Relation to Climate. J. Appl. Meteorol. Sci. 1996, 7, 175–182. [Google Scholar]
- UNEP. World Atlas of Desertification; The United Nations Environment Programme (UNEP): London, UK, 1992. [Google Scholar]
- Chai, R.; Mao, J.; Chen, H.; Wang, Y.; Shi, X.; Jin, M.; Zhao, T.; Hoffman, F.; Ricciuto, D.; Wullschleger, S. Human-caused long-term changes in global aridity. npj Clim. Atmos. Sci. 2021, 4, 65. [Google Scholar] [CrossRef]
- Ullah, S.; You, Q.; Sachindra, D.; Nowosad, M.; Ullah, W.; Bhatti, A.; Jin, Z.; Ali, A. Spatiotemporal changes in global aridity in terms of multiple aridity indices: An assessment based on the CRU data. Atmos. Res. 2022, 268, 105998. [Google Scholar] [CrossRef]
- Lu, J.Y.; Yao, L.; Qin, J.; Jiang, H.; Zhou, C.H. Global reconstruction of gridded aridity index and its spatial and temporal characterization from 2003 to 2022. Int. J. Digit. Earth 2025, 18, 2473639. [Google Scholar] [CrossRef]
- Yao, L.; Lu, J.; Jiang, H.; Liu, T.; Qin, J.; Zhou, C. Satellite-derived aridity index reveals China’s drying in recent two decades. iScience 2023, 26, 106185. [Google Scholar] [CrossRef]
- Zhang, S.; Chen, Y.; Guo, H.; Lu, Y.; Guo, X.; Liu, C.; Zhou, X.; Zhang, Y. Changes in dryland areas and net primary productivity in China from 1980 to 2020. J. Earth Syst. Sci. 2023, 132, 83. [Google Scholar] [CrossRef]
- Xiao, X.; Qiu, X.; Xu, J. Characteristics of Dry and Wet Climate Change in China from 1960 to 2019 Based on TerraClimate Dataset. J. Yangtze River Sci. Res. Inst. 2023, 40, 27. [Google Scholar]
- Li, M.; Wu, P.; Ma, Z.; Liu, J. Climate change reshapes bioclimatic environments in China’s dry-wet transition zones. J. Hydrol. 2024, 634, 131122. [Google Scholar] [CrossRef]
- Yu, Z.; Sha, X.; Xiong, J.; Hu, Y.; Yang, W.; Zhang, Y.; Yao, X. Where to forestation in dry-wet transition areas of China? Ecol. Front. 2024, 44, 1320–1328. [Google Scholar] [CrossRef]
- Wu, X.L.; Zhang, C.J.; Dong, S.Y.; Hu, J.H.; Tong, X.Y.; Zheng, X.N.A. Spatiotemporal changes of the aridity index in Xinjiang over the past 60 years. Environ. Earth Sci. 2023, 82, 392. [Google Scholar] [CrossRef]
- Jiang, J.; Jiang, D.; Lin, Y. Monsoon Area and Precipitation over China for 1961–2009. Chin. J. Atmos. Sci. 2015, 39, 722–730. [Google Scholar]
- Liu, C.; Hu, R.; Wang, Y.; Lin, H.; Wu, D.; Dai, Y.; Zhu, Y.; Liu, Z.; Yang, D.; Zhang, Q.; et al. Integrating ICESat-2 laser altimeter observations and hydrological modeling for enhanced prediction of climate-driven lake level change. J. Hydrol. 2023, 626, 130304. [Google Scholar] [CrossRef]
- Diao, Y.; Guo, J.; Zhang, Y.; Hou, Z.; Luo, B. Trend turning of North China summer extreme precipitations around early 2000s and its possible reason. Clim. Dyn. 2023, 61, 5367–5386. [Google Scholar] [CrossRef]
- Xie, Z.; Fu, Y.; He, H.S.; Wang, S.; Wang, L.; Liu, C. Increases in extreme precipitation expected in Northeast China under continued global warming. Clim. Dyn. 2024, 62, 4943–4965. [Google Scholar] [CrossRef]
- Han, Y.; Tian, X. Significant increase in humidity since 2003 in Qinghai Province, China: Evidence from annual and seasonal precipitation. Environ. Monit. Assess. 2023, 195, 1549. [Google Scholar] [CrossRef]
- Ma, Z. The interdecadal trend and shift of dry/wet over the central part of North China and their relationship to the Pacific Decadal Oscillation (PDO). Chin. Sci. Bull. 2007, 52, 2130–2139. [Google Scholar] [CrossRef]
- Qian, C.; Zhou, T. Multidecadal Variability of North China Aridity and Its Relationship to PDO during 1900–2010. J. Clim. 2014, 27, 1210–1222. [Google Scholar] [CrossRef]
- Wu, K.; Liu, H.; Zhao, L.; Lin, Y.; Yang, Z. The strengthening relationship between summer rainfall over North China and PDO since the mid-2000s. Front. Earth Sci. 2022, 10, 957940. [Google Scholar] [CrossRef]
- Peng, Y.; Gao, Q.; Liu, Y. The influence of El Nino on different types of persistent summer precipitation in the eastern China monsoon region. Acta Meteorol. Sin. 2023, 81, 375–392. [Google Scholar]
- Chun, L.I.; Dehai, L.U.O.; Zhifang, F.; Houfu, Z. Linkage of Inter-decadal Variations of the Arctic Oscillation and Summer Precipitation over North China. J. Nanjing Inst. Meteorol. 2005, 28, 755–762. [Google Scholar]
- Liu, Y.; Lu, M.; Yang, H.; Duan, A.; He, B.; Yang, S.; Wu, G. Land-atmosphere-ocean coupling associated with the Tibetan Plateau and its climate impacts. Natl. Sci. Rev. 2020, 7, 534–552. [Google Scholar] [CrossRef]
- Sylla, M.B.; Gaye, A.T.; Jenkins, G.S.; Pal, J.S.; Giorgi, F. Consistency of projected drought over the Sahel with changes in the monsoon circulation and extremes in a regional climate model projections. J. Geophys. Res.-Atmos. 2010, 115, D16108. [Google Scholar] [CrossRef]
- Janowiak, J.E. An Investigation of Interannual Rainfall Variability in Africa. J. Clim. 1988, 1, 240–255. [Google Scholar] [CrossRef]
- Zhu, Y.; Ye, A.; Zhang, Y. Changes of total and artificial water bodies in inland China over the past three decades. J. Hydrol. 2022, 613, 128344. [Google Scholar] [CrossRef]
- Zhao, K.; Fang, Z.; Li, J.; He, C. Spatial-temporal variations of groundwater storage in China: A multiscale analysis based on GRACE data. Resour. Conserv. Recycl. 2023, 197, 107088. [Google Scholar] [CrossRef]
- Zhong, Y.; Tian, B.; Kim, H.; Yuan, X.; Liu, X.; Zhu, E.; Wu, Y.; Wang, L.; Wang, L. Over 60% precipitation transformed into terrestrial water storage in global river basins from 2002 to 2021. Commun. Earth Environ. 2025, 6, 53. [Google Scholar] [CrossRef]
- Kuang, X.; Liu, J.; Scanlon, B.R.; Jiao, J.J.; Jasechko, S.; Lancia, M.; Biskaborn, B.K.; Wada, Y.; Li, H.; Zeng, Z.; et al. The changing nature of groundwater in the global water cycle. Science 2024, 383, eadf0630. [Google Scholar] [CrossRef] [PubMed]
- Shouzhang, P. 1-km monthly precipitation dataset for China (1901–2024). Earth Syst. Sci. Data 2025, 11, 1931–1946. [Google Scholar] [CrossRef]
- Yan, C.; Wang, J. 1:100000 Desert (Sand) Distribution Data Set in China; National Cryosphere Desert Data Center (NCDC): Lanzhou, China, 2021. [Google Scholar] [CrossRef]


Disclaimer/Publisher’s Note: The statements, opinions and data contained in all publications are solely those of the individual author(s) and contributor(s) and not of MDPI and/or the editor(s). MDPI and/or the editor(s) disclaim responsibility for any injury to people or property resulting from any ideas, methods, instructions or products referred to in the content. |
© 2026 by the authors. Licensee MDPI, Basel, Switzerland. This article is an open access article distributed under the terms and conditions of the Creative Commons Attribution (CC BY) license.