Highlights
What are the main findings?
- We propose a novel similarity metric based on the receptive field to replace the traditional IoU for obtaining similarity scores.
- In the label assignment strategy, we integrate classification scores and Gaussian similarity scores to comprehensively screen candidate samples in order to obtain highquality candidates.
- We propose a Multi-scale Hybrid Attention module that integrates multi-scale local attention and global attention to enhance the feature representation of tiny objects.
What are the implications of the main findings?
- BCDet can be easily integrated into both anchor-based and anchor-free detectors, significantly enhancing the robustness and scalability of tiny object detection in remote sensing images under complex environmental conditions.
- Compared to existing state-of-the-art methods, this approach achieves superior performance on the AI-TOD-v2 and VisDrone2019 datasets.
Abstract
The rapid development of Convolutional Neural Networks (CNNs) has markedly boosted the performance of object detection in remote sensing. Nevertheless, tiny objects typically account for an extremely small fraction of the total area in remote sensing images, rendering existing IoU-based or area-based evaluation metrics highly sensitive to minor pixel deviations. Meanwhile, classic detection models face inherent bottlenecks in efficiently mining discriminative features for tiny objects, leaving the task of tiny object detection in remote sensing images as an ongoing challenge in this field. To alleviate these issues, this paper proposes a tiny object detection method based on Normalized Gaussian Label Assignment and Multi-scale Hybrid Attention. Firstly, 2D Gaussian modeling is performed on the feature receptive field and the actual bounding box, using Normalized Bhattacharyya Distance for precise similarity measurement. Furthermore, a candidate sample quality ranking mechanism is constructed to select high-quality positive samples. Finally, a Multi-scale Hybrid Attention module is designed to enhance the discriminative feature extraction of tiny objects. The proposed method achieves 25.7% and 27.9% AP on the AI-TOD-v2 and VisDrone2019 datasets, respectively, significantly improving the detection capability of tiny objects in complex remote sensing scenarios.
1. Introduction
In recent years, deep neural networks (such as CNNs and Transformers) have made significant progress on public object detection benchmarks, including COCO and PASCAL VOC, with their general object detection performance continuously improving. However, most of these methods are designed for objects with moderate resolution and large scales, and struggle to handle “tiny objects” that occupy only a few pixels in images and have indistinct appearance features. In complex remote sensing scenarios, taking the AI-TOD [1] dataset as an example, tiny objects are usually smaller than 16 × 16 pixels. Thus, detectors struggle to extract sufficient discriminative features, resulting in a large number of false detections and false negatives during the inference of benchmark detectors [2].
To alleviate the aforementioned problems, numerous researchers have recently been committed to improving the performance of detectors on tiny objects. Kisantal et al. [3] addressed the issue of insufficient tiny object count in individual images by copying existing objects within the images. Ma et al. [4] further enhanced image saliency from the perspective of superpixel generation by means of a differentiable superpixel method. In addition, the introduction of dedicated feature extraction architectures can strengthen the ability to extract discriminative features of tiny objects, thereby boosting model performance. For instance, FDNet [5] incorporates saliency-aware deformable convolution (SD-Conv) layers and adaptive Fourier convolution (AF-Conv) layers to further enhance local subtle features and global contextual features. FreDNet [6] proposes a denoising-bypassed residual block (DRB) to suppress frequency-domain noises while preserving edge structures.
Although these methods have been well validated in practice, they usually involve complex feature fusion strategies or time-consuming sampling paradigms. In addition, they ignore the key point of model training, namely the positive and negative sample label assignment strategy. In other words, for tiny objects, the anchors assigned to each ground truth (GT) bounding box often fail to meet practical requirements. This is because the Intersection over Union (IoU) metric cannot accurately measure the positional offset of tiny objects. More critically, mainstream label assignment strategies mostly rely on predefined metrics, which are prone to causing imbalanced assignment results, thus leading the model to focus on normal-scale objects while neglecting tiny objects during training. As shown in Figure 1a, the same pixel deviation exerts different impacts on objects of varying sizes. Even slight pixel deviations in tiny objects can lead to a significant drop in IoU scores (from 0.33 to 0.05), making IoU an extremely sensitive metric for such objects. However, for medium-sized objects with more pixels, the same pixel deviation has a milder impact on IoU scores (from 0.75 to 0.69). Furthermore, the calculation mechanism of IoU means it cannot accurately measure the similarity between two non-intersecting bounding boxes (i.e., IoU is always 0). In tiny object detection tasks, non-intersections are extremely common, which further highlights the limitations of IoU in this scenario. Similarly, for anchor-free detectors, as shown in Figure 1b, the extremely small pixel count of tiny objects results in very few anchor points within the GT region, directly affecting the assignment of positive and negative sample labels. This prevents the detector from obtaining sufficient positive samples, thereby impairing its performance.
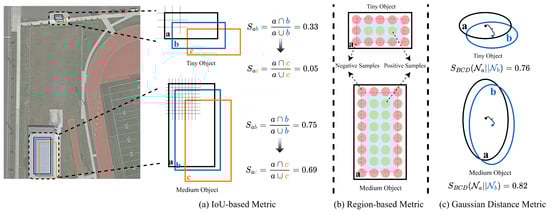
Figure 1.
Comparison of IoU-based metric, region-based metric, and Gaussian distance metric. The a represents the GT, and the b, and c are candidate priors.
To address the drawbacks of IoU-based and area-based methods in assigning training samples, this paper proposes BCDet, a tiny object detection method based on Normalized Gaussian Label Assignment and Multi-scale Hybrid Attention. The method includes a novel similarity measurement approach for tiny bounding boxes, which is integrated with a custom label assignment strategy. Meanwhile, a Multi-scale Hybrid Attention module is incorporated into the network to further improve the detection performance for tiny objects. Specifically, as shown in Figure 1c, we first model the receptive field of feature points on the feature map directly as a 2D Gaussian distribution, and then use the Bhattacharyya Distance (BCD) [7] to quantify the similarity between the two Gaussian distributions. Further, we adopt a nonlinear transformation function to remap the BCD value and normalize its range, ultimately obtaining the Normalized Bhattacharyya Distance () metric. In the subsequent positive and negative sample label assignment process, in order to select high-quality candidate samples, we introduce predicted classification confidence into the label assignment process and combine it with the proposed to jointly measure the quality of candidate samples, thereby avoiding the phenomenon of high classification confidence but low localization score or low classification confidence but high localization score. In addition, existing mainstream object detection networks consistently use four convolutional layers to predict location and classification when processing object features of different scales in the detection head. Such a simple feature extraction method has poor localization and classification effects for tiny objects. In order to alleviate this problem, this method employs a Multi-scale Hybrid Attention module to enhance the feature extraction capability of the detection network for tiny objects. By combining global self-attention feature maps and local multi-scale attention feature maps, the ability to recognize details of tiny objects is further enhanced, thereby improving the feature extraction capability of general object detectors.
The main contributions of this paper are summarized as follows.
- We propose an efficient small object detection method called BCDet. This method measures the similarity between Gaussian distributions using a Normalized Gaussian Label Assignment (NGLA) strategy instead of the IoU metric, and designs a classification–localization joint quality screening strategy to optimize sample allocation. Furthermore, we construct a Multi-scale Hybrid Attention module (MSHA) to enhance the perception of small object features and improve the detector’s performance on small object detection tasks.
- We introduce a Normalized Gaussian Label Assignment (NGLA) strategy. This strategy introduces a symmetric and scale-invariant metric to quantify the similarity between two Gaussian distributions, thus overcoming the scale sensitivity of WD [8] and the asymmetry of KLD [9]. Furthermore, this paper constructs a candidate sample quality ranking mechanism to dynamically filter candidate samples with both high classification confidence and high localization accuracy, thereby solving the problem of imbalance between classification and localization scores in traditional assignment strategies.
- We utilize a Multi-scale Hybrid Attention module (MSHA) to integrate global attention and multi-scale local convolution features. By using multi-branch dilated convolution, the discriminative features of tiny objects are captured, enhancing the spatial sensitivity and scale adaptability of the detection head to tiny objects.
- The proposed method performs well on the AI-TOD-v2 dataset and the VisDrone-2019 dataset. It achieves state-of-the-art performance in common Anchor-free-type detectors such as FCOS [10], Anchor-based-type detectors such as Faster R-CNN [11], and the latest benchmark detection network, DetectoRS [12].
2. Related Work
2.1. Object Detection
Most existing object detection frameworks are designed based on the Convolutional Neural Network (CNN) and are constantly being improved to achieve better feature learning [13,14,15,16,17,18,19]. Furthermore, object detection methods are divided into anchor-based detectors [11,12,20,21,22,23] and anchor-free detectors [10,23,24,25,26] based on whether they pre-set candidate anchor boxes to match the GT. Classic anchor-box-based detectors can be categorized into single-stage and two-stage detectors, depending on whether a Region Proposal Network (RPN) is used to generate region proposals for prediction. Faster R-CNN [11], Cascade R-CNN [20], and DetectoRS [12] are typical two-stage networks, where the training process includes region proposal extraction and detection. In contrast, single-stage target detectors, such as SSD [22] and RetinaNet [21], directly predict the bounding boxes and class probabilities of the object. Anchor-based detectors suffer from extreme sensitivity of the IoU metric to tiny objects. Moreover, most preset anchor boxes have no overlap with the GT, making IoU unable to directly measure their similarity (i.e., the IoU score remains zero), which consequently leads to poor performance of anchor-based baseline detectors.
Besides the anchor-based detectors mentioned above, there are also some anchor-free detectors, such as CornerNet [27], CenterNet [28], and FCOS [10]. These methods achieve object localization by predicting the center or corner points of the object. Recent anchor-free detectors, such as DETR [29], Spare R-CNN [30], RT-DETR [31], TinyDef-DETR [32], and DCC-DETR [33], focus on removing the NMS process while achieving higher overall performance to further improve inference speed. Similar to anchor-based detectors, the region-based strategy used by anchor-free detectors for determining positive and negative samples is also extremely unfriendly to tiny objects with an inherently minimal area.
In this work, we propose a novel label assignment strategy that includes a distance-based metric and a quality-based ranking assignment strategy to alleviate the sample imbalance caused by IoU-based and region-based metrics.
2.2. Tiny Object Detection
Mainstream tiny object detection methods primarily enhance the feature learning capability for tiny objects by strengthening the network architecture or introducing additional components. Firstly, training specific detectors at different scales can improve their performance, but this often incurs significant memory and computational costs. To address this issue, the Feature Pyramid Network (FPN) [34] constructs a feature-level pyramid, integrating information from features at different scales through a top-down architecture. Building upon FPN, several works, such as PANet [35], BiFPN [36], and RecursiveFPN [12], have introduced structural modifications to enhance the network’s ability to extract multi-scale features. Zhu et al. [37] introduce the Hessian matrix to detect more feature points to improve image feature detection. MTNet [38] avoids the influence of noisy labels by co-training three different branch networks. Zhang et al. [39] integrate a spatial pyramid mechanism into the FPN, generating multi-region hierarchical feature maps of varying sizes. Liu et al. [40] develop a saliency detection module to facilitate the fusion of deep and shallow features, thereby effectively reducing the influence of complex backgrounds. MAN [41] proposes a multi-level, multi-scale meta-classifier module to improve feature discrimination capability. ESL-YOLO [42] proposes an effective feature enhancement module that integrates local features at different scales to enhance the perception of tiny objects. FANet [43] employs multi-scale patchwise frequency-domain filtering to adaptively enhance the texture and contour details of tiny objects.
In addition, tiny objects typically occupy minuscule regions within an image, resulting in an extremely limited number of candidate samples available for optimization. ATSS [44] sets a dynamic threshold based on the mean and standard deviation of IoU values from a set of anchors to dynamically assign positive and negative samples. NWD [2] adopts the Gaussian Wasserstein Distance to reduce the metric sensitivity to tiny objects, thereby enabling the model to mine more positive samples, and proposes a Ranking Label Assignment (RKA) strategy, which sorts candidate samples and selects the top-k candidates as positive samples, replacing the Max-IoU Assigner strategy. RFLA [45] and KLDet [46] introduce the Kullback–Leibler Divergence (KLD) as a similarity metric to balance the distribution of positive samples across various scales in the anchor box matching process. Fu et al. [47] introduce an Adaptive Dynamic Anchor Mining Strategy (ADAS), dynamically selecting the top-k positive samples to balance the distribution bias between positive and negative samples. DCFL [48] designs a coarse-to-fine label assignment strategy, providing appropriate and relatively balanced supervision for different instances.
3. Proposed Method
3.1. Overview
The proposed BCDet based on Normalized Gaussian Label Assignment and Multi-scale Hybrid Attention employs a Normalized Bhattacharyya Distance metric to measure the similarity between candidate samples and GT. Label assignment is then performed, incorporating both classification and localization scores to measure similarity, thus avoiding the imbalance in positive and negative sample assignment caused by IoU-based and area-based methods. Furthermore, considering the limitations of existing general detection networks in feature extraction, we propose a cross-scale Hybrid Attention module to improve the network’s ability to represent the features of tiny objects. The architecture of our method is shown in Figure 2. Specifically, the BCDet method uses Faster R-CNN and FCOS as benchmark detection networks. First, the input feature map undergoes feature extraction and fusion through a backbone network and feature pyramid to obtain a feature map. For the obtained feature map, firstly, 2D Gaussian modeling is performed on each feature point based on its receptive field to obtain a 2D Gaussian distribution representation corresponding to each feature point, and the GT is modeled based on its data annotations. Subsequently, a novel Normalized Gaussian Label Assignment method is used to calculate the similarity score between the Gaussian distribution of each feature point and the GT. Based on the obtained similarity scores, quality-ranked label assignment is performed. Combining the classification score and localization score, a corresponding quality score is provided for each candidate sample. The quality scores are then sorted in descending order, and the top-k candidate samples are selected as positive samples. Simultaneously, in the detection head part of the detection network, a Multi-scale Hybrid Attention module is introduced to perform global attention feature extraction and multi-scale feature extraction on the feature map, further improving detection capability.
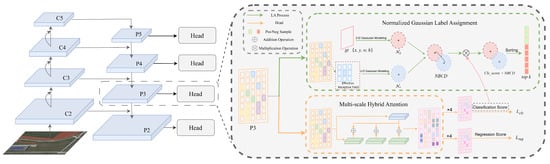
Figure 2.
Schematic diagram of BCDet.
3.2. 2D Gaussian Modeling
For tiny objects in remote sensing images, most GTs are not consistent with the labeled information. The edges of their bounding boxes often have some background pixels. On the contrary, the foreground pixels of the bounding boxes are concentrated in the center of the bounding boxes. In order to better describe the weight of each pixel in the bounding box, the idea of Gaussian distribution is introduced to give the highest weight to the central pixel of the bounding box and gradually decrease it from the center to the boundary. Following the modeling approach of previous work, the positions of feature points (, ) on the feature map output by FPN [34] are assigned to the mean vector of its standard 2D Gaussian distribution, and half of the theoretical receptive field (TRF) is assigned to . The square of is used as the covariance in the 2D Gaussian distribution, thus obtaining the 2D Gaussian distribution representation = (, ) of the ERF. Furthermore, for the GT(, , , ), where (, ) are the center coordinates of the GT, serving as the mean vector of its standard 2D Gaussian distribution, and (, ) are the width and height of the GT, respectively, the covariance in its standard 2D Gaussian distribution is formed using (, ). and together constitute the standard 2D Gaussian distribution representation = (, ) of the GT. The proposed expressions for = (, ) and = (, ) are as follows:
3.3. Normalized Gaussian Label Assignment
In traditional anchor-based object detection networks, whether they are a single-stage object detection network, such as RetinaNet [21], or a two-stage object detection network, such as Faster R-CNN [11], Cascade R-CNN [20], and DetectoRS [12], sample boxes of different scales and proportions are generated in advance, and IoU is used to determine the measure of positive and negative samples. For the IoU of all sample boxes, MaxIoUAssigner is used as the label allocation strategy, which mainly allocates positive and negative samples to candidate sample boxes by setting positive and negative thresholds. When the IoU score of a specific sample box exceeds the positive threshold, it will be assigned a positive sample label. Conversely, when the IoU of a specific sample box is lower than the negative threshold, it will be assigned a negative sample label. Sample boxes with IoU between the positive and negative thresholds will be ignored. This allocation strategy tends to allocate more positive training samples within a certain scale range. In order to alleviate this phenomenon, existing works [2,45] proposed a ranking-based label assignment strategy. By ranking the similarity scores of sample boxes, positive sample labels are assigned to the top-k scores corresponding to a specific GT, and negative sample labels are assigned to the remaining anchor points. Although the ranking-based label assignment strategy can effectively provide sufficient sample supervision for tiny objects, it ignores the impact of classification scores on detection performance. When only the localization score is used as the basis for positive and negative sample assignment, a situation of high localization score and low classification score often occurs.
To alleviate this phenomenon, we propose a new positive and negative sample label assignment strategy called Normalized Gaussian Label Assignment (NGLA). Specifically, we use Normalized Bhattacharyya Distance () as a more robust localization metric, then combine it with classification confidence to form a comprehensive quality score. Finally, based on this quality score, we rank and select the top-k samples with the highest comprehensive quality for each GT bounding box as positive samples.
In measuring the similarity between candidate bounding boxes and GT, benchmark detectors often suffer from a lack of sufficient positive samples. First, in previous work [45], the Wasserstein distance (WD) [8] between the 2D Gaussian distributions of the preset candidate boxes and the GT is used in the anchor-based detection network to replace IoU as the similarity score. Given the 2D Gaussian distribution = (, ) of the preset candidate boxes and the 2D Gaussian distribution = (, ) of the GT boxes, the second Wasserstein distance (WD) between them can be expressed as follows:
where is the Frobenius norm.
As can be observed from Equation (2), the second Wasserstein Distance metric primarily consists of the following two components: and . The term reflects the distance between the center points of the predicted and ground-truth bounding boxes, while captures the discrepancy in their width–height characteristics. Although WD can enhance the performance for tiny objects, the decoupled optimization of center points and dimensions leads to localization bias in the final detection results. Moreover, the inherent lack of scale invariance in WD significantly limits its generalization capability. To mitigate the performance limitations caused by WD’s lack of scale invariance, existing studies [45,46] have proposed using the Kullback–Leibler Divergence (KLD) [9] as an alternative metric. However, when the overlap between two distributions is negligible, KLD fails to consistently reflect the inter-distribution distance [45], revealing its inherent asymmetry. Based on these observations, we introduce the symmetric Bhattacharyya Distance (BCD) [7] to measure the divergence between the Gaussian distributions = (, ) and = (, ). The specific formulation is as follows.
where represents the determinant of a matrix and = .
By calculating the BCD, we can quantify the similarity between the candidate sample and the GT in a 2D Gaussian distribution. A larger BCD indicates a lower similarity between the candidate sample and the GT. The BCD possesses the same scale invariance as the KLD, while also possessing the symmetry that the KLD lacks. This further indicates that the BCD is more suitable for measuring the distance between two Gaussian distributions. However, the BCD yields values within the range of (0, ) when the distance between two distributions is calculated. Although this range can reflect the divergence between different samples, the inherent uncontrollability of such unbounded values renders the BCD unsuitable for the subsequent label assignment of positive and negative samples. By performing a nonlinear transformation on , we can control its value range within (0, 1), resulting in a value range approximately similar to that of IoU, which further improves the adaptability of the transformed BCD to different label assignment strategies. After normalization, we obtain the final metric, namely, Normalized Bhattacharyya Distance (), as follows.
Given that NBCD scores fall within the range (0, 1), where a higher score indicates a greater similarity between the candidate box and the GT, this property can be directly adapted to the positive–negative sample partitioning rules. Furthermore, previous WD-based work [2] only considers the localization quality of anchor boxes while ignoring the impact of classification accuracy. Therefore, in the positive and negative sample label assignment process, we adopt the localization score calculated by the proposed , while simultaneously introducing the corresponding classification score to jointly measure the similarity between each candidate box and the GT. On this basis, we select the top-k most similar samples to each GT as positive samples. Specifically, while maintaining the ranking, a new quality score is formed by introducing a classification score during label assignment and combining it with the localization score. is then ranked and filtered to retain predictions with both high localization and high classification scores for the detector during training and inference. is specifically expressed as = × , where cls represents the classification score of a specific bounding box, reg represents the localization score, and the balancing factor adjusts the weights of the two scores in .
Generally, in traditional tiny object detection networks, the GT of tiny objects rarely overlaps with most candidate bounding boxes. This prevents the assignor from assigning labels to candidate boxes based on ranking using IoU scores. Conversely, even if candidate boxes do not overlap, consistently responds to the similarity between candidate boxes and their corresponding bounding boxes, as well as the degree of matching with the GT. At the same time, the introduction of quality score further encourages the network to dynamically select high-quality samples from the perspective of joint optimization. In the positive and negative sample label assignment during the inference stage, the introduction of the quality score can promote the assignment of positive samples to have both high regression scores and high classification scores, thereby providing high-quality candidate samples in the subsequent NMS process and further improving the detection network’s ability to detect tiny objects.
3.4. Multi-Scale Hybrid Attention
To improve the feature representation capability of benchmark detectors for tiny objects, this paper proposes a Multi-scale Hybrid Attention module (MSHA). The feature map after feature pyramid feature fusion is processed by a global attention mechanism and a multi-scale local attention mechanism to output global features and multi-scale local features. These features are then fused to obtain more discriminative features of tiny objects, thereby improving the detection performance. The overall design of the MSHA is shown in Figure 3. In the MSHA module, the input feature map is mainly processed through the following two aspects: global attention and multi-scale local attention for global and local feature extraction. In global attention, , , and are first obtained through a 1 × 1 convolutional mapping, which can be represented as follows.
where represents the convolution operation with a kernel size of 1.
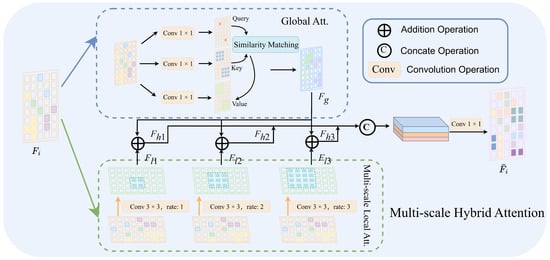
Figure 3.
Schematic diagram of Multi-scale Hybrid Attention (MSHA).
For the self-attention module widely used in existing methods, similarity matching can be performed using and to obtain the corresponding attention weight W(,), which is then multiplied with to obtain the final global attention feature map .
In multi-scale local attention, we employ a multi-branch structure. Within each branch, convolutional operations with different dilation rates (i.e., 1, 2, 3) are performed to obtain feature representations at different scales. Convolutions with smaller dilation rates tend to capture feature representations of smaller objects, and vice versa. The feature maps output by each branch through convolutions with three different dilation rates are shown below.
where represents a convolution operation with a kernel size of 3, and rate represents the dilation rate in the convolution operation. , , and represent local features at different scales extracted by convolution operations with different dilation rates.
Then, by adding the local feature maps of each branch to the obtained , a hybrid attention feature representation can be obtained. Further concatenation of the three hybrid feature maps and dimensional alignment using a 1 × 1 convolution yields the final output feature map .
where represents the concatenation operation.
4. Experiments
4.1. Experiment Settings
All experiments with the proposed BCDet method were run on an NVIDIA RTX TITAN GPU (NVIDIA Corporation, Santa Clara, CA, USA), and experiments were conducted using the MMDetection toolkit (2.13.0) [49] and PyTorch (1.10.0) [50]. Similar to the benchmark object detectors, we used a “backbone network–feature pyramid–detector head” architecture, where the backbone network used ResNet50 [51] pre-trained on ImageNet. The effectiveness of the proposed method was validated on the AI-TOD-v2 [2] and VisDrone2019 [52] datasets. All models were trained for 12 epochs (1× learning policy) using a stochastic gradient descent (SGD) optimizer. To better handle tiny objects, we used layers P2–P6 of the feature pyramid. During inference, the IoU threshold for non-maximum suppression (NMS) was set to 0.5, and the first 3000 bounding boxes were saved to fit the prediction of tiny objects. Unless otherwise stated, all experiments should use the parameters described above.
4.1.1. AI-TOD-v2 Dataset
The AI-TOD-v2 dataset [2] comprises 28,036 remote sensing images and 700,621 object instances. AI-TOD-v2 is based on AI-TOD, re-annotating it without changing the number of images and adding 52,133 instances, while reducing label noise and mislabeling issues. The dataset includes the following eight categories: aircraft, bridges, storage-tanks, ships, swimming-pools, vehicles, people, and windmills.
4.1.2. VisDrone2019 Dataset
The VisDrone2019 dataset is a large-scale public dataset widely used for drone vision tasks. Released by the Machine Learning and Data Mining Laboratory of Tianjin University, it aims to promote computer vision research in drone scenarios. The dataset contains 10,209 images, including 6271 training images, 548 validation images, and 3190 test images. It mainly includes image and video data from various complex scenes, including urban areas, rural areas, airports, highways, and other environments. This dataset is characterized by varied perspectives, large differences in target scale, and complex backgrounds, effectively simulating the challenges of real-world applications.
4.2. Comparison of State-of-the-Art Methods
To verify the detection performance and generalization ability of the proposed method on the tiny object detection task, this section conducts experimental comparisons on the highly challenging tiny object detection datasets AI-TOD-v2 [2] and VisDrone2019 [52]. Meanwhile, since the proposed directly measures the similarity between the feature receptive field and the GT, the proposed BCDet can be adapted to both anchor-based and anchor-free detection networks. In this section, we run BCDet on the common anchor-free detector FCOS [10], the anchor-based detector Faster R-CNN [11], and the latest benchmark detection network DetectoRS [12]. The accuracy comparisons on the AI-TOD-v2 dataset and the VisDrone2019 dataset are shown in Table 1 and Table 2, respectively.

Table 1.
Accuracy (%) of the baseline detector and our proposed detector on the AI-TOD-v2 test set. , , , and denote the average precision of , , , and objects, respectively. “Schedule” denotes the number of epochs for training, in which “1×” corresponds to 12 epochs and “4×” means 48 epochs. * means using P2–P6 of FPN. NWD-RKA [2], RFLA [45], SR-TOD [53], and Bian et al. [54] are employed based on the DetectoRS. † denotes a re-implementation of the results with the same experiment setting. “w/” denotes “with”. Bold fonts indicate the best performance.
Table 2.
Accuracy (%) comparisons on the VisDrone2019 Dataset. * means that the detector is embedded with BCDet. NWD-RKA is employed based on the DetectoRS. † denotes a re-implementation of the results with the same experiment setting. Bold fonts indicate the best performance.
4.2.1. Comparative Experiments on the AI-TOD-v2 Dataset
On the AI-TOD-v2 dataset, firstly, Table 1 shows the accuracy performance of NWD-RKA and RFLA, both implemented on DetectoRS. Table 1 shows that compared to the benchmark detectors, FCOS, Faster R-CNN, and DetectoRS, after introducing DDet, improved by 3.3%, 9.0%, and 9.7%, respectively. Meanwhile, compared to NWD-RKA and RFLA, which also use DetectoRS as the benchmark detection network, BCDet still maintained a significant advantage (1.6% higher than NWD-RKA and 1.2% higher than RFLA). Furthermore, compared to YOLC, which uses a 4× training strategy, the proposed BCDet achieved higher detection performance with less training. In addition, in the and high-precision metrics, FCOS, Faster R-CNN, and DetectoRS, after introducing BCDet, improved by 9.5% and 0.5%, 24.0% and 4.7%, and 23.5% and 6.4%, respectively. Specifically, regarding accuracy metrics at different scales, for the parameters and related to tiny objects, BCDet achieved improvements of 3.9% and 2.4%, 8.2% and 12.0%, and 8.4% and 13.2% on three different benchmark detectors, respectively. For small-scale and medium-scale objects, the introduction of BCDet also maintained similar improvements. This not only validates the effectiveness of our method across different benchmark detection frameworks, but also highlights the significant improvement the proposed method makes in detecting tiny objects.
4.2.2. Comparative Experiments on the VisDrone2019 Dataset
As shown in Table 2, the performance evaluation on the VisDrone2019 dataset reveals the superiority of our method. Similar to the results in Table 1, NWD-RKA represents its accuracy performance on DetectoRS. Specifically, we use FCOS and Faster R-CNN to illustrate the performance improvements of the proposed BCDet on anchor-free and anchor-based detection networks, respectively, and then mount BCDet on DetectoRS to achieve the highest accuracy breakthrough. The results show that FCOS w/BCDet and Faster R-CNN w/BCDet improved the by 1.8% and 2.8%, respectively, compared to the original benchmark detection networks. Meanwhile, DetectoRS w/BCDet outperformed the state-of-the-art models on all accuracy metrics, achieving the best performance with 27.9% . Furthermore, when the accuracy metrics are compared to objects of different scales, BCDet still provides excellent performance improvements. As shown in Table 2, in the and metrics related to tiny objects, introducing BCDet resulted in improvements of 3.2% and 3.4% , 5.2% and 5.0% , and 5.2% and 2.5% on three benchmark detectors, respectively. Finally, DetectoRS w/BCDet outperformed NWD-RKA using Wasserstein distance by 1.4% and 0.4% in and , respectively, further validating the effectiveness and superiority of our method across different benchmark detection frameworks.
4.3. Ablation Study
4.3.1. P-R Curve Comparison
Specifically, for a detailed comparison of categories on the AI-TOD-v2 dataset, we visualize the P-R curves of Faster R-CNN and Faster R-CNN w/BCDet across eight categories. As shown in Figure 4, the solid line represents that the maximum number of predicted boxes is 100 during the inference process of the detection network, and the dashed line represents that the maximum number of predicted boxes is 10. The cyan line represents Faster R-CNN, while the green line represents Faster R-CNN w/BCDet. It is noteworthy that the proposed BCDet achieves a significant improvement in precision across all recall rates, both for frequent categories (such as storage tanks, ships, and vehicles) and rare categories (such as bridges and windmills). Furthermore, as illustrated in the second and eighth figures of Figure 4, BCDet delivers substantial performance gains for bridges and windmills, i.e., their Precision–Recall (P-R) curves are notably improved.
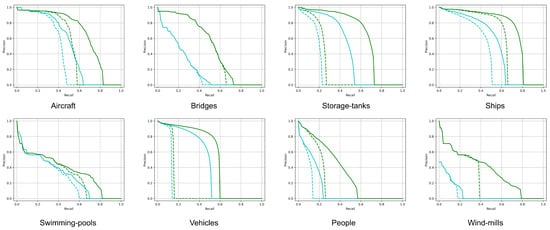
Figure 4.
Comparison of class-wise P-R curves on the AI-TOD-v2 dataset. The solid line represents that the maximum number of predicted boxes is 100 during the inference process of the detection network, and the dashed line represents that the maximum number of predicted boxes is 10. The cyan line represents Faster R-CNN, while the green line represents Faster R-CNN w/BCDet.
4.3.2. Individual Component Effectiveness
As shown in Table 3, to validate the effectiveness of each component in the proposed algorithm, we progressively apply NGLA and MSHA to the Faster R-CNN detector [11] on the AI-TOD-v2 dataset [2]. It can be observed that introducing the NGLA module increases from 13.3% to 21.3%, while rises substantially by 23.2%. In addition, adding MSHA alone also effectively improves from 13.3% to 18.3%. Finally, with NGLA already integrated, further incorporating the MSHA module into the network architecture elevates to 22.3%, with consistent gains observed across all evaluation metrics. This demonstrates the complementary nature of the proposed modules.
Table 3.
Accuracy (%) comparisons of different designs. Baseline indicates the vanilla Faster R-CNN.
4.3.3. Confusion Matrix Comparison
On the VisDrone2019 dataset, we compare the confusion matrices of vanilla Faster R-CNN and Faster R-CNN equipped with BCDet to more clearly demonstrate the improvements brought by the proposed BCDet across various categories. As shown in Figure 5, in the confusion matrix, the rows denote the ground-truth labels, the columns represent the predicted categories, while the last row and the last column indicate the false-positive rate and the false-negative rate for each class, respectively. The values along the diagonal represent the accuracy per category. It can be observed that on the VisDrone2019 dataset, lower accuracy and recall rates imply more false positives and missed detections in the predictions. The introduction of BCDet improves the prediction accuracy for most categories. For instance, in the vehicle category, compared to the baseline of 67%, BCDet brings a 13% increase, achieving 80%. Furthermore, regarding the false-negative metric, as shown in the last column of Figure 5, in the car and pedestrian categories, which constitute a large proportion of the dataset, BCDet reduces the false-negative rate by 15% and 32%, respectively, compared to the baseline (i.e., from 27% to 12% and from 64% to 32%). In the awning-tricycle and tricycle categories, which have a very small proportion of the dataset, BCDet also performs exceptionally well (i.e., from 67% to 43% and from 59% to 39%).
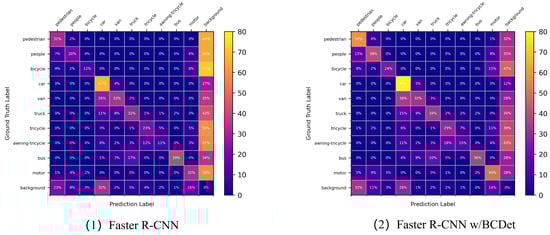
Figure 5.
Comparison of confusion matrices.
4.3.4. Comparison of Different Measurement Methods
In Table 4, we compare with other metrics on the Faster R-CNN benchmark detector, including IoU and its derivatives, CIoU [62], DIoU [62], GIoU [63], and WD [8], based on a 2D Gaussian distribution. It can be seen that the proposed shows significant advantages in different accuracy metrics. Specifically, compared with IoU, while maintaining the consistency of positive and negative sample label strategies, the introduction of improves the detector’s accuracy by 0.6%, 3.5%, and 6.0% on , , and , respectively. In addition, achieves 54.7% on . This shows that can identify objects more effectively than other metrics at lower IoU thresholds.
Table 4.
Accuracy (%) comparisons of different metrics. All metrics are employed on the proposed DCLA. Bold fonts indicate the best performance.
4.3.5. Ablation Comparison Between Different Backbones
To verify the robustness of the proposed BCDet under different backbone networks, we introduce the following three larger backbone networks in addition to ResNet50: ResNet-101 [51], ResNeXt-101-32x4d [64], and HRNet-w32 [65]. We replaced ResNet50 with each network for ablation experiments. The experimental results are shown in Table 5, where FR is an abbreviation for Faster R-CNN. Under the same backbone network, we compared the benchmark detector Faster R-CNN based on IoU, NWD-RKA based on WD, and the proposed BCDet. In the experiments with the three different backbone networks, BCDet achieved 21.7% , 23.4% , and 23.9% for the three larger backbone networks, ResNet-101, ResNeXt-101-32x4d, and HRNet-w32, respectively. At the same time, compared with the benchmark detector, BCDet improved by 8.6%, 9.4%, and 9.4% on the three backbone networks, respectively. Compared to NWD-RKA, which uses WD as the metric, BCDet improved by 0.9% and 1.8% on the ResNet-101 backbone, 0.9% and 1.4% on the ResNeXt-101-32x4d backbone, and 1.3% and 2.6% on the HRNet-w32 backbone. Table 5 also lists the accuracy metrics and related to tiny objects. In the accuracy comparison at specific scales, BCDet maintained strong competitiveness, and achieved the best 9.1% on the HRNet-w32 backbone. This further demonstrates the robustness of the proposed BCDet for tiny object detection.
Table 5.
Experimental performance (%) on larger backbones. FR denotes Faster R-CNN. † denotes a re-implementation of the results with the same experiment setting. Bold fonts indicate the best performance.
4.3.6. Comparison of Different Quality Score Combination Strategies
To explore the impact of different combinations of classification and localization scores on the object detector, we present the performance of various accuracy metrics under different combination strategies in Table 6. As shown in Table 6, the four strategies include only using IoU, × IoUα, × , and × . We first combine the classification score and IoU as the final candidate box score. Although IoU is suboptimal for tiny objects, its characteristics make it the best for medium-sized objects. In contrast, the quality score proposed in this paper improves the detection performance of objects at different scales, especially tiny objects. Furthermore, by replacing the predefined threshold strategy with a normalized Gaussian label allocation strategy, objects of different scales can obtain the same level of sample supervision. This strategy alleviates the problem of insufficient training samples for tiny objects, enabling the model to provide more reasonable supervision for instances of different sizes.
Table 6.
Performance comparison of different metric methods. Bold fonts indicate the best performance.
4.3.7. Comparison of Different Values
As shown in Table 7, we tested the effect of the balance factor in × IoUα on the quality score. We observed that when = 5, reached the highest value of 8.2%. Meanwhile, , , , and reached their highest values of 22.3%, 21.7%, 28.0%, and 35.5%, respectively. It is noteworthy that when we reduced the weight of the regression score, the high-precision index reached 14.1% at = 4, and the accuracy for medium-scale objects reached its best value of 35.7% at = 3. However, the accuracy indices and for tiny objects are not as good as those at = 5. Therefore, in the relevant experiments of this paper, = 5 was adopted unless otherwise specified. Furthermore, to verify the specific performance of the proposed hyperparameter over a wider range, we additionally tested the performance of = 1 and = 10, as shown in Table 7. In extreme hyperparameter settings, BCDet still maintained a stable performance (i.e., 21.8% and 21.9%). This performance further demonstrates that in , for different hyperparameter values, the detection model exhibits significant stability during hyperparameter tuning, with minimal fluctuations in its accuracy index. This indicates that the model’s performance is weakly dependent on parameter configuration and possesses excellent parameter robustness.
Table 7.
Performance comparison with different values. Bold fonts indicate the best performance.
4.3.8. Computational Cost and Parameter Comparison
Table 8 shows a detailed comparison of FCOS and Faster R-CNN in terms of Params (M), Flops (G), and Frames Per Second (FPS). To further verify the computational overhead of each module, we set up parameter experiments with only the NGLA module and with both NGLA and MSHA modules. It can be observed that introducing only NGLA achieves performance improvement without introducing additional parameters. Furthermore, compared to the two different baseline detectors (i.e., FCOS and Faster R-CNN), the introduction of the MSHA module increases the number of parameters by 1.6 M and 1.8 M, respectively. The computational cost is increased by 1.69 GFLOPs and 1.88 GFLOPs, respectively. Correspondingly, the model accuracy is also improved to 19.3% and 22.3%, respectively.
Table 8.
Comparison of baseline and our proposed method in terms of parameters and computational cost. Bold fonts indicate the best performance.
4.4. Visualization
To more intuitively demonstrate the detection capability of our proposed method for tiny objects, we visualized the detection results of BCDet based on Faster R-CNN and BCDet based on FCOS on the AI-TOD-v2 and VisDrone datasets, as shown in Figure 6. It can be observed that our method achieves excellent detection results in different scenes, day and night, and at different density levels, which indirectly illustrates the great potential of the proposed BCDet in building detectors suitable for real-world scenarios. Furthermore, as shown in Figure 7, using the same images on the VisDrone2019 dataset, we visualized the detection results for both the Faster R-CNN benchmark detector and the detector improved by introducing BCDet. Figure 7a–d represent the detection performance of the benchmark detector, while Figure 7e–h represent the detection performance after introducing BCDet. In Figure 7, red boxes represent GTs, green boxes represent model predictions, yellow dashed boxes represent the baseline detection in certain regions, and orange dashed boxes represent the detection visualization after introducing BCDet at the same location. We grouped the visualizations of different detectors for the same region into the same image together for comparison. Figure 7 shows that BCDet can effectively improve the detection rate of tiny objects in scenes with densely distributed tiny objects (e.g., Figure 7d vs. Figure 7h). Moreover, compared to the benchmark detector, BCDet can better adapt to switching between different scenes (e.g., Figure 7b vs. Figure 7f).
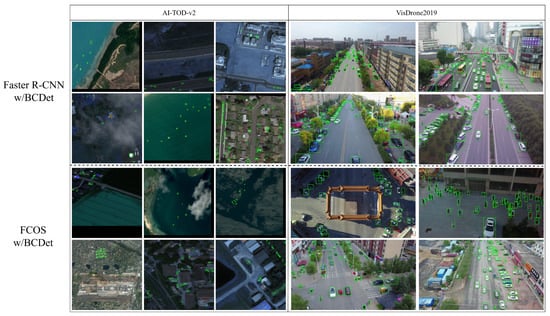
Figure 6.
Qualitative Comparison of detection results by Faster R-CNN w/BCDet and FCOS w/BCDet on the AI-TOD-v2 and VisDrone2019 datasets. “w/” denotes “with”. Green boxes represent the predictions.
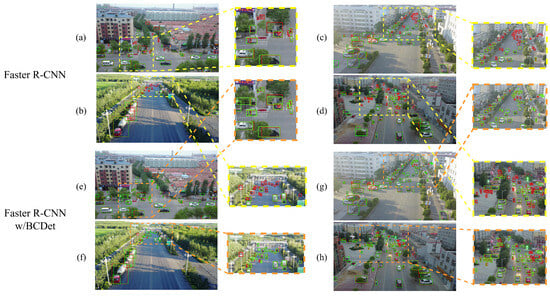
Figure 7.
Qualitative comparison of detection results between the baseline Faster R-CNN and Faster R-CNN w/BCDet on the VisDrone2019 dataset. “w/” denotes “with”. Red boxes represent the GTs and green boxes represent the predictions.
5. Discussion
5.1. Analysis of Effectiveness
Overall, extensive experiments and analyses demonstrate the effectiveness of our proposed method. For instance, on the AI-TOD-v2 dataset, when integrated with mainstream benchmark detectors, our method yields notable improvements in detection accuracy across complex scenarios, regardless of whether the target category is instance-rich (e.g., aircraft) or instance-sparse (e.g., swimming pools). Specifically, the proposed NGLA can further enrich the quality of positive samples for tiny objects without introducing computational costs, thereby improving the model’s detection performance for tiny objects. Meanwhile, the proposed MSHA enhances the model’s ability to extract discriminative features for tiny objects. Furthermore, the plug-and-play nature of NGLA and MSHA allows for seamless integration into both anchor-based and anchor-free benchmark detectors without architectural modifications, making our method applicable to real-world scenarios.
5.2. Limitations
We acknowledge that there are several limitations to the current work that are worth discussing. Firstly, the integration of the MSHA module, while yielding performance gains, inevitably introduces extra computational overhead. This, in turn, leads to an increase in model parameter count and a reduction in inference speed, which also poses limitations on edge devices with limited resources, thereby restricting the application of the model in mobile and embedded deployment scenarios. Secondly, although the design of a diagonal covariance matrix in 2D Gaussian modeling can balance computational efficiency and optimization stability, a non-diagonal covariance matrix can construct a tighter probability distribution, providing more accurate positioning and shape description. This also imposes limitations on the metric when dealing with anisotropic tiny objects with significant directionality or slender shapes.
6. Conclusions
We propose a tiny object detection method based on Normalized Gaussian Label Assignment and Multi-scale Hybrid Attention. This method incorporates a Normalized Gaussian Label Assignment strategy and a Multi-scale Hybrid Attention module to address the limitations of existing metric methods and label assignment strategies in tiny object detection tasks, and enhances the model’s ability to extract discriminative features from tiny objects. Comparative experiments, ablation experiments, and visualization experiments on the AI-TOD-v2 and VisDrone2019 datasets demonstrate that the proposed method achieves excellent performance in tiny object detection. However, while improving performance, the introduction of the Multi-scale Hybrid Attention module inevitably increases computational overhead, which further limits the model’s deployment on edge devices. Therefore, future research will focus on lightweight model design to facilitate its practical application on mobile and edge devices.
Author Contributions
Conceptualization, S.L.; methodology, S.L.; software, S.L. and L.Z.; validation, S.L. and L.Z.; formal analysis, S.L. and S.C.; investigation, S.L. and L.Z.; resources, S.C.; data curation, S.L.; writing—original draft preparation, S.L.; writing—review and editing, L.Z. and S.C.; visualization, S.L.; supervision, D.-H.W.; project administration, S.C. and D.-H.W.; funding acquisition, S.C. All authors have read and agreed to the published version of the manuscript.
Funding
This work was supported in part by the National Natural Science Foundation of China (No. 62571466), Natural Science Foundation of Xiamen (No. 3502Z202573073), Unveiling and Leading Projects of Xiamen (No. 3502Z20241011), and Major Science and Technology Plan Project on the Future Industry Fields of Xiamen City (No. 3502Z20241027).
Data Availability Statement
AI-TOD-v2 dataset is available at https://chasel-tsui.github.io/AI-TOD-v2 (accessed on 12 March 2025) and VisDrone2019 dataset is available at https://github.com/VisDrone/VisDrone-Dataset (accessed on 18 March 2025).
Acknowledgments
The authors would like to thank their colleagues and reviewers for their constructive comments and suggestions, which helped improve this work. The authors declare no use of generative AI in this work.
Conflicts of Interest
The authors declare no conflicts of interest.
Abbreviations
The following abbreviations are used in this manuscript:
| CNN | Convolutional Neural Network |
| NGLA | Normalized Gaussian Label Assignment |
| NBCD | Normalized Bhattacharyya Distance |
| BCD | Bhattacharyya Distance |
| DCN | Deformable Convolution Cetwork |
| RPN | Region Proposal Network |
| FPN | Feature Pyramid Network |
| IoU | Intersection over Union |
References
- Wang, J.; Yang, W.; Guo, H.; Zhang, R.; Xia, G.S. Tiny object detection in aerial images. In Proceedings of the 2020 25th International Conference on Pattern Recognition (ICPR), Milan, Italy, 10–15 January 2021; IEEE: New York, NY, USA, 2021; pp. 3791–3798. [Google Scholar]
- Xu, C.; Wang, J.; Yang, W.; Yu, H.; Yu, L.; Xia, G.-S. Detecting tiny objects in aerial images: A normalized Wasserstein distance and a new benchmark. ISPRS J. Photogramm. Remote Sens. 2022, 190, 79–93. [Google Scholar] [CrossRef]
- Kisantal, M.; Wojna, Z.; Murawski, J.; Naruniec, J.; Cho, K. Augmentation for small object detection. In Proceedings of the 9th International Conference on Advances in Computing and Information Technology, Sydney, Australia, 21–22 December 2019; pp. 119–133. [Google Scholar] [CrossRef]
- Ma, F.; Sun, X.; Zhang, F.; Zhou, Y.; Li, H.C. What Catch Your Attention in SAR Images: Saliency Detection Based on Soft-Superpixel Lacunarity Cue. IEEE Trans. Geosci. Remote Sens. 2023, 61, 5200817. [Google Scholar] [CrossRef]
- Liu, H.; Zhou, X.; Wang, C.; Chen, S.; Kong, H. Fourier-Deformable Convolution Network for Road Segmentation From Remote Sensing Images. IEEE Trans. Geosci. Remote Sens. 2024, 62, 4415117. [Google Scholar] [CrossRef]
- Li, X.; Xu, F.; Zhang, J.; Zhang, H.; Lyu, X.; Liu, F.; Gao, H.; Kaup, A. Frequency-Guided Denoising Network for Semantic Segmentation of Remote Sensing Images. IEEE Trans. Geosci. Remote Sens. 2026, 64, 5400217. [Google Scholar] [CrossRef]
- Bhattacharyya, A. On a measure of divergence between two statistical populations defined by their probability distribution. Bull. Calcutta Math. Soc. 1943, 35, 99–110. [Google Scholar]
- Peyré, G.; Cuturi, M.; Hoedel, J.M. Computational optimal transport: With applications to data science. Found. Trends Mach. Learn. 2019, 11, 355–607. [Google Scholar]
- Kullback, S.; Leibler, R.A. On information and sufficiency. Ann. Math. Stat. 1951, 22, 79–86. [Google Scholar] [CrossRef]
- Tian, Z.; Shen, C.; Chen, H.; He, T. FCOS: Fully Convolutional One-Stage Object Detection. In Proceedings of the IEEE/CVF International Conference on Computer Vision (ICCV), Seoul, Republic of Korea, 27 October–2 November 2019; pp. 9626–9635. [Google Scholar]
- Ren, S.; He, K.; Girshick, R.; Sun, J. Faster R-CNN: Towards Real-Time Object Detection with Region Proposal Networks. IEEE Trans. Pattern Anal. Mach. Intell. 2017, 39, 1137–1149. [Google Scholar] [CrossRef]
- Qiao, S.; Chen, L.C.; Yuille, A. Detectors: Detecting objects with recursive feature pyramid and switchable atrous convolution. In Proceedings of the IEEE/CVF Conference on Computer Vision and Pattern Recognition (CVPR), Nashville, TN, USA, 20–25 June 2021; pp. 10213–10224. [Google Scholar]
- Chen, S.; Huang, H.; Zhu, S.; Xu, H.; He, Y.; Wang, D.H. SiamCCF: Siamese visual tracking via cross-layer calibration fusion. IET Comput. Vis. 2023, 17, 869–882. [Google Scholar] [CrossRef]
- Chen, S.; Lai, X.; Yan, Y.; Wang, D.H.; Zhu, S. Learning an attention-aware parallel sharing network for facial attribute recognition. J. Vis. Commun. Image Represent. 2023, 90, 103745. [Google Scholar] [CrossRef]
- Du, Y.; Yan, Y.; Chen, S.; Hua, Y. Object-adaptive LSTM network for real-time visual tracking with adversarial data augmentation. Neurocomputing 2020, 384, 67–83. [Google Scholar] [CrossRef]
- Huang, Y.; Yan, Y.; Chen, S.; Wang, H. Expression-targeted feature learning for effective facial expression recognition. J. Vis. Commun. Image Represent. 2018, 55, 677–687. [Google Scholar] [CrossRef]
- Chen, S.; Xu, B.; Zhang, M.; Yan, Y.; Du, X.; Zhuang, W.; Wu, Y. HC-GCN: Hierarchical contrastive graph convolutional network for unsupervised domain adaptation on person re-identification. Multimed. Syst. 2023, 29, 2779–2790. [Google Scholar] [CrossRef]
- Tsai, M.D.; Tseng, K.W.; Lai, C.C.; Wei, C.T.; Cheng, K.F. Exploring Airborne LiDAR and Aerial Photographs Using Machine Learning for Land Cover Classification. Remote Sens. 2023, 15, 2280. [Google Scholar] [CrossRef]
- Wei, C.T.; Tsai, M.D.; Chang, Y.L.; Wang, M.C.J. Enhancing the Accuracy of Land Cover Classification by Airborne LiDAR Data and WorldView-2 Satellite Imagery. ISPRS Int. J. Geo-Inf. 2022, 11, 391. [Google Scholar] [CrossRef]
- Cai, Z.; Vasconcelos, N. Cascade r-cnn: Delving into high quality object detection. In Proceedings of the 2018 IEEE/CVF Conference on Computer Vision and Pattern Recognition, Salt Lake City, UT, USA, 18–23 June 2018; pp. 6154–6162. [Google Scholar]
- Lin, T.Y.; Goyal, P.; Girshick, R.; He, K.; Dollár, P. Focal Loss for Dense Object Detection. IEEE Trans. Pattern Anal. Mach. Intell. 2020, 42, 318–327. [Google Scholar] [CrossRef]
- Liu, W.; Anguelov, D.; Erhan, D.; Szegedy, C.; Reed, S.; Fu, C.Y.; Berg, A.C. Ssd: Single shot multibox detector. In Computer Vision—ECCV 2016; Springer: Cham, Switzerland, 2016; pp. 21–37. [Google Scholar]
- Liu, J.; Yu, J.; Zhang, C.; Cui, H.; Zhao, J.; Zheng, W.; Xu, F.; Wei, X. Optimization of a multi-environmental detection model for tomato growth point buds based on multi-strategy improved YOLOv8. Sci. Rep. 2025, 15, 25726. [Google Scholar] [CrossRef]
- Tian, Y.; Ye, Q.; Doermann, D. YOLOv12: Attention-Centric Real-Time Object Detectors. arXiv 2025, arXiv:2502.12524. [Google Scholar]
- Yi, J.; Han, W.; Lai, F. YOLOv8n-DDSW: An efficient fish target detection network for dense underwater scenes. PeerJ Comput. Sci. 2025, 11, e2798. [Google Scholar] [CrossRef]
- Zheng, Y.; Zheng, W.; Du, X. Paddy-YOLO: An accurate method for rice pest detection. Comput. Electron. Agric. 2025, 238, 110777. [Google Scholar] [CrossRef]
- Law, H.; Deng, J. Cornernet: Detecting objects as paired keypoints. In Proceedings of the European Conference Computer Vision—ECCV, Munich, Germany, 8–14 September 2018; pp. 734–750. [Google Scholar]
- Zhou, X.; Wang, D.; Krähenbühl, P. Objects as Points. arXiv 2019, arXiv:1904.07850. [Google Scholar] [PubMed]
- Carion, N.; Massa, F.; Synnaeve, G.; Usunier, N.; Kirillov, A.; Zagoruyko, S. End-to-end object detection with transformers. In Computer Vision—ECCV 2020; Springer: Cham, Switzerland, 2020; pp. 213–229. [Google Scholar]
- Sun, P.; Zhang, R.; Jiang, Y.; Kong, T.; Xu, C.; Zhan, W.; Tomizuka, M.; Li, L.; Yuan, Z.; Wang, C.; et al. Sparse r-cnn: End-to-end object detection with learnable proposals. In Proceedings of the IEEE/CVF Conference on Computer Vision and Pattern Recognition (CVPR), Nashville, TN, USA, 20–25 June 2021; pp. 14454–14463. [Google Scholar]
- Zhao, Y.; Lv, W.; Xu, S.; Wei, J.; Wang, G.; Dang, Q.; Liu, Y.; Chen, J. Detrs beat yolos on real-time object detection. In Proceedings of the IEEE/CVF Conference on Computer Vision and Pattern Recognition (CVPR), Seattle, WA, USA, 16–22 June 2024; pp. 16965–16974. [Google Scholar]
- Shen, F.; Cui, J.; Li, W.; Zhou, S. TinyDef-DETR: A Transformer-Based Framework for Defect Detection in Transmission Lines from UAV Imagery. Remote Sens. 2025, 17, 3789. [Google Scholar] [CrossRef]
- Chen, X.; Yin, H. DCC-DETR: A real-time lightweight gesture recognition network for home human–robot interaction. J. Real-Time Image Process. 2025, 22, 184. [Google Scholar] [CrossRef]
- Lin, T.Y.; Dollár, P.; Girshick, R.; He, K.; Hariharan, B.; Belongie, S. Feature pyramid networks for object detection. In Proceedings of the IEEE Conference on Computer Vision and Pattern Recognition (CVPR), Honolulu, HI, USA, 21–26 July 2017; pp. 2117–2125. [Google Scholar]
- Liu, S.; Qi, L.; Qin, H.; Shi, J.; Jia, J. Path aggregation network for instance segmentation. In Proceedings of the IEEE/CVF Conference on Computer Vision and Pattern Recognition (CVPR), Salt Lake City, UT, USA, 18–23 June 2018; pp. 8759–8768. [Google Scholar]
- Tan, M.; Pang, R.; Le, Q.V. Efficientdet: Scalable and efficient object detection. In Proceedings of the IEEE/CVF Conference on Computer Vision and Pattern Recognition (CVPR), Seattle, WA, USA, 13–19 June 2020; pp. 10781–10790. [Google Scholar]
- Shunzhi, Z.; Lizhao, L.; Si, C. Image feature detection algorithm based on the spread of Hessian source. Multimed. Syst. 2017, 23, 105–117. [Google Scholar] [CrossRef]
- Chen, S.; Qiu, L.; Tian, Z.; Yan, Y.; Wang, D.H.; Zhu, S. MTNet: Mutual tri-training network for unsupervised domain adaptation on person re-identification. J. Vis. Commun. Image Represent. 2023, 90, 103749. [Google Scholar] [CrossRef]
- Zhang, Z.; Li, J.; Li, J.; Xu, J. SAMKD: Spatial-aware Adaptive Masking Knowledge Distillation for Object Detection. arXiv 2025, arXiv:2501.07101. [Google Scholar]
- Liu, Z.; Zhang, Y.; He, J.; Zhang, T.; Rehman, S.u.; Saraee, M.; Sun, C. Enhancing Infrared Small Target Detection: A Saliency-Guided Multi-Task Learning Approach. IEEE Trans. Intell. Transp. Syst. 2025, 26, 3603–3618. [Google Scholar] [CrossRef]
- Chen, S.; Wang, L.; Wang, Z.; Yan, Y.; Wang, D.H.; Zhu, S. Learning meta-adversarial features via multi-stage adaptation network for robust visual object tracking. Neurocomputing 2022, 491, 365–381. [Google Scholar] [CrossRef]
- Zheng, X.; Qiu, Y.; Zhang, G.; Lei, T.; Jiang, P. ESL-YOLO: Small Object Detection with Effective Feature Enhancement and Spatial-Context-Guided Fusion Network for Remote Sensing. Remote Sens. 2024, 16, 4374. [Google Scholar] [CrossRef]
- Wen, Z.; Li, P.; Liu, Y.; Chen, J.; Xiang, X.; Li, Y.; Wang, H.; Zhao, Y.; Zhou, G. FANet: Frequency-Aware Attention-Based Tiny-Object Detection in Remote Sensing Images. Remote Sens. 2025, 17, 4066. [Google Scholar] [CrossRef]
- Zhang, S.; Chi, C.; Yao, Y.; Lei, Z.; Li, S.Z. Bridging the gap between anchor-based and anchor-free detection via adaptive training sample selection. In Proceedings of the IEEE/CVF Conference on Computer Vision and Pattern Recognition (CVPR), Seattle, WA, USA, 13–19 June 2020; pp. 9759–9768. [Google Scholar]
- Xu, C.; Wang, J.; Yang, W.; Yu, H.; Yu, L.; Xia, G.S. RFLA: Gaussian receptive field based label assignment for tiny object detection. In Computer Vision—ECCV 2022; Springer: Cham, Switzerland, 2022; pp. 526–543. [Google Scholar]
- Zhou, Z.; Zhu, Y. KLDet: Detecting Tiny Objects in Remote Sensing Images via Kullback–Leibler Divergence. IEEE Trans. Geosci. Remote Sens. 2024, 62, 4703316. [Google Scholar] [CrossRef]
- Fu, R.; Chen, C.; Yan, S.; Heidari, A.A.; Wang, X.; Escorcia-Gutierrez, J.; Mansour, R.F.; Chen, H. Gaussian similarity-based adaptive dynamic label assignment for tiny object detection. Neurocomputing 2023, 543, 126285. [Google Scholar] [CrossRef]
- Xu, C.; Ding, J.; Wang, J.; Yang, W.; Yu, H.; Yu, L.; Xia, G.S. Dynamic coarse-to-fine learning for oriented tiny object detection. In Proceedings of the IEEE/CVF Conference on Computer Vision and Pattern Recognition (CVPR), Vancouver, BC, Canada, 17–24 June 2023; pp. 7318–7328. [Google Scholar]
- Chen, K.; Wang, J.; Pang, J.; Cao, Y.; Xiong, Y.; Li, X.; Sun, S.; Feng, W.; Liu, Z.; Xu, J.; et al. MMDetection: Open MMLab Detection Toolbox and Benchmark. arXiv 2019, arXiv:1906.07155. [Google Scholar] [CrossRef]
- Paszke, A.; Gross, S.; Massa, F.; Lerer, A.; Bradbury, J.; Chanan, G.; Killeen, T.; Lin, Z.; Gimelshein, N.; Antiga, L.; et al. Pytorch: An imperative style, high-performance deep learning library. In Proceedings of the Advances in Neural Information Processing Systems (NeurIPS), Vancouver, BC, Canada, 8–14 December 2019; Volume 32. [Google Scholar]
- He, K.; Zhang, X.; Ren, S.; Sun, J. Deep residual learning for image recognition. In Proceedings of the IEEE/CVF Conference on Computer Vision and Pattern Recognition (CVPR), Las Vegas, NV, USA, 27–30 June 2016; pp. 770–778. [Google Scholar]
- Du, D.; Zhu, P.; Wen, L.; Bian, X.; Lin, H.; Hu, Q.; Peng, T.; Zheng, J.; Wang, X.; Zhang, Y.; et al. VisDrone-DET2019: The vision meets drone object detection in image challenge results. In Proceedings of the 2019 IEEE/CVF International Conference on Computer Vision Workshop (ICCVW), Seoul, Republic of Korea, 27–28 October 2019; pp. 213–226. [Google Scholar]
- Cao, B.; Yao, H.; Zhu, P.; Hu, Q. Visible and Clear: Finding Tiny Objects in Difference Map. In Computer Vision—ECCV 2024; Springer: Cham, Switzerland, 2024. [Google Scholar]
- Bian, J.; Mingtao, F.; Weisheng, D.; Fangfang, W.; Jianqiao, L.; Yaonan, W.; Guangming, S. Feature Information Driven Position Gaussian Distribution Estimation for Tiny Object Detection. In Proceedings of the IEEE/CVF Conference on Computer Vision and Pattern Recognition (CVPR), Nashville, TN, USA, 11–15 June 2025. [Google Scholar]
- Du, B.; Huang, Y.; Chen, J.; Huang, D. Adaptive Sparse Convolutional Networks with Global Context Enhancement for Faster Object Detection on Drone Images. In Proceedings of the IEEE/CVF Conference on Computer Vision and Pattern Recognition (CVPR), Vancouver, BC, Canada, 17–24 June 2023. [Google Scholar]
- Cai, X.; Lai, Q.; Wang, Y.; Wang, W.; Sun, Z.; Yao, Y. Poly Kernel Inception Network for Remote Sensing Detection. In Proceedings of the IEEE/CVF Conference on Computer Vision and Pattern Recognition (CVPR), Seattle, WA, USA, 16–22 June 2024. [Google Scholar]
- Hou, X.; Liu, M.; Zhang, S.; Wei, P.; Chen, B. Salience DETR: Enhancing Detection Transformer with Hierarchical Salience Filtering Refinement. In Proceedings of the 2024 IEEE/CVF Conference on Computer Vision and Pattern Recognition (CVPR), Seattle, WA, USA, 16–22 June 2024; pp. 17574–17583. [Google Scholar] [CrossRef]
- Lu, X.; Li, B.; Yue, Y.; Li, Q.; Yan, J. Grid r-cnn. In Proceedings of the 2019 IEEE/CVF International Conference on Computer Vision Workshop (ICCVW), Seoul, Republic of Korea, 27–28 October 2019; pp. 7363–7372. [Google Scholar]
- Zhu, B.; Wang, J.; Jiang, Z.; Zong, F.; Liu, S.; Li, Z.; Sun, J. AutoAssign: Differentiable Label Assignment for Dense Object Detection. arXiv 2020, arXiv:2007.03496. [Google Scholar] [CrossRef]
- Feng, C.; Zhong, Y.; Gao, Y.; Scott, M.R.; Huang, W. Tood: Task-aligned one-stage object detection. In Proceedings of the 2021 IEEE/CVF International Conference on Computer Vision (ICCV), Montreal, QC, Canada, 10–17 October 2021; IEEE Computer Society: New York, NY, USA, 2021; pp. 3490–3499. [Google Scholar]
- Liu, C.; Gao, G.; Huang, Z.; Hu, Z.; Liu, Q.; Wang, Y. YOLC: You Only Look Clusters for Tiny Object Detection in Aerial Images. IEEE Trans. Intell. Transp. Syst. 2024, 25, 13863–13875. [Google Scholar] [CrossRef]
- Zheng, Z.; Wang, P.; Liu, W.; Li, J.; Ye, R.; Ren, D. Distance-IoU loss: Faster and better learning for bounding box regression. In Proceedings of the AAAI Conference on Artificial Intelligence, New York, NY, USA, 7–12 February 2020; Volume 34, pp. 12993–13000. [Google Scholar]
- Rezatofighi, H.; Tsoi, N.; Gwak, J.; Sadeghian, A.; Reid, I.; Savarese, S. Generalized intersection over union: A metric and a loss for bounding box regression. In Proceedings of the IEEE/CVF Conference on Computer Vision and Pattern Recognition (CVPR), Long Beach, CA, USA, 15–20 June 2019; pp. 658–666. [Google Scholar]
- Xie, S.; Girshick, R.; Dollár, P.; Tu, Z.; He, K. Aggregated Residual Transformations for Deep Neural Networks. In Proceedings of the 2017 IEEE Conference on Computer Vision and Pattern Recognition (CVPR), Honolulu, HI, USA, 21–26 July 2017; pp. 5987–5995. [Google Scholar] [CrossRef]
- Sun, K.; Xiao, B.; Liu, D.; Wang, J. Deep High-Resolution Representation Learning for Human Pose Estimation. In Proceedings of the 2019 IEEE/CVF Conference on Computer Vision and Pattern Recognition (CVPR), Long Beach, CA, USA, 15–20 June 2019; pp. 5686–5696. [Google Scholar] [CrossRef]


Disclaimer/Publisher’s Note: The statements, opinions and data contained in all publications are solely those of the individual author(s) and contributor(s) and not of MDPI and/or the editor(s). MDPI and/or the editor(s) disclaim responsibility for any injury to people or property resulting from any ideas, methods, instructions or products referred to in the content. |
© 2026 by the authors. Licensee MDPI, Basel, Switzerland. This article is an open access article distributed under the terms and conditions of the Creative Commons Attribution (CC BY) license.