Technical Note

Airborne SAR Imaging Algorithm for Ocean Waves Oriented to Sea Spike Suppression

1
National Key Laboratory of Microwave Imaging, Aerospace Information Research Institute, Chinese Academy of Sciences, Beijing 100190, China
2
Key Laboratory of Ocean Observation Technology, Ministry of Natural Resources, Tianjin 300112, China
3
School of Electronic, Electrical and Communication Engineering, University of Chinese Academy of Sciences, Beijing 100049, China
*
Author to whom correspondence should be addressed.
Remote Sens. 2026, 18(3), 397; https://doi.org/10.3390/rs18030397
Submission received: 28 December 2025 / Revised: 18 January 2026 / Accepted: 22 January 2026 / Published: 24 January 2026
(This article belongs to the Special Issue Microwave Remote Sensing on Ocean Observation)

Highlights

What are the main findings?
  • An airborne SAR imaging algorithm for ocean waves oriented to sea spike suppression is proposed, designed to suppress sea spikes from the signal domain.
  • Validated with airborne SAR data, including SAR data with completely invisible waves and other data with weakly visible waves under sea spike influence, the proposed algorithm can significantly suppress sea spikes and improve the texture features of ocean waves in SAR images.
What are the implications of the main findings?
  • The proposed algorithm addresses the issue of sea spike interference in SAR images.
  • The proposed algorithm can provide data with clear wave texture for the retrieval of SAR wave parameters.

Abstract

Synthetic aperture radar (SAR) is widely used in the field of ocean remote sensing. However, SAR images are usually affected by sea spikes, which appear as strong echo and azimuth defocus characteristics. The texture features of ocean waves in SAR images are submerged by sea spikes, making them weak or even invisible. This seriously affects the further applications of SAR technology in ocean remote sensing. To address this issue, an airborne SAR imaging algorithm for ocean waves oriented to sea spike suppression is proposed in this paper. The non-stationary characteristics of sea spikes are taken into account in the proposed algorithm. The SAR echo data is transformed into the time–frequency domain by short-time Fourier transform (STFT). And the echo signals of sea spikes are suppressed in the time–frequency domain. Then, the ocean waves are imaged in focus by applying focus settings. In order to verify the effectiveness of the proposed algorithm, airborne SAR data was processed using the proposed algorithm, including SAR data with completely invisible waves and other data with weakly visible waves under sea spike influence. Through analyzing the ocean wave spectrum and imaging quality, it is confirmed that the proposed algorithm can significantly suppress sea spikes and improve the texture features of ocean waves in SAR images.

1. Introduction

Synthetic aperture radar (SAR) has become an important technical means in the field of ocean remote sensing due to its all-weather observation capability, high resolution, and wide swath coverage [1,2]. It is worth noting that with the rapid development of high-resolution SAR systems [3], the recognition ability of ocean surface details has been significantly improved, but sea spikes are also prone to appear. Sea spikes manifest as sporadic movement or stationary “targets” randomly distributed at different distances and angles [4]. Their physical mechanism is related to waves breaking. In cases of high resolution, high incident angle, and HH polarization, sea spikes are more likely to appear [5]. Different from noise signals, sea spikes have a strong echo characteristic. They exhibit a noticeable defocusing or trailing phenomenon in the azimuth of SAR images due to their motion [6]. The texture features of ocean waves in SAR images are submerged by sea spikes, making them weak or even invisible. As a result, sea spikes not only compromise image quality but also impair the reliability of wave parameter retrieval, which ultimately limits the broader application of SAR in ocean remote sensing.
To address the issue of sea spike interference, a series of suppression methods have been proposed, which can be divided into three major categories. The three types are the time-domain suppression method [7,8,9], the frequency-domain filtering method [10,11], and the method based on feature matrix decomposition [12,13]. However, most of the sea spike suppression methods focus on intelligent pixel processing X-band (IPIX) datasets, and the methods for SAR datasets are still relatively weak. At present, only a sea spike suppression method based on the optimum polarization ratio in airborne SAR images [14] has been publicly reported. Although the method can effectively suppress sea spikes, it highly relies on VV and HH dual-polarized SAR data and cannot be applied to other SAR data modes, which has certain application limitations.
As a step forward, taking into account the impacts of sea spikes on SAR imaging, this paper proposes an airborne SAR imaging algorithm for ocean waves oriented to sea spike suppression in the signal domain. First, pulse compression in range is performed on the SAR raw data. Then, considering the non-stationary characteristics of sea spikes, the SAR echo data is transformed into the time–frequency domain by short–time Fourier transform (STFT). The echo signals of sea spikes are suppressed in the time–frequency domain. Subsequently, reconstructed SAR data after sea spike suppression is obtained by inverse short–time Fourier transform. Finally, the ocean waves are imaged in focus by applying the focus setting. In order to verify the effectiveness of the proposed algorithm, airborne SAR data is processed using the proposed algorithm, including SAR data with completely invisible waves and other data with weakly visible waves under sea spike influence. By analyzing the ocean wave spectrum and imaging quality, it is confirmed that the proposed algorithm can significantly improve the texture features of ocean waves in SAR images.
The rest of the paper is organized as follows. In Section 2, the airborne SAR imaging algorithm for ocean waves oriented to sea spike suppression is introduced in detail. In Section 3, SAR data with completely invisible waves and other data with weakly visible waves under sea spike influence are processed, and the results are given. Finally, conclusions are presented in Section 4.

2. Airborne SAR Imaging Algorithm for Ocean Waves Oriented to Sea Spike Suppression

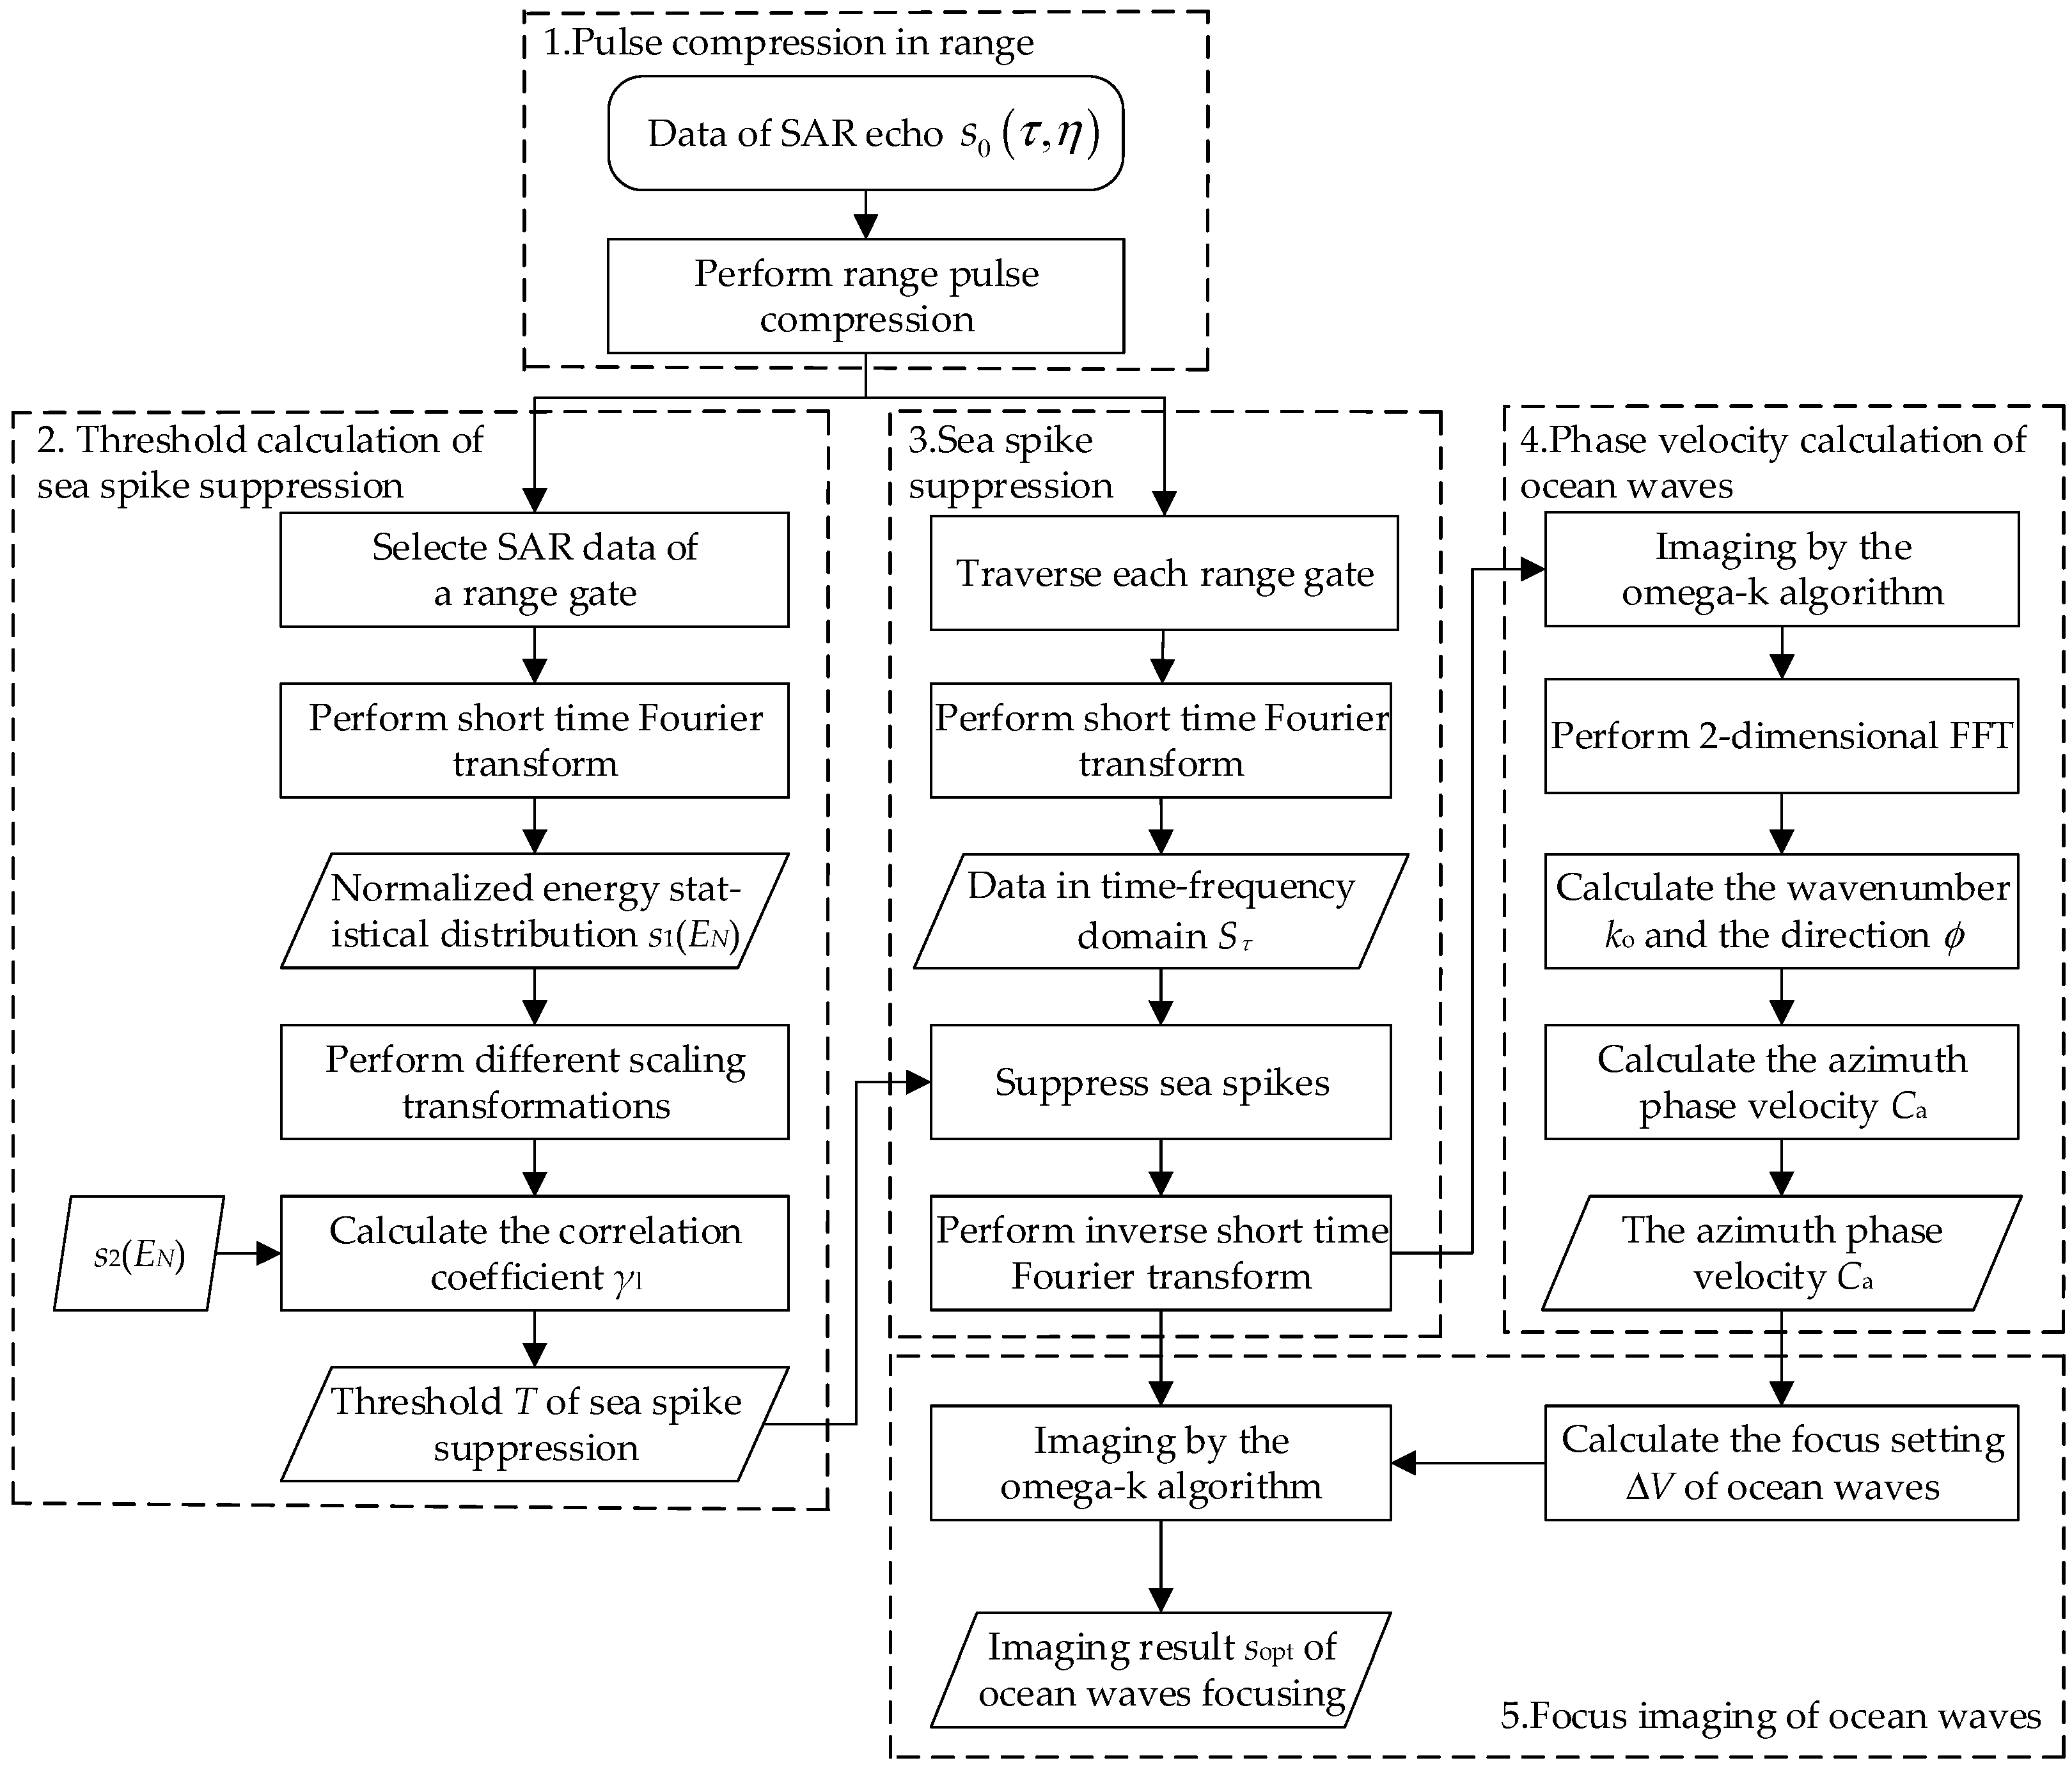
In this section, an airborne SAR imaging algorithm for ocean waves oriented to sea spike suppression is proposed. The flow chart of the proposed algorithm is shown in Figure 1. As can be seen, the proposed algorithm can be divided into five parts: pulse compression in range, threshold calculation of sea spike suppression, processing of sea spike suppression, phase velocity calculation of ocean waves, and focus imaging of ocean waves. The five parts are introduced below.

2.1. Pulse Compression in Range

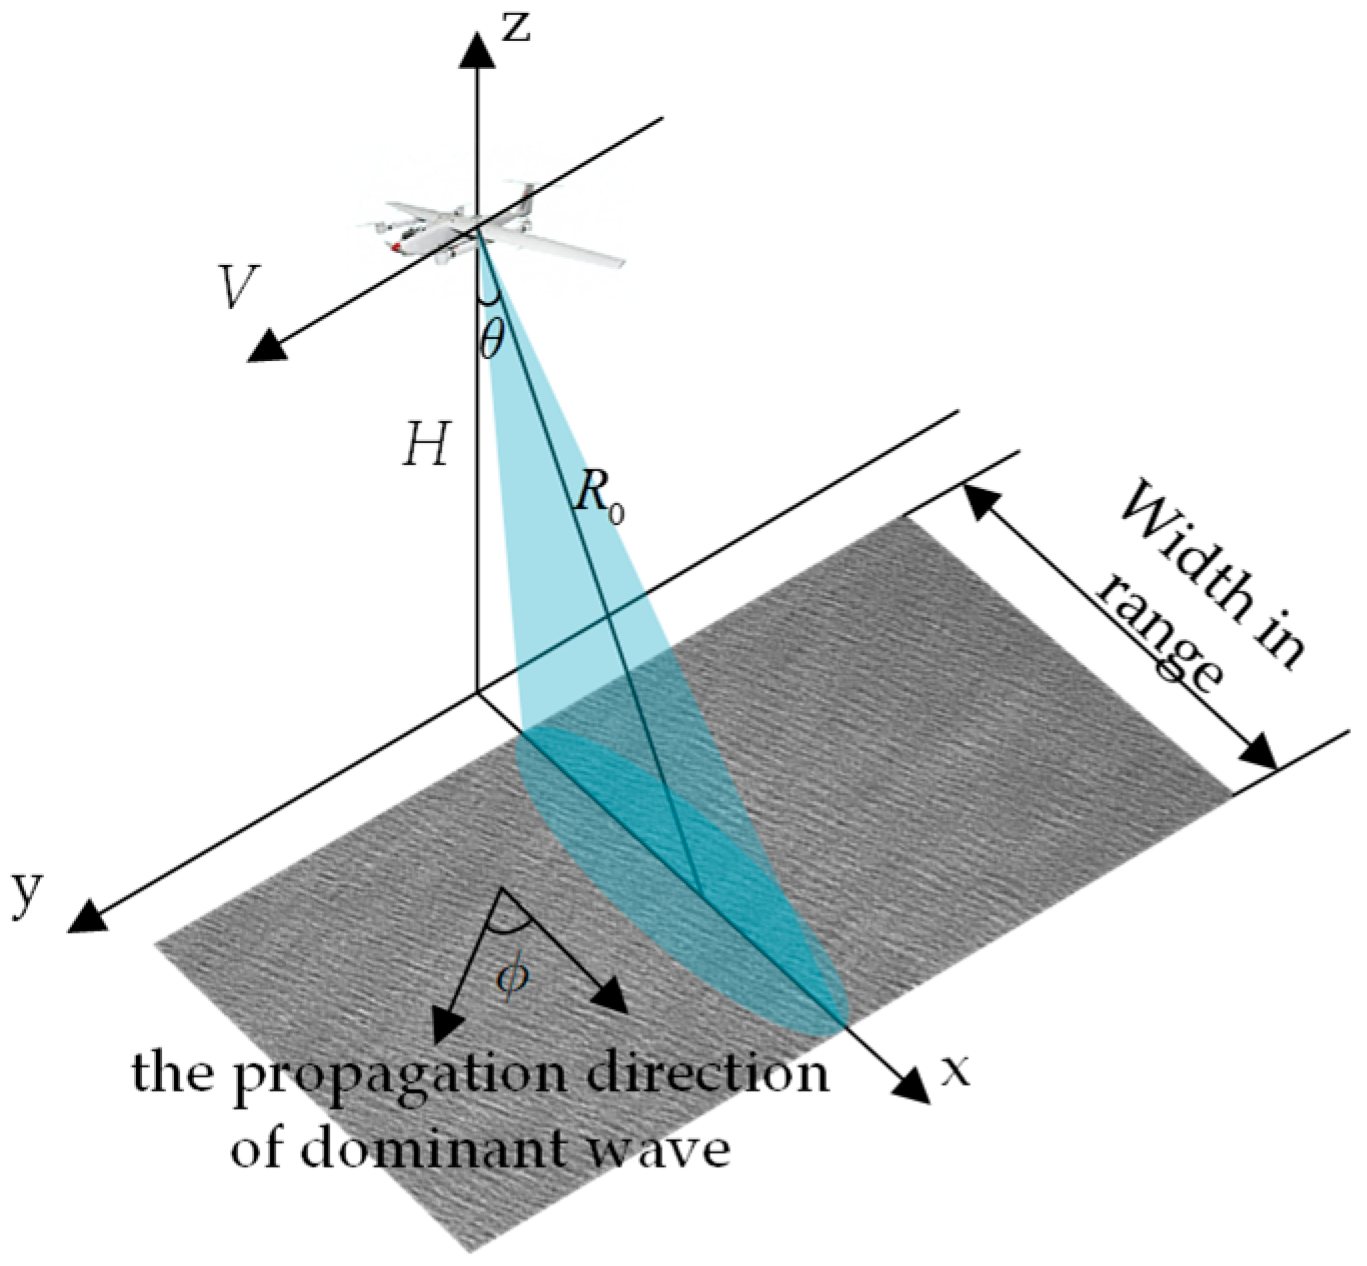
Schematic diagram of SAR observing ocean waves is shown in Figure 2. The corresponding SAR echo signal model is expressed as
s 0 τ , η = A 0 w r τ 2 R η c w a η η c × exp j 4 π f 0 R η c exp j π K r τ 2 R η c 2
where A 0 is a complex constant, τ and η are the fast time in range and the slow time in azimuth, respectively, R η is the slant range, c is the speed of light, η c is the deviation time of the beam center, w r and w a are the envelope in range and envelope in azimuth, respectively, f 0 is the radar center frequency, and K r is the modulation frequency in range. The data of range frequency–azimuth time domain data are obtained through fast Fourier transform (FFT) in range, which is expressed as
S 0 f τ , η = A 0 A 1 W r f τ w a η η c × exp j 4 π f 0 + f τ R η c exp j π f τ 2 K r
where A 1 is a constant, f τ is the range frequency, and W r f τ = w r f τ / K r is the envelope of the range spectrum.
Matched filtering is the theoretical basis of pulse compression, which is an optimal filter. SAR achieves high range resolution by transmitting and receiving wide-band pulse signals, and the signal-to-noise ratio of output echo is maximized by pulse compression.
Matched filtering in the frequency domain is used to perform range pulse compression on SAR data in the range frequency–azimuth time domain. The range pulse compression function is expressed as
H r f τ = exp j π f τ 2 K r
Finally, the echo of range compressed is transformed into the range time–azimuth time domain using inverse fast Fourier transform, which is
s rc τ , η = A 0 p r τ 2 R η c w a η η c exp j 4 π f 0 R η c
where the envelope of compressed pulse p r τ is the inverse Fourier transform of the range spectrum envelope W r f τ .

2.2. Threshold Calculation of Sea Spike Suppression

One of the range gates from the pulse compression result s rc τ , η is selected. Generally speaking, the data of the slant center position can be selected, which is denoted as x n . The data x n is transformed into the time–frequency domain by short-time Fourier transform.
S x m , k = n = 0 N 1 x n w n m D exp j 2 π k n / N
where w n is the window function, D is the time step between adjacent windows, m 0 , M 1 represents the time unit, and k 0 , N 1 represents the frequency unit. Then, the threshold is calculated using the corresponding time–frequency results S x .
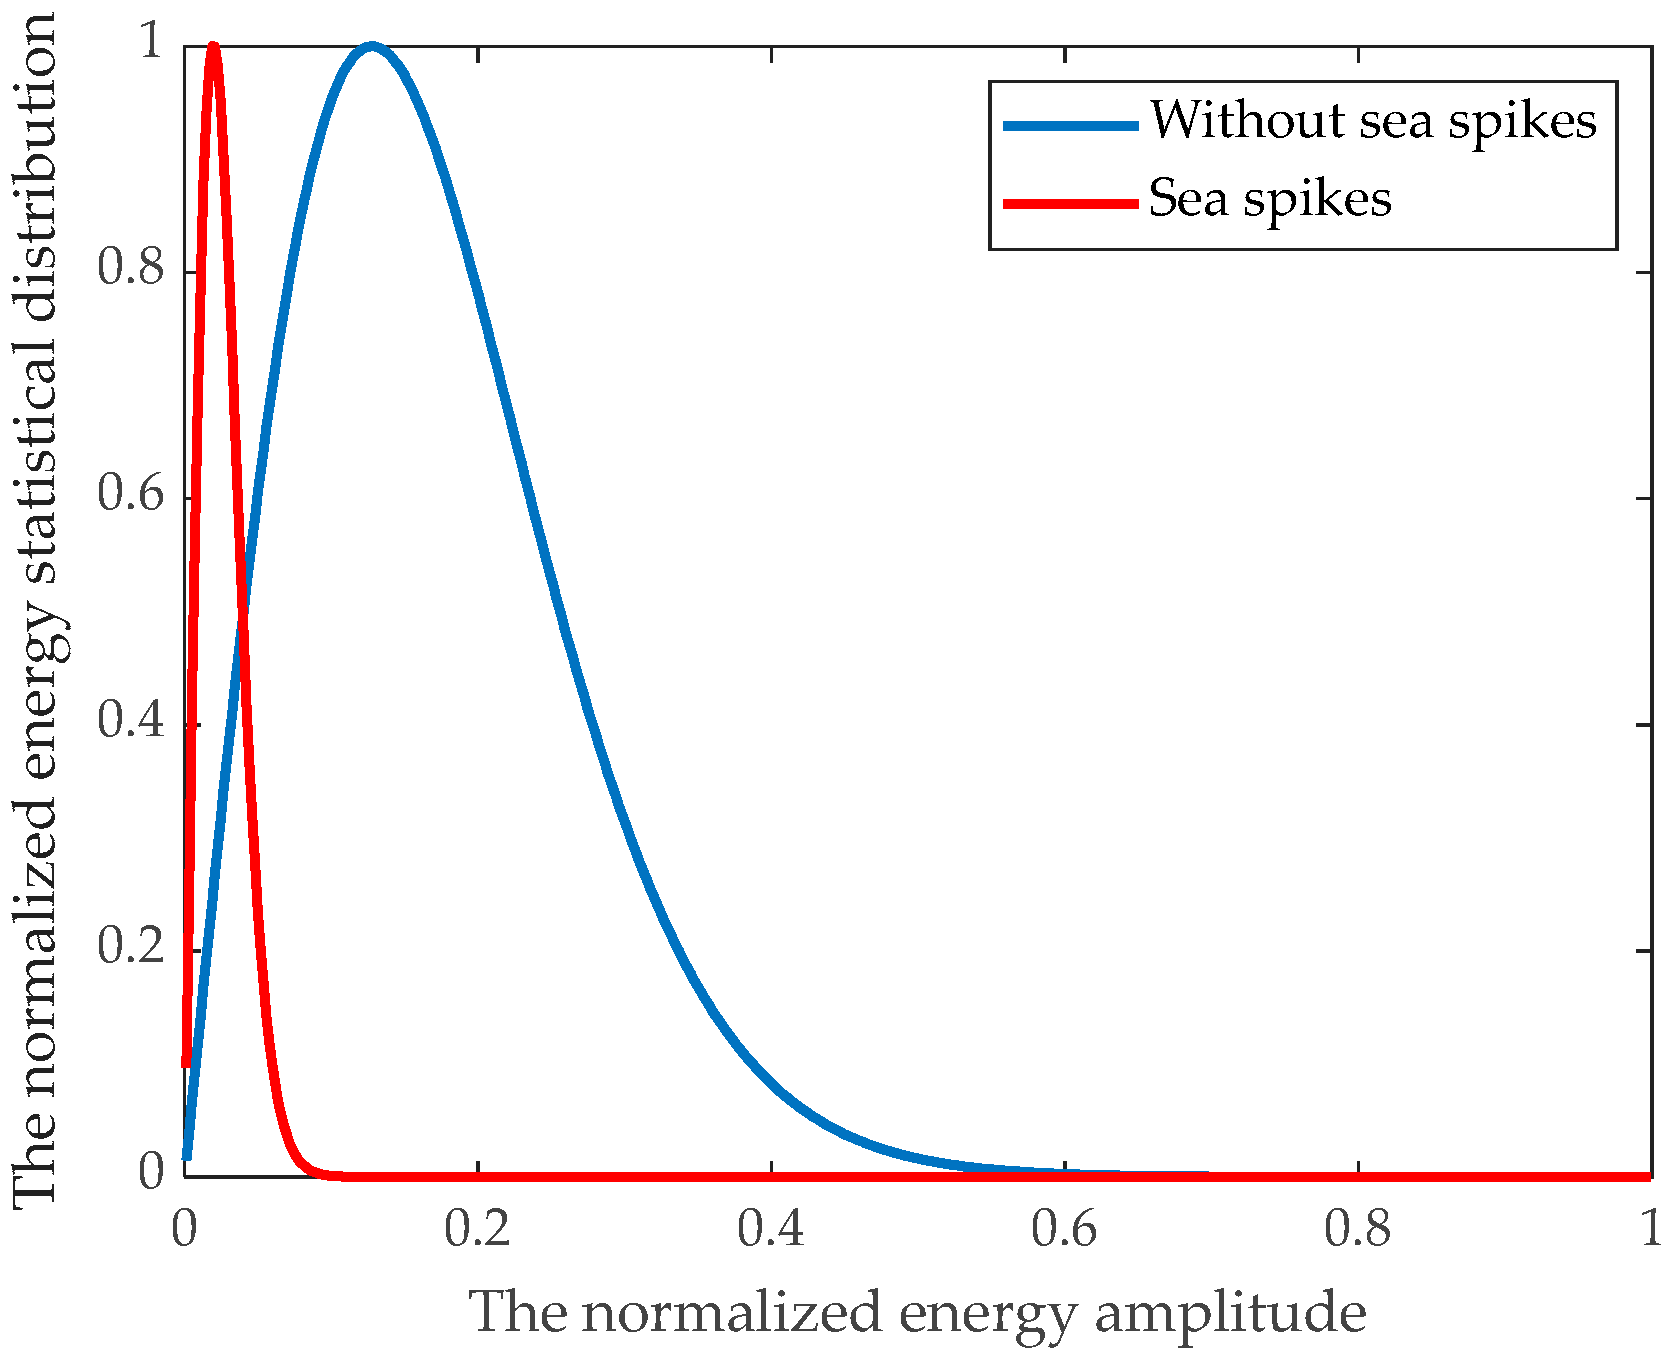
The normalized energy statistical distribution s 1 E N of S x is calculated, and the normalized short-time Fourier spectrum energy statistical distribution s 2 E N of SAR data obtained simultaneously without sea spikes is calculated, where E N is the normalized energy amplitude. The energy statistical distribution s 1 E N and s 2 E N are shown in Figure 3.
The energy statistical distribution of the short-time Fourier spectrum under sea spike interference is performed different scaling transformations. The energy statistical distribution s 1 L l × E N is obtained, where L l represents the multiple of the scaling transformation, L represents the total number of scaling transformations, l represents the l th scaling transformation, and L can be taken as 100, l 1 , 100 .
A portion of the data s 1 L l × E N is extracted by L l × E N 0 , 1 . A scaled short-time Fourier spectral energy distribution s l E N under sea spike interference is obtained by L l times bilinear interpolation, which is the same length as the energy statistical distribution s 2 E N .
The correlation between s l E N and s 2 E N is calculated by
γ l = C o v s 2 E N , s l E N V a r s 2 E N V a r s l E N
where γ l represents the correlation coefficient between s l E N and s 2 E N , C o v s 2 E N , s l E N is the covariance of s 2 E N and s l E N , V a r · is variance, s l E N is a scaled short-time Fourier spectral energy distribution under sea spike interference, and s 2 E N is the normalized short-time Fourier spectrum energy statistical distribution of SAR data without sea spikes.
The coherence coefficients are obtained using Equation (6), and the maximum value of γ l is calculated as follows:
γ max = max l γ l , l = 1 , 2 , , L
The corresponding l th scaling transformation is obtained based on the maximum coherence coefficient γ max . And the threshold T for suppressing sea spikes is estimated by combining the maximum spectrum energy E max under sea spike interference:
T = l L × E max

2.3. Processing of Sea Spike Suppression

The data of each range gate in the pulse compression result s rc τ , η are traversed, which is denoted as s τ n . The data s τ n of each range gate is processed through short-time Fourier transform using Equation (5), and the corresponding time–frequency results S τ of s τ n are obtained.
The values of time–frequency coordinate points with energy greater than T are suppressed, achieving sea spike suppression
S τ m , k = S τ m , k , 0 , S τ m , k T S τ m , k > T
The time–frequency domain data after sea spike suppression are processed using inverse short-time Fourier transform:
s τ n = m = 0 M 1 k = 0 K 1 S τ m , k w n m D exp j 2 π k n / N
Finally, the data s τ n after sea spike suppression at each range are combined. The data of each range are updated, and the reconstructed SAR data s s p τ , η without sea spikes are obtained.

2.4. Phase Velocity Calculation of Ocean Waves

Due to the influence of sea surface motion, SAR images of ocean waves often appear blurry and defocused. Therefore, it is necessary to consider the phase velocity of waves and integrate it into the imaging algorithm to improve image quality.
The reconstructed SAR data s sp τ , η after sea spike suppression are imaged by the omega-k algorithm [15], including reference function multiplication and Stolt interpolation. The SAR image s ac τ , η after sea spike suppression is obtained.
The SAR image s ac τ , η is transformed into the wavenumber domain by two-dimensional FFT. Then, the wavenumber vector k s = k rs   k as of the dominant wave is calculated from the wavenumber spectrum, where k rs and k as are the range wavenumber and the azimuth wavenumber of the dominant wave in the SAR image, respectively.
The range wavenumber k ro  of the dominant wave on the real ocean surface matches that k rs in the SAR image. In contrast, the azimuth wavenumber k ao of the dominant wave on the real ocean surface is typically different from that k as in the SAR image due to the influence of scanning distortion [16,17]. The relationship between k ao and k as is
k ao = k as + g k o V
where k o = k ao 2 + k ro 2 is the wavenumber of the dominant wave on the real ocean surface, V is the platform speed, and g is the acceleration of gravity. The wavenumber k o of the dominant wave on the real ocean surface can be calculated by solving Equation (11). Meanwhile, the propagation direction ϕ = tan 1 k ro / k ao of the dominant wave is calculated.
Furthermore, the azimuth phase velocity C a can be calculated as [18]
C a = g / k o / cos ϕ

2.5. Focus Imaging of Ocean Waves

The dynamic characteristics of ocean waves require the use of a matching focus setting in SAR imaging. The focus setting is defined as the difference between the speed of the azimuth matched filter and the SAR platform speed.
Numerous simulations and experimental studies have demonstrated that the optimum imaging for ocean waves can be achieved when the focus setting is equivalent to half of its azimuthal phase speed [19,20,21,22,23,24,25]. Therefore, the focus setting Δ V is set as half of the ocean wave azimuthal phase velocity for subsequent processing, namely Δ V = C a / 2 . The reconstructed SAR data s s p τ , η after sea spike suppression are imaged for the focus setting Δ V by the omega-k algorithm. Finally, the imaging result s o p t τ , η is obtained.

3. Validation of the Proposed Algorithm with Field Data

In this section, the proposed algorithm is applied to airborne SAR data to verify its effectiveness, including SAR data with completely invisible waves and data with weakly visible waves under sea spike influence.

3.1. Case 1: Completely Invisible Waves Under Sea Spike Influence (HH Polarization)

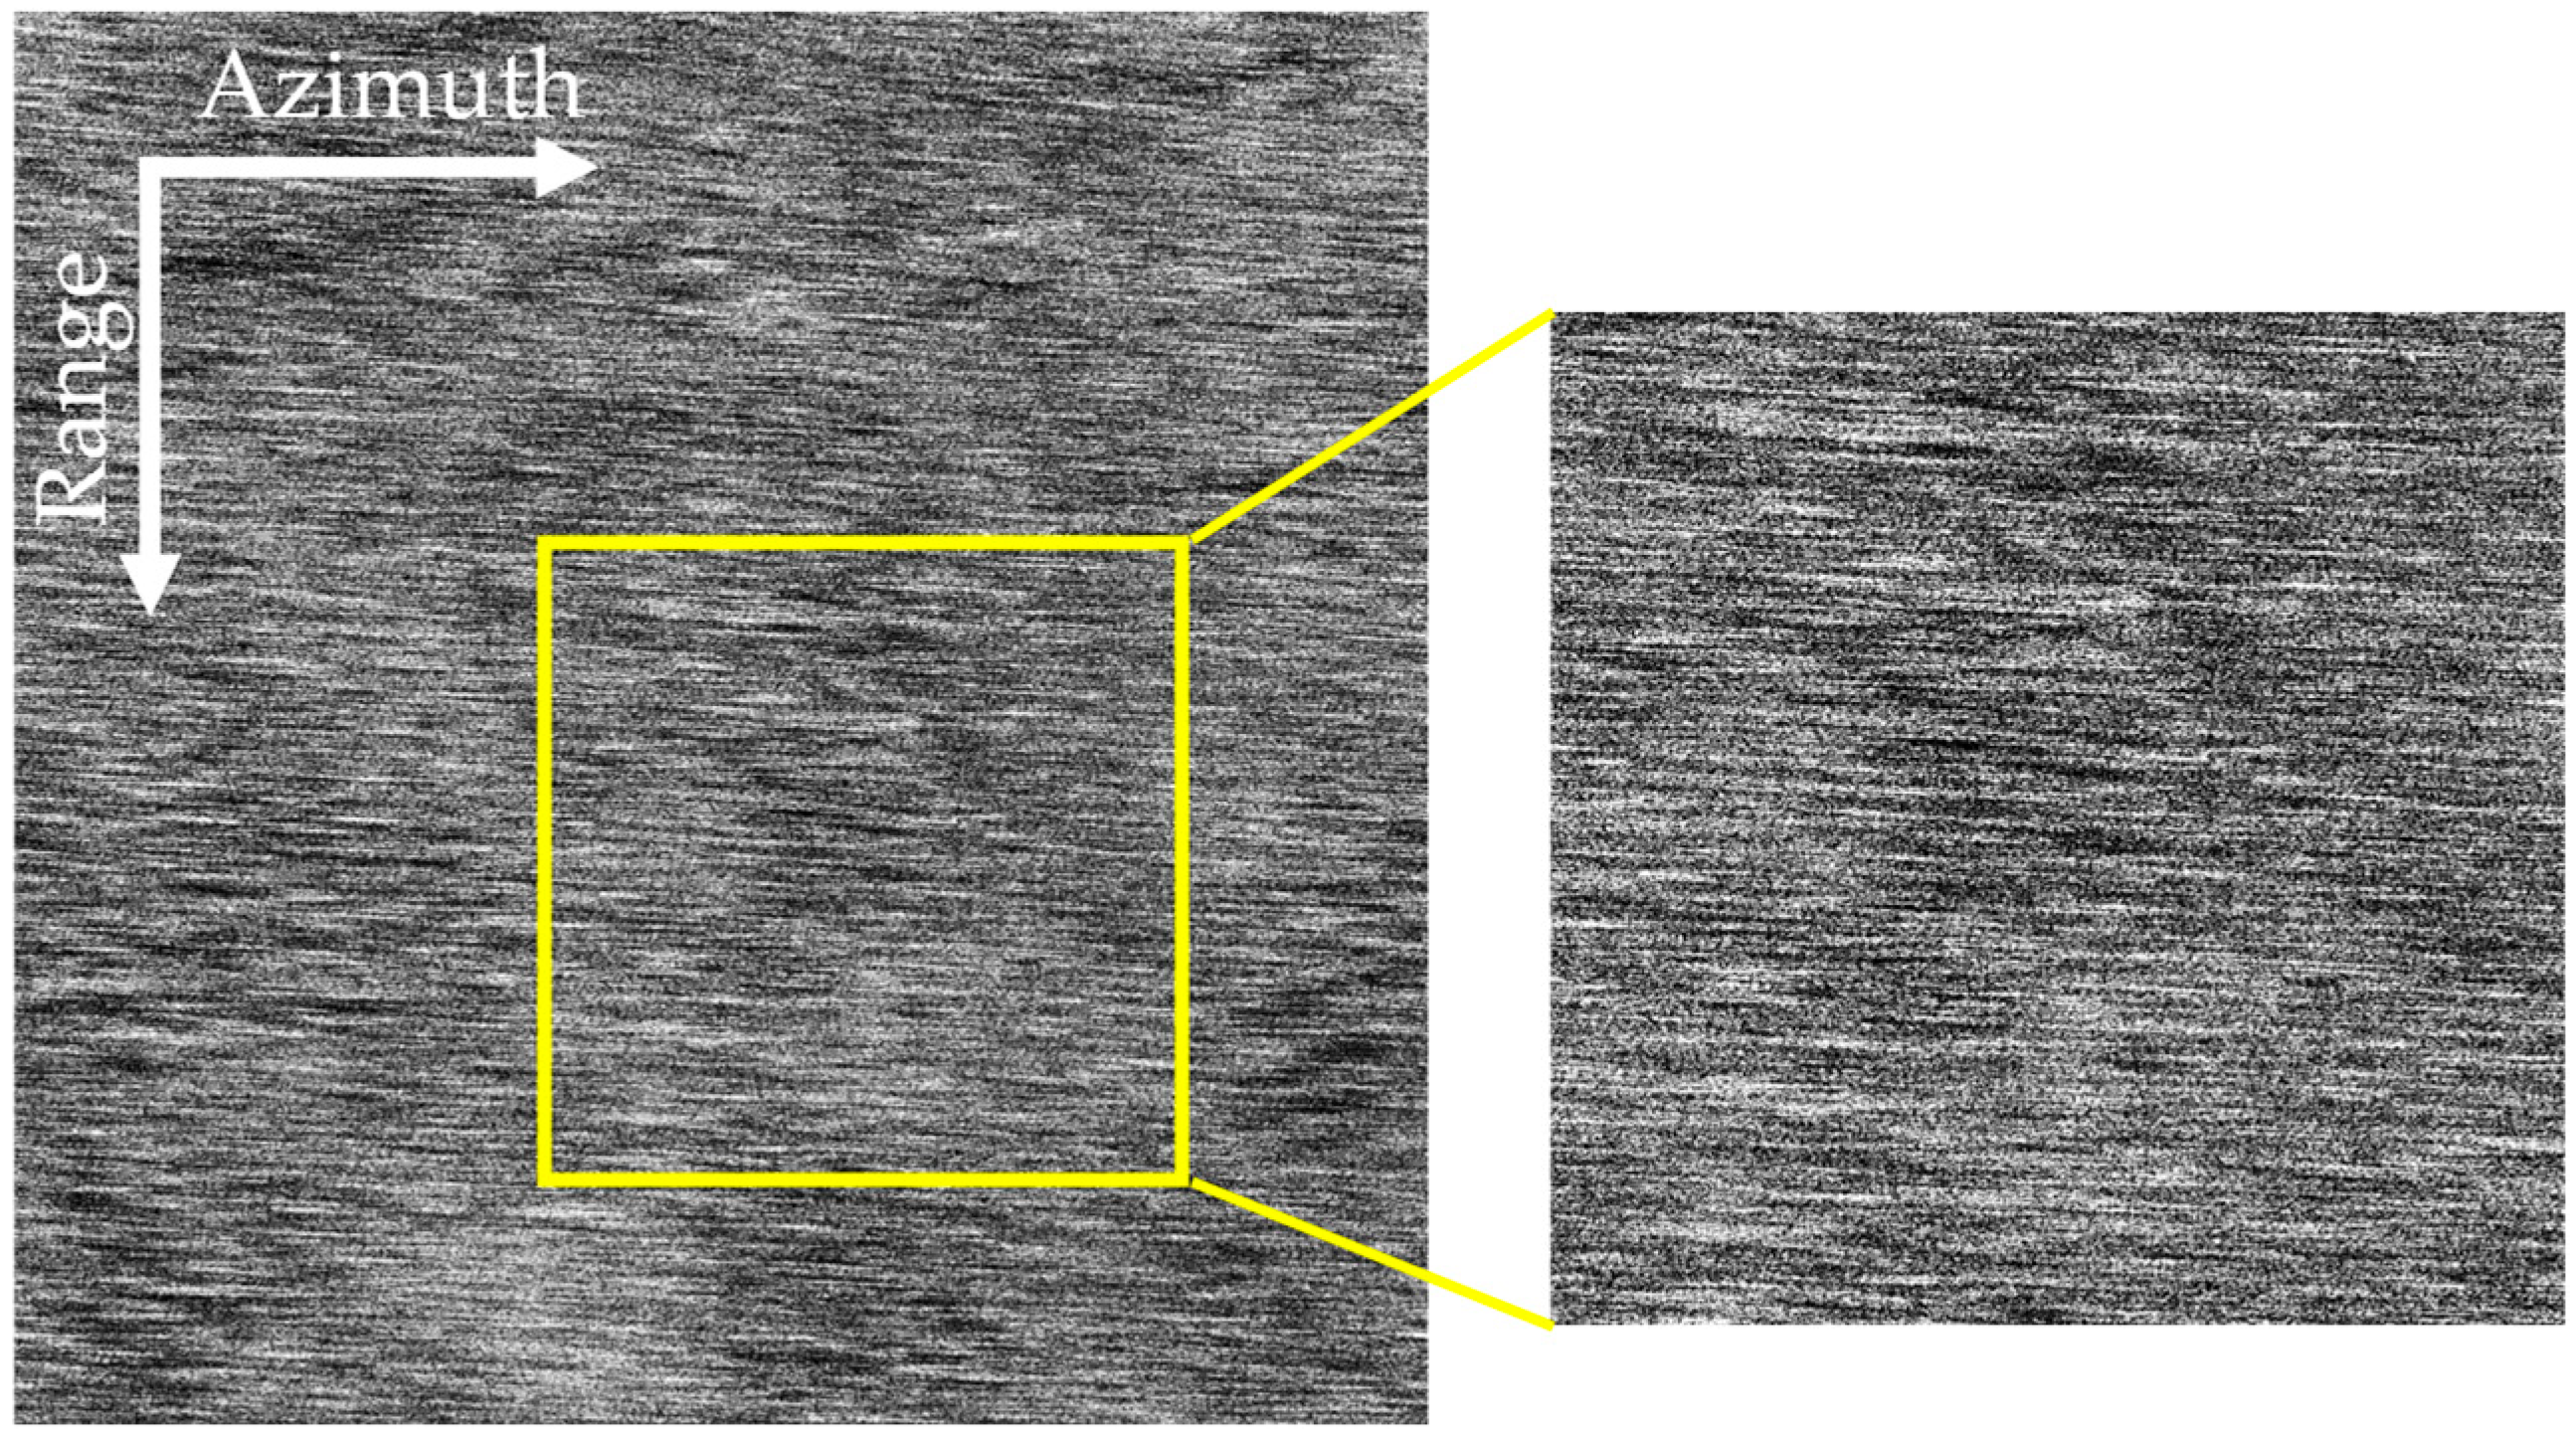
Experimental data in which waves are completely invisible due to sea spike interference were obtained from the sea trial experiment conducted by the Aerospace Information Research Institute, Chinese Academy of Sciences covering the South China Sea in 2019. The parameters of the SAR system are shown in Table 1. The SAR image obtained by the omega-k imaging algorithm [15] is given in Figure 4. It can be seen that the SAR image is severely affected by sea spikes, and the wave texture information is completely submerged in Figure 4.
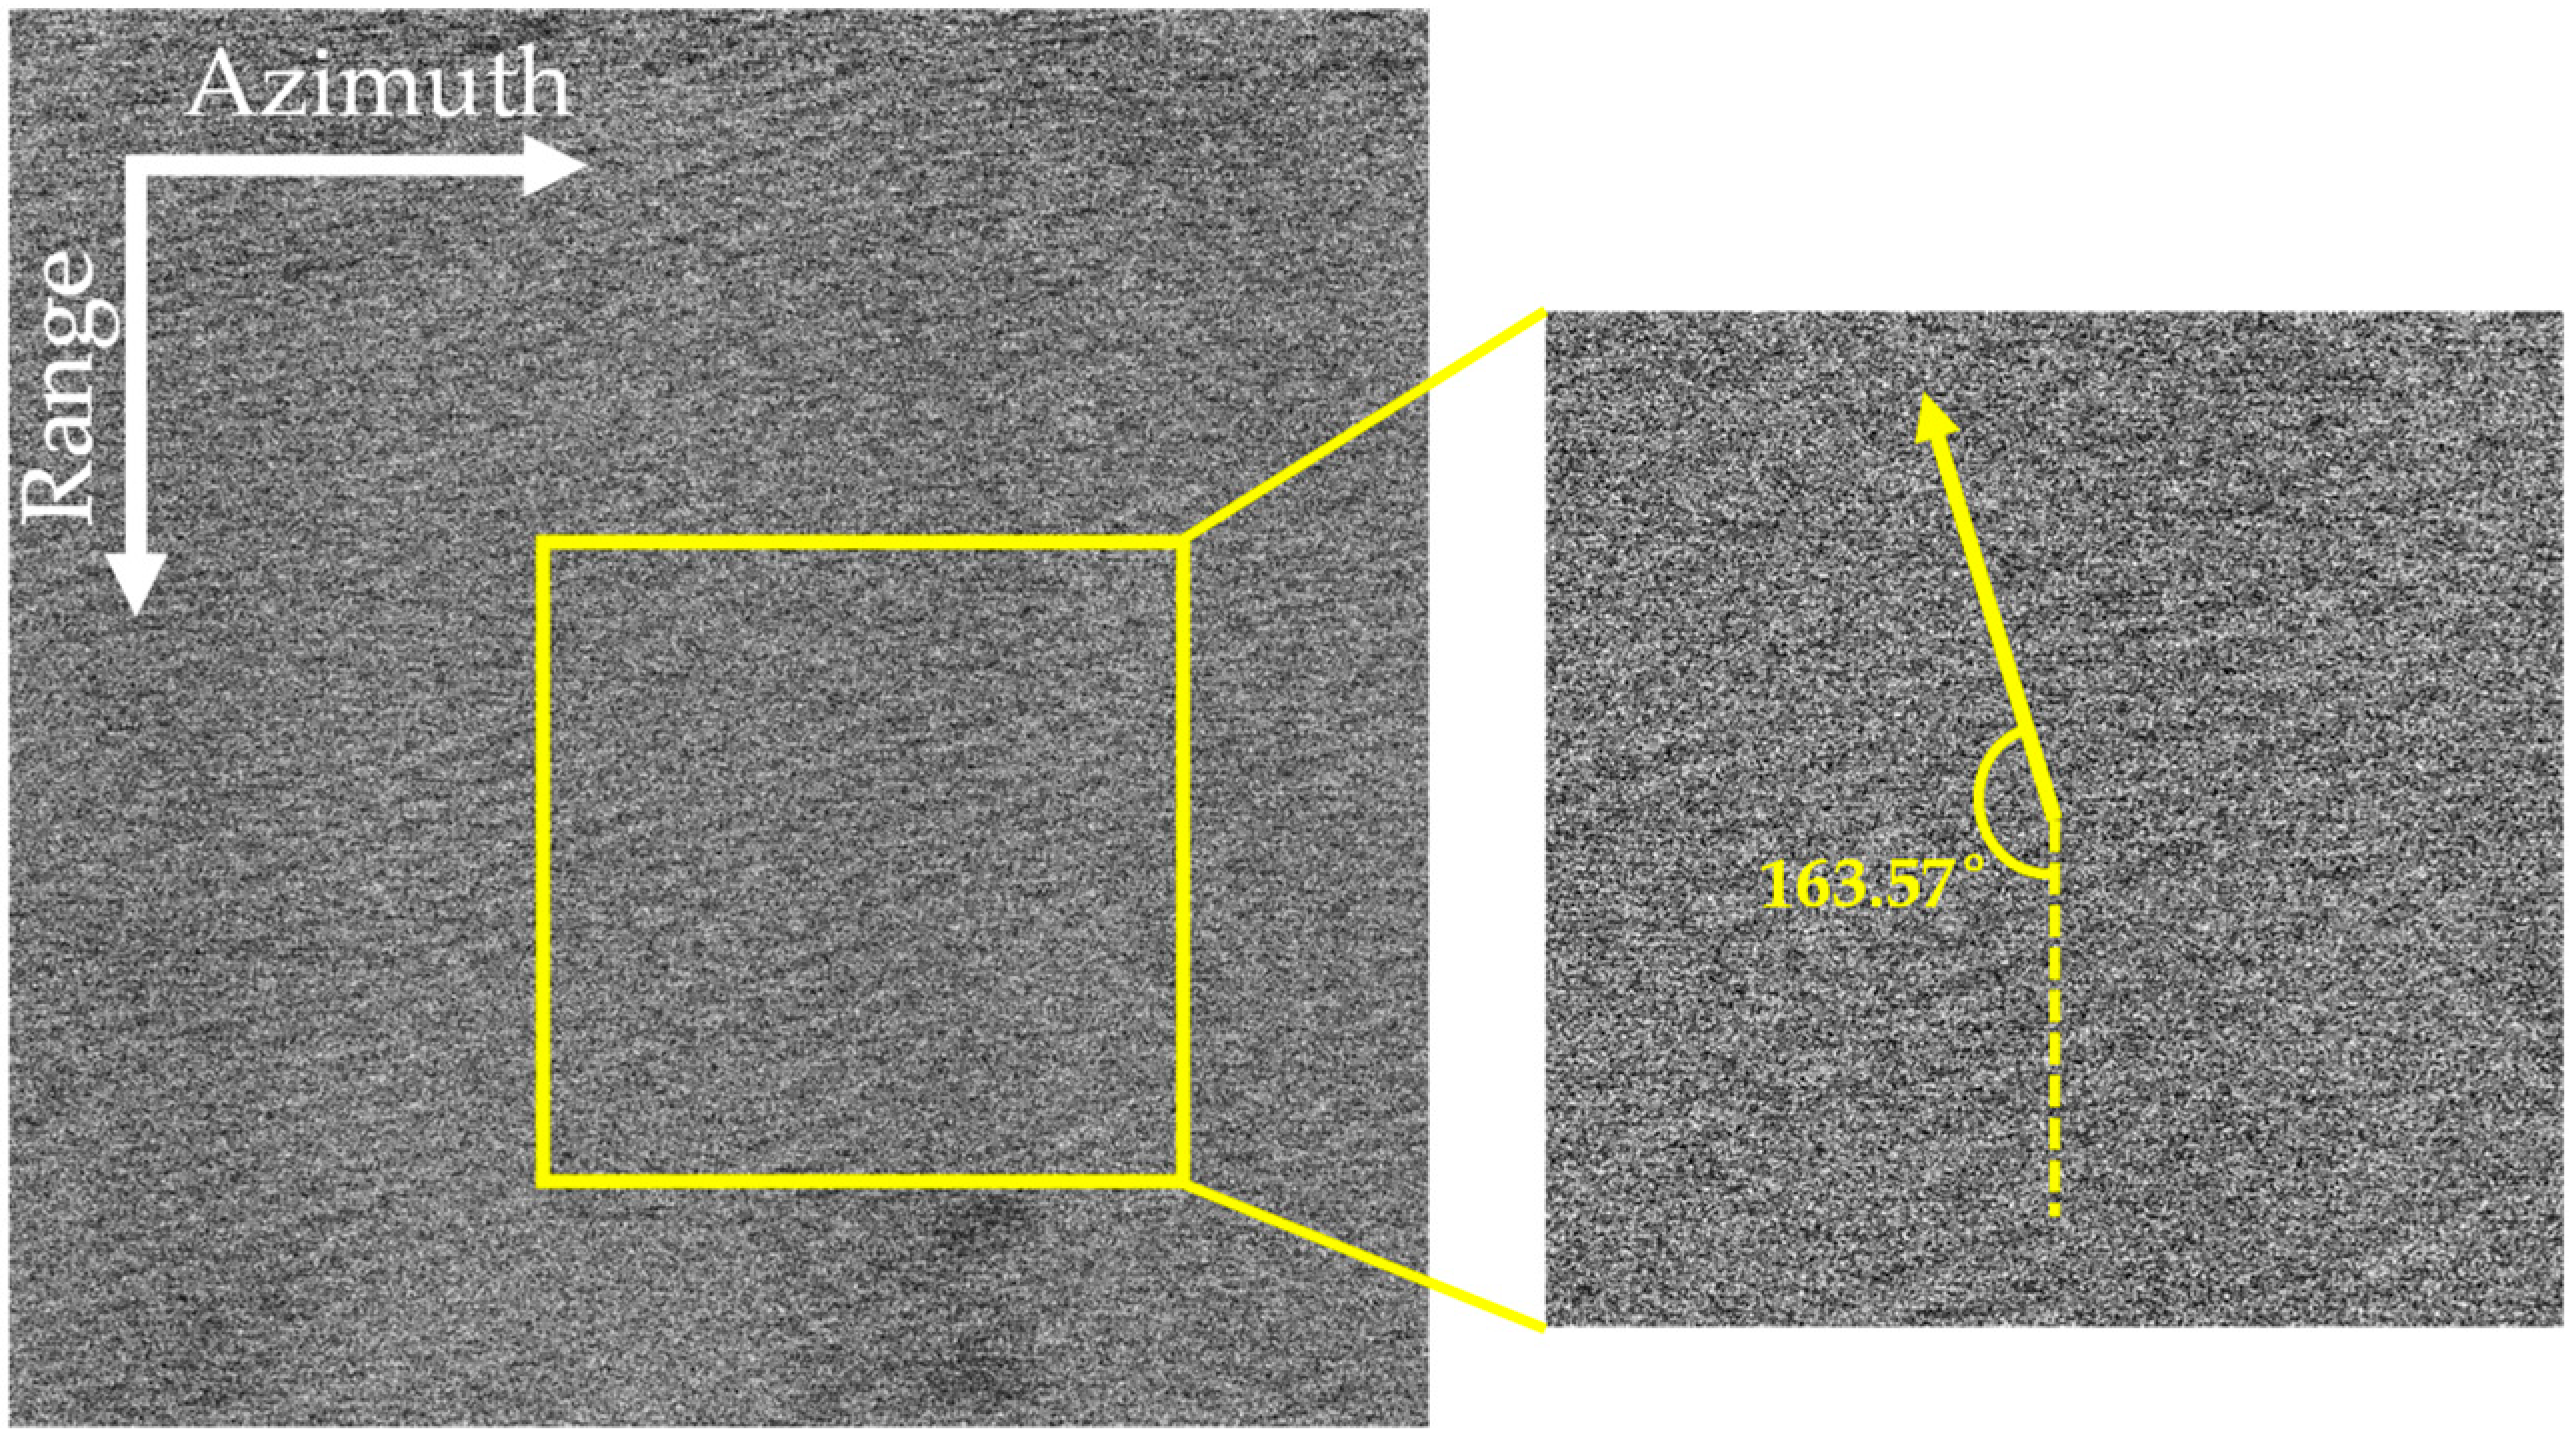
The SAR image shown in Figure 5 was obtained through the proposed algorithm shown in Figure 1. It can be seen that the interference of sea spikes is significantly suppressed. Compared with Figure 4, the texture features of the ocean waves submerged in the sea spikes are highlighted by using the proposed algorithm. According to the data from the European Centre for Medium-Range Weather Forecasts (ECMWF), the angle between the wave direction and the radar range direction is 163.57°, as indicated by the yellow arrow in the right image in Figure 5. This angle is nearly perpendicular to the texture in the SAR image, thereby validating the correctness of the imaging results obtained with the proposed algorithm.
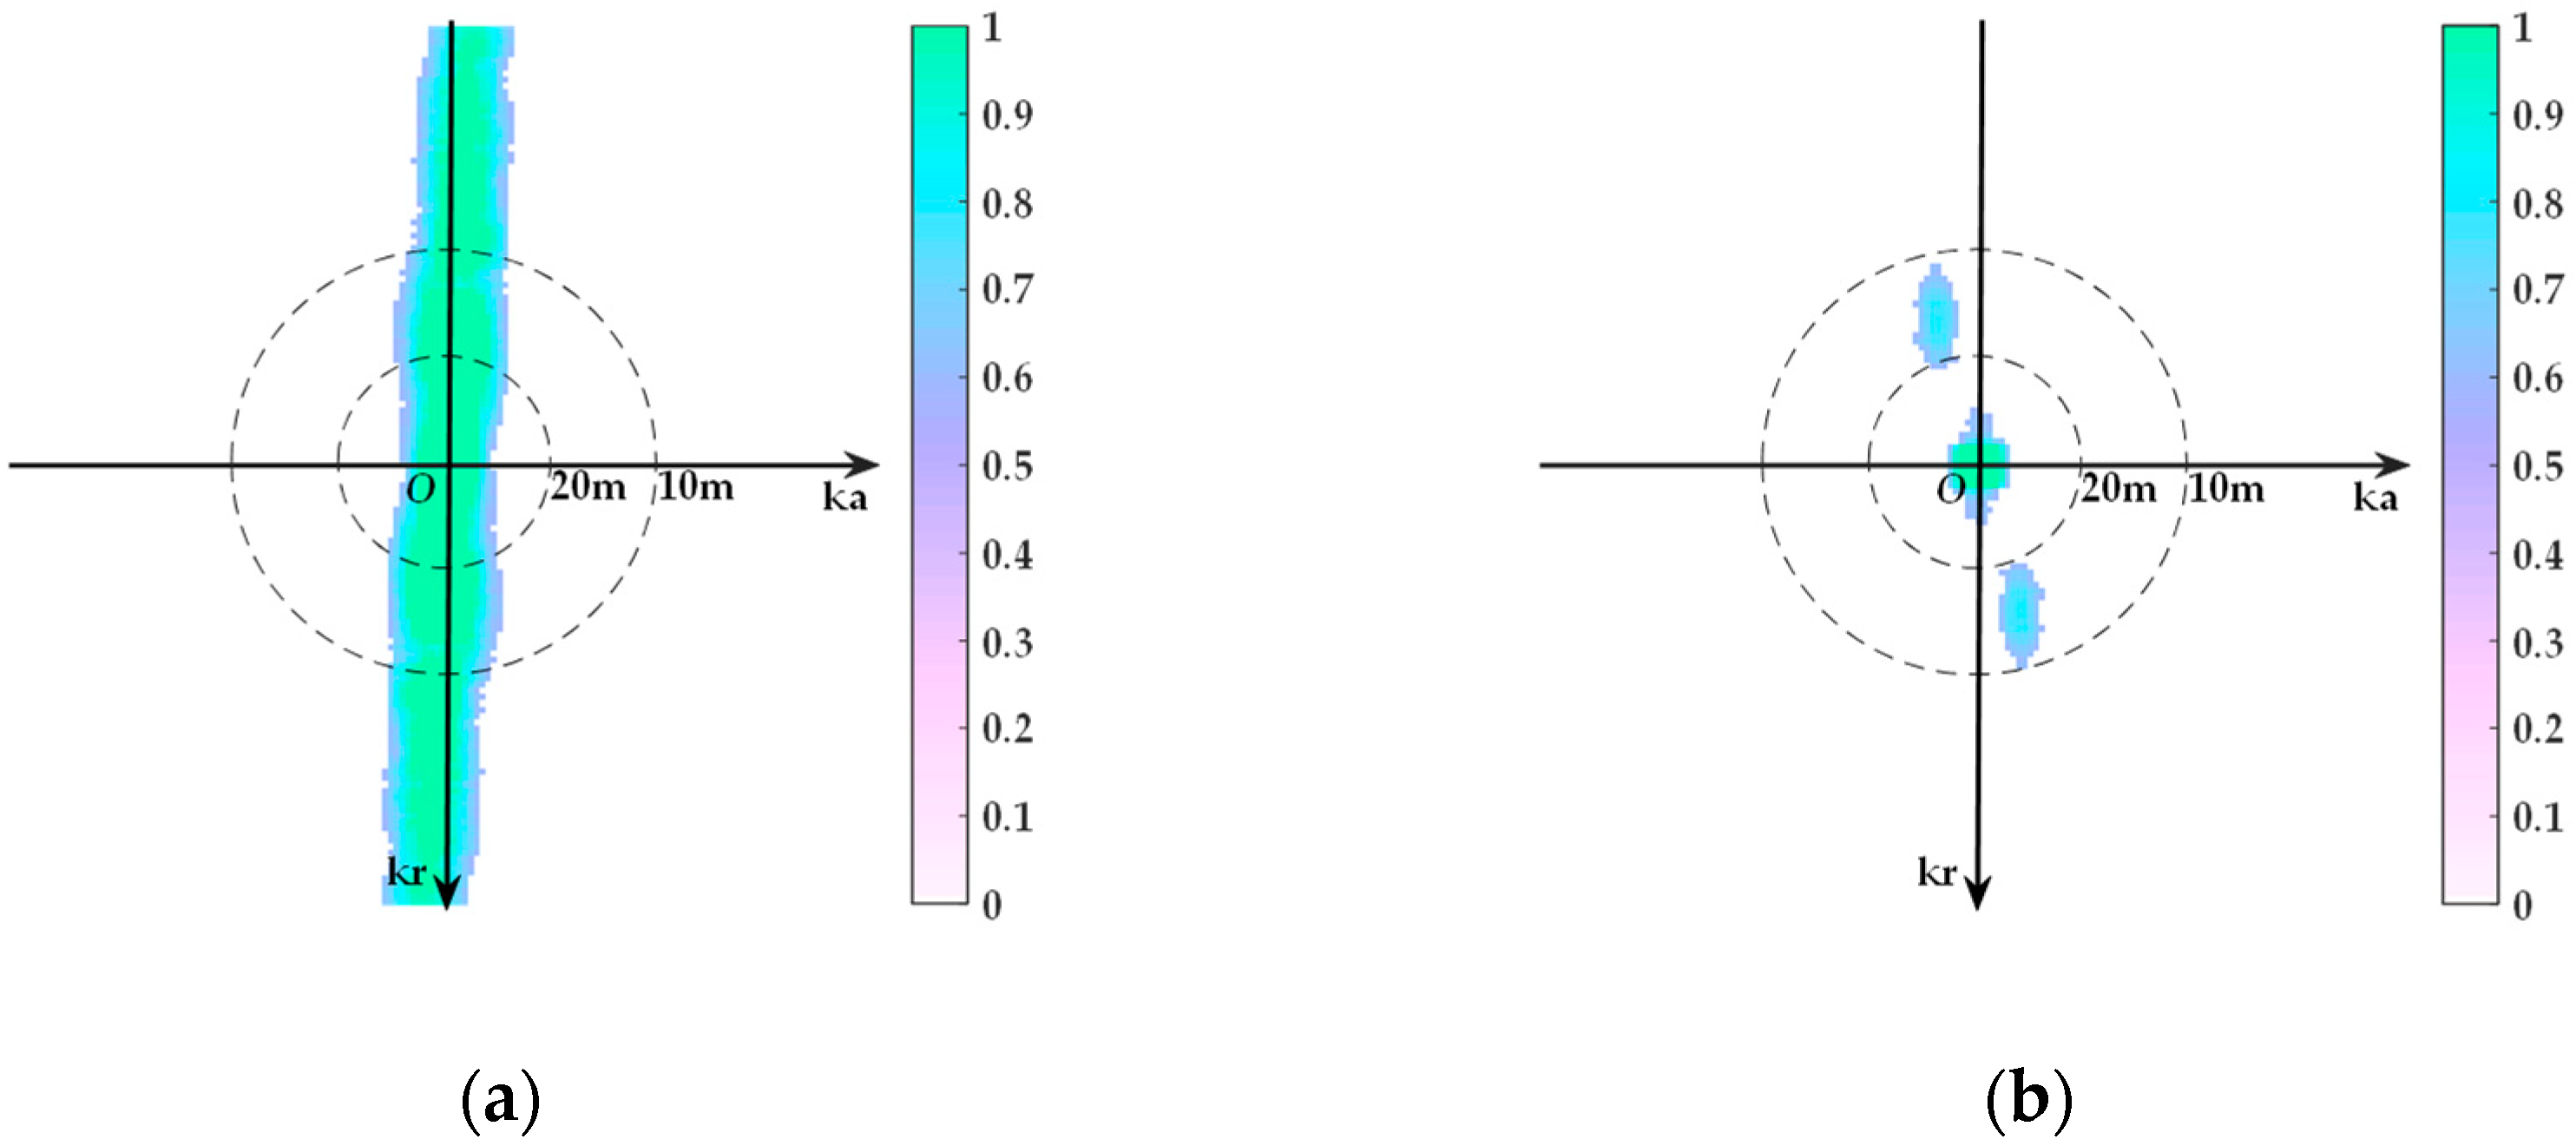
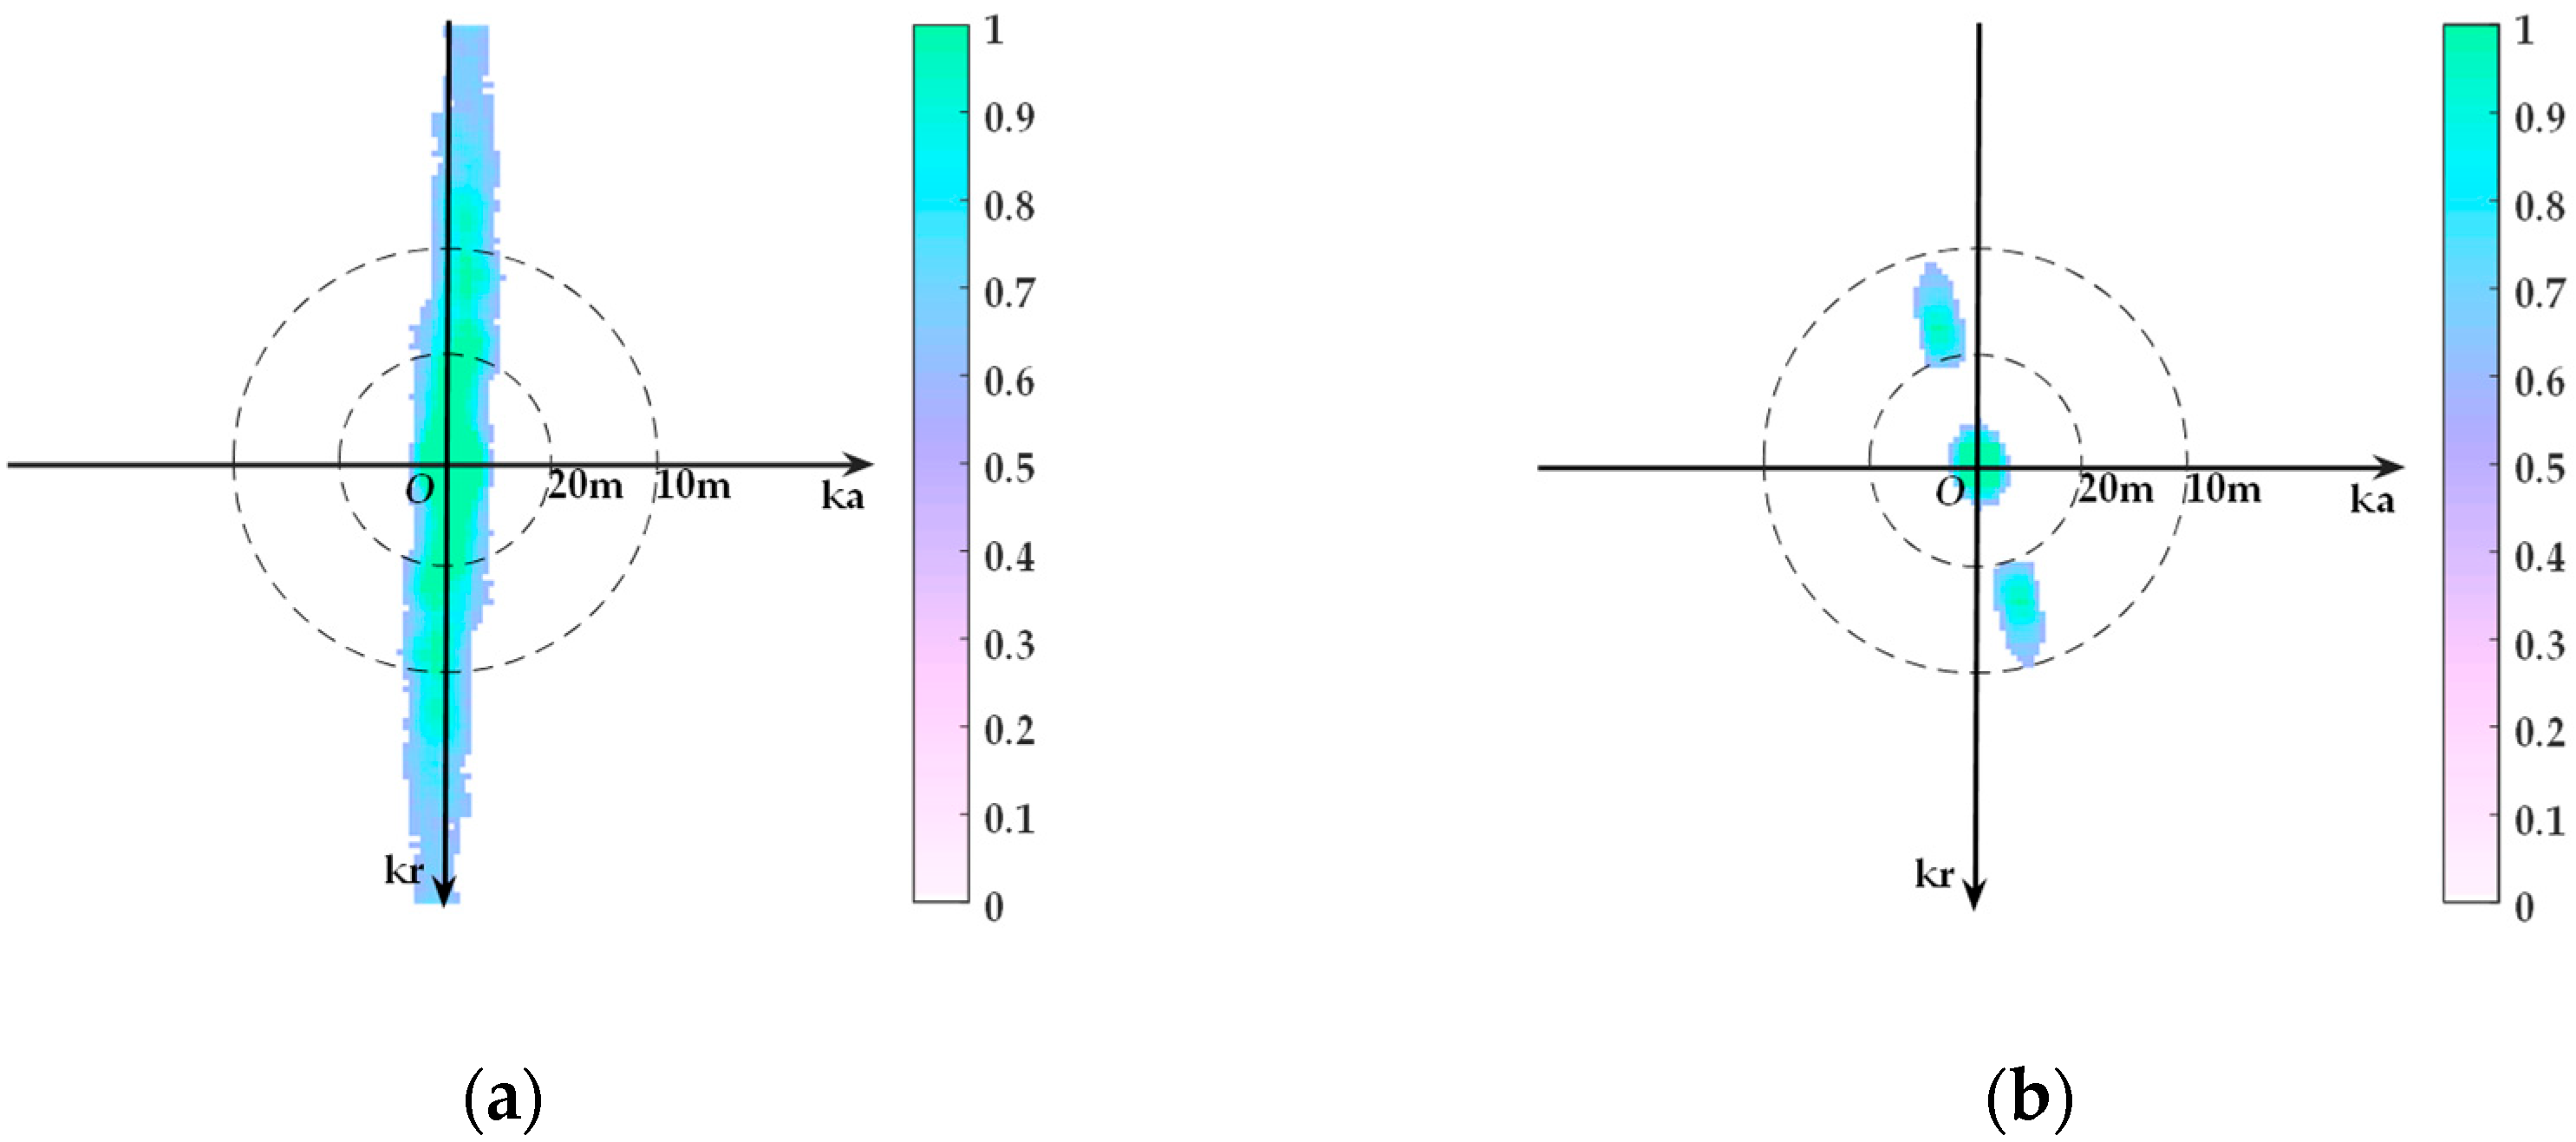
Analysis of image spectrums for HH polarization data of completely invisible waves is given. For the HH polarization data of completely invisible waves, the image spectrum of the SAR image obtained by the omega-k imaging algorithm is shown in Figure 6a, while the corresponding result obtained by the proposed algorithm is shown in Figure 6b.
The effectiveness of the proposed algorithm is clearly revealed by the comparison of the wave spectrums shown in Figure 6. As shown in Figure 6a, the image spectrum of ocean waves obtained by the omega-k imaging algorithm is aliased with the spectrum of sea spikes, making it difficult to distinguish. It is difficult to extract ocean wave parameters from the spectrum because the image spectrum of ocean waves is overlapped with that of sea spikes. In contrast, after processing by the proposed algorithm, the wave spectrum submerged in the sea spike spectrum can be more clearly distinguished, as shown in Figure 6b. The significant improvement not only demonstrates the effectiveness of the proposed algorithm in suppressing sea spikes, but also means that the clear and reliable wave spectrum information can be obtained, laying a solid foundation for subsequent ocean parameter retrieval.

3.2. Case 2: Completely Invisible Waves Under Sea Spike Influence (VV Polarization)

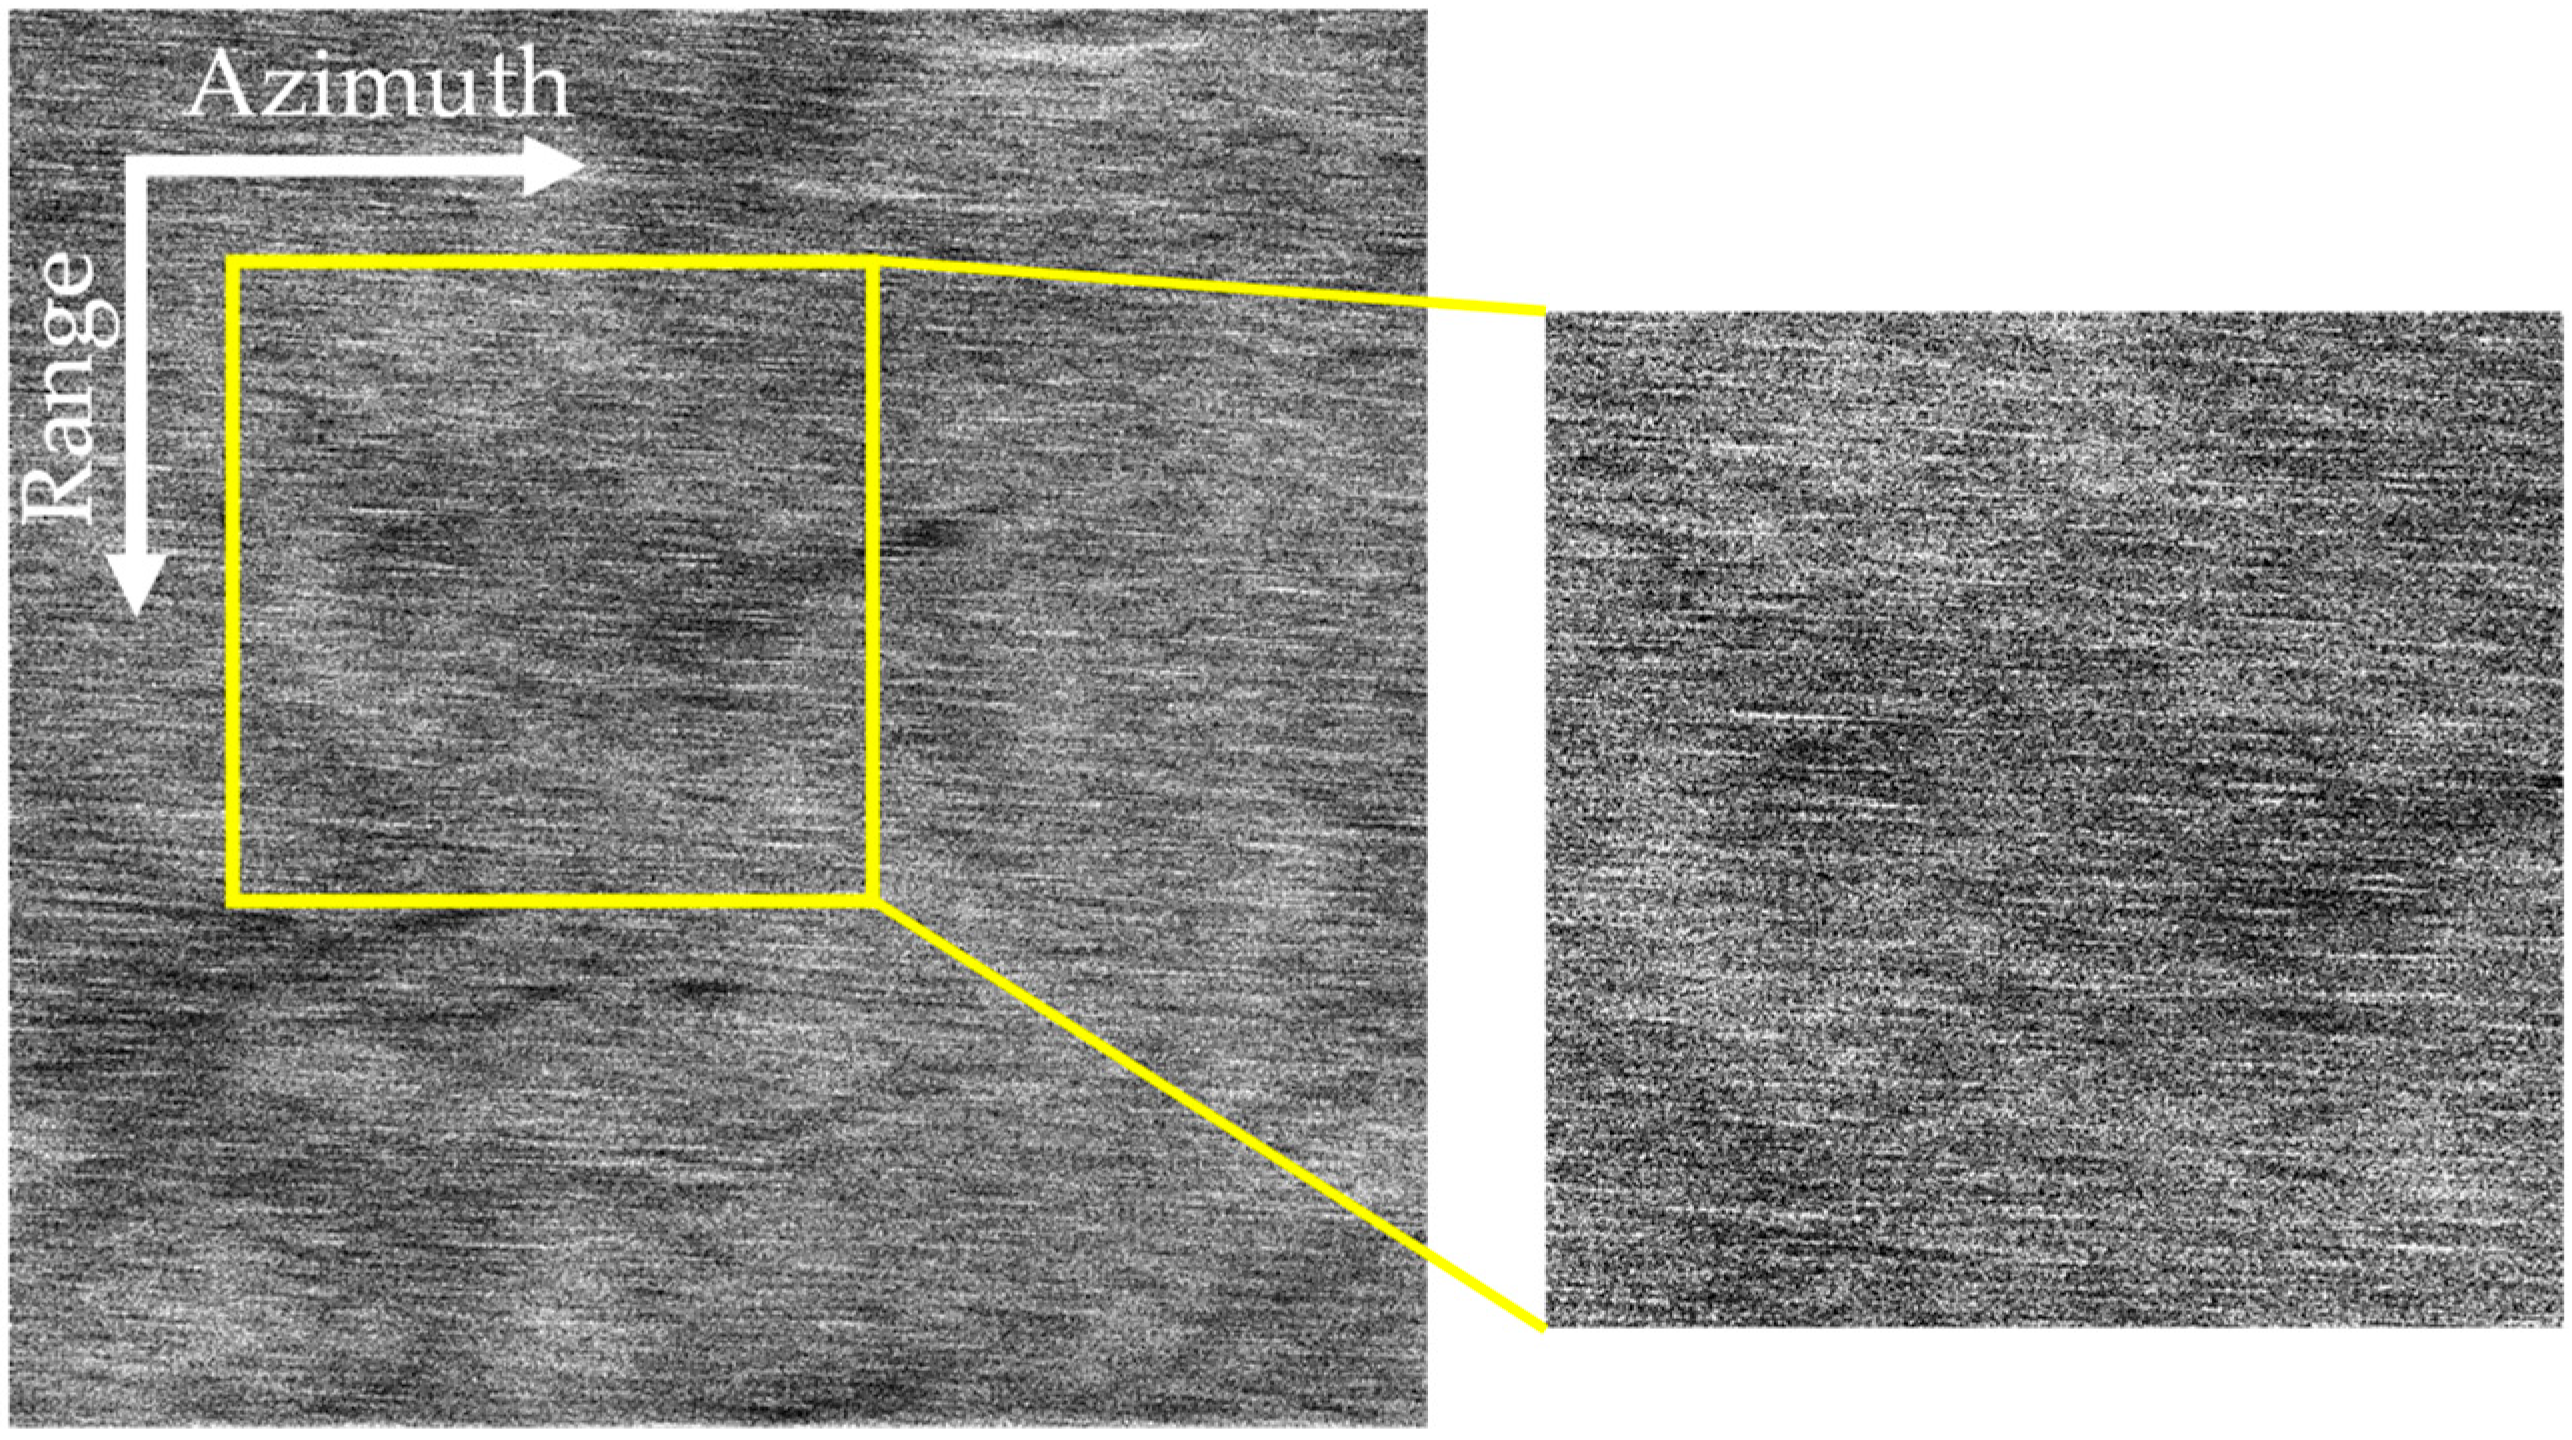
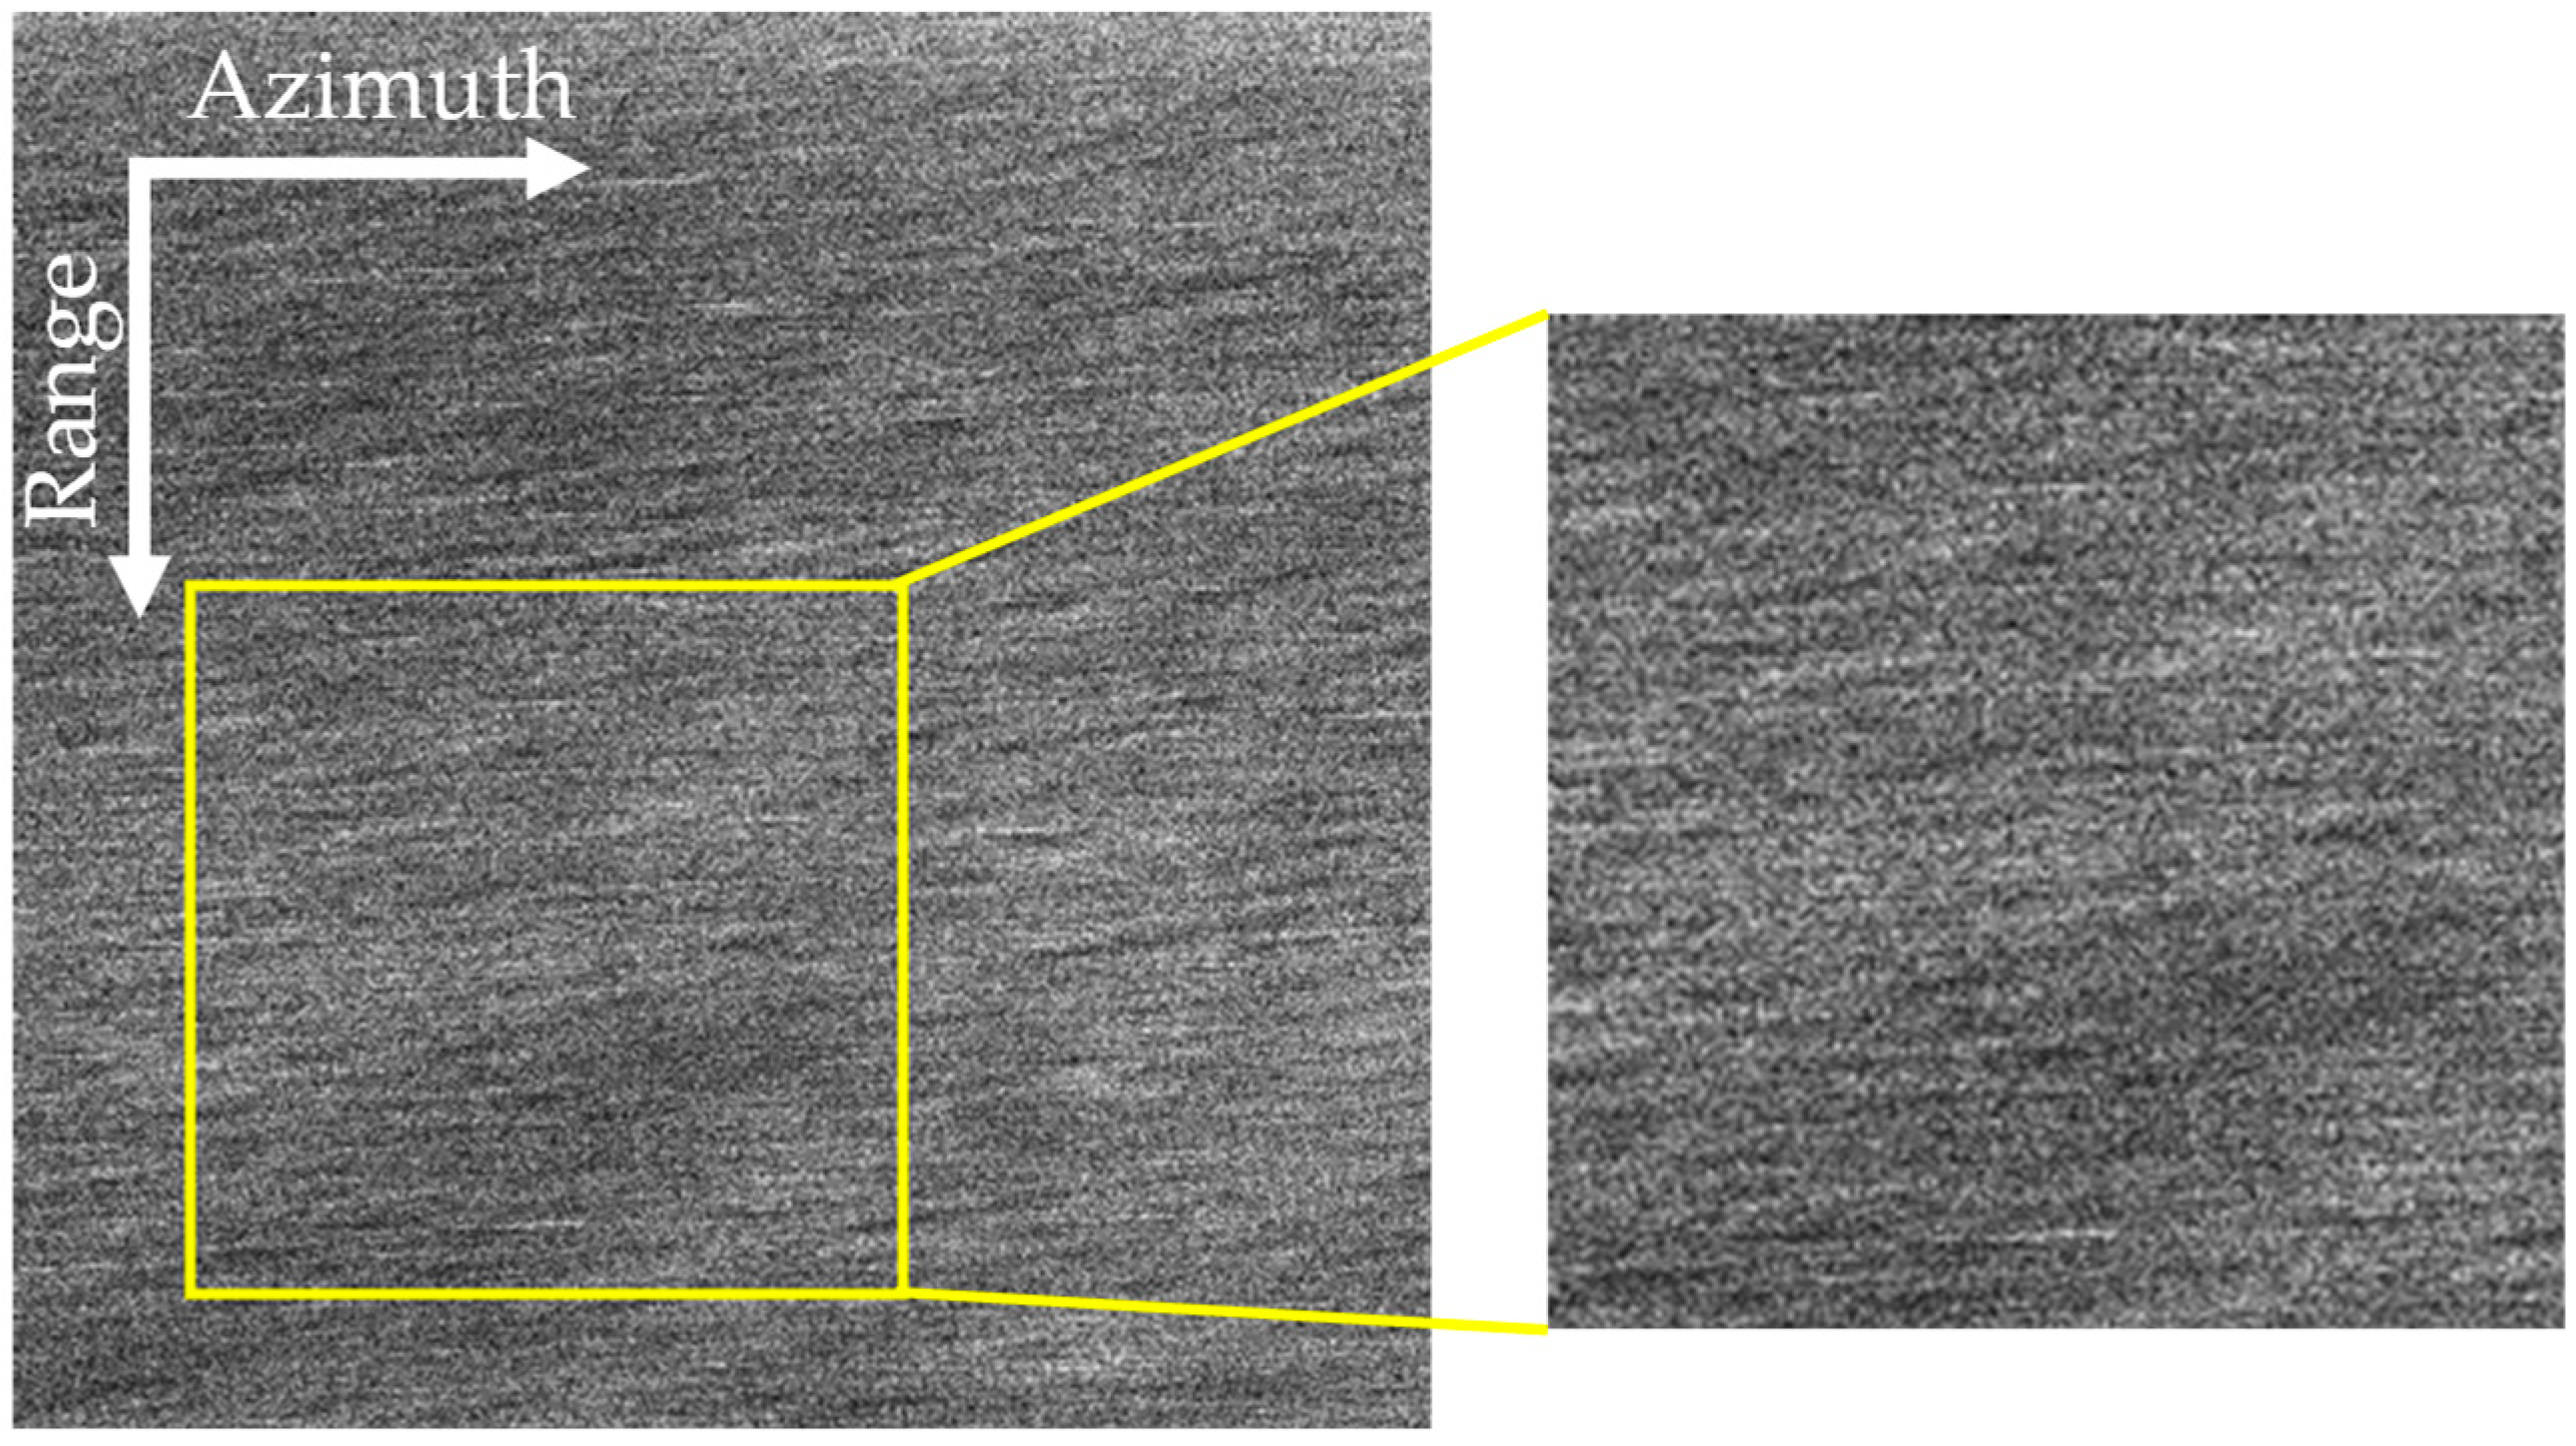
For Case 2, the experimental data, in which waves are completely invisible due to sea spike interference, differed from the data in Case 1. The time interval between Case 1 and Case 2 was 20 min, and the routes were parallel. Except for the polarization mode, which was VV, the other SAR parameters were identical to those in Case 1, as shown in Table 1. The SAR image obtained by the omega-k imaging algorithm [15] is given in Figure 7. Although the SAR image is less affected by the sea spikes than that in Figure 4, the wave texture is still covered by the sea spikes, making it difficult to distinguish the ocean waves.
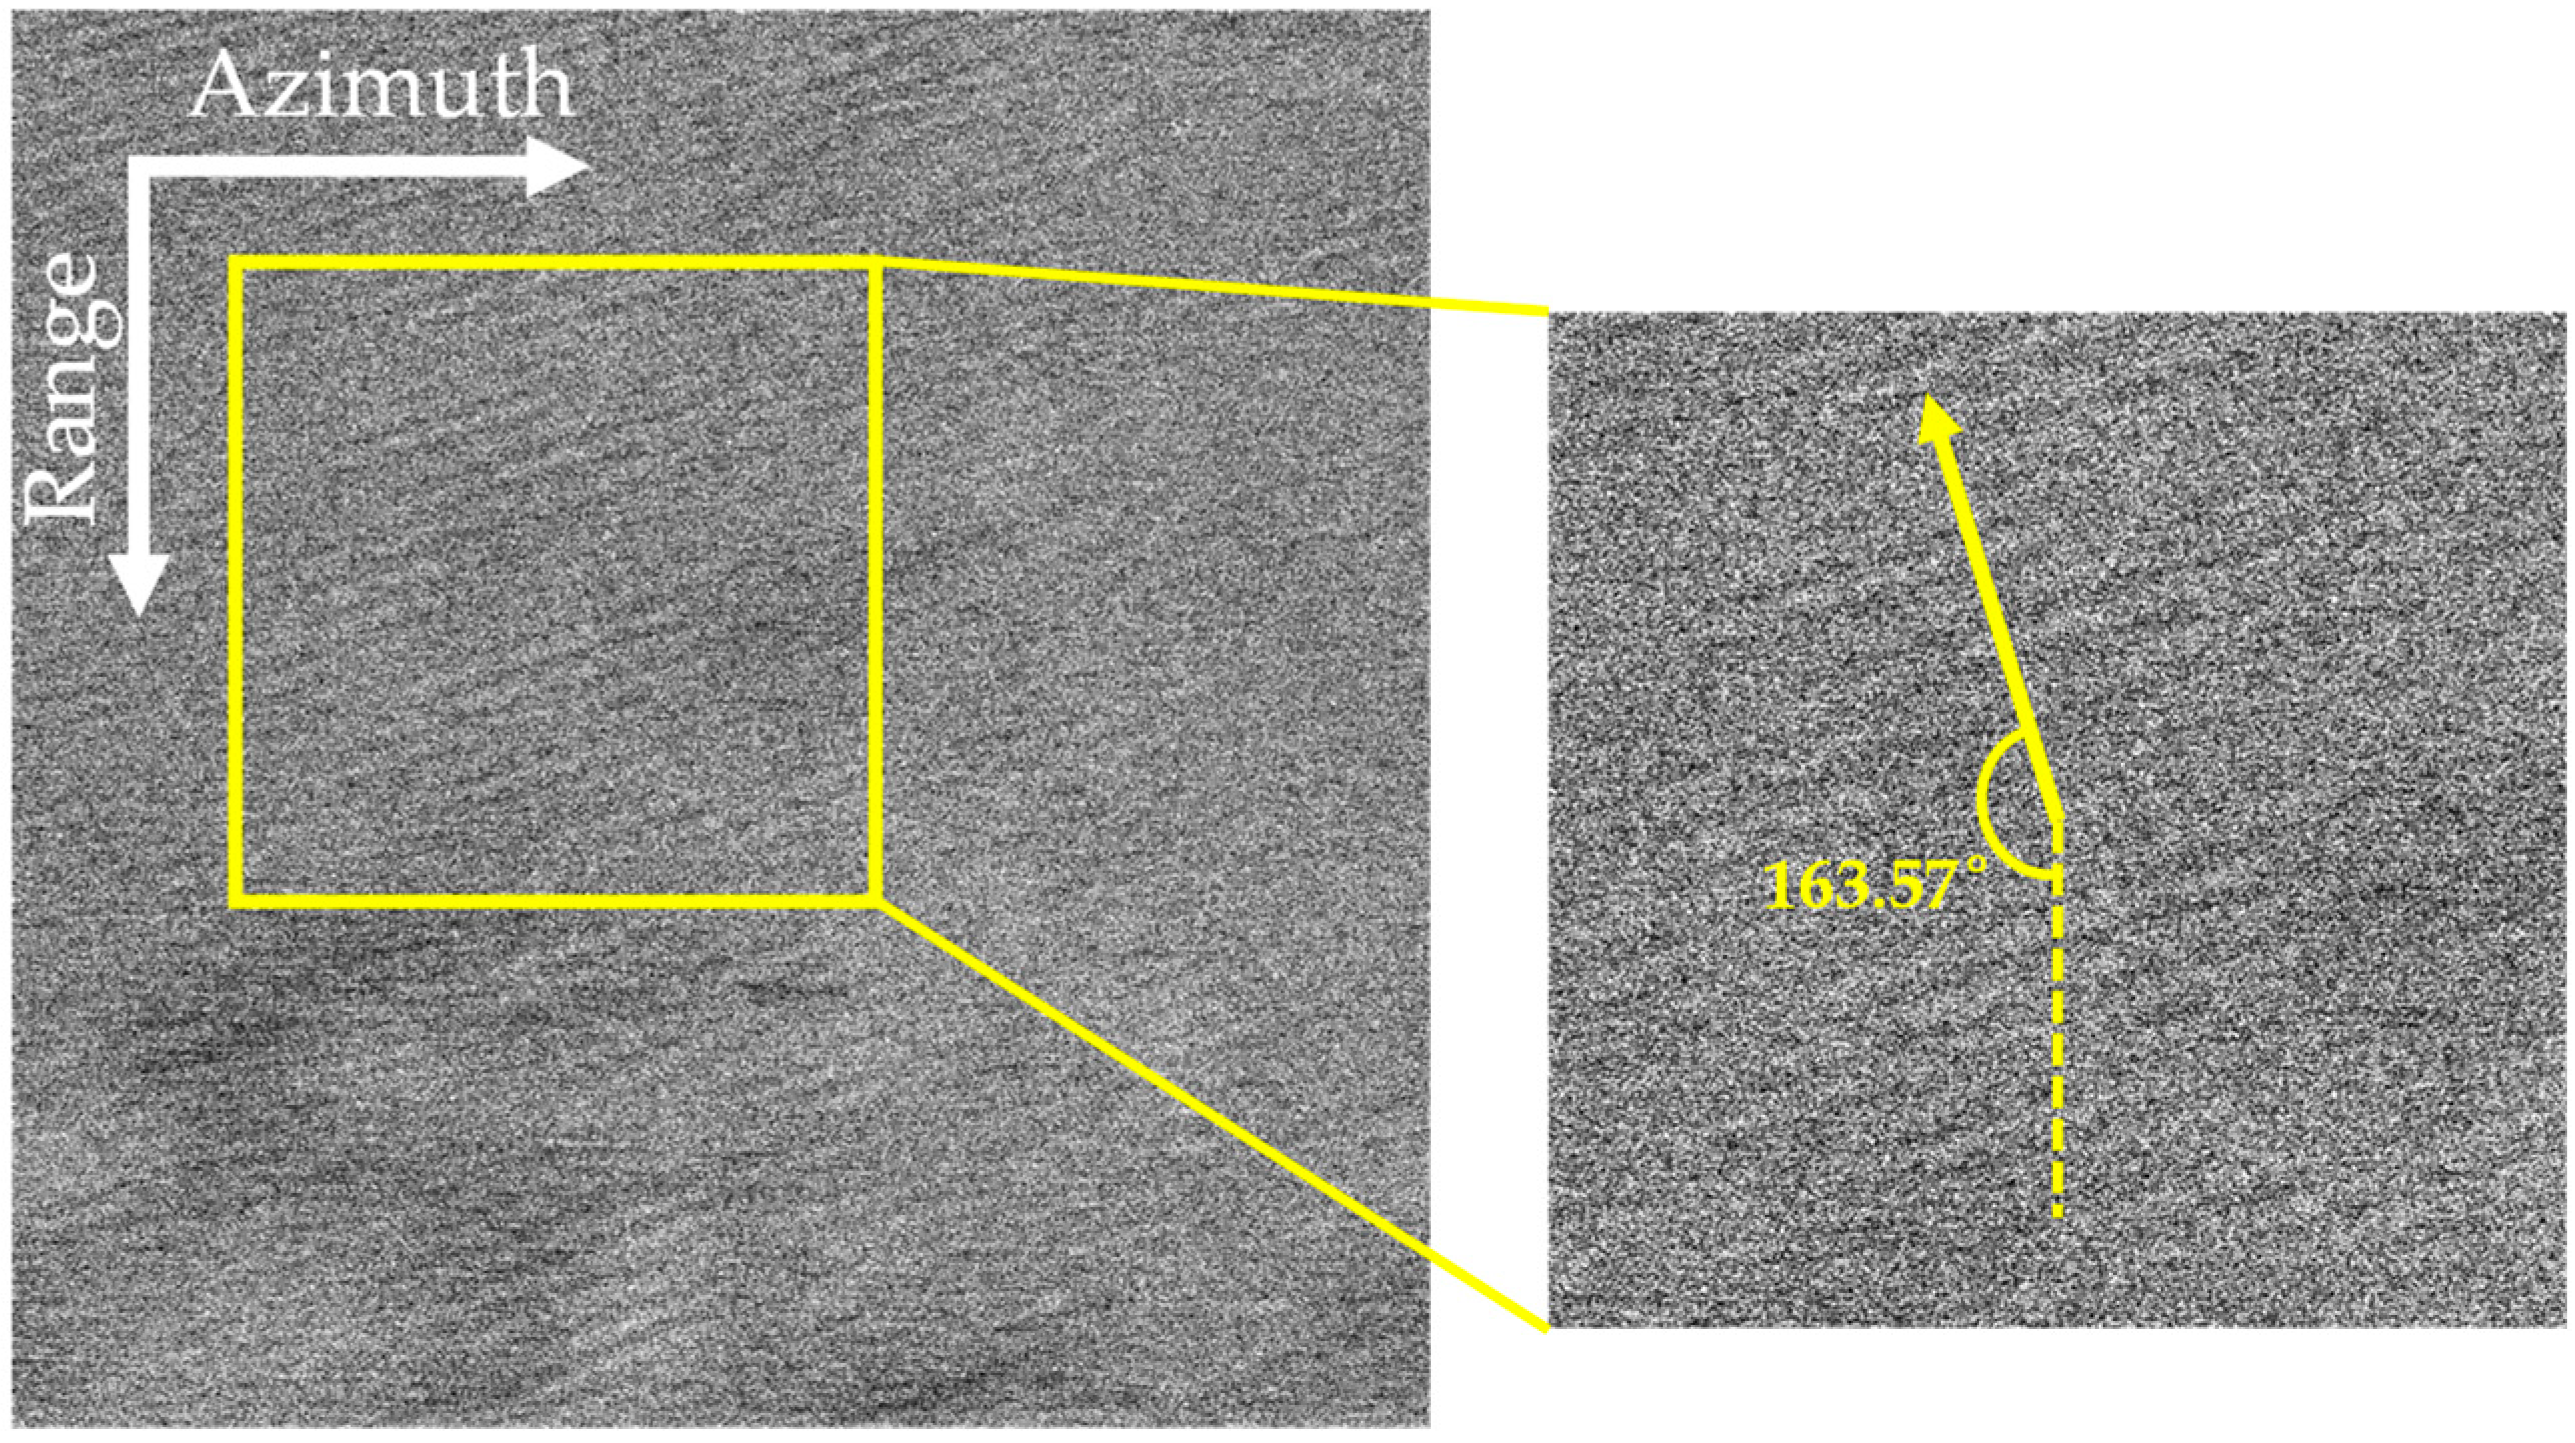
The SAR image shown in Figure 8 is the result of data processed through the proposed algorithm, where a noticeable suppression of sea spikes can be observed. In comparison with Figure 7, the texture features of the ocean waves are effectively enhanced. Because the time interval between Case 1 and Case 2 was 20 min, the wave direction did not change, and the routes were parallel. Therefore, the angle between the wave direction and the radar range direction was the same as in Case 1, namely 163.57°, as indicated by the yellow arrow in the right image in Figure 8. The angle is nearly perpendicular to the texture in the SAR image, thereby validating the correctness of the imaging results. Furthermore, compared with the HH polarization results shown in Figure 5, the wave texture features exhibit high consistency.
Analysis of the image spectrums for VV polarization data of completely invisible waves is given. For the VV polarization data of completely invisible waves, the image spectrum of the SAR image obtained by the omega-k imaging algorithm is shown in Figure 9a, while the corresponding result obtained by the proposed algorithm is shown in Figure 9b.
The effectiveness of the proposed algorithm is clearly verified by the comparison of the wave spectrums. As shown in Figure 9a, the image spectrum of ocean waves obtained by the omega-k imaging algorithm significantly overlaps with the spectrum of sea spikes, preventing accurate extraction of wave parameters from the spectrum. In contrast, the wave spectrums are significantly separated from sea spike interference by the proposed algorithm, as shown in Figure 9b. In addition, compared with the image spectrums of HH polarization data shown in Figure 6, it can be seen that HH polarization is more severely affected by sea spikes, and the spectral energy of the sea spikes is higher. After processing the data with the proposed algorithm, the wave spectrums under HH and VV polarizations were effectively recovered, with both showing relatively consistent spectrum characteristics. This indicates that the proposed algorithm has a better processing capacity for uniform HH and VV polarization.

3.3. Case 3: Weakly Visible Waves Under Sea Spike Influence

Experimental data in which waves are weakly visible due to sea spike interference were obtained from the sea trial experiment conducted by the Aerospace Information Research Institute, Chinese Academy of Sciences covering the South China Sea in 2020. The parameters of the SAR system are shown in Table 2. The SAR image obtained by the omega-k imaging algorithm [15] is given in Figure 10. It can be seen that the wave texture information is extremely weak due to sea spike interference in Figure 10.
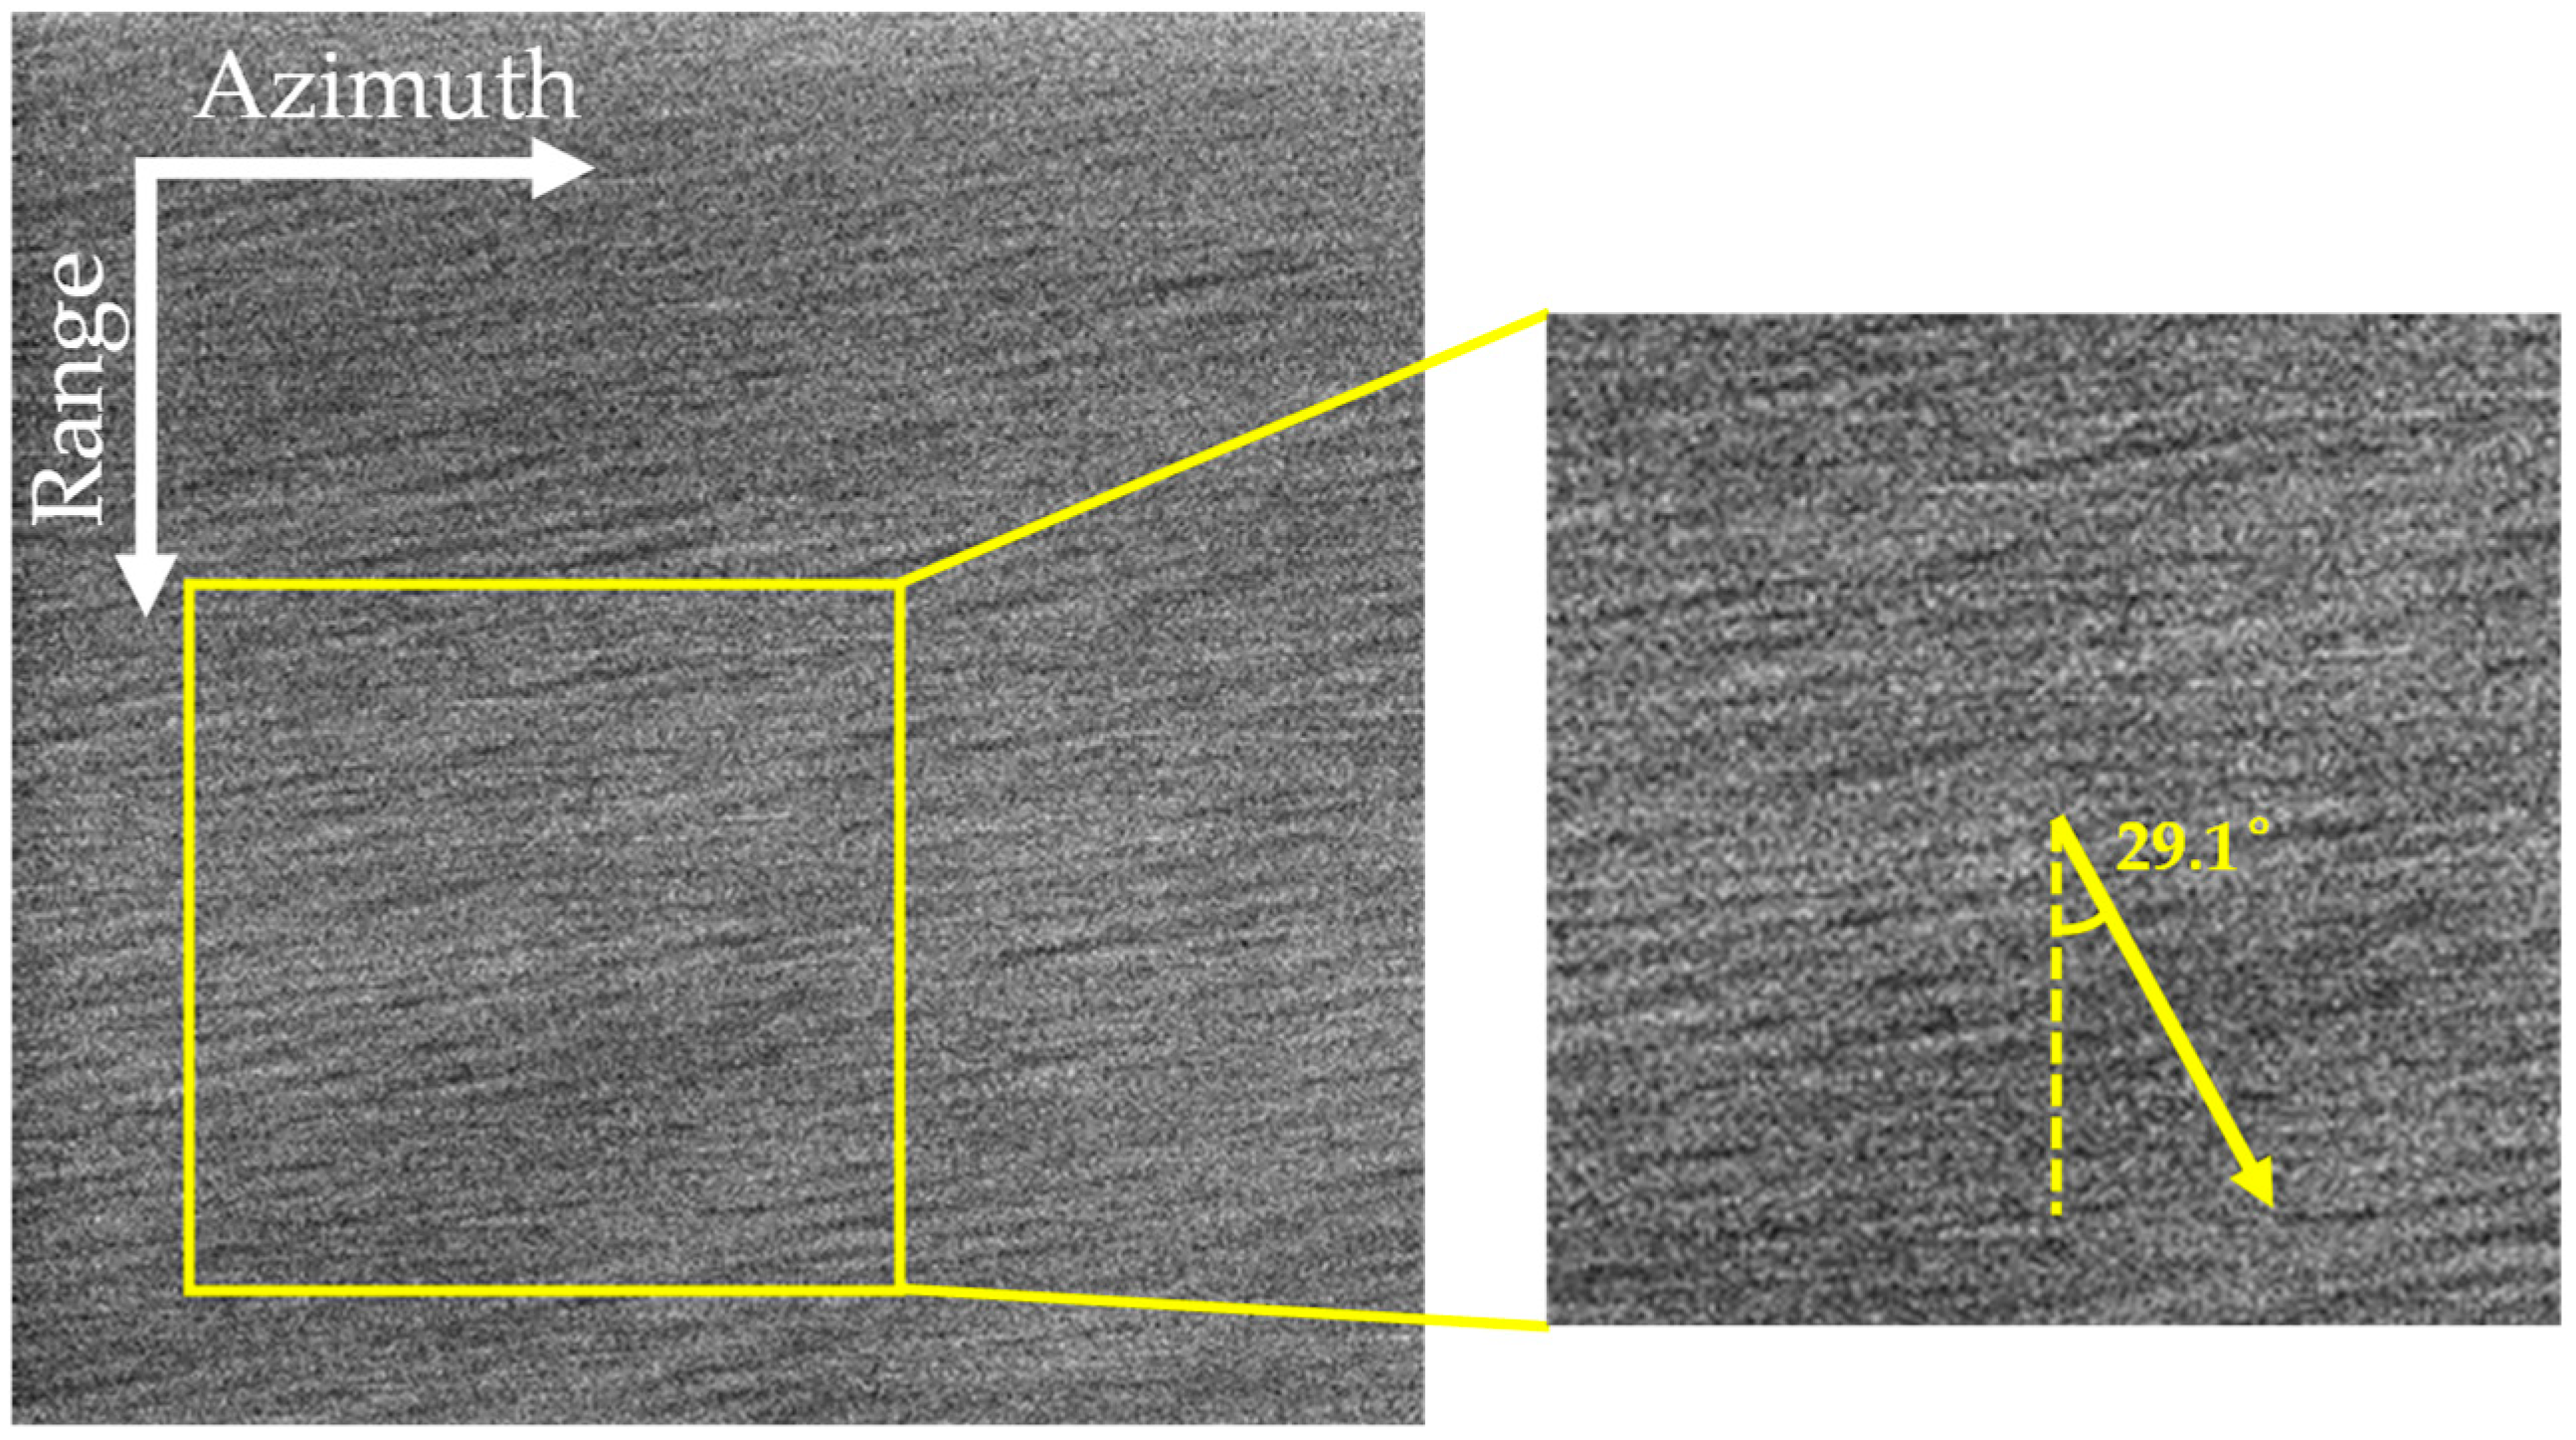
The SAR image shown in Figure 11 was obtained through the proposed algorithm shown in Figure 1. Compared with the omega-k imaging results shown in Figure 10, the texture features of the ocean waves are significantly enhanced, and their spatial distribution details are more distinct. This fully verifies the effectiveness of the proposed algorithm in improving the quality of ocean waves in SAR images. The angle between the wave direction and the radar range direction was −29.1°, obtained from the ECMWF data, as indicated by the yellow arrow in the right image of Figure 11. The angle is nearly perpendicular to the texture in the SAR image, which validates the correctness of the imaging results using the proposed algorithm.
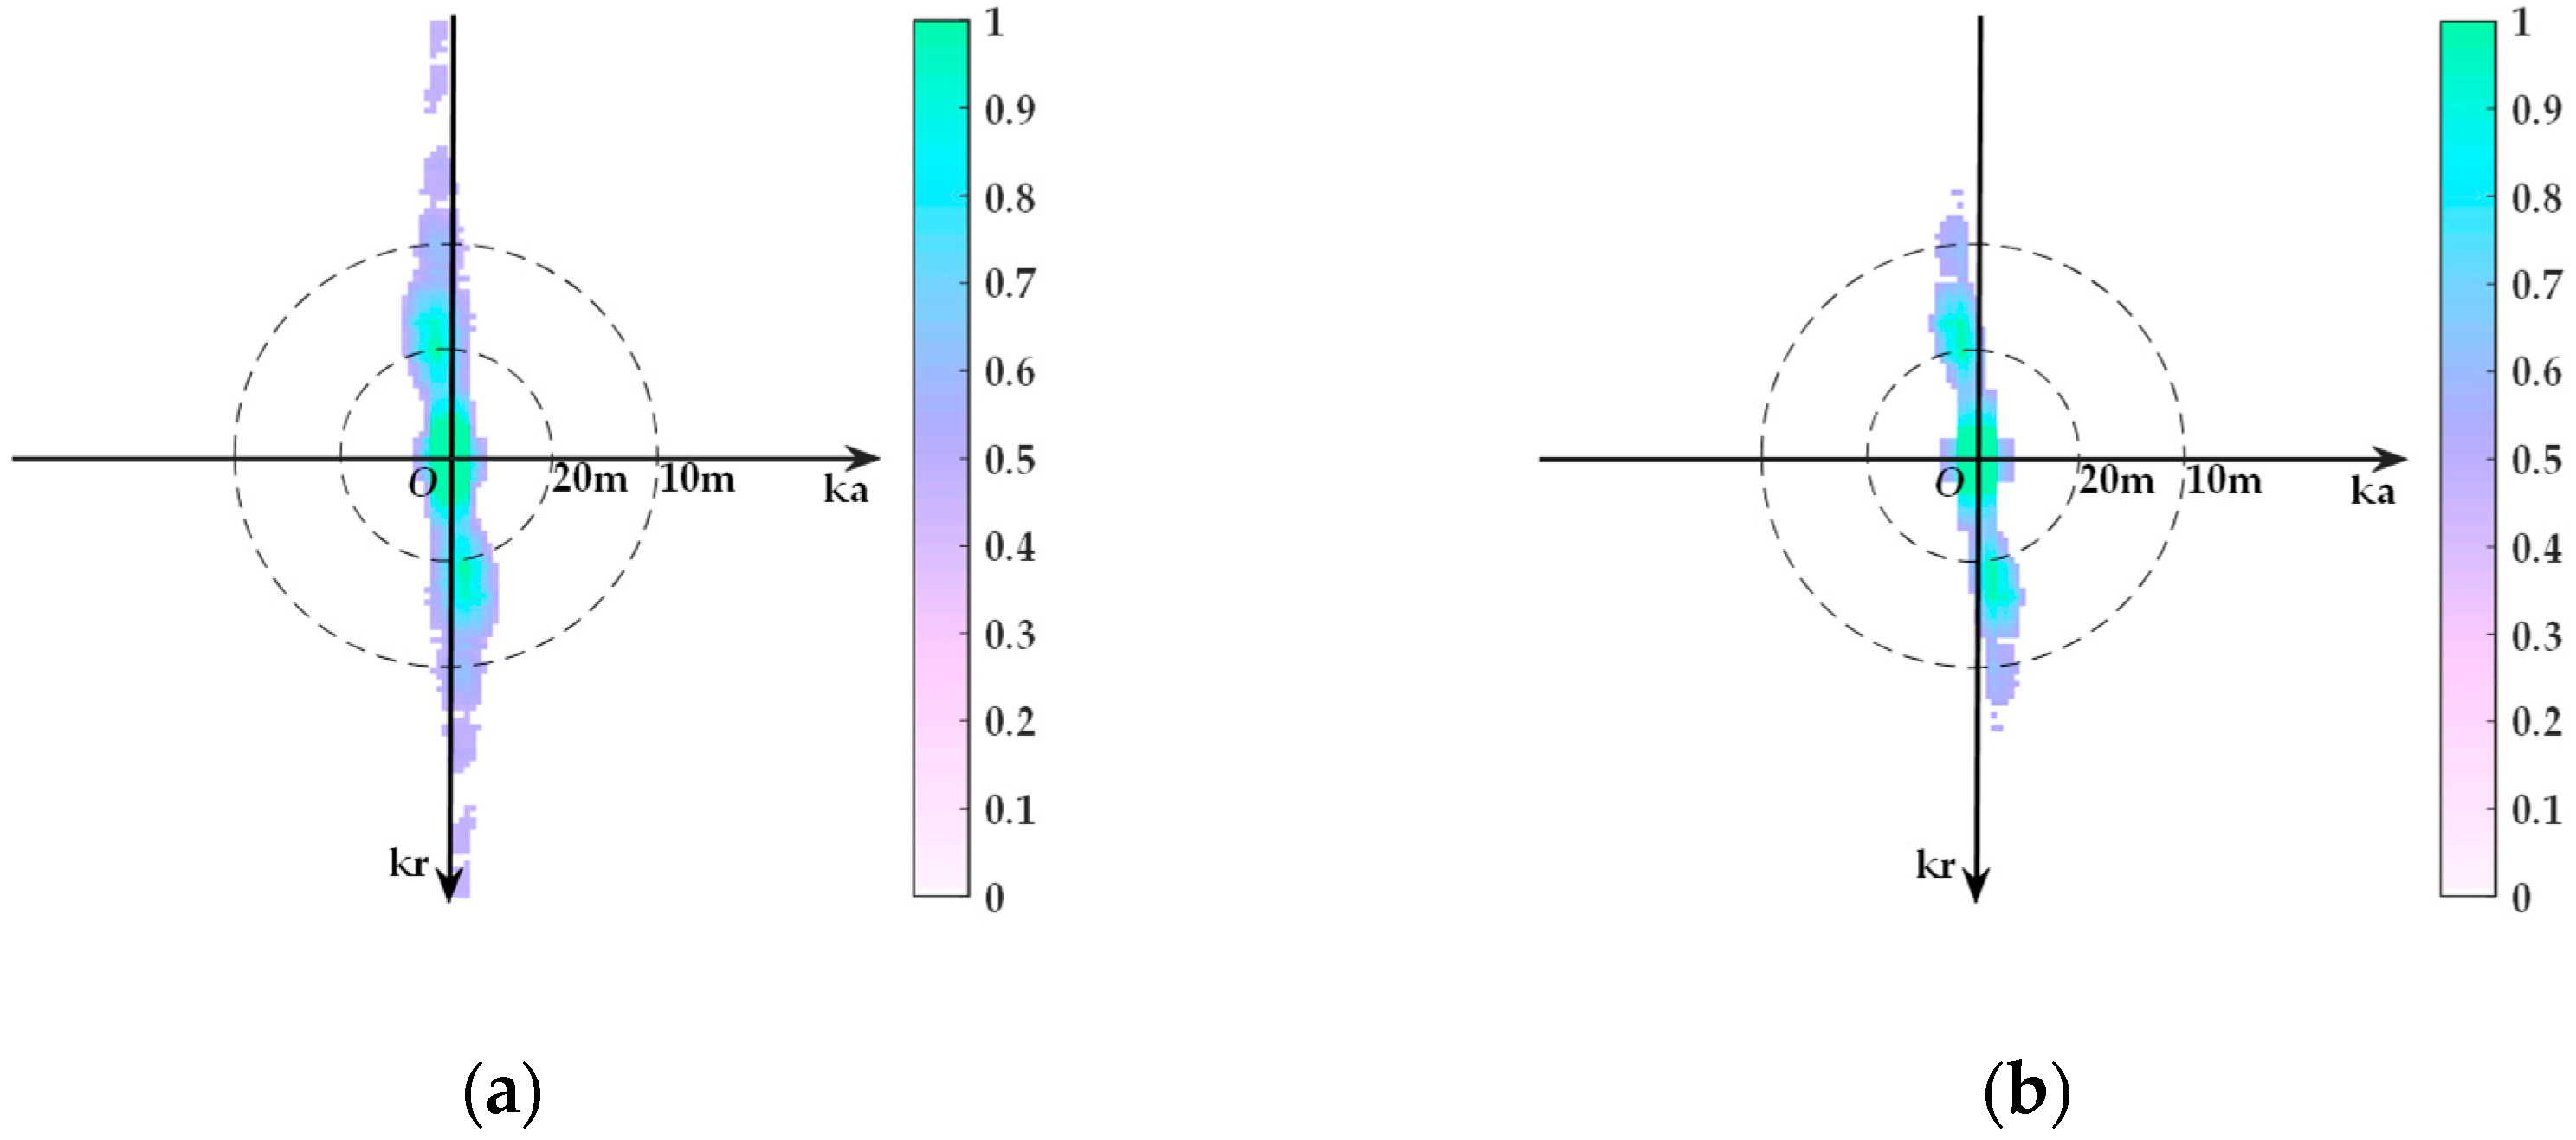
To further demonstrate the effectiveness of the proposed algorithm, analysis of image spectrums for data of weakly visible waves is given. For the data of weakly visible waves, the image spectrum of the SAR image obtained by the omega-k imaging algorithm is shown in Figure 12a, while the corresponding result obtained by the proposed algorithm is shown in Figure 12b.
As shown in Figure 12a, there is significant overlap between the sea spike spectrum and the wave spectrum, which interferes with the extraction of the dominant wave number and significantly interferes with the subsequent retrieval of ocean parameters. Using the proposed algorithm processing, the sea spikes are effectively suppressed and the spectrum features of ocean waves become more prominent, providing a reliable data basis for subsequent applications.

3.4. Quantitative Analysis of Imaging Quality

To further illustrate the effectiveness and superiority of the proposed algorithm, a quantitative analysis of the imaging quality was carried out by calculating the peak-to-background ratio (PBR), standard deviation (STD), and equivalent number of looks (ENL).
The PBR is conventionally employed as a quantitative metric to analyze wave contrast in SAR images. The PBR is defined as the peak value and noise floor of the SAR image spectrum. The SAR image is transformed into a two-dimensional wavenumber domain through a two-dimensional FFT. Then, the PBR of the dominant wave energy in the wavenumber spectrum is calculated. The PBR is defined as follows [19,26]:
P = S I max S n
where S I max and S n represent the peak value and noise floor of the SAR image spectrum, respectively. The larger the PBR, the higher the contrast of the ocean waves.
Due to the homogeneity of SAR images affecting the ability of wave parameter retrieval, the STD and the ENL are calculated to analyze the homogeneity of SAR images. The STD equation is
σ = x = 1 X y = 1 Y I x , y μ 2 X · Y
where μ represents the mean of the SAR image, I x , y represents the pixel values at the coordinate x , y , X and Y represent the number of pixels in the azimuth and range of the SAR image, respectively. The smaller the STD, the more uniform the SAR image.
The ENL can also be used to determine the homogeneity of SAR images [27]. The equation for ENL is [28]
ξ = μ 2 σ 2
The larger the ENL, the higher the homogeneity. For the Case 1 and Case 2 data of completely invisible waves and the Case 3 data of weakly visible waves, a comparison of the PBR, STD and ENL between the SAR images obtained by the omega-k imaging algorithm and those obtained by the proposed algorithm is shown in Table 3.
As can be seen in Table 3, the PBR of the proposed algorithm improved by 10.9% compared to that of the omega-k imaging algorithm for the Case 1 data of completely invisible waves. The STD decreased by 45.2%, and the ENL increased by 34.3%, which fully demonstrates the significant improvement in wave contrast processing by the proposed algorithm. The PBR of the proposed algorithm improved by 13.5% compared to that of the omega-k imaging algorithm for the Case 2 data of completely invisible waves. The STD decreased by 20.5%, and the ENL increased by 16.7%. The PBR of the proposed algorithm improved by 7.2% compared to that of the omega-k imaging algorithm for the Case 3 data of weakly visible waves. The STD decreased by 3.1%, and the ENL increased by 11.8%. The effect of the data of completely invisible waves is more significant compared with that of weakly visible waves, which fully demonstrates the significant improvement in wave contrast processing by the proposed algorithm.
The data for Case 1 and Case 2 involved different polarizations but were collected on the same day. Comparing the results of Case 1 and Case 2, it can be seen that for both the omega-k algorithm and the proposed algorithm, the PBR obtained by HH polarization is greater than that obtained by VV polarization. There are two main reasons for this. On the one hand, the SAR image contrast with HH polarization is higher. On the other hand, it is affected by the difference between channels. According to the STD and ENL, the homogeneity of HH polarization is lower using the omega-k algorithm. And the homogeneity of HH polarization is almost the same as that of VV polarization using the proposed algorithm.
In addition, the data for Case 1 and Case 3 are both HH polarization, but they were collected at different frequencies and at separate times. Comparing the results of Case 1 and Case 3, it can be seen that for both the omega-k algorithm and the proposed algorithm, the PBR obtained from the data of completely invisible waves is greater than that of the weakly visible waves data, mainly due to the influence of the SAR system. Different SAR systems have varying levels of base noise, resulting in different noise floors in the SAR image spectrum. The PBR is affected by different noise floors in the SAR image spectrum.

4. Conclusions

Due to the influence of sea spikes, ocean waves in SAR images often have unclear or even invisible texture features. In order to solve these problems, an airborne SAR imaging algorithm for ocean waves oriented to sea spike suppression is proposed in this paper. First, pulse compression in range is performed on SAR raw data. Then, considering the non-stationary characteristics of sea spikes, SAR echo data is transformed into the time–frequency domain by short-time Fourier transform. Sea spike echo signals are suppressed in the time–frequency domain. Subsequently, reconstructed SAR data after sea spike suppression is obtained by inverse short-time Fourier transform. Finally, the ocean waves are imaged in focus by applying focus settings. The proposed algorithm is applied to airborne SAR data, including SAR data with completely invisible waves and SAR data with weakly visible waves. The results demonstrate that the texture features of ocean waves in SAR images can be improved using the proposed algorithm. The contrast of ocean waves using the proposed algorithm is improved compared to that using the omega-k imaging algorithm, and the homogeneity of SAR images is effectively enhanced, fully demonstrating the effectiveness of the proposed algorithm. The results not only demonstrate the effectiveness of the proposed algorithm in suppressing sea spikes but also mean that clear and reliable wave spectrum information can be obtained, laying a solid foundation for subsequent SAR application in ocean remote sensing, such as parameter retrieval of ocean waves. In addition, sea spikes are also common in spaceborne SAR images, such as GF-3 and AIRSAT-01 SAR images. The physical mechanism is similar to those observed by airborne SAR. Therefore, in principle, the proposed algorithm can be extended to spaceborne SAR data processing. However, due to the availability of spaceborne SAR raw data, this extended application has not yet been verified by field data.

Author Contributions

All authors have made some contributions to the article from different aspects. Conceptualization, J.C.; Investigation, Y.Z.; Software, Y.Z. and Y.X.; Writing—Original Draft Preparation, Y.Z.; Writing—Review and Editing, Y.Z., J.C. and Y.D. All authors have read and agreed to the published version of the manuscript.

Funding

This work was supported by the National Natural Science Foundation of China under Grant No. 62231024; the Strategic Priority Research Program of the Chinese Academy of Sciences under Grant XDA0370101; and the Open Fund Project of Key Laboratory of Ocean Observation Technology, MNR under Grant 2023klootA05.

Data Availability Statement

The original contributions presented in this study are included in the article. Further inquiries can be directed to the corresponding author.

Acknowledgments

The authors would also like to thank the reviewers for their constructive comments.

Conflicts of Interest

The authors declare no conflicts of interest.

References

  1. Li, K.; Li, H. Global SAR spectral analysis of intermediate ocean waves: Statistics and derived real aperture radar modulation. Remote Sens. 2025, 17, 1416. [Google Scholar] [CrossRef] [Scilit]
  2. Fan, S.; Zhang, B.; Kudryavtsev, V. Comprehensive assessment of ocean surface current retrievals using SAR doppler shift and drifting buoy observations. Remote Sens. 2025, 17, 2007. [Google Scholar] [CrossRef] [Scilit]
  3. Hu, F.; Xu, F.; Wang, R.; Qiu, X.; Ding, C.; Jin, Y. Conceptual study and performance analysis of Tandem multi-antenna spaceborne SAR interferometry. J. Remote Sens. 2024, 4, 0137. [Google Scholar] [CrossRef] [Scilit]
  4. Skolnick, M. Radar Handbook; Mc-Graw-Hill: New York, NY, USA, 2008. [Google Scholar]
  5. Li, J.; Zhang, M.; Fan, W.; Nie, D. Facet-based investigation on microwave backscattering from sea surface with breaking waves: Sea spikes and SAR imaging. IEEE Trans. Geosci. Remote Sens. 2017, 55, 2313–2325. [Google Scholar] [CrossRef] [Scilit]
  6. Barber, B.C. Remote sensing the sea surface using a multichannel ATI SAR: Imaging sea spikes. In Proceedings of the 2005 IEEE International Geoscience and Remote Sensing Symposium, Seoul, Republic of Korea, 25–29 July 2005; IEEE: Piscataway, NJ, USA, 2005; pp. 2676–2679. [Google Scholar]
  7. Melief, H.W.; Greidanus, H.; Van Genderen, P.; Hoogeboom, P. Analysis of sea spikes in radar sea clutter data. IEEE Trans. Geoence Remote Sens. 2006, 44, 985–993. [Google Scholar] [CrossRef]
  8. Greco, M.; Stinco, P.; Gini, F. Identification and analysis of sea radar clutter spikes. IET Radar Sonar Navig. 2010, 4, 239–250. [Google Scholar] [CrossRef] [Scilit]
  9. Sun, H.; Wan, X. Research on the sea spike suppression based on range domain characteristics of relatively high resolution radar. J. Phys. Conf. Ser. 2020, 1607, 012077. [Google Scholar] [CrossRef] [Scilit]
  10. Shi, Y.-L.; Shui, P.-L. Target detection in high-resolution sea clutter via block-adaptive clutter suppression. IET Radar Sonar Navig. 2011, 5, 48–57. [Google Scholar] [CrossRef] [Scilit]
  11. Shao, Z.; He, J.; Feng, S. Extraction of a target in sea clutter via signal decomposition. Sci. China Inf. Sci. 2020, 63, 129301. [Google Scholar] [CrossRef] [Scilit]
  12. Gu, T. Detection of small floating targets on the sea surface based on multi-features and principal component analysis. IEEE Geosci. Remote Sens. Lett. 2019, 17, 809–813. [Google Scholar] [CrossRef] [Scilit]
  13. Li, G.; Zhang, H.; Gao, Y.; Ma, B. Sea clutter suppression using smoothed Pseudo-Wigner–Ville distribution–singular value decomposition during sea spikes. Remote Sens. 2023, 15, 5360. [Google Scholar] [CrossRef] [Scilit]
  14. Zhao, Y.; Chong, J.; Li, Y.; Sun, K.; Yang, X. Sea spike suppression method based on optimum polarization ratio in airborne SAR images. Sensors 2021, 21, 3269. [Google Scholar] [CrossRef] [Scilit]
  15. Cumming, I.; Wong, F. Digital Processing of Synthetic Aperture Radar Data: Algorithms and Implementation; Artech House: Boston, MA, USA, 2005. [Google Scholar]
  16. Vachon, P.W.; Krogstad, H.E.; Paterson, J.S. Airborne and spaceborne synthetic aperture radar observations of ocean waves. Atmos.-Ocean 1994, 32, 83–112. [Google Scholar] [CrossRef] [Scilit]
  17. Hwang, P.A.; Toporkov, J.V.; Sletten, M.A.; Menk, S.P. Mapping surface currents and waves with interferometric synthetic aperture radar in coastal waters: Observations of wave breaking in swell-dominant conditions. J. Phys. Oceanogr. 2012, 43, 563–582. [Google Scholar] [CrossRef] [Scilit]
  18. Du, Y.; Yang, X.; Chen, K.-S.; Ma, W.; Li, Z. An improved spectrum model for sea surface radar backscattering at L-band. Remote Sens. 2017, 9, 776. [Google Scholar] [CrossRef] [Scilit]
  19. Lyzenga, D.R. Numerical simulation of synthetic aperture radar image spectra for ocean waves. IEEE Trans. Geosci. Remote Sens. 1986, GE-24, 863–872. [Google Scholar] [CrossRef] [Scilit]
  20. Lyden, J.D.; Hammond, R.R.; Lyzenga, D.R.; Shuchman, R.A. Synthetic aperture radar imaging of surface ship wakes. J. Geophys. Res. 1988, 93, 12293. [Google Scholar] [CrossRef] [Scilit]
  21. Kasilingam, D.P.; Shemdin, O.H. Theory for synthetic aperture radar imaging of the ocean surface: With application to the Tower Ocean Wave and Radar Dependence Experiment on focus, resolution, and wave height spectra. J. Geophys. Res. 1988, 93, 13837–13848. [Google Scholar] [CrossRef] [Scilit]
  22. Raney, R.K.; Vachon, P.W. Synthetic aperture radar imaging of ocean waves from an airborne platform: Focus and tracking issues. J. Geophys. Res. Oceans 1988, 93, 12475–12486. [Google Scholar] [CrossRef] [Scilit]
  23. Vachon, P.W.; Raney, R.K.; Emergy, W.J. A simulation for spaceborne SAR imagery of a distributed, moving scene. IEEE Trans. Geosci. Remote Sens. 1989, 27, 67–78. [Google Scholar] [CrossRef] [Scilit]
  24. Hayt, D.W.; Alpers, W.; Burning, C.; Dewitt, R.; Henyey, F.; Kasilingam, D.P.; Keller, W.C.; Lyzenga, D.R.; Plant, W.J.; Schult, R.L. Focusing simulations of synthetic aperture radar ocean images. J. Geophys. Res. Oceans 1990, 95, 16245–16261. [Google Scholar] [CrossRef] [Scilit]
  25. Kasilingam, D.P.; Hayt, D.W.; Shemdin, O.H. Focusing of synthetic aperture radar ocean images with long integration times. J. Geophys. Res. 1991, 96, 16935–16942. [Google Scholar] [CrossRef] [Scilit]
  26. Jain, A.; Shemdin, O. L band SAR ocean wave observations during MARSEN. J. Geophys. Res. Oceans 1983, 88, 9792–9808. [Google Scholar] [CrossRef] [Scilit]
  27. Shen, P.; Wang, C.; Fu, H.; Zhu, J.; Hu, J. Estimation of equivalent number of looks in time-series Pol(In)SAR data. Remote Sens. 2020, 12, 2715. [Google Scholar] [CrossRef] [Scilit]
  28. Gómez, L.; Cardona-Mesa, A.A.; Vásquez-Salazar, R.D.; Travieso-González, C.M. Analysis of despeckling filters using ratio images and divergence measurement. Remote Sens. 2024, 16, 2893. [Google Scholar] [CrossRef] [Scilit]
Figure 1. Flow chart of the proposed algorithm.
Remotesensing 18 00397 g001
Figure 2. Schematic diagram of SAR observation of ocean waves.
Remotesensing 18 00397 g002
Figure 3. Statistical distribution of short-time Fourier spectral energy between SAR data with sea spikes and data without sea spikes.
Remotesensing 18 00397 g003
Figure 4. Case 1: The SAR image obtained by the omega-k imaging algorithm.
Remotesensing 18 00397 g004
Figure 5. Case 1: The SAR image obtained by the proposed algorithm.
Remotesensing 18 00397 g005
Figure 6. Case 1: Comparison of the wave spectrums between the SAR images obtained by the omega-k imaging algorithm and the proposed algorithm. (a) The spectrum of the SAR image obtained by the omega-k imaging algorithm. (b) The spectrum of the SAR image obtained by the proposed algorithm.
Remotesensing 18 00397 g006
Figure 7. Case 2: The SAR image obtained by the omega-k imaging algorithm.
Remotesensing 18 00397 g007
Figure 8. Case 2: The SAR image obtained by the proposed algorithm.
Remotesensing 18 00397 g008
Figure 9. Case 2: Comparison of wave spectrums between the SAR images obtained by the omega-k imaging algorithm and the proposed algorithm. (a) The spectrum of the SAR image obtained by the omega-k imaging algorithm. (b) The spectrum of the SAR image obtained by the proposed algorithm.
Remotesensing 18 00397 g009
Figure 10. Case 3: The SAR image obtained by the omega-k imaging algorithm.
Remotesensing 18 00397 g010
Figure 11. Case 3: The SAR image obtained by the proposed algorithm.
Remotesensing 18 00397 g011
Figure 12. Case 3: Comparison of the wave spectrums between the SAR images obtained by the omega-k imaging algorithm and the proposed algorithm. (a) The spectrum of the SAR image obtained by the omega-k imaging algorithm. (b) The spectrum of the SAR image obtained by the proposed algorithm.
Remotesensing 18 00397 g012
Table 1. Parameters of the X-band SAR system.
Parametric NameParametric SymbolParametric Value
Radar wavelength (m) λ 0.0313
Pulse length (us) T r 6
Radar bandwidth (MHz) B r 606
Platform speed (m/s) V 74.65
PRF (Hz) P R F 2000
Near range (m) R n e a r 4300
PolarizationPolHH
Table 2. Parameters of the C-band SAR system.
Parametric NameParametric SymbolParametric Value
Radar wavelength (m) λ 0.0556
Pulse length (us) T r 40
Radar bandwidth (MHz) B r 450
Platform speed (m/s) V 75
PRF (Hz) P R F 2500
Near range (m) R n e a r 5000
PolarizationPolHH
Table 3. For the data of completely invisible waves and the data of weakly visible waves, the comparison of PBR, STD and ENL between the SAR images obtained by the omega-k imaging algorithm and the SAR images obtained by the proposed algorithm.
Case NameOmega-k Imaging AlgorithmProposed Algorithm
PBRCase 14.424.90
Case 24.224.79
Case 34.334.64
STDCase 10.450.31
Case 20.390.31
Case 30.330.32
ENLCase 10.350.47
Case 20.420.49
Case 30.340.38
Disclaimer/Publisher’s Note: The statements, opinions and data contained in all publications are solely those of the individual author(s) and contributor(s) and not of MDPI and/or the editor(s). MDPI and/or the editor(s) disclaim responsibility for any injury to people or property resulting from any ideas, methods, instructions or products referred to in the content.