Highlights
What are the main findings?
- Evaluation of twelve satellite XCO2 products, encompassing nearly all publicly available datasets, reveals significant variations in uncertainty across global, latitudinal, and seasonal scales. Newer products have yet to demonstrate a distinct performance advantage. Although the ensemble product enhances overall accuracy, it retains biases inherent to its constituent datasets.
- We recommend appropriate XCO2 products for applications across diverse spatiotemporal contexts.
What are the implications of the main findings?
- Climate and sustainability research require the evidence-based selection of satellite XCO2 products.
- The development of future ensemble products must address biases inherited from constituent datasets to ensure more robust data fusion.
Abstract
Accurate monitoring of atmospheric carbon dioxide (CO2) is critical for addressing climate change, as CO2 is one of the dominant greenhouse gases. Satellite remote sensing remains the primary method for monitoring column-averaged CO2 (XCO2), yet different satellite missions and retrieval algorithms generate distinct XCO2 products. Thus, recommendations for selecting appropriate XCO2 products remain unclear due to a lack of systematic evaluation of XCO2 products. Here, we present a comprehensive evaluation of eleven XCO2 products from major satellite missions—including the Environmental Satellite (Envisat), Greenhouse Gases Observing Satellite (GOSAT/GOSAT-2), Orbiting Carbon Observatories (OCO-2/OCO-3), and TanSat—alongside one ensemble product based on the ensemble median algorithm (EMMA). We assess their spatiotemporal coverage and performance using Total Carbon Column Observing Network (TCCON) measurements as reference, evaluating both at global and regional scales across seasons. Our results reveal distinct latitudinal and seasonal variations in the evaluation results. Most products show the highest accuracy at 60–80°N in summer (optimal root mean square error < 1.0 ppm), while the largest uncertainties appear in the tropics (20°S–20°N; root mean square error > 2 ppm). Furthermore, systematic biases are most pronounced during winter, with mean absolute error increasing by 0.3–1.0 ppm compared to other seasons. Among the twelve satellite XCO2 products, the Atmospheric CO2 Observations from Space-Orbiting Carbon Observatory-2 (ACOS-OCO-2) product shows the best overall performance globally. These results provide practical guidelines for the informed selection and application of satellite-derived XCO2 products in climate research.
1. Introduction
Atmospheric carbon dioxide (CO2) levels have risen dramatically since pre-industrial times, driving global temperatures to record highs and intensifying extreme weather events [1,2]. Thus, precise monitoring of atmospheric CO2 is critical for climate research and mitigation.
Atmospheric CO2 monitoring, focusing on CO2 column concentration (XCO2), includes ground-based, aircraft-based, and satellite-based remote sensing methods [3]. Ground-based remote sensing delivers high-accuracy data, exemplified by the Total Carbon Column Observing Network (TCCON) established in 2004. While TCCON provides valuable long-term records [4,5], its sparse station limits detailed regional analysis [6]. Aircraft-based remote sensing provides accurate and extensive XCO2 profiles but is costly and challenging for sustained monitoring [7,8,9]. Satellite-based remote sensing has become the primary method for monitoring global XCO2 levels, thanks to its ability to provide near-global observational coverage [4,5,10,11]. Satellite-based XCO2 monitoring was pioneered by the European Space Agency’s (ESA) Envisat satellite in 2002, with a spatial resolution of 30 × 60 km [12]. The observational capabilities advanced significantly with the launch of Japan’s Greenhouse Gases Observing Satellite (GOSAT) in 2009 and GOSAT-2 in 2018, which achieved approximately 10 km resolution [13,14]. A substantial breakthrough occurred with NASA’s Orbiting Carbon Observatory-2 (OCO-2) in 2014 and OCO-3 in 2019, which enhanced resolutions to 2.25 × 1.29 km [15,16]. China’s TanSat in 2016 further improved this to 2 × 2 km [17]. Upcoming satellites, such as ESA’s CO2M constellation and China’s TanSat-2, aim to further enhance XCO2 monitoring capabilities [18,19].
Evaluation of satellite XCO2 products reveals substantial variations in performance relative to ground-based measurements, primarily due to differences in instrument designs [20], retrieval algorithms [21], calibration protocols [22], atmospheric conditions [23], and terrain features [24,25]. Spatially, differences in satellite XCO2 products at the continental scale are notable [26,27,28,29,30,31,32,33,34]. For example, in East Asia, the National Institute for Environmental Studies (NIES)-GOSAT-2 product (product naming rule: [algorithm]-[satellite]) demonstrates poorer performance than the Atmospheric Carbon Observations from Space (ACOS)-OCO-2 product, with a lower coefficient of determination (R2: 0.77 vs. 0.94) and a higher mean absolute error (MAE: 3.28 ppm vs. 1.24 ppm) due to uncorrected biases [34]. Latitudinal gradients also influence product accuracy, where the ACOS-OCO-2 product outperforms the GOSAT satellite products at 60–70°N (R2: 0.985 vs. 0.809), due to enhanced spatial resolution and sampling density [28]. Hemispheric contrasts are similarly pronounced, as demonstrated by the mean biases of the ACOS-OCO-2 product −0.12 ppm and 0.1 ppm in the Northern Hemisphere (NH) and Southern Hemisphere (SH) during summer, respectively [33]. Temporally, seasonal variations can significantly affect the accuracy of satellite XCO2 products [33,35,36,37,38,39,40,41,42,43]. In Hefei, China, the monthly mean bias of the ACOS-GOSAT product is 0.6 ppm during winter and −0.6 ppm during summer [43]. Also, the University of Leicester full-physics (OCFP)-TanSat product overestimates by 1.5 ppm in spring and underestimates by 0.8 ppm in autumn in the NH [33]. Overall, the evaluation of satellite XCO2 products is influenced by geographic location and season, requiring careful product selection for regional and temporal analyses.
Despite the urgent need for guidance on selecting satellite XCO2 products tailored to specific spatiotemporal contexts, existing evaluations remain limited. Previous work has focused on a narrow set of satellite products at regional scales or compared multiple satellite products without validation against ground-based measurements. Consequently, the selection of appropriate XCO2 products at a global scale remains highly uncertain. To address this gap, we present a comprehensive global evaluation of eleven satellite XCO2 products and one ensemble product, encompassing nearly all available datasets derived from diverse satellites and retrieval algorithms. We assess their spatiotemporal coverage and performance using TCCON measurements as reference, evaluating both at global and regional scales across seasons. To date, this evaluation offers the most complete product coverage and the longest temporal span. We aim to provide guidelines for selecting XCO2 products across various spatiotemporal contexts. We also highlight current product limitations to inform future algorithm and satellite development.
2. Data
2.1. TCCON
TCCON is a global network of ground-based Fourier transform infrared spectrometers for observing column-averaged concentrations of greenhouse gases, and its data are widely regarded as the ground truth. It was established in 2004 and now includes 31 stations across various climatic and geographic regions [44,45]. The network provides continuous, high-precision measurements of column-averaged concentrations of greenhouse gases such as XCO2. Each TCCON station uses either a Bruker IFS 125HR or 120HR spectrometer. These instruments record high-resolution absorption spectra of direct solar radiation in the near-infrared range. This allows accurate retrieval of gas column abundances. With rigorous calibration and high spectral resolution, TCCON achieves a measurement accuracy of 0.25% [44]. As a result, it serves as the gold standard for XCO2 observation and validation. TCCON stations process data using Goddard’s GGG software. The latest version, GGG2020, was released in 2022. This study uses data processed from GGG2020 across 31 TCCON stations (Figure 1 and Figure S1; Table S1).
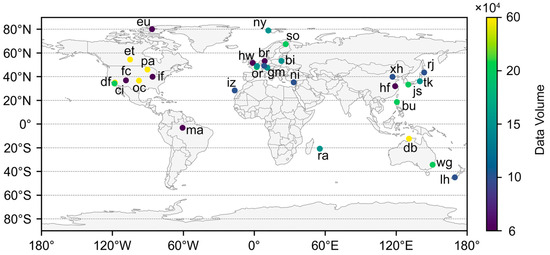
Figure 1.
Location of TCCON stations. Colour shading denotes the available count of valid observational data at each station during this study (Table S1). The globe is divided into 20-degree latitude bands for subsequent analysis.
2.2. Satellite XCO2 Products
Eleven individual satellite XCO2 products are evaluated in this study (product naming rule: [algorithm]-[satellite]): Bremen Optimal Estimation DOAS (BESD)-Envisat, Weighting Function Modified DOAS (WFMD)-Envisat, NIES-GOSAT, ACOS-GOSAT, OCFP-GOSAT, RemoTeC Full Physics (SRFP)-GOSAT, NIES-GOSAT-2, ACOS-GOSAT-2, ACOS-OCO-2, ACOS-OCO-3, and OCFP-TanSat. In addition, the EMMA-Ensemble product is also included in the evaluation. Detailed satellite and product information is summarized in Table 1 and Table 2.

Table 1.
Summary of satellite information.
Table 2.
Summary of Satellite XCO2 products.
2.2.1. Envisat Satellite XCO2 Products
The Envisat satellite provides Earth observation and climate monitoring data. It operates in a sun-synchronous orbit at an altitude of approximately 790 km. The SCanning Imaging Absorption spectroMeter for Atmospheric CartograpHY (SCIAMACHY) instrument onboard measures reflected sunlight over a broad spectral range from 214 to 2380 nm.
The XCO2 products generated from the Envisat satellite use two primary retrieval algorithms. Developed by the University of Bremen, the BESD algorithm is a full-physics retrieval algorithm. Through explicit aerosol modeling, it corrects aerosol-induced scattering errors below 4 ppm [46]. The WFMD algorithm employs pre-calculated weighting functions for CO2 and O2 A-band absorption, enabling computationally efficient retrievals. The WFMD algorithm implements rigorous quality control through polarization-based cloud filtering and strict detector anomaly management, attaining a single-measurement precision of approximately 6 ppm [47]. While the BESD algorithm shows better performance, the WFMD algorithm provides improved computational efficiency for long-term analyses.
2.2.2. GOSAT Series Satellite XCO2 Products
Japan’s GOSAT satellite monitors global greenhouse gases, including XCO2. The onboard instruments include the Thermal And Near-infrared Sensor for carbon Observation-Fourier Transform Spectrometer (TANSO-FTS), which measures reflected solar radiance in three shortwave infrared bands and one thermal infrared band. Accompanying this is the Thermal And Near-infrared Sensor for carbon Observation-Cloud and Aerosol Imager (TANSO-CAI), which provides multispectral imagery for cloud/aerosol detection, critical for correcting atmospheric scattering in TANSO-FTS data [48]. Multiple retrieval algorithms are applied [49,50,51,52] (Table 2), which employ radiative transfer models with aerosol correction, rigorous cloud screening, and bias adjustments.
The successor GOSAT-2 satellite carries upgraded TANSO-FTS-2 and TANSO-CAI-2 instruments with enhanced measurement capabilities [53]. Specifically, TANSO-CAI-2 introduces simultaneous forward and backward 20° viewing, while TANSO-FTS-2 expands spectral coverage with additional bands. These upgrades significantly enhance data volume and refine the atmospheric retrieval characteristics. The satellite has two core products: NIES-GOSAT-2 and SRFP-GOSAT-2 [54,55]. Note that the NIES-GOSAT-2 product is bias-uncorrected [56] and the SRFP-GOSAT-2 product utilizes a shortened retrieval window for the O2 A-band to mitigate the spectral irregularities [53]. These may affect their performance compared to the GOSAT-based products.
2.2.3. OCO Series Satellite XCO2 Products
NASA’s OCO-2 satellite measures XCO2 using three co-aligned grating spectrometers capturing high-resolution radiances in CO2 absorption bands [57]. It cycles through nadir (vertical viewing), glint (sun-glint optimization), and target (site-specific sampling) observation modes to optimize coverage and quality.
Deployed from the International Space Station (ISS), OCO-3 operates in an orbit of 408 km at an inclination of 51.6°, enabling unique diurnal sampling across ±52° latitude [15]. The OCO-3 satellite is equipped with an optical instrument called the Pointing Mirror Assembly (PMA), which facilitates the Snapshot Area Mapping mode for targeted regional studies [58].
The ACOS algorithm is used for both the OCO-2 and OCO-3 satellites. The ACOS algorithm employs a full-physics optimal estimation approach, simultaneously retrieving XCO2 concentrations and auxiliary atmospheric parameters through spectral fitting of observed radiances. This process incorporates multilayer cloud screening, aerosol correction modules, and post-hoc empirical bias adjustments to meet ≤1 ppm accuracy requirements [10,23,49]. For the OCO-3 satellite, the ACOS algorithm requires additional calibration to account for its unique orbital configuration.
2.2.4. TanSat Satellite XCO2 Product
China’s TanSat satellite measures XCO2 concentrations from a 712 km sun-synchronous orbit. The TanSat satellite hosts two complementary instruments. The primary instrument is the Atmospheric Carbon Dioxide Grating Spectrometer (ACGS), which is very similar to the spectrometer on the OCO-2 satellite. Another instrument is the Cloud and Aerosol Polarimetric Imager (CAPI), which provides polarization-sensitive images to improve the inversion accuracy by reducing aerosol-related biases [59].
Derived using the OCFP algorithm, the TanSat product features a robust physical retrieval framework. Its core advantage lies in coupling the Linearized Discrete Ordinates Radiative Transfer (LIDORT) with a Two-Orders-of-Scattering (2OS) model, a hybrid approach that effectively accounts for multiple scattering and polarization caused by atmospheric aerosols. To further ensure data quality, the algorithm constrains the retrieval using Copernicus Atmosphere Monitoring Service (CAMS) aerosol fields as a priori profiles and mitigates errors through multiple linear regression bias correction.
2.2.5. EMMA-Ensemble XCO2 Product
The EMMA-Ensemble XCO2 product is a multi-satellite fusion product developed by the University of Bremen. It operates under the Copernicus Climate Change Service greenhouse gas monitoring program. It integrates eleven Level 2 retrieval products from the Envisat satellite, the GOSAT satellite, the GOSAT-2 satellite, and the OCO-2 satellite [60]. The EMMA algorithm determines the value for a grid box by identifying the median from the available individual input products [61]. As the only fusion product developed and authorized by multiple research institutions, the EMMA-Ensemble product achieves consistent long-term XCO2 reconstruction across satellite platforms.
3. Methods
3.1. Evaluation Metrics
Three statistical metrics are selected to evaluate satellite XCO2 products against TCCON measurements: R2, root mean square error (RMSE), and MAE. (1) R2 quantifies the proportion of variance in TCCON measurements explained by satellite products, indicating the strength of the linear relationship (Equation (1)); (2) RMSE identifies high bias by squaring the differences (Equation (2)); (3) MAE provides robust measurements of average bias magnitude (Equation (3)). The statistical metrics are presented as follows:
where and denote the retrieved XCO2 concentrations from satellites and TCCON measurements at the -th matched observation, respectively; and represent their respective means; and indicates the number of valid matched data. Only quality-filtered data (xco2_quality_flag = 0) is used from each product.
We further characterize the bias through the scatter plots generated from the matched data pairs. The bias direction is interpreted relative to the 1:1 identity line: data clusters distributed above the line indicate overestimation, while those falling below the line indicate underestimation.
3.2. Spatiotemporal Matching Between Satellite and TCCON Measurements
Accurate evaluation of satellite XCO2 products requires careful spatiotemporal matching with TCCON measurements. Building on established approaches [11,43], we implement a systematic sensitivity test of collocation criteria across spatial and temporal matching windows. The spatial matching window is defined using the Chebyshev distance (also known as chessboard distance), where the tested Chebyshev distance ranges from 1.0° to 5.0° in 0.5° increments. Tested temporal matching windows range from ±0.5 h to ±2.0 h in 0.5 h increments. We finally adopt a spatial matching window of 1.5° Chebyshev distance and a temporal matching window of ±1 h as the collocation criteria, as this configuration yields the highest agreement (high R2, low RMSE/MAE) for most products (Figure S3). Although a smaller spatial matching window could slightly reduce global evaluation bias for the high-resolution ACOS-OCO-2 and ACOS-OCO-3 products, it increases bias in most latitudinal evaluations (Table S2). Therefore, considering all factors, a spatial matching window of 1.5° Chebyshev distance remains the best choice for this study.
3.3. Deriving Ensemble Mean Distribution
To quantify inter-product deviations in global distributions, a multi-product ensemble mean distribution, computed as the average of all available products, is established as the reference. Due to the varying operational periods of the satellites, we select three distinct analysis periods that maximize product coverage (Figure S2): March 2011 to February 2012 (BESD-Envisat, WFMD-Envisat, ACOS-GOSAT, NIES-GOSAT, OCFP-GOSAT, SRFP-GOSAT, and EMMA-Ensemble products), March 2017 to February 2018 (ACOS-GOSAT, NIES-GOSAT, OCFP-GOSAT, SRFP-GOSAT, ACOS-OCO-2, OCFP-TanSat, and EMMA-Ensemble products), and March 2020 to February 2021 (NIES-GOSAT-2, SRFP-GOSAT-2, ACOS-OCO-2, ACOS-OCO-3, and EMMA-Ensemble products).
For each period, we implement the following steps. First, for each product, all available data points are re-gridded to a common 1° × 1° spatial resolution. Annual and seasonal ensemble mean fields (Spring: March–May, Summer: June–August, Autumn: September–November, Winter: December–February) are then computed based on these gridded data. Finally, we derive deviations by comparing each product relative to the ensemble mean fields.
4. Results
4.1. Spatiotemporal Coverage Analysis
The products from the OCO satellites have the highest overall data availability, providing about 100 times more observations compared to the most sparsely covered products from the GOSAT satellites (Figure 2; see comparison of ‘Data volume’ in Table S3). However, other products can also have decent data availability under certain spatiotemporal conditions.
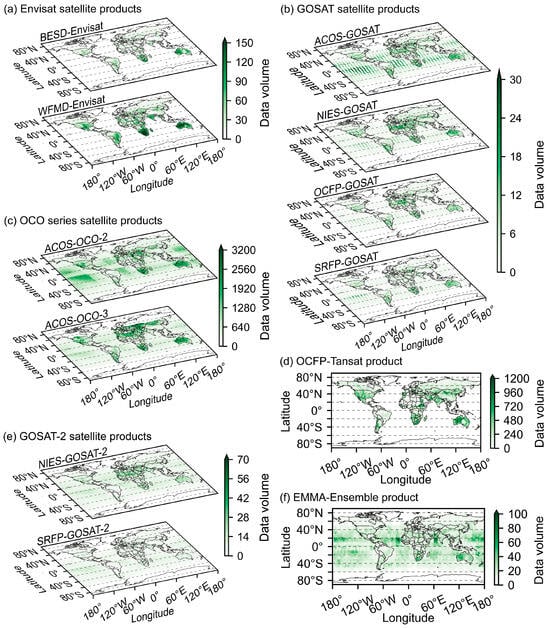
Figure 2.
Monthly average number of valid XCO2 observation data per 3° × 3° grid.
The OCFP-TanSat product provides consistent coverage in high-latitude regions (60–80°N) from February to September (Figure S4), while most other products have limited data availability due to observation constraints (Figure 2). These products mainly record data in summer (Figure S5) when longer daylight hours, stable weather, and less cloud cover improve retrieval conditions [62]. The ACOS-OCO-3 product lacks data coverage in high-latitude regions due to the orbital inclination of the OCO-3 satellite, which is approximately 51.6° [15], rendering it unable to cover these areas.
In mid-latitude regions, data coverage varies significantly, primarily limited by cloud patterns [63] (Text S1, Figure S6). In Western China (20–40°N), the OCFP-TanSat and EMMA-Ensemble products achieve robust coverage (70% and 80% valid coverage, respectively) (Figure 2), with the latter benefiting from multi-source integration to fill gaps. Northern India experiences a seasonal contrast in data coverage, with 80% of data acquired during the winter season (Figure S5), corresponding to the period of minimal cloud cover during the monsoon-free season (Figure S6). Similarly, North Africa contributes 60–70% of land data for products from the GOSAT satellites at 20–40°N (Figure 2), predominantly from autumn and winter (Figure S4), whereas the OCFP-TanSat product coverage here is nearly negligible except for autumn (~10%). The SH mid-latitudes (20–40°S) exhibit higher data availability, particularly over South Africa and Australia (~70% coverage, mostly from summer observations). The WFMD-Envisat, ACOS-OCO-2, and ACOS-OCO-3 products excel in these regions, reaching ~90% coverage (Figure S5). In contrast, frequent heavy rainfall in South America is associated with extensive cloud cover and strong water vapor absorption, which severely affect observations for the ACOS-OCO-2, NIES-GOSAT-2, and SRFP-GOSAT-2 products. (Figure 2 and Figure S6). Among the limited available data in South America, approximately 50% originates from land areas within 20–40°S during June to August (Figures S4 and S5).
In Equatorial regions, signal attenuation from thick convective clouds severely limits data availability, particularly in Southeast Asia and southern India [64] (Figure 2 and Figure S6). However, drier winter conditions facilitate improved coverage for the OCFP-TanSat and WFMD-Envisat products (Figure 2, Figure S5 and S6). Notably, the EMMA-Ensemble product exhibits a fourfold data increase in January (0–20°N) (Figure S4), driven by oceanic observations (~80% of the data) inherited from the glint-mode capabilities of the ACOS-OCO-2 and ACOS-GOSAT products [65] (Figure 2 and Figure S4).
4.2. Evaluation Against Global TCCON Stations
In addition to the coverage analysis, this section evaluates XCO2 satellite products using all available TCCON observations globally. Globally, the ACOS-OCO-2 product demonstrates the best performance, while other products exhibit variable accuracy across regions and seasons.
Among Envisat products, the BESD-Envisat product demonstrates significantly better performance than the WFMD-Envisat product. The WFMD-Envisat product exhibits systematic underestimation (MAE: 2.31 ppm; Table S3), which is most prominent in winter (MAE: 2.67 ppm; Table S3). It also shows an RMSE of 3.00 ppm driven primarily by summer biases at 40–60°N (RMSE: 2.74 ppm) and winter biases at 40–60°S (RMSE: 3.47 ppm; Figure 3 and Figure S7). Additionally, the WFMD-Envisat product shows a weaker correlation (R2: 0.72) with TCCON data. While computationally efficient, the WFMD algorithm relies on unconstrained linear least-squares fitting with predefined atmospheric profiles, which may introduce large errors under complex atmospheric conditions. In contrast, the BESD-Envisat product achieves substantially lower MAE (1.55 ppm) and RMSE (1.98 ppm), although it still exhibits overestimation at 40–60°S during spring and winter (Figure S7).
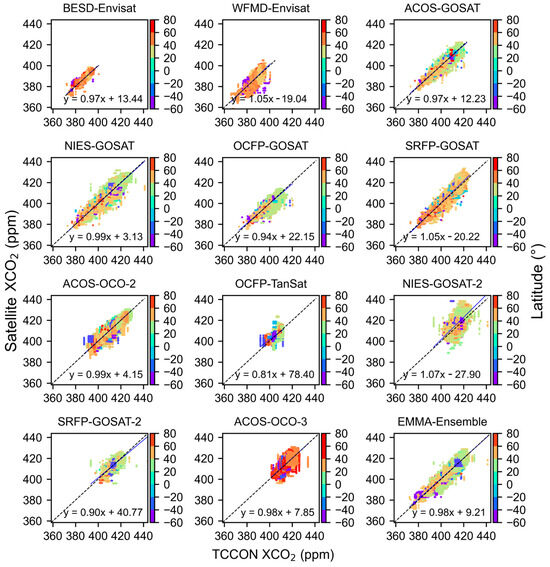
Figure 3.
Comparison of satellite XCO2 products with TCCON observations. Data points are color-coded by latitude. The black dashed line indicates the 1:1 reference, while the blue solid line represents the best-fit linear regression.
Among the six GOSAT satellite products, the ACOS-GOSAT product demonstrates the best performance. The GOSAT-based products generally outperform the GOSAT-2-based products, primarily because the NIES-GOSAT-2 product is bias-uncorrected [56] while the SRFP-GOSAT-2 product has a shortened retrieval window [53]. Although the NIES-GOSAT product shows a marginally higher R2 than the ACOS-GOSAT product (0.92 vs. 0.91), it displays larger MAE and RMSE values (Table S3) and systematically underestimates by up to 4 ppm (Figure S8). In contrast, the OCFP-GOSAT product and the SRFP-GOSAT product show markedly poorer performance. The SRFP-GOSAT product (MAE: 2.79 ppm) overestimates at 20–60°N (Figure 3), and the OCFP-GOSAT product systematically underestimates at 20–40°N, while showing the largest underestimation biases in autumn at 40–60°S (Figure S7). The NIES-GOSAT-2 product performs the worst among all products, with the highest MAE (2.66 ppm) and RMSE (3.53 ppm) (Table S3). Many data points show significant bias from observations, with maximum biases reaching nearly 20 ppm at 20–60°N during spring and autumn, and similar biases observed in the 20–40°S region during winter. This product also shows persistent seasonal overestimation (up to 4 ppm in summer/autumn; Figure S8) and the weakest correlation with observations (R2: 0.61).
The ACOS-OCO-2 product exhibits superior performance among all evaluated products, achieving exceptional agreement with observations (R2: 0.96) along with the lowest MAE and RMSE values (RMSE: 1.35 ppm, MAE: 1.03 ppm; Table S3). In contrast, the ACOS-OCO-3 product shows increased overall bias and a higher frequency of larger biases (RMSE: 1.58 ppm, MAE: 1.20 ppm), particularly evident during winter (RMSE: 1.81 ppm, MAE: 1.36 ppm; Figure 3 and Figure S7). The ACOS-OCO-3 product tends to overestimate during the first few months, but then it underestimates in the following months (Figure S8). Given that the OCO-2 and OCO-3 satellites both employ the ACOS algorithm, the observed performance disparity is likely attributable to the orbital constraints of the ISS. In contrast to OCO-2′s stable sun-synchronous orbit, the ISS follows a precessing orbit. This induces highly variable viewing geometries and solar illumination, resulting in significantly higher retrieval uncertainty [15].
The OCFP-TanSat product, derived from only 1.5 years of observations, shows moderate performance, with an R2 of 0.64. High biases occur at 20–40°N and 0–40°S, resulting in an RMSE of 1.91 ppm. The pronounced biases over 0–20°S may be attributed to the product’s limited data available in equatorial regions, particularly over central Africa.
The evaluation of the EMMA-Ensemble product reveals existing challenges in the data fusion process. Although the fused product successfully reduces overall MAE and improves data consistency, it also leads to an increased RMSE due to the influence of the source data, particularly at 20–40°N (R2: 0.95, RMSE: 1.78 ppm, MEA: 1.32 ppm). These results suggest that although data fusion improves overall accuracy, inherited errors from the source data can significantly impact its performance in specific regions.
4.3. Evaluation Against TCCON Stations by Latitude
Extending the global evaluation, this section further evaluates XCO2 satellite products across different latitude bands. Higher accuracy is generally observed in high latitudes (60–80°N) compared to mid- and low-latitudes, where larger biases (both overestimation and underestimation) are more prevalent (Figure 4 and Figure S9).
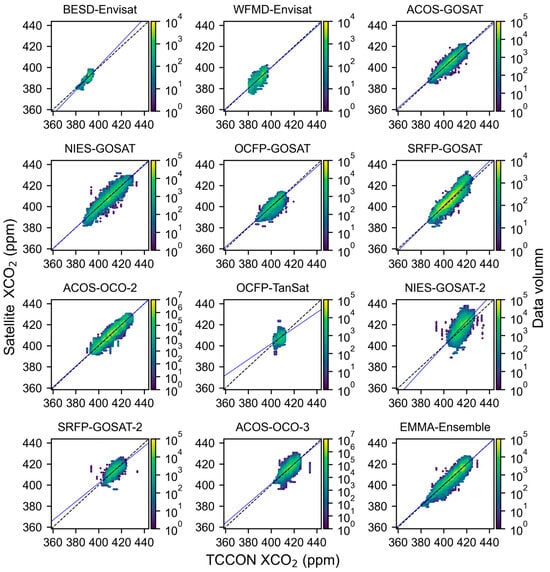
Figure 4.
Comparison of satellite XCO2 products with TCCON observations in the 20–40°N latitude band. The color gradient indicates data density. The black dashed line is the 1:1 reference, and the blue solid line shows the best-fit linear regression. See Figure S9 for other latitude bands and Figure S11 for station-specific evaluations to identify bias sources.
At high latitudes (60–80°N), most products achieve the highest accuracy in summer. However, the NIES-GOSAT-2 and WFMD-Envisat products exhibit significant systematic overestimation (Figure S10). This bias is driven entirely by comparisons at the so station in Finland (RMSE: 2.86 ppm and 3.01 ppm, MAE: 2.28 ppm and 2.46 ppm; Figure S11) as it is the only station in this latitude zone with matching data (Table S4). Although the ACOS-OCO-2 product demonstrates the highest overall accuracy (R2: 0.98, RMSE: 0.99 ppm, MAE: 0.72 ppm), the OCFP-TanSat product significantly outperforms ACOS-OCO-2 at the eu station (R2: 0.80 vs. 0.64, RMSE: 0.70 ppm vs. 1.95 ppm, MAE: 0.49 ppm vs. 1.51 ppm; Figure S11).
Between 40–60°N, GOSAT satellite products occasionally exhibit biases exceeding 10 ppm, with particularly pronounced biases in the NIES-GOSAT and OCFP-GOSAT products (RMSE: 2.62 ppm and 1.77 ppm, MAE: 1.96 ppm and 1.35 ppm; Figure S9). Most of these biases are attributable to the pa station in autumn (RMSE: 2.59 ppm and 1.87 ppm, MAE: 1.85 ppm and 1.44 ppm; Figure S11), some of which are introduced into the EMMA-Ensemble product (Figure 5). Additionally, the ACOS-OCO-3 product shows a notable global negative bias within the 40–60°N latitude band (RMSE: 1.64 ppm, MAE: 1.25 ppm; Figure S9), primarily driven by the hw station in summer (RMSE: 1.20 ppm, MAE: 0.89 ppm; Figure S11).
Figure 5.
Comparison of EMMA-Ensemble XCO2 product with TCCON observations. Selected bias sources are provided. The black dashed line indicates the 1:1 reference, while the blue solid line represents the best-fit linear regression. Data points are color-coded by latitude.
In the 20–40°N latitude band, the NIES-GOSAT-2 product exhibits significant biases (RMSE: 3.48 ppm, MAE: 2.62 ppm; Figure 4). Positive biases primarily stem from the df and xh stations in autumn (RMSE: 3.05 ppm and 3.38 ppm, MAE: 2.32 ppm and 2.65 ppm; Figure S11). In contrast, negative biases largely arise from the iz station in summer (RMSE: 4.93 ppm, MAE: 3.13 ppm; Figure S11). Notably, the EMMA-Ensemble product exhibits a distinct negative bias within 20–40°N, displaying the highest RMSE and MAE among all latitude bands (RMSE: 2.13 ppm, MAE: 1.62 ppm; Figure 4). This bias is primarily driven by contributions from the OCFP-GOSAT and SRFP-GOSAT products at the ci station (RMSE: 2.25 ppm and 2.95 ppm, MAE: 1.63 ppm and 2.38 ppm) and the df station (RMSE: 2.18 ppm and 3.04 ppm, MAE: 1.59 ppm and 2.46 ppm; Figure S11 and Figure 5). While the EMMA-Ensemble product effectively reduces overall bias, it also inherits uncertainties from its input satellite products.
Most satellite products face big challenges in coastal Southeast Asia and Australia (20°S–20°N) due to complex cloud structures [66], high aerosol loading [67], and spatially heterogeneous land cover [68]. Among the evaluated products, the ACOS-OCO-2 and ACOS-OCO-3 products demonstrate the best performance (R2: 0.92 and 0.89, RMSE: 1.08 ppm and 1.23 ppm, MAE: 0.83 ppm and 0.89 ppm). In contrast, GOSAT-based satellite products and the EMMA-Ensemble product exhibit the lowest R2 values in this latitude band (0.52–0.78; Table S4). This performance disparity is likely attributed to the higher spatial resolution of the OCO satellites, which minimizes sub-pixel cloud contamination and thereby mitigates retrieval errors caused by residual cloud scattering.
Across SH mid-latitudes (20–60°S), all satellite products demonstrate slightly reduced performance compared to NH 20–60°N. This is likely due to challenging atmospheric conditions, including high water vapor content [35] and low surface reflectivity [69] over oceanic and coastal areas (e.g., ra and lh stations). In the 20–40°S band, the ACOS-GOSAT and ACOS-OCO-2 products perform the best (R2: 0.92 and 0.95; RMSE: 1.53 ppm and 1.31 ppm; MAE: 1.15 ppm and 0.91 ppm; Figure S9). For the 40–60°S analysis, all data come from the lh station in New Zealand, with the ACOS-OCO-2 and EMMA-Ensemble products performing the best here (R2: 0.97 and 0.94, RMSE: 1.05 ppm and 1.51 ppm, MAE: 0.82 ppm and 1.12 ppm; Figure S11). Notably, the BESD-Envisat and WFMD-Envisat products have limited data availability and poor correlation (R2: 0.16 and 0.08), with the WFMD-Envisat product showing particularly severe underestimation biases up to 10 ppm (RMSE: 3.21 ppm, MAE: 2.57 ppm; Figures S10 and S11).
4.4. Intercomparison of Global Distributions
The global mean deviations of each product relative to the ensemble mean (Section 3.3) are compared to characterize their spatiotemporal distribution patterns across regions and seasons.
The two Envisat satellite products exhibit spatially anti-correlated bias patterns, with regions showing positive deviations in one product typically corresponding to negative deviations in the other (Figure 6). Latitudinal analysis reveals pronounced contrasts: during summer at high latitudes (60–80°N), the BESD-Envisat product shows deviations of up to +6 ppm, while the WFMD-Envisat product displays comparable negative values (−6 ppm, Figure S12). The WFMD-Envisat product exhibits particularly variable performance, with deviations ranging from −6 ppm in tropical Central Africa (0–20°N) to +3–5 ppm across temperate Asia (40–60°N). Seasonal analysis further highlights this variability, with positive deviations predominantly occurring in spring and strong negative deviations peaking in summer and autumn (Figure S12).
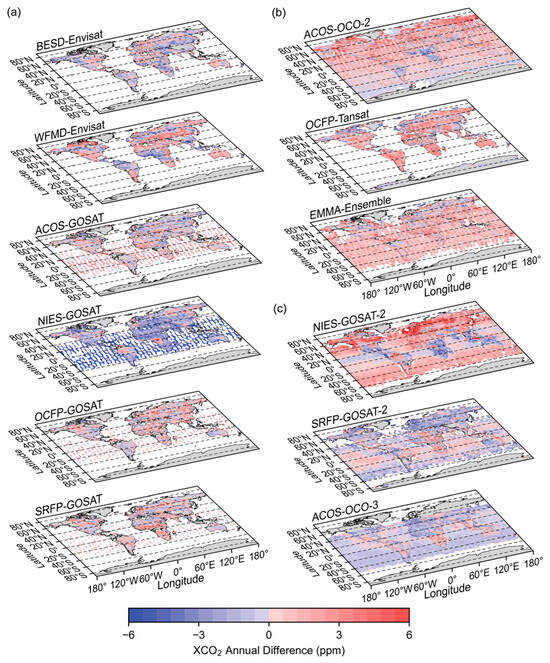
Figure 6.
Mean deviations of satellite XCO2 products relative to the ensemble mean of all products during: (a) March 2011–February 2012, (b) March 2017–February 2018, (c) March 2020–February 2021.
Among the GOSAT series satellite products, the ACOS-GOSAT product exhibits consistently small global deviations, remaining within ±1.8 ppm across all seasons (Figure 6 and Figure S13). In contrast, the NIES-GOSAT product shows negative deviations typically within −3 ppm across all seasons, except for springtime positive deviation of +6 ppm over South America and Central Africa (0–20°S, Figure S12). Most other GOSAT series products show moderate deviations within ±2.4 ppm globally. An exception is the NIES-GOSAT-2 product, which displays high positive deviations of +5–6 ppm at northern mid-to-high latitudes (40–80°N, Figure S13).
The ACOS-OCO-2 product shifts from positive deviations in 2017–2018 to negative deviations in 2020–2021 (both within ±3 ppm), particularly over NH and oceanic regions. Similarly, the EMMA-Ensemble product maintains consistent positive deviations (+3 ppm) in 2011–2012 and 2017–2018, but negative deviations (within −5 ppm) across 40–80°N in 2020–2021 (Figure 6 and Figure S13). These temporal inversions in deviation patterns suggest fundamental differences in the relative distribution among satellite products across observation periods.
5. Discussion
5.1. Recommendation for Selecting Satellite XCO2 Products
The ACOS-OCO-2 product is recommended as the principal dataset for all analyses commencing in 2014, irrespective of scale (global, latitudinal) or season. It exhibits the most robust statistical performance, consistently achieving the highest R2 and the lowest error metrics (RMSE and MAE) across the vast majority of evaluated spatiotemporal domains. This product also offers a high spatial resolution of 2.25 km × 1.29 km.
When historical data from 2009 is required, the ACOS-GOSAT product (spatial resolution: 10.5 km × 10.5 km) serves as the most suitable supplement, typically ranking as the second-best performer globally, by latitude, and in most seasons. However, during autumn, the EMMA-Ensemble product is recommended instead, as it provides statistically better agreement with the TCCON data. Note that the EMMA product has a significantly coarser spatial resolution of 10° × 10°.
For investigations targeting specific local regions, we recommend referring to the station-level evaluation presented in Figure S11 and Table S7 to determine the most appropriate product for the particular purpose.
5.2. Limitations
The primary limitation of this study arises from the geographical imbalance of the TCCON network. The majority of the stations are concentrated within the 20–40°N latitude band (21 stations, approximately 67% of the total). In contrast, coverage is sparse at high latitudes (3 stations) and in the SH (5 stations). Notably, the absence of stations over the oceans and across Africa may result in underrepresentation. Consequently, while the statistical results are robust at the station locations, they may not fully represent broader continental-scale conditions.
In addition to spatial constraints, the evaluation is also limited by the seasonal availability of data in specific regions. For example, in the 60–80°N latitude band, matched data are not available in winter.
Another source of uncertainty is the disparity in the temporal coverage of the satellite products evaluated. The OCFP-TanSat product, for instance, provides data only from March 2017 to May 2018. This contrasts with the decade-long records of the GOSAT and OCO-2 products. While the sample size of the OCFP-TanSat product is statistically sufficient for a robust evaluation within its operational period, this temporal mismatch may introduce biases related to inter-annual variability.
Furthermore, while specific biases are identified, their attribution to distinct physical mechanisms (e.g., differences in aerosol models) is beyond the scope of this analysis. Future work should therefore focus on disentangling these specific algorithmic elements to advance satellite retrieval accuracy.
6. Conclusions
This study has analyzed the data coverage and evaluated the performance of twelve satellite XCO2 products against TCCON station measurements, considering both global and regional scales across different seasons. Key findings of this study are: Among the evaluated satellite XCO2 products, the OCO satellite-based products provide the highest data availability. However, all products exhibit significant regional and seasonal variations in coverage, with particularly sparse data in polar and equatorial regions, especially during winter. The EMMA-Ensemble product achieves relatively uniform land coverage but shows uneven data distribution over oceans. These spatial and temporal coverage patterns must be carefully considered alongside retrieval accuracy when selecting products for comprehensive analysis.
Global validation against TCCON measurements demonstrates that the ACOS-OCO-2 product consistently outperforms others across seasons and most latitude bands. Notably, products from newer generation satellites (e.g., GOSAT-2, OCO-3) show no systematic improvements. While all products face challenges in tropical regions due to aerosol and cloud interference, the ACOS-GOSAT product maintains relatively better performance in these areas.
Latitude-specific assessments reveal distinct performance patterns. The high-latitude band (60–80°N) shows the highest overall accuracy in summer, particularly for the ACOS-OCO-2 product, while NIES-GOSAT-2 and WFMD-Envisat products display consistent overestimation. In the NH mid-latitude bands (20–60°N), larger positive/negative biases are observed across multiple products, such as the NIES-GOSAT and OCFP-GOSAT products, while the ACOS-OCO-2 product performs the best. Challenges exist in tropical regions (20°S–20°N), but the ACOS-OCO-2 and ACOS-GOSAT products offer more reliable retrievals. Across the SH mid-latitude bands (20–60°S), product performance is slightly weaker than in the NH. In the 20–40°S band, the ACOS-GOSAT and ACOS-OCO-2 products perform the best. Further south (40–60°S), the ACOS-OCO-2 and ACOS-OCO-3 products are the most reliable, whereas the Envisat satellite products show poor correlation and significant underestimation. These findings underscore the importance of matching product selection to specific spatiotemporal study requirements.
The comparative analysis with the ensemble mean distribution reveals significant divergence in mean deviations across products. These deviations range from globally consistent values (e.g., ±1.8 ppm for the ACOS-GOSAT product) to those exhibiting marked regional and seasonal variability (e.g., ±6 ppm for the WFMD-Envisat and NIES-GOSAT products).
The EMMA-Ensemble product reduces overall bias with the TCCON observations compared to individual products. However, it inherits localized high biases from its constituent products, particularly during summer and autumn. This highlights the need for improvement in future XCO2 ensemble product development.
Although we have quantified performance disparities, the underlying mechanisms driving these errors warrant deeper investigation. To advance satellite retrieval accuracy, subsequent studies must focus on decoupling the effects of core algorithmic elements.
Supplementary Materials
The following supporting information can be downloaded at: https://www.mdpi.com/article/10.3390/rs18020371/s1. Figure S1: Timeline of TCCON station data; Figure S2: Timeline of XCO2 satellite product data; Figure S3: Tests of spatiotemporal collocation criteria between TCCON stations and satellite products; Figure S4: Monthly average number of valid XCO2 observation data for latitude bands; Figure S5: Monthly average number of valid XCO2 observation data per 3° × 3° grid in each season; Figure S6: Annual and seasonal average cloud cover during the period 2003–2024; Figure S7: Comparison of satellite XCO2 products with TCCON observations per season; Figure S8: Monthly mean differences in XCO2 (ppm) between satellite products and TCCON observations from June 2004 to June 2024; Figure S9: Comparison of satellite XCO2 products with TCCON observations per latitude band; Figure S10: Probability density distributions of the bias in different latitude bands for each satellite product; Figure S11: Comparison of satellite XCO2 products with each TCCON station observation; Figure S12: Mean deviations of satellite XCO2 products relative to the ensemble mean of all products per season; Figure S13: Mean deviations of other satellite XCO2 products relative to the ensemble mean of all products; Table S1: Information for TCCON stations; Table S2: Evaluation of the ACOS-OCO-2 and ACOS-OCO-3 products using different spatial matching windows; Table S3: Evaluation of satellite XCO2 products and TCCON measurements per season; Table S4: Evaluation of satellite XCO2 products and TCCON measurements per latitude band; Table S5: Number of matched data points between satellite and TCCON XCO2 products per season per latitude band; Table S6: Evaluation of satellite XCO2 products per latitude band in summer; Table S7: Evaluation of satellite XCO2 products at each TCCON station; Text S1: Cloud Data Description.
Author Contributions
J.Y.: Writing—original draft, Methodology, Investigation, Formal analysis, Data curation, Visualization. J.T.: Writing—review & editing. R.X.: Writing—review & editing. Y.L.: Writing—review & editing. A.P.M.: Writing—review & editing. Q.M.: Writing—original draft, Conceptualization, Methodology, Formal analysis, Resources, Funding acquisition, Supervision. All authors have read and agreed to the published version of the manuscript.
Funding
This study was supported by the Basic Research Program of Jiangsu (No. BK20250467), the Research Development Fund of Xi’an Jiaotong-Liverpool University (No. RDF-23-01-118), and the Jiangsu Province Young Scientific and Technological Talents Promotion Plan (No. JSTJ-2024-436).
Data Availability Statement
The data used in this study are available through several online repositories. BESD-Envisat product: https://catalogue.ceda.ac.uk/uuid/294b4075ddbc4464bb06742816813bdc/ (accessed on 8 November 2024). WFMD-Envisat product: https://catalogue.ceda.ac.uk/uuid/e493802d83c846c8b76f817866fb74cc/ (accessed on 8 November 2024). ACOS-GOSAT product: https://disc.gsfc.nasa.gov/datasets/ACOS_L2_Lite_FP_9r/summary?keywords=OCO-2 (accessed on 10 December 2024). NIES-GOSAT product: https://www.gosat.nies.go.jp/en/index.html (accessed on 10 December 2024). OCFP-GOSAT product: https://catalogue.ceda.ac.uk/uuid/9255faeb392f41debf5402caa40dada8/ (accessed on 3 December 2024). SRFP-GOSAT product: https://catalogue.ceda.ac.uk/uuid/e61704b00267405082fbd41bb710dd74/ (accessed on 8 December 2024). ACOS-OCO-2 product: https://disc.gsfc.nasa.gov/datasets/OCO2_L2_Lite_SIF_11r/summary?keywords=oco2 (accessed on 5 December 2024). OCFP-TanSat product: https://catalogue.ceda.ac.uk/uuid/b0beb88af3b748b98afc4b35f77bebf8/ (accessed on 13 December 2024). NIES-GOSAT-2 product: https://prdct.gosat-2.nies.go.jp/app/searchproduct/display (accessed on 31 December 2024). SRFP-GOSAT-2 product: https://catalogue.ceda.ac.uk/uuid/875f25069b5d4bd9a7101ca1206ee4f0/ (accessed on 20 December 2024). ACOS-OCO-3 product: https://disc.gsfc.nasa.gov/datasets/OCO-3_L2_Lite_FP_10.4r/summary?keywords=OCO-3 (accessed on 13 December 2024). MERGED-EMMA product: https://cds.climate.copernicus.eu/datasets/satellite-carbon-dioxide?tab=download (accessed on 18 November 2024). Additionally, this study utilizes data from 31 TCCON stations [70,71,72,73,74,75,76,77,78,79,80,81,82,83,84,85,86,87,88,89,90,91,92,93,94,95,96,97,98,99,100,101,102,103]. TCCON data is downloaded from https://tccondata.org. The code related to this article is available online at https://zenodo.org/records/15703764 (accessed on 19 January 2026).
Acknowledgments
We thank Xi’an Jiaotong-Liverpool University for providing high-performance computing resources essential for this study. We sincerely appreciate all data providers for making their datasets publicly accessible, as detailed in the Data Availability section. The TCCON data were obtained from the TCCON Data Archive hosted by CaltechDATA at https://tccondata.org.
Conflicts of Interest
The authors declare that they have no known competing financial interests or personal relationships that could have appeared to influence the work reported in this paper.
References
- Cenozoic CO2 Proxy Integration Project (CenCO2PIP) Consortium. Toward a Cenozoic history of atmospheric CO2. Science 2023, 382, eadi5177. [Google Scholar] [CrossRef]
- Copernicus Climate Change Service. The Year 2024 Set to End Up as the Warmest on Record. 2024. Available online: https://climate.copernicus.eu/year-2024-set-end-warmest-record (accessed on 12 July 2025).
- Liu, L.; Chen, L.; Liu, Y.; Yang, D.; Zhang, X.; Lu, N.; Ju, W.; Jiang, F.; Yin, Z.; Liu, G.; et al. Satellite Remote Sensing for Global Stocktaking: Methods, Progress and Perspectives. Natl. Remote Sens. Bull. 2022, 26, 243–267. [Google Scholar] [CrossRef]
- Cai, K.; Guan, L.; Li, S.; Zhang, S.; Liu, Y.; Liu, Y. Full-coverage estimation of CO2 concentrations in China via multisource satellite data and Deep Forest model. Sci. Data 2024, 11, 1231. [Google Scholar] [CrossRef]
- Antezana Lopez, F.P.; Zhou, G.; Jing, G.; Zhang, K.; Chen, L.; Chen, L.; Tan, Y. Global daily column average CO2 at 0.1° × 0.1° spatial resolution integrating OCO-3, GOSAT, CAMS with EOF and deep learning. Sci. Data 2025, 12, 268. [Google Scholar] [CrossRef] [PubMed]
- Alcibahy, M.; Gafoor, F.A.; Mustafa, F.; El Fadel, M.; Al Hashemi, H.; Al Hammadi, A.; Al Shehhi, M.R. Improved estimation of carbon dioxide and methane using machine learning with satellite observations over the Arabian Peninsula. Sci. Rep. 2025, 15, 766. [Google Scholar] [CrossRef]
- Rosan, T.M.; Sitch, S.; O’Sullivan, M.; Basso, L.S.; Wilson, C.; Silva, C.; Gloor, E.; Fawcett, D.; Heinrich, V.; Souza, J.G.; et al. Synthesis of the land carbon fluxes of the Amazon region between 2010 and 2020. Commun. Earth Environ. 2024, 5, 46. [Google Scholar] [CrossRef]
- Sonabend-W, A.; Elkin, C.; Dean, T.; Dudley, J.; Ali, N.; Blickstein, J.; Brand, E.; Broshears, B.; Chen, S.; Engberg, Z.; et al. Feasibility test of per-flight contrail avoidance in commercial aviation. Commun. Eng. 2025, 3, 184. [Google Scholar] [CrossRef]
- Wang, H.; He, Q.; Kong, H.; Qin, K.; Zheng, B.; Lin, J.; Zhao, Y. Declining short-term emission control opportunity for major events in Chinese cities. Nat. Cities 2025, 2, 434–446. [Google Scholar] [CrossRef]
- Butz, A.; Hasekamp, O.P.; Frankenberg, C.; Aben, I. Retrievals of atmospheric CO2 from simulated space-borne measurements of backscattered near-infrared sunlight: Accounting for aerosol effects. Appl. Opt. 2009, 48, 3322–3336. [Google Scholar] [CrossRef] [PubMed]
- Zhang, L.; Jiang, F.; He, W.; Wu, M.; Wang, J.; Ju, W.; Wang, H.; Zhang, Y.; Sitch, S.; Chen, J.M. Improved estimates of net ecosystem exchanges in mega-countries using GOSAT and OCO-2 observations. Commun. Earth Environ. 2024, 5, 737. [Google Scholar] [CrossRef]
- Buchwitz, M.; de Beek, R.; Noël, S.; Burrows, J.P.; Bovensmann, H.; Schneising, O.; Khlystova, I.; Bruns, M.; Bremer, H.; Bergamaschi, P.; et al. Atmospheric carbon gases retrieved from SCIAMACHY by WFM-DOAS: Version 0.5 CO and CH4 and impact of calibration improvements on CO2 retrieval. Atmos. Chem. Phys. 2006, 6, 2727–2751. [Google Scholar] [CrossRef]
- NIES. Summary of the Validation of GOSAT-2 TANSO-FTS-2 SWIR L2 Column-Averaged Dry-Air Mole Fraction Product (Ver. 02.10). 2025. Available online: https://prdct.gosat-2.nies.go.jp/documents/pdf/ValidationResult_FTS-2_L2_SWFP_ver0210_en_00.pdf (accessed on 20 July 2025).
- NIES. Summary of the Evaluation of GOSAT-2 TANSO-FTS-2 SWIR L2 Column-Averaged Dry-Air Mole Fraction Product (Ver. 02.20). 2025. Available online: https://prdct.gosat-2.nies.go.jp/documents/pdf/ValidationResult_FTS-2_L2_SWFP_ver0220_en_00.pdf (accessed on 20 July 2025).
- Taylor, T.E.; O’Dell, C.W.; Baker, D.; Bruegge, C.; Chang, A.; Chapsky, L.; Chatterjee, A.; Cheng, C.; Chevallier, F.; Crisp, D.; et al. Evaluating the consistency between OCO-2 and OCO-3 XCO2 estimates derived from the NASA ACOS version 10 retrieval algorithm. Atmos. Meas. Tech. 2023, 16, 3173–3209. [Google Scholar] [CrossRef]
- Jacobs, N.; O’Dell, C.W.; Taylor, T.E.; Logan, T.L.; Byrne, B.; Kiel, M.; Kivi, R.; Heikkinen, P.; Merrelli, A.; Payne, V.H.; et al. The importance of digital elevation model accuracy in XCO2 retrievals: Improving the Orbiting Carbon Observatory-2 Atmospheric Carbon Observations from Space version 11 retrieval product. Atmos. Meas. Tech. 2024, 17, 1375–1401. [Google Scholar] [CrossRef]
- Hong, X.; Zhang, C.; Tian, Y.; Zhu, Y.; Hao, Y.; Liu, C. First TanSat CO2 retrieval over land and ocean using both nadir and glint spectroscopy. Remote Sens. Environ. 2024, 304, 114053. [Google Scholar] [CrossRef]
- Bazalgette Courrèges-Lacoste, G.; Pachot, C.; Ouslimani, H.; Durand, Y.; Pasquet, A.; Chanumolu, A.; Martinez Fernandez, M.; Caleno, M.; Bastirmaci, T.; Birtwhistle, A.; et al. Progress on the development of the Copernicus CO2M mission. In Proceedings of the Remote Sensing SPIE Sensors + Imaging 2024 Symposium, Edinburgh, UK, 16–20 September 2024; p. 131920S. [Google Scholar]
- Zhao, D.; Du, S.; Zou, C.; Tian, L.; Fan, M.; Du, Y.; Liu, L. TanSat-2: A new satellite for mapping solar-induced chlorophyll fluorescence at both red and far-red bands with high spatiotemporal resolution. Atmos. Meas. Tech. 2024, 18, 3647–3667. [Google Scholar] [CrossRef]
- Nguyen, H.; Osterman, G.; Wunch, D.; O’Dell, C.; Mandrake, L.; Wennberg, P.; Fisher, B.; Castaño, R. A method for colocating satellite XCO2 data to ground-based data and its application to ACOS-GOSAT and TCCON. Atmos. Meas. Tech. 2014, 7, 2631–2644. [Google Scholar] [CrossRef]
- Wu, L.; Hasekamp, O.; Hu, H.; Landgraf, J.; Butz, A.; De Brugh, A.; Aben, I.; Pollard, D.; Griffith, D.; Feist, D.; et al. Carbon dioxide retrieval from OCO-2 satellite observations using the RemoTeC algorithm and validation with TCCON measurements. Atmos. Meas. Tech. 2018, 11, 3111–3130. [Google Scholar] [CrossRef]
- Cai, Z.; Sun, K.; Yang, D.; Liu, Y.; Yao, L.; Lin, C.; Liu, X. On-Orbit Characterization of TanSat Instrument Line Shape Using Observed Solar Spectra. Remote Sens. 2022, 14, 3334. [Google Scholar] [CrossRef]
- Hong, J.; Kim, J.; Jung, Y.; Kim, W.; Lim, H.; Jeong, S.; Lee, S. Potential improvement of XCO2 retrieval of the OCO-2 by having aerosol information from the A-train satellites. GISci. Remote Sens. 2023, 60, 2209968. [Google Scholar] [CrossRef]
- Velazco, V.; Deutscher, N.; Morino, I.; Uchino, O.; Bukosa, B.; Ajiro, M.; Kamei, A.; Jones, N.; Paton-Walsh, C.; Griffith, D. Satellite and ground-based measurements of XCO2 in a remote semiarid region of Australia. Earth Syst. Sci. Data 2019, 11, 935–946. [Google Scholar] [CrossRef]
- Müller, A.; Tanimoto, H.; Sugita, T.; Machida, T.; Nakaoka, S.; Patra, P.K.; Laughner, J.; Crisp, D. New approach to evaluate satellite-derived XCO2 over oceans by integrating ship and aircraft observations. Atmos. Chem. Phys. 2021, 21, 8255–8271. [Google Scholar] [CrossRef]
- Zhang, M.; Zhang, X.-Y.; Liu, R.-X.; Hu, L.-Q. A study of the validation of atmospheric CO2 from satellite hyperspectral remote sensing. Adv. Clim. Change Res. 2014, 5, 131–135. [Google Scholar] [CrossRef]
- Kulawik, S.; Wunch, D.; O’Dell, C.; Frankenberg, C.; Reuter, M.; Oda, T.; Chevallier, F.; Sherlock, V.; Buchwitz, M.; Osterman, G.; et al. Consistent evaluation of ACOS-GOSAT, BESD-SCIAMACHY, CarbonTracker, and MACC through comparisons to TCCON. Atmos. Meas. Tech. 2016, 9, 683–709. [Google Scholar] [CrossRef]
- Liang, A.; Gong, W.; Han, G.; Xiang, C. Comparison of Satellite-Observed XCO2 from GOSAT, OCO-2, and Ground-Based TCCON. Remote Sens. 2017, 9, 1033. [Google Scholar] [CrossRef]
- Wunch, D.; Wennberg, P.O.; Osterman, G.; Fisher, B.; Naylor, B.; Roehl, C.M.; O’Dell, C.; Mandrake, L.; Viatte, C.; Kiel, M.; et al. Comparisons of the Orbiting Carbon Observatory-2 (OCO-2) XCO2 measurements with TCCON. Atmos. Meas. Tech. 2017, 10, 2209–2238. [Google Scholar] [CrossRef]
- Bie, N.; Lei, L.; Zeng, Z.; Cai, B.; Yang, S.; He, Z.; Wu, C.; Nassar, R. Regional uncertainty of GOSAT XCO2 retrievals in China: Quantification and attribution. Atmos. Meas. Tech. 2018, 11, 1251–1272. [Google Scholar] [CrossRef]
- Meng, X.; Zhang, X.; Zhou, M.; Guang, B.; Zhou, L.; Yu, X.; Hu, Y. Validation and Analysis of GOSAT XCO2 Measurements by TCCON Sites. Meteorol. Mon. 2018, 44, 1306–1317. [Google Scholar] [CrossRef]
- Zhang, S.; Bai, Y.; He, X.; Huang, H.; Zhu, Q.; Gong, F. Comparisons of OCO-2 satellite derived XCO2 with in situ and modeled data over global ocean. Acta Oceanol. Sin. 2021, 40, 136–142. [Google Scholar] [CrossRef]
- Fang, J.; Chen, B.; Zhang, H.; Dilawar, A.; Guo, M.; Liu, C.; Gemechu, T.M.; Zhang, X. Global Evaluation and Intercomparison of XCO2 Retrievals from GOSAT, OCO-2, and TANSAT with TCCON. Remote Sens. 2023, 15, 5073. [Google Scholar] [CrossRef]
- Ji, M.; Xu, Y.; Zhang, Y.; Mo, Y.; Zhu, S.; Wang, W.; Zhu, M.; Morino, I.; Ohyama, H.; Kei, S.; et al. Validation of remotely sensed XCO2 products with TCCON observations in East Asia. IEEE J. Sel. Top. Appl. Earth Obs. Remote Sens. 2024, 17, 7159–7169. [Google Scholar] [CrossRef]
- Crisp, D.; Fisher, B.M.; O’Dell, C.; Frankenberg, C.; Basilio, R.; Bösch, H.; Brown, L.R.; Castano, R.; Connor, B.; Deutscher, N.M.; et al. The ACOS CO2 retrieval algorithm—Part II: Global XCO2 data characterization. Atmos. Meas. Tech. 2012, 5, 687–707. [Google Scholar] [CrossRef]
- Crisp, D. Measuring atmospheric carbon dioxide from space with the Orbiting Carbon Observatory-2 (OCO-2). In Proceedings of the SPIE Optical Engineering + Applications, San Diego, CA, USA, 9–13 August 2015. [Google Scholar]
- Kong, Y.; Chen, B.; Measho, S. Spatio-Temporal Consistency Evaluation of XCO2 Retrievals from GOSAT and OCO-2 Based on TCCON and Model Data for Joint Utilization in Carbon Cycle Research. Atmosphere 2019, 10, 354. [Google Scholar] [CrossRef]
- Chen, Y.; Cheng, J.; Song, X.; Liu, S.; Sun, Y.; Yu, D.; Fang, S. Global-Scale Evaluation of XCO2 Products from GOSAT, OCO-2 and CarbonTracker Using Direct Comparison and Triple Collocation Method. Remote Sens. 2022, 14, 5635. [Google Scholar] [CrossRef]
- Hong, X.; Zhang, P.; Bi, Y.; Liu, C.; Sun, Y.; Wang, W.; Chen, Z.; Yi, H.; Zhang, C.; Tian, Y.; et al. Retrieval of Global Carbon Dioxide from TanSat Satellite and Comprehensive Validation with TCCON Measurements and Satellite Observations. IEEE Trans. Geosci. Remote Sens. 2022, 60, 4101716. [Google Scholar] [CrossRef]
- Karbasi, S.; Malakooti, H.; Rahnama, M.; Azadi, M. Study of mid-latitude retrieval XCO2 greenhouse gas: Validation of satellite-based shortwave infrared spectroscopy with ground-based TCCON observations. Sci. Total Environ. 2022, 836, 155513. [Google Scholar] [CrossRef]
- Yang, H.; Li, T.; Wu, J.; Zhang, L. Inter-comparison and evaluation of global satellite XCO2 products. Geo-Spat. Inf. Sci. 2023, 26, 131–144. [Google Scholar] [CrossRef]
- Zheng, J.; Zhang, H.; Zhang, S. Comparison of Atmospheric Carbon Dioxide Concentrations Based on GOSAT, OCO-2 Observations and Ground-Based TCCON Data. Remote Sens. 2023, 15, 5172. [Google Scholar] [CrossRef]
- Hong, X.; Gao, Y.; Wang, J.; Zhang, C.; Chen, H.; Ni, Y.; Wang, W.; Sun, Y.; Zhu, Y.; Tang, Z.; et al. Evaluating the performance of carbon dioxide and methane observations from carbon-monitoring satellite products over China. Sci. Total Environ. 2024, 955, 176896. [Google Scholar] [CrossRef]
- Laughner, J.L.; Toon, G.C.; Mendonca, J.; Petri, C.; Roche, S.; Wunch, D.; Blavier, J.-F.; Griffith, D.W.T.; Heikkinen, P.; Keeling, R.F.; et al. The Total Carbon Column Observing Network’s GGG2020 data version. Earth Syst. Sci. Data 2024, 16, 2197–2260. [Google Scholar] [CrossRef]
- Wunch, D.; Toon, G.C.; Blavier, J.-F.L.; Washenfelder, R.A.; Notholt, J.; Connor, B.J.; Griffith, D.W.T.; Sherlock, V.; Wennberg, P.O. The Total Carbon Column Observing Network. Philos. Trans. A Math. Phys. Eng. Sci. 2011, 369, 2087–2112. [Google Scholar] [CrossRef]
- ESA CCI GHG Project Team. ESA Greenhouse Gases Climate Change Initiative (GHG_cci): Column-Averaged CO2 from SCIAMACHY Generated with the WFMD Algorithm (CO2_SCI_WFMD), v4.0. 2018. Available online: https://catalogue.ceda.ac.uk/uuid/e493802d83c846c8b76f817866fb74cc/ (accessed on 11 March 2025).
- ESA CCI GHG Project Team. ESA Greenhouse Gases Climate Change Initiative (GHG_cci): Column-Averaged CO2 from SCIAMACHY Generated with the BESD Algorithm (CO2_SCI_BESD), v02.01.02. 2018. Available online: https://catalogue.ceda.ac.uk/uuid/294b4075ddbc4464bb06742816813bdc/ (accessed on 11 March 2025).
- Jung, Y.; Kim, J.; Kim, W.; Boesch, H.; Lee, H.; Cho, C.; Goo, T.-Y. Impact of aerosol property on the accuracy of a CO2 retrieval algorithm from satellite remote sensing. Remote Sens. 2016, 8, 322. [Google Scholar] [CrossRef]
- Mandrake, L.; Frankenberg, C.; O’Dell, C.W.; Osterman, G.; Wennberg, P.; Wunch, D. Semi-autonomous sounding selection for OCO-2. Atmos. Meas. Tech. 2013, 6, 2851–2864. [Google Scholar] [CrossRef]
- Dils, B.; Buchwitz, M.; Reuter, M.; Schneising, O.; Boesch, H.; Parker, R.; Guerlet, S.; Aben, I.; Blumenstock, T.; Burrows, J.P.; et al. The Greenhouse Gas Climate Change Initiative (GHG-CCI): Comparative validation of GHG-CCI SCIAMACHY/ENVISAT and TANSO-FTS/GOSAT CO2 and CH4 retrieval algorithm products with measurements from the TCCON. Atmos. Meas. Tech. 2014, 7, 1723–1744. [Google Scholar] [CrossRef]
- ESA CCI GHG Project Team. ESA Greenhouse Gases Climate Change Initiative (GHG CCI): Column-Averaged CO2 from GOSAT Generated with the OCFP (UoL-FP) Algorithm (CO2_GOS_OCFP), v7.0. 2018. Available online: https://catalogue.ceda.ac.uk/uuid/9255faeb392f41debf5402caa40dada8/ (accessed on 11 March 2025).
- ESA CCI GHG Project Team. ESA Greenhouse Gases Climate Change Initiative (GHG_cci): Column-Averaged CO2 from GOSAT Generated with the SRFP (RemoTeC) Algorithm (CO2_GOS_SRFP), v2.3.8. 2018. Available online: https://catalogue.ceda.ac.uk/uuid/e61704b00267405082fbd41bb710dd74/ (accessed on 11 March 2025).
- GHG-CCI+ Project Team. Algorithm Theoretical Basis Document (ATBD) Version 1.5 for the RemoTeC XCO2 and XCH4 GOSAT-2 SRON Full Physics Products. 2024. Available online: https://climate.esa.int/media/documents/ATBD_XCO2_XCH4_GOSAT2_SRFP_v1.5.pdf (accessed on 9 March 2025).
- Oishi, Y.; Nakajima, T.Y.; Matsunaga, T. Difference between forward- and backward-looking bands of GOSAT-2 CAI-2 cloud discrimination used with Terra MISR data. Int. J. Remote Sens. 2016, 37, 1115–1126. [Google Scholar] [CrossRef]
- Suto, H.; Kataoka, F.; Kikuchi, N.; Knuteson, R.O.; Butz, A.; Haun, M.; Buijs, H.; Shiomi, K.; Imai, H.; Kuze, A. Thermal and near-infrared sensor for carbon observation Fourier transform spectrometer-2 (TANSO-FTS-2) on the Greenhouse gases Observing SATellite-2 (GOSAT-2) during its first year in orbit. Atmos. Meas. Tech. 2021, 14, 2013–2039. [Google Scholar] [CrossRef]
- Yoshida, Y.; Someya, Y.; Ohyama, H.; Morino, I.; Matsunaga, T.; Deutscher, N.M.; Griffith, D.W.T.; Hase, F.; Iraci, L.T.; Kivi, R.; et al. Quality evaluation of the column-averaged dry air mole fractions of carbon dioxide and methane observed by GOSAT and GOSAT-2. SOLA 2023, 19, 173–184. [Google Scholar] [CrossRef]
- Wu, L.; Aan de Brugh, J.; Meijer, Y.; Sierk, B.; Hasekamp, O.; Butz, A.; Landgraf, J. XCO2 observations using satellite measurements with moderate spectral resolution: Investigation using GOSAT and OCO-2 measurements. Atmos. Meas. Tech. 2020, 13, 713–729. [Google Scholar] [CrossRef]
- Eldering, A.; Taylor, T.E.; O’Dell, C.W.; Pavlick, R. The OCO-3 mission: Measurement objectives and expected performance based on 1 year of simulated data. Atmos. Meas. Tech. 2019, 12, 2341–2370. [Google Scholar] [CrossRef]
- Yang, D.; Boesch, H.; Liu, Y.; Somkuti, P.; Cai, Z.; Chen, X.; Di Noia, A.; Lin, C.; Lu, N.; Lyu, D.; et al. Toward high precision XCO2 retrievals from TanSat observations: Retrieval improvement and validation against TCCON measurements. J. Geophys. Res. Atmos. 2020, 125, e2020JD032794. [Google Scholar] [CrossRef]
- Reuter, M.; Bösch, H.; Bovensmann, H.; Bril, A.; Buchwitz, M.; Butz, A.; Burrows, J.P.; O’Dell, C.W.; Guerlet, S.; Hasekamp, O.; et al. A joint effort to deliver satellite retrieved atmospheric CO2 concentrations for surface flux inversions: The ensemble median algorithm EMMA. Atmos. Chem. Phys. 2013, 13, 1771–1780. [Google Scholar] [CrossRef]
- Reuter, M.; Fuentes Andrade, B.; Buchwitz, M. C3S Greenhouse Gas (GHG: CO2 & CH4) v4.6: Algorithm Theoretical Basis Document (ATBD). 2025. Available online: https://confluence.ecmwf.int/x/AS-OIQ (accessed on 28 December 2025).
- Li, X.; Mace, G.G.; Strong, C.; Krueger, S.K. Wintertime cooling of the Arctic TOA by low-level clouds. Geophys. Res. Lett. 2023, 50, e2023GL104869. [Google Scholar] [CrossRef]
- Wang, Y.; Yuan, Q.; Li, T.; Yang, Y.; Zhou, S.; Zhang, L. Seamless mapping of long-term (2010–2020) daily global XCO2 and XCH4 from the Greenhouse Gases Observing Satellite (GOSAT), Orbiting Carbon Observatory 2 (OCO-2), and CAMS global greenhouse gas reanalysis (CAMS-EGG4) with a spatiotemporally self-supervised fusion method. Earth Syst. Sci. Data 2023, 15, 3597–3622. [Google Scholar] [CrossRef]
- Chen, Y.; Teo, F.Y.; Wong, S.Y.; Chan, A.; Weng, C.; Falconer, R.A. Monsoonal extreme rainfall in Southeast Asia: A review. Water 2024, 17, 5. [Google Scholar] [CrossRef]
- Taylor, T.E.; O’Dell, C.W.; Crisp, D.; Kuze, A.; Lindqvist, H.; Wennberg, P.O.; Chatterjee, A.; Gunson, M.; Eldering, A.; Fisher, B.; et al. An 11-year record of XCO2 estimates derived from GOSAT measurements using the NASA ACOS version 9 retrieval algorithm. Earth Syst. Sci. Data 2022, 14, 325–360. [Google Scholar] [CrossRef]
- Hong, Y.; Di Girolamo, L. Cloud phase characteristics over Southeast Asia from A-Train satellite observations. Atmos. Chem. Phys. 2020, 20, 8267–8291. [Google Scholar] [CrossRef]
- Lorenzo, G.R.; Arellano, A.F.; Cambaliza, M.O.; Castro, C.; Cruz, M.T.; Di Girolamo, L.; Gacal, G.F.; Hilario, M.R.A.; Lagrosas, N.; Ong, H.J.; et al. An emerging aerosol climatology via remote sensing over Metro Manila, the Philippines. Atmos. Chem. Phys. 2023, 23, 10579–10608. [Google Scholar] [CrossRef]
- Abdullah, A.Y.M.; Masrur, A.; Adnan, M.S.G.; Baky, M.A.A.; Hassan, Q.K.; Dewan, A. Spatio-Temporal Patterns of Land Use/Land Cover Change in the Heterogeneous Coastal Region of Bangladesh between 1990 and 2017. Remote Sens. 2019, 11, 790. [Google Scholar] [CrossRef]
- Chevallier, F.; Broquet, G.; Pierangelo, C.; Crisp, D. Probabilistic global maps of the CO2 column at daily and monthly scales from sparse satellite measurements. J. Geophys. Res. Atmos. 2017, 122, 7614–7629. [Google Scholar] [CrossRef]
- Buschmann, M.; Petri, C.; Palm, M.; Warneke, T.; Notholt, J. TCCON Data from Ny-Ålesund, Svalbard (NO), Release GGG2020.R0. 2022. Available online: https://data.caltech.edu/records/3t5by-f7e05 (accessed on 1 March 2025).
- De Mazière, M.; Sha, M.K.; Desmet, F.; Hermans, C.; Scolas, F.; Kumps, N.; Zhou, M.; Metzger, J.-M.; Duflot, V.; Cammas, J.-P. TCCON Data from Réunion Island (RE), Release GGG2020.R0. 2022. Available online: https://data.caltech.edu/records/ynzeh-7d777 (accessed on 1 March 2025).
- Deutscher, N.M.; Griffith, D.W.T.; Paton-Walsh, C.; Jones, N.B.; Velazco, V.A.; Wilson, S.R.; Macatangay, R.C.; Kettlewell, G.C.; Buchholz, R.R.; Riggenbach, M.O.; et al. TCCON Data from Wollongong (AU), Release GGG2020.R0. 2023. Available online: https://data.caltech.edu/records/ne5d5-49f48 (accessed on 1 March 2025).
- Deutscher, N.M.; Griffith, D.W.T.; Paton-Walsh, C.; Velazco, V.A.; Wennberg, P.O.; Blavier, J.-F.; Washenfelder, R.A.; Yavin, Y.; Keppel-Aleks, G.; Toon, G.C.; et al. TCCON Data from Darwin (AU), Release GGG2020.R0. 2023. Available online: https://data.caltech.edu/records/48g0w-26146 (accessed on 1 March 2025).
- Dubey, M.K.; Henderson, B.G.; Allen, N.T.; Blavier, J.-F.; Roehl, C.M.; Wunch, D. TCCON Data from Manaus (BR), Release GGG2020.R0. 2022. Available online: https://data.caltech.edu/records/n8crt-k1z07 (accessed on 1 March 2025).
- Dubey, M.; Lindenmaier, R.; Henderson, B.G.; Allen, N.T.; Roehl, C.M.; Blavier, J.-F.; Love, S.; Wunch, D. TCCON Data from Four Corners (US), Release GGG2020.R0. 2022. Available online: https://data.caltech.edu/records/hm5f3-4kj52 (accessed on 1 March 2025).
- García, O.E.; Schneider, M.; Herkommer, B.; Gross, J.; Hase, F.; Blumenstock, T.; Sepúlveda, E. TCCON Data from Izana (ES), Release GGG2020.R1. 2022. Available online: https://data.caltech.edu/records/k6zn2-6hf17 (accessed on 1 March 2025).
- Hase, F.; Herkommer, B.; Groß, J.; Blumenstock, T.; Kiel, M.Ä.; Dohe, S. TCCON Data from Karlsruhe (DE), Release GGG2020.R2. 2024. Available online: https://data.caltech.edu/records/cgkcc-ymk88 (accessed on 1 March 2025).
- Iraci, L.T.; Podolske, J.R.; Hillyard, P.W.; Roehl, C.; Wennberg, P.O.; Blavier, J.-F.; Landeros, J.; Allen, N.; Wunch, D.; Zavaleta, J.; et al. TCCON Data from Indianapolis (US), Release GGG2020.R1. 2022. Available online: https://data.caltech.edu/records/2dzj5-kz424 (accessed on 1 March 2025).
- Iraci, L.T.; Podolske, J.R.; Roehl, C.; Wennberg, P.O.; Blavier, J.-F.; Allen, N.; Wunch, D.; Osterman, G.B. TCCON Data from Edwards (US), Release GGG2020.R0. 2022. Available online: https://data.caltech.edu/records/ms21z-b3d73 (accessed on 1 March 2025).
- Kivi, R.; Heikkinen, P.; Kyrö, E. TCCON Data from Sodankylä (FI), Release GGG2020.R0. 2022. Available online: https://data.caltech.edu/records/fnpcw-myc91 (accessed on 1 March 2025).
- Liu, C.; Wang, W.; Sun, Y.; Shan, C. TCCON Data from Hefei (PRC), Release GGG2020.R1. 2023. Available online: https://data.caltech.edu/records/etz11-jpg19 (accessed on 1 March 2025).
- Morino, I.; Ohyama, H.; Hori, A.; Ikegami, H. TCCON Data from Rikubetsu (JP), Release GGG2020.R0. 2022. Available online: https://data.caltech.edu/records/ksrr6-jqh95 (accessed on 1 March 2025).
- Morino, I.; Ohyama, H.; Hori, A.; Ikegami, H. TCCON Data from Tsukuba (JP), 125HR, Release GGG2020.R0. 2022. Available online: https://data.caltech.edu/records/2ve20-pr498 (accessed on 1 March 2025).
- Morino, I.; Velazco, V.A.; Hori, A.; Uchino, O.; Griffith, D.W.T. TCCON Data from Burgos, Ilocos Norte (PH), Release GGG2020.R0. 2022. Available online: https://data.caltech.edu/records/8tfg7-t6d28 (accessed on 1 March 2025).
- Notholt, J.; Petri, C.; Warneke, T.; Buschmann, M. TCCON Data from Bremen (DE), Release GGG2020.R0. 2022. Available online: https://data.caltech.edu/records/9hf0j-qa326 (accessed on 1 March 2025).
- Petri, C.; Deutscher, N.M.; Notholt, J.; Warneke, T.; Buschmann, M. TCCON Data from Bialystok (PL), Release GGG2020.R0. 2024. Available online: https://data.caltech.edu/records/k67dv-a5z77 (accessed on 1 March 2025).
- Petri, C.; Vrekoussis, M.; Rousogenous, C.; Warneke, T.; Sciare, J.; Notholt, J. TCCON Data from Nicosia (CY), Release GGG2020.R1. 2024. Available online: https://data.caltech.edu/records/9kdk2-c5881 (accessed on 1 March 2025).
- Pollard, D.F.; Robinson, J.; Shiona, H. TCCON Data from Lauder (NZ), Release GGG2020.R0. 2022. Available online: https://data.caltech.edu/records/1jb1r-rck28 (accessed on 1 March 2025).
- Sherlock, V.; Connor, B.; Robinson, J.; Shiona, H.; Smale, D.; Pollard, D.F. TCCON Data from Lauder (NZ), 120HR, Release GGG2020.R0. 2022. Available online: https://data.caltech.edu/records/88rj0-vsd46 (accessed on 1 March 2025).
- Sherlock, V.; Connor, B.; Robinson, J.; Shiona, H.; Smale, D.; Pollard, D.F. TCCON Data from Lauder (NZ), 125HR, Release GGG2020.R0. 2022. Available online: https://data.caltech.edu/records/7xf61-2jh47 (accessed on 1 March 2025).
- Shiomi, K.; Kawakami, S.; Ohyama, H.; Arai, K.; Okumura, H.; Ikegami, H.; Usami, M. TCCON Data from Saga (JP), Release GGG2020.R0. 2022. Available online: https://data.caltech.edu/records/dy9h2-6gc10 (accessed on 1 March 2025).
- Strong, K.; Roche, S.; Franklin, J.E.; Mendonca, J.; Lutsch, E.; Weaver, D.; Fogal, P.F.; Drummond, J.R.; Batchelor, R.; Lindenmaier, R.; et al. TCCON Data from Eureka (CA), Release GGG2020.R0. 2022. Available online: https://data.caltech.edu/records/ft9t6-zzg68 (accessed on 1 March 2025).
- Sussmann, R.; Rettinger, M. TCCON Data from Garmisch (DE), Release GGG2020.R1. 2025. Available online: https://data.caltech.edu/records/q3cf5-1ng55 (accessed on 1 July 2025).
- Té, Y.; Jeseck, P.; Janssen, C. TCCON Data from Paris (FR), Release GGG2020.R0. 2022. Available online: https://data.caltech.edu/records/6cj5y-spd74 (accessed on 1 March 2025).
- Warneke, T.; Petri, C.; Notholt, J.; Buschmann, M. TCCON Data from Orléans (FR), Release GGG2020.R1. 2024. Available online: https://data.caltech.edu/records/gexfp-a3461 (accessed on 1 March 2025).
- Weidmann, D.; Brownsword, R.; Doniki, S. TCCON Data from Harwell, Oxfordshire (UK), Release GGG2020.R0. 2023. Available online: https://data.caltech.edu/records/nhdz9-5d936 (accessed on 1 March 2025).
- Wennberg, P.O.; Roehl, C.M.; Blavier, J.-F.; Wunch, D.; Allen, N.T. TCCON Data from Jet Propulsion Laboratory (US), 2011, Release GGG2020.R0. 2022. Available online: https://data.caltech.edu/records/1pe8f-3bd32 (accessed on 1 March 2025).
- Wennberg, P.O.; Roehl, C.M.; Wunch, D.; Blavier, J.-F.; Toon, G.C.; Allen, N.T.; Treffers, R.; Laughner, J. TCCON Data from Caltech (US), Release GGG2020.R0. 2022. Available online: https://data.caltech.edu/records/dwedt-mpm96 (accessed on 1 March 2025).
- Wennberg, P.O.; Roehl, C.M.; Wunch, D.; Toon, G.C.; Blavier, J.-F.; Washenfelder, R.; Keppel-Aleks, G.; Allen, N.T. TCCON Data from Park Falls (US), Release GGG2020.R1. 2022. Available online: https://data.caltech.edu/records/xa6rd-9g966 (accessed on 1 March 2025).
- Wennberg, P.O.; Wunch, D.; Roehl, C.M.; Blavier, J.-F.; Toon, G.C.; Allen, N.T. TCCON Data from Lamont (US), Release GGG2020.R0. 2022. Available online: https://data.caltech.edu/records/zwkm5-2z990 (accessed on 1 March 2025).
- Wennberg, P.O.; Wunch, D.; Yavin, Y.; Toon, G.C.; Blavier, J.-F.; Allen, N.T.; Keppel-Aleks, G.; Roehl, C.M. TCCON Data from Jet Propulsion Laboratory (US), 2007, Release GGG2020.R0. 2022. Available online: https://data.caltech.edu/records/8an3t-kqb88 (accessed on 1 March 2025).
- Wunch, D.; Mendonca, J.; Colebatch, O.; Allen, N.T.; Blavier, J.-F.; Kunz, K.; Roche, S.; Hedelius, J.; Neufeld, G.; Springett, S.; et al. TCCON Data from East Trout Lake, SK (CA), Release GGG2020.R0. 2022. Available online: https://data.caltech.edu/records/b971b-jk686 (accessed on 1 March 2025).
- Zhou, M.; Wang, P.; Kumps, N.; Hermans, C.; Nan, W. TCCON Data from Xianghe, China, Release GGG2020.R0. 2022. Available online: https://data.caltech.edu/records/6ywxa-yk431 (accessed on 1 March 2025).


Disclaimer/Publisher’s Note: The statements, opinions and data contained in all publications are solely those of the individual author(s) and contributor(s) and not of MDPI and/or the editor(s). MDPI and/or the editor(s) disclaim responsibility for any injury to people or property resulting from any ideas, methods, instructions or products referred to in the content. |
© 2026 by the authors. Licensee MDPI, Basel, Switzerland. This article is an open access article distributed under the terms and conditions of the Creative Commons Attribution (CC BY) license.