Highlights
What are the main findings?
- ICESat-2 surface elevations achieve centimeter-level accuracy over flat, sparsely vegetated terrain.
- Snow depth retrieval from ICESat-2 reaches centimeter-level accuracy using both the pathlength method and the snow-on–off technique.
What are the implications of the main findings?
- ICESat-2 provides reliable measurements of snow depth and surface elevations in flat, open terrain.
- The pathlength method is more robust than snow on–off for snow depth retrieval in vegetated or steep areas.
Abstract
Recent studies have shown that lidar observations from the Ice, Clouds, and Land Elevation Satellite-2 (ICESat-2) enable seasonal snow depth retrieval over land through two primary approaches. The snow-on–off method estimates snow depth by differencing surface elevations acquired during snow-covered and snow-free periods, while the pathlength method derives it from multiple-scattering photon distributions within the snowpack. In this study, we cross-validate ICESat-2-derived surface elevations and snow depths against in situ measurements from SnowEx field campaigns. ICESat-2 surface elevations agree closely with SnowEx data, which we consider closest to the truth, achieving centimeter-level accuracy (e.g., 1 cm) over flat, sparsely vegetated terrain, with larger biases in vegetated and steep areas. Snow depth estimates from both methods show comparable performance in the tundra area, with typical errors on the order of tens of centimeters; however, in vegetated or steep terrain, the pathlength method yields more reliable snow depth results, being less affected by slope and vegetation than the snow-on–off method. These findings show that ICESat-2 is a reliable tool for measuring snow depth from space.
1. Introduction
Accurate measurement of seasonal snow is essential for understanding the hydrological cycle, managing water resources, and monitoring climate variability in snow-dominated regions [1,2,3,4,5]. Traditional in situ measurements [6] provide high accuracy but are spatially limited and labor-intensive, making it challenging to capture snowpack variability across large and heterogeneous landscapes [7]. Satellite remote sensing helps address these limitations [8]. Passive microwave observations, for example, provide long-term global records [4,9], but their coarse spatial resolution (~25 km) limits the ability to resolve fine-scale snow variability, and retrievals saturate in deep snow (>0.8 m depth) [10]. Optical sensors such as MODIS and VIIRS offer global, daily snow cover products at moderate resolution (500 m) under an open-data policy [11,12]. However, these products primarily map snow extent rather than snow depth, which is critical to assess water resources [8].
To advance snow depth monitoring, NASA initiated the SnowEx program, a multi-year, multi-agency effort designed to evaluate and advance remote sensing techniques for snow observation [13,14]. SnowEx integrates extensive airborne and field measurements across diverse landscapes and vegetation types, providing critical datasets for the development and validation of future satellite missions. One promising satellite instrument is the Ice, Clouds, and Land Elevation Satellite-2 (ICESat-2), launched in 2018 [15]. Using photon-counting lidar, ICESat-2 measures Earth’s surface elevations with unprecedented accuracy [16,17], enabling snow depth retrieval through two primary approaches: the snow-on–off elevation differencing method (snow-on–off method) [18,19,20,21] and the pathlength method based on multiple scattering within the snowpack [22,23,24].
The snow-on–off method estimates snow accumulation by differencing surface elevations acquired during snow-covered and snow-free periods [20,21]. Most existing studies implement this approach by combining snow-on ICESat-2 elevations with snow-off digital terrain models (DTMs) derived from airborne or satellite data [5,18,19,20,21]. These studies consistently show that the accuracy of ICESat-2 surface elevation and snow depth estimates is strongly dependent on surface characteristics, particularly terrain slope and vegetation cover [19,20]. For example, Enderlin et al. (2022) reported ICESat-2 surface elevation errors of approximately 0.2 m over gentle slopes (0–5°), increasing to more than 1.0 m over steep terrain (>20°) [19]. Similarly, Deschamps-Berger et al. reported a basin-wide snow depth bias of ~0.2 m and a precision of ~1.0 m, with improved precision of ~0.5 m over low-slope terrain (<10°) [20].
In contrast, the pathlength method derives snow depth from the distribution of multiple-scattered photons within the snowpack [22,23,24]. Using this approach, Lu et al. demonstrated that snow depths retrieved from ICESat-2 over Arctic sea ice agree well with co-located IceBridge snow radar measurements [25], with a root-mean-square (RMS) difference of 7.8 cm (~29% of the mean snow depth), and exhibit spatial patterns consistent with University of Arizona (UA) [26] and Canadian Meteorological Centre (CMC) [27] snow products over land. They further demonstrated through simulations that snow depth errors can be reduced to less than 5 cm when surface roughness–induced pulse spreading remains below 50 cm [22].
Although both methods provide meter-scale resolution, their relative performance across different terrain and vegetation conditions remains to be fully evaluated. ICESat-2 provides high-resolution measurements along individual tracks, but the same ground track is revisited only every 91 days. In this study, we conduct a systematic cross-validation of ICESat-2 surface elevation and snow depth estimates using SnowEx field measurements [13]. Surface elevation accuracy is assessed across diverse environments, including Alaska tundra and boreal forest. We then evaluate the performance of both snow depth retrieval approaches across tundra and boreal forest regions, highlighting their respective strengths and limitations. The results advance understanding of ICESat-2’s capability for snowpack monitoring and demonstrate the broader potential of spaceborne lidar for global snow depth measurement.
The remainder of this paper is organized as follows. Section 2 describes the ICESat-2 and SnowEx datasets. Section 3 outlines the two snow depth retrieval approaches. Section 4 presents the validation of ICESat-2 surface elevation against SnowEx snow-free measurements. Section 5 compares snow depth retrievals with SnowEx data. Section 6 discusses the results, including temporal variability in snow depth measurements and the influence of terrain and vegetation on snow depth retrieval performance. Finally, Section 7 summarizes the findings and conclusions.
2. Dataset
2.1. ICESat-2 Data
ICESat-2 is a spaceborne laser altimeter that provides precise measurements of surface elevation [15], enabling monitoring of terrain height across seasons under both snow-on and snow-off conditions. The mission generates several data products. The ATL03 product [28] contains all geolocated photon data along with ancillary information required for generating higher-level products. Each individual photon in ATL03 is time-tagged and geolocated, allowing photon counts to be binned horizontally and vertically for applications such as system impulse response studies [29], as well as ocean [29,30,31] and snow profile analyses [22].
Higher-level products include the ATL06 land ice product [32] and the ATL08 vegetation height product [33], which provide surface elevation estimates over fixed-length along-track segments. In this study, we used version 6 of the ATL06 land ice product (h_li, 20 m segments) and the ATL08 vegetation product (h_te_best_fit_20m, 20 m segments), both referenced to the WGS84 ellipsoid. These were evaluated against surface elevation measurements from the SnowEx field campaigns (Section 2.2). Since release 007 will be available soon, we note that substantial differences from release 006 are not expected for snow depth retrievals. ATL06 underwent only minor changes, while ATL08 may contain some updates whose impact is expected to be limited.
2.2. SnowEx Field Campaign
NASA’s SnowEx is a multi-year field program designed to evaluate remote sensing techniques for monitoring seasonal snow [13,14]. The campaign collects extensive airborne and surface-based observations across diverse landscapes, with the goal of identifying the most effective strategies for accurate and consistent snow monitoring. In this study, we used SnowEx datasets from 2022 and 2023 to compare with ICESat-2 results. Table 1 summarizes the surface elevation products from SnowEx survey sites during snow-free periods, which were used to evaluate ICESat-2 surface elevation measurements collected in the same seasons. Snow-on measurements listed in Table 1, combined with corresponding snow-off surface elevations, are used to estimate SnowEx snow depth using the surface elevation difference between snow-on and snow-off measurements (snow-on–off method).

Table 1.
SnowEx digital terrain model (DTMs) and Snow Depth at survey sites.
The SnowEx 2022–2023 campaign (SnowEx23) focuses on tundra and boreal forest regions of Alaska to collect observations of snow in these unique environments [34]. Data were acquired at five field sites between spring 2022 and spring 2023 [35]. The Bonanza Creek Experimental Forest (BCEF), Caribou Poker Creek watershed (CPCRW), and Farmers Loop/Creamer’s Field (FLCF) represent boreal forest environments near Fairbanks, while the Arctic coastal plain (ACP) and Upper Kuparuk Toolik (UKT) sites represent coastal tundra environments on the North Slope. Figure 1 shows the five SnowEx sites in Alaska. Snow free surveys were generally scheduled during summer periods with minimal foliage to maximize bare earth coverage. The accuracy of SnowEx23 DTMs is estimated at ~5 cm, with precision of ~1 mm, referenced directly to WGS84 [34]. Here, accuracy refers to the absolute agreement with an external reference, whereas precision describes the repeatability or internal consistency of the measurements [34]. Products are provided at 0.5 m spatial resolution, and no additional datum correction was required.
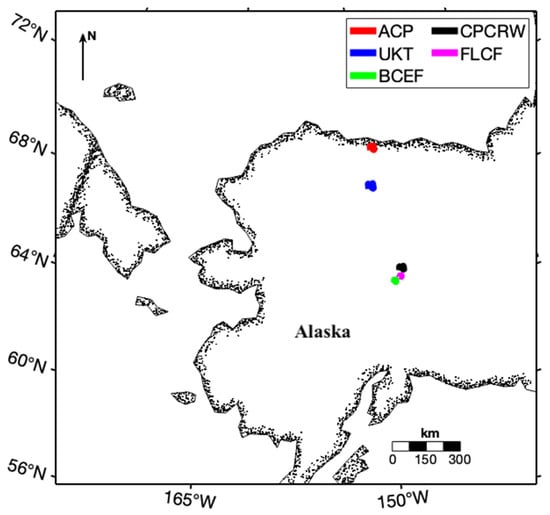
Figure 1.
Locations of SnowEx sites: ACP, UKT, BCEF, CPCRW, and FLCF used for surface elevation and snow depth studies.
3. Snow Depth Methods
3.1. Snow-On–Off Method
Snow depths can be estimated as the difference between the snow surface height (snow-on) and the snow-free ground height (snow-off) [7]. In this study, ICESat-2 surface elevations from both ATL06 and ATL08 during snow-on seasons were used to represent the snow surface height. Snow-free ground heights were obtained from (1) SnowEx DTM products (Table 1) and (2) ICESat-2 snow-off measurements. Snow depth () was calculated as:
where represents ICESat-2 ATL06/ATL08 surface elevation during snow-on conditions, is the ICESat-2 measured surface elevation during snow-off conditions, and is the DTM elevation from SnowEx snow-off campaigns (Table 1).
Direct pairing of ICESat-2 snow-on and snow-off measurements is challenging due to the 91-day repeat cycle and spatial mismatches between ground tracks from different cycles. However, when snow-on and snow-off observations are sufficiently collocated (e.g., distance between snow-on and snow-off observations less than 100 m), snow depth can be derived using Equation (1) (on–off method). This 100 m threshold is applied primarily in areas with low surface variability, such as tundra, where snow depth can be reliably estimated despite small spatial offsets. In more heterogeneous or steep terrain, closer co-location is required, as larger mismatches may introduce significant errors. When collocated ICESat-2 snow-off data are not available, SnowEx DTMs were used following Equation (2) (on-DTM method).
The snow depths derived from Equations (1) and (2) were compared and cross-validated (Section 5). Ensuring consistency between these surface elevation measurements is critical, since any bias in surface elevation directly propagates into snow depth retrieval errors when using the snow-on–off method described in Equations (1) and (2).
3.2. Snow Pathlength Method
An alternative approach to estimating snow depth is the pathlength method [23,24], which uses ICESat-2 measurements of multiple scattering signals returned from the snowpack. At 532 nm, pure snow is a weakly absorbing and highly diffusive medium [36]. Photons undergo many scattering events before exiting the snow surface. The photon-counting lidar [15] onboard ICESat-2 is able to detect these multiply scattered photons, providing valuable information on the photon pathlength distribution within the snowpack.
The ICESat-2 ATL03 geolocated photon product [37], which provides high vertical resolution of photon returns from both the snow surface and subsurface layers, was used to construct vertical snow profiles. Photons were aggregated into vertical bins of 15 cm and along-track bins of 7 m to generate the photon pathlength distribution, L(z). Snow depth can then be estimated as [22]:
where L(z) is the backscattered photon pathlength distribution measured by ICESat-2 [22,23], representing the total photon travel distance within the snowpack including contributions from multiple scattering, and z represents the travel distance of a photon within the snowpack, which is not a straight line due to multiple scattering, rather than the penetration depth which refers to the vertical distance below the snow surface. Snow depths derived from the pathlength method were subsequently compared against those obtained using the snow-on–off method (Equations (1) and (2)).
The pathlength method has the advantage of relying solely on ICESat-2 snow-on measurements. Therefore, it does not require (1) geoid corrections for surface elevation retrievals, (2) reference DTMs (Equation (2)), and (3) snow-off measurements (Equation (1)) [21,38]. Unlike passive microwave-based snow depth products (e.g., AMSR-E and AMSR2), which have spatial resolutions of tens of kilometers and are primarily reliable over first-year sea ice [39,40], the ICESat-2 pathlength method can be applied to both first-year and multi-year sea ice as well as terrestrial snow [22,39]. It provides snow depth estimates at spatial resolutions of only a few meters along the ground track.
3.3. ICESat-2 and SnowEx Consistency Assessment
The SnowEx data (DTM and snow depth) have a spatial resolution of 0.5 m, whereas the along-track resolution of the ICESat-2 ATL06 and ATL08 products is 20 m. To enable a consistent spatial comparison, the SnowEx data were aggregated to match the ICESat-2 scale. Specifically, for ICESat-2 results obtained from ATL06 and ATL08, SnowEx data were averaged over 40 pixels (0.5 m × 40 = 20 m) along the ICESat-2 track direction. For ICESat-2 snow depth derived using the pathlength method, which has a finer along-track resolution of 7 m, SnowEx data were aggregated over 14 pixels along the track. This aggregation ensures that the SnowEx-derived values, including surface elevation and snow depth, are spatially consistent with the corresponding ICESat-2 results.
To assess the consistency between ICESat-2 surface elevations (or snow depth) and SnowEx DTMs (or SnowEx snow depth), four statistical metrics were calculated: bias (Equation (4)), median difference (Equation (5)), mean absolute error (MAE) (Equation (6)), and root mean square error (RMSE) (Equation (7)):
where , and are the ICESat-2 and SnowEx surface elevations (or snow depth) at the i-th collocated pixel, respectively, and N is the total number of collocated ICESat-2 and SnowEx observations used in the analysis.
4. Surface Elevation Results
As shown in Equations (1) and (2), reliable snow depth retrieval using the snow-on–off method depends on consistent and accurate surface elevation measurements. In this section, we evaluate the agreement between ICESat-2 and SnowEx surface elevations during snow-off seasons.
ICESat-2 data collected between July and September from 2019 to 2024 were collocated with the SnowEx survey sites listed in Table 1 and Figure 1. To enable a consistent comparison with ICESat-2 surface elevations, SnowEx DTMs were first aggregated to match the ICESat-2 scale (Section 3.3), and linear interpolation was then applied to the aggregated SnowEx DTMs to obtain elevation values at the exact ICESat-2 measurement locations. ICESat-2 data from the snow-off period (July–September) spanning 2019–2024 were used. The data were collocated spatially with SnowEx measurements but not necessarily acquired simultaneously, assuming no significant land surface changes over these years. Figure 2 shows histograms of elevation differences, with ATL06 in red and ATL08 in blue, and median differences for each site. Averaged metrics for the five sites during the snow-off period are provided in Table 2.
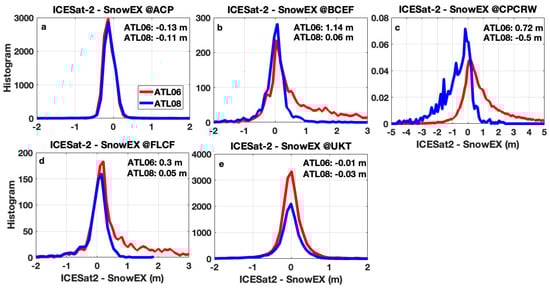
Figure 2.
Histogram of surface elevation differences between ICESat-2 and SnowEx in Alaska during snow-off seasons at (a) ACP, (b) BCEF, (c) CPCRW, (d) FLCF, and (e) UKT sites; Red curves correspond to ATL06 results, and blue curves to ATL08 results. The values indicated in the figure correspond to the median differences.
Table 2.
Comparison of ICESat-2 and SnowEx surface elevations at five Alaskan sites during snow-off periods (July–September 2019–2024).
ATL08 generally outperforms ATL06 across both tundra and forested regions. Over tundra sites (ACP and UKT), ATL06 biases are near zero (−0.01 m and 0.01 m) with RMSE of 1.28 m and 0.97 m, respectively. ATL08 reduces RMSE to 0.22 m at ACP and 0.52 m at UKT, with low biases (−0.10 m and −0.09 m). Both products are highly accurate over flat, sparsely vegetated terrain.
Table A1, along with Figure 3, summarizes ACP and UKT tundra performance from 2019 to 2024. ATL06 shows larger interannual errors, with high RMSE in 2019 (2.86 m at ACP, 1.47 m at UKT), improving in subsequent years. ATL08 consistently achieves lower bias and RMSE, with ACP RMSE stable at 0.18–0.28 m (2020–2024) versus 0.27–0.75 m for ATL06. At UKT, ATL08 RMSE ranges 0.36–0.84 m, lower than ATL06 (0.51–1.06 m), though errors increase slightly in 2024.
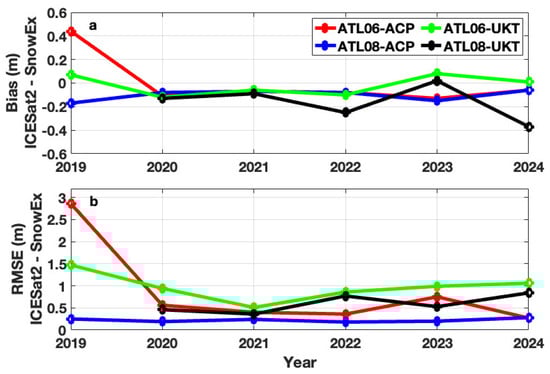
Figure 3.
Year-to-year comparison of ICESat-2 surface elevations relative to SnowEx from 2019 to 2024. (a) Bias and (b) RMSE of surface elevation differences. ATL06 results at ACP are shown in red and at UKT in green; ATL08 results at ACP are shown in blue and at UKT in black. ATL08 data for the UKT 2019 are not available.
In forested regions, canopy effects lead to larger discrepancies (e.g., Figure 4 and Table 2). At BCEF, ATL06 bias is 3.22 m (RMSE: 5.54 m), compared with ATL08 bias of 1.68 m (RMSE: 4.60 m). At CPCRW, ATL06 shows bias 1.82 m (RMSE: 3.81 m) and ATL08 −0.72 m (RMSE: 1.39 m). At FLCF, ATL06 has a bias of 1.31 m (RMSE: 2.90 m), while ATL08 achieves −0.05 m (RMSE: 0.64 m). Figure 4 illustrates a comparison of surface elevations over the BCEF boreal forest site. ICESat-2 measurements on 11 August 2022 (ATL03 photons: blue dots; ATL06: red; ATL08: purple) are compared with the SnowEx DTM from 28 May 2022 (green line). These data represent the collocated measurements over the BCEF region, whereas for other snow-free months in 2022, either no collocated data were available, or the number of collocated measurements was extremely limited. Both ATL06 and ATL08 follow the terrain, but ATL06 systematically overestimates elevations under dense canopy. ATL08 closely matches SnowEx, effectively capturing the ground surface beneath forest cover, with mean differences of 0.3 ± 0.8 m versus 7.5 ± 2.8 m for ATL06. These results highlight the improved capability of ATL08 in estimating surface elevations in forested environments, though dense forests remain challenging.
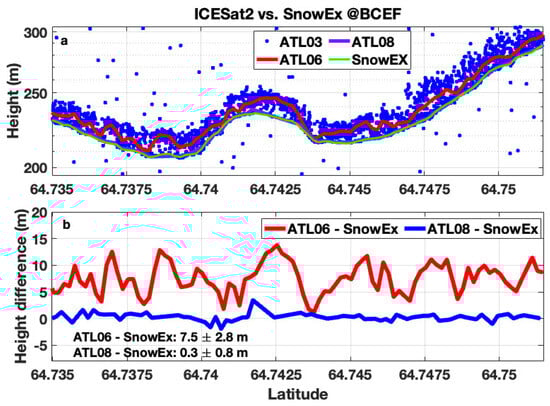
Figure 4.
(a) ICESat-2 photon heights (blue dots), surface elevations from ATL06 (red) and ATL08 (purple) on 11 August 2022, compared with SnowEx surface elevations (green) on 28 May 2022, over the BCEF region; (b) Surface elevation differences between ICESat-2 and SnowEx, with ATL06 shown in red and ATL08 in blue.
5. Snow Depth Results
The surface elevation comparisons with SnowEx DTMs presented in Section 4 demonstrated that (1) ICESat-2 surface elevation products achieve high accuracy over flat, sparsely vegetated tundra, (2) larger discrepancies occur in forested or mountainous regions due to canopy interference and topographic complexity, and (3) ATL08 generally outperforms ATL06 in capturing ground elevations beneath forest cover (e.g., Figure 4). Building on these results, we evaluate ICESat-2 snow depth retrievals derived from the snow-on–off method (Equations (1) and (2), using ATL08 elevations) and the pathlength method (Equation (3), using ATL03 photon pathlength distributions) against SnowEx measurements.
5.1. ICESat-2 vs. SnowEx Snow Depth
Figure 5 presents snow depth comparisons for tundra (upper panels) and boreal forest (lower panels) in March 2022 and 2023. Figure 5a,c shows snow depth histograms from the snow-on-DTM method (green), the pathlength method (red), and SnowEx (blue), while Figure 5b,d illustrates depth differences. Numbers indicate the median and standard deviation for each curve. Table 3 summarizes statistical metrics of these comparisons. Additional cases of snow depth comparisons between SnowEx field measurements and ICESat-2 retrievals along satellite ground tracks are provided in Figure A1, Figure A2, Figure A3, Figure A4, Figure A5, Figure A6, Figure A7, Figure A8, Figure A9, Figure A10, Figure A11, Figure A12, Figure A13 and Figure A14 in Appendix A. Table A2 lists the corresponding measurement dates for SnowEx and ICESat-2. Because coincident measurements at the same location and date are not available, temporal and spatial differences may contribute to bias between SnowEx and ICESat-2 snow depth results (see Section 6.1).
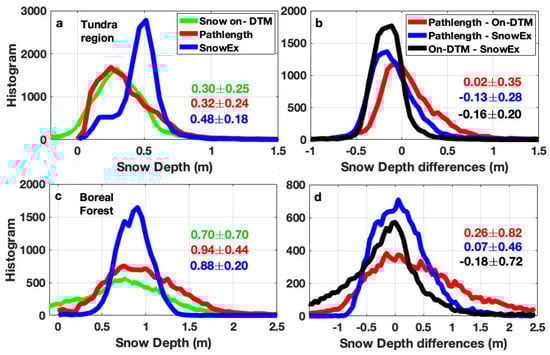
Figure 5.
Histogram plots of snow depth (a,c) and snow depth differences (b,d) for March 2022 and 2023 over Alaska tundra (upper panels) and boreal forests (lower panels). Numbers indicate the median and standard deviation for each curve. Snow depth biases relative to SnowEx are largely due to temporal offsets between ICESat-2 and SnowEx snow-on measurements (see Section 6 and Appendix A). The snow-on-DTM (green) and pathlength methods (red) in panels (a,c), which use the same ICESat-2 snow-on measurements, show good agreement.
Table 3.
Snow depth comparisons at the Alaska Boreal Forest and Tundra regions in March 2022 and 2023.
Over tundra, both ICESat-2 methods show close agreement with SnowEx, with small median biases (−0.16 to −0.13 m) and low RMSE values (0.25–0.30 m). The snow depth biases relative to SnowEx may be attributable to temporal offsets of up to 18 days between ICESat-2 and SnowEx snow-on measurements (Table A2 and Section 6.1). For the same day snow measurements, the snow depths from ICESat-2 snow-on-DTM and pathlength methods indicate even a small bias of 0.06 m with a median bias of 0.02 m, as shown in Table 3. These findings are consistent with the surface elevation validation (Section 4), where ICESat-2 agrees closely with SnowEx DTM data, achieving centimeter-level (~ 1 cm) accuracy over flat, open terrain. These results confirm the reliability of both ICESat-2 snow depth retrieval approaches in tundra environments.
In contrast, boreal forest sites show larger discrepancies. The snow-on-DTM method substantially underestimates depths (bias = −0.27 m, RMSE = 0.77 m), whereas the pathlength method performs better (bias = 0.11 m, RMSE = 0.47 m). Broader histograms and higher error statistics in forests (lower panels in Figure 5) highlight the influence of canopy cover, sub-canopy air gaps, and complex terrain on snow depth retrievals (see Section 6.2). These effects are consistent with SnowEx findings, which reported a SnowEx snow depth bias of ~10 cm in boreal forest and ~1 cm in tundra, with RMSE values ranging from 6.3 cm (tundra) to 12.1 cm (forest) [12]. The larger errors in the forest are likely due to basal vegetation layers and snowpack structural heterogeneity when using the snow-on–off method. The pathlength method produces errors within the reported SnowEx uncertainty, demonstrating more robust performance than the snow-on–off method in boreal forest regions (see Section 6.2).
Figure 6 presents examples of snow depth comparisons at the ACP site along ICESat-2 ground tracks on 4 March 2022 and 2 March 2023, with corresponding SnowEx measurements on 12 March 2022 and 10 March 2023, respectively. For the ICESat-2 snow-on measurements from these two days, collocated snow-off measurements from 9 June 2019, were used for the snow-on–off retrievals. In the plots, SnowEx snow depths are shown in blue, ICESat-2 snow-on-DTM estimates in green, snow-on–off estimates in black, and pathlength method estimates in red. The corresponding SnowEx DTMs are shown in gray, corresponding to the right y-axis.
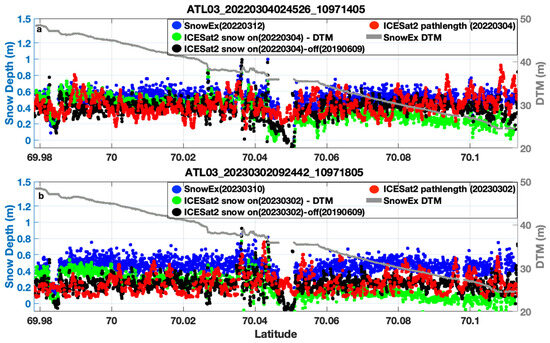
Figure 6.
Snow depth comparison at the ACP site in (a) March 2022 and (b) March 2023 from the SnowEx campaign (blue), ICESat-2 snow-on-DTM (green), ICESat-2 snow on–off (black), and ICESat-2 pathlength method (red). Surface elevations from SnowEx DTM show on the right y-axis (gray). Larger snow depth from SnowEx, ICESat2 snow-on-DTM, and ICESat-2 snow on–off at 70.027°N, 70.036°N, and 70.044°N due to steeply sloped terrain.
Results indicate that the snow-on–off method (green and black) produces larger snow depths (e.g., >1 m) over steep terrain (e.g., at 70.027°N, 70.036°N, and 70.044°N), likely due to the geolocation mismatch of the snow-on and snow-off measurements. The snow-on-DTM method yields the lowest snow depths at latitudes > 70.08°N, because SnowEx DTMs are generally higher than ICESat-2 surface elevations during snow-off periods at the ACP site (Table 2 and Table A1), leading to underestimated snow depths using the on-DTM method (Equation (2)). Compared with snow-on-DTM results (green in Figure 6), the pathlength (red) method agrees very well with snow-on–off estimates (black). This is because the two methods only use ICESat-2 measurements.
Table 4 gives the corresponding snow depth averaged metrics. The snow depth comparisons between different retrieval methods and SnowEx ground measurements for March 2022 and March 2023 indicate consistent performance trends. The pathlength method shows the smallest bias and lowest RMSE relative to SnowEx, demonstrating strong agreement and reliability. The snow-on–off method performs slightly worse than the pathlength approach but still outperforms the snow-on-DTM method. The snow-on-DTM method exhibits the largest negative bias, particularly in March 2023 (−0.26 m), likely due to terrain representation mismatches or geolocation misalignments. Cross-comparisons between the pathlength and ICESat-2 methods (on-DTM and on–off) show small internal biases (≤0.06 m), underscoring consistency among the satellite-based approaches.
Table 4.
Snow Depth Comparisons in March at the ACP site.
Overall, these results confirm that ICESat-2 snow depth retrievals are highly reliable in tundra environments, while in forests the pathlength method provides a clear improvement over the snow-on-DTM approach. The superior performance of the pathlength method arises because it relies on photon distributions within the snowpack, making it less sensitive to canopy height, geolocation uncertainty, misalignments, terrain changes, and complexity.
5.2. ICESat-2 Snow-On-DTM vs. Pathlength Snow Depth
To further compare the snow-on-DTM and pathlength retrieval methods, ICESat-2 measurements from December to March between 2020 and 2024 over SnowEx’s five survey sites were analyzed. Snow depth distributions over Alaska tundra and boreal forest regions are shown in Figure 7, with corresponding statistical metrics summarized in Table 5. Because coincident SnowEx and ICESat-2 measurements at the same location and date are not available, direct scatter plots between SnowEx and ICESat-2 are not presented. Instead, Figure 7 shows snow depths retrieved using the pathlength method (y-axis) and snow-on-DTM method (x-axis) based solely on ICESat-2 snow-on measurements.
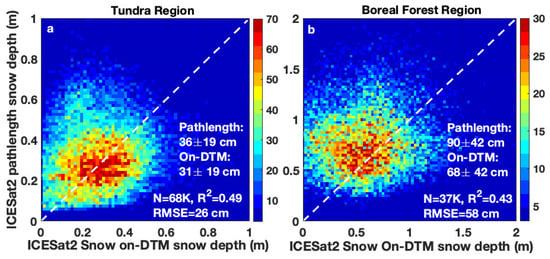
Figure 7.
Comparison of snow depth retrieved by snow-on-DTM (x-axis) and pathlength (y-axis) methods over Alaska tundra (a) and boreal forests (b) in December–March from 2020 to 2024. Colors indicate the collocated measurements. The 1:1 line is plotted as a white dashed line.
Table 5.
Snow Depth Comparisons in December–March from 2020 to 2024.
On average, boreal forests exhibit deeper snow (pathlength: 90 ± 42 cm; on-DTM: 68 ± 42 cm), while tundra regions show shallower depths (pathlength: 36 ± 19 cm; on-DTM: 31 ± 19 cm), consistent with in situ snow depth measurements in March 2023, which reported mean snow depths of 71 cm (FLCF), 79 cm (BCEF), and 86 cm (CPCRW) in boreal forests, and 34 cm (ACP) and 45 cm (UKT) in tundra regions [13]. The comparison between the two methods reveals generally good agreement in tundra, with a small positive bias (5 cm), low median difference (4 cm), and modest RMSE (26 cm). In contrast, boreal forests display larger discrepancies, with the pathlength method reporting deeper snow (bias = 22 cm, RMSE = 58 cm). The broader spread and lower coefficient of determination (R2 = 0.43) in forests highlight the challenges introduced by canopy cover and complex terrain. The two ICESat-2 snow depth methods are consistent in tundra regions but diverge under forested conditions.
6. Discussion
6.1. Temporal Variability in Snow Depth Measurements
To assess snow depth variability associated with differences in measurement timing between SnowEx and ICESat-2, we use daily snow depth observations from nearby SNOTEL (SNOw TELemetry) stations as an independent ground-based reference [41,42,43]. The SNOTEL observation network, operated by the U.S. Natural Resources Conservation Service (NRCS), consists of automated weather stations located primarily in mountainous and high-elevation regions of Alaska and the western United States. These stations provide continuous observations of snowpack and related meteorological variables, including air temperature, precipitation, snow water equivalent (SWE), and snow depth [43]. Snow depth is measured using acoustic sensors mounted on a tower, which determine the distance to the snow surface relative to the height of the sensor, with measurements typically recorded at hourly or daily intervals.
Figure 8 illustrates the time series of daily snow depth from SNOTEL stations near the ACP sites (panels a and b at Sagwon and Prudhoe Bay) and the UKT site (panel c at Imnaviat Creek) for March 2022 (blue line) and 2023 (red line). Vertical dashed lines indicate ICESat-2 observation dates in 2022 (blue) and 2023 (red), while vertical solid lines mark SnowEx measurement dates for the corresponding years. Snow depth exhibits both interannual and intramonth variability, with generally higher and more stable values in 2022 than in 2023 at the ACP sites (Figure 8a,b), and larger mid-March accumulation followed by melt at the UKT site (Figure 8c). SNOTEL daily snow depth observations further indicate that differences in snow depth between the ICESat-2 and SnowEx measurement dates are typically on the order of several centimeters and can reach up to ~13 cm, highlighting the influence of observation timing on snow depth comparisons.
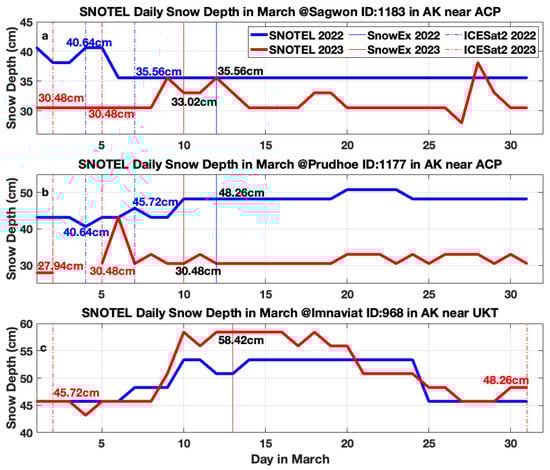
Figure 8.
Time series of daily snow depth from SNOTEL stations near ACP (a,b) and UKT (c) sites in March 2022 (blue line) and 2023 (red line). Vertical dashed lines indicate ICESat-2 measurement dates in 2022 (blue) and 2023 (red), while vertical solid lines indicate SnowEx measurement dates in 2022 (blue) and 2023 (red).
Table 6 further compares daily mean snow depth at the ACP and UKT sites with nearby SNOTEL stations from SnowEx field measurements, pathlength, snow-on DTM, and ICESat-2 snow-on–off methods for March 2022 and 2023. The distances between the ACP site and Sagwon (~80 km), the ACP site to Prudhoe Bay (~180 km), and the UKT site and Imnaviat Creek (~15 km) indicate that spatial heterogeneity is an important source of discrepancy. Overall, SnowEx measurements generally yield the largest mean snow depths, while the pathlength, snow-on DTM, and ICESat-2 snow-on–off methods show very good agreement with each other. These methods produce intermediate values between SnowEx and SNOTEL, although variability remains across sites and years.
Table 6.
Daily Mean Snow Depth derived by each method at ACP, UKT, and SNOTEL sites.
6.2. Influence of Terrain and Vegetation on Snow Depth Retrieval Methods
To evaluate the performance of different snow depth retrieval methods across diverse site conditions, Table 7 summarizes mean snow depth for December–March in 2022 and 2023 at each site as derived by the SnowEx field campaign, snow-on-DTM, and pathlength methods. Across sites and years, the snow-on-DTM method generally produces lower mean snow depth estimates than SnowEx, particularly in the CPCRW boreal forest region. This underestimation is likely associated with residual geolocation and elevation uncertainties in the snow-free reference DTM, as well as the influence of canopy cover and surface roughness, which complicate accurate surface elevation retrievals in forested and heterogeneous terrain (see Section 4). Interannual differences between 2022 and 2023 are evident at all sites, reflecting natural variability in seasonal snow accumulation.
Table 7.
Mean Snow Depth in December–March for 2022 and 2023 at each site as derived by each method.
In contrast, the pathlength method yields comparable or higher snow depth estimates relative to SnowEx at several sites, with notably larger values at BCEF and CPCRW boreal forest region. These higher estimates are consistent with the generally thicker snowpack observed in forested environments. In comparison, SnowEx snow depth values, which are also retrieved using the snow-on–off method, can be more strongly affected by canopy height in forest regions, leading to increased sensitivity to vegetation structure.
Figure 9 further examines the influence of vegetation by comparing snow depth estimates from the pathlength method and the SnowEx snow-on–off approach as a function of canopy height for boreal forest (Figure 9a,b) and tundra (Figure 9c,d) environments, with canopy height obtained from the ICESat-2 ATL08 product. Over tundra sites, both methods display more compact snow depth distributions, consistent with more homogeneous, sparsely vegetated conditions. However, in boreal forest environments, SnowEx snow-on–off estimates exhibit a clear negative relationship between snow depth and canopy height, indicating reduced retrieved snow depth under taller canopies and highlighting the increasing influence of canopy structure on snow-on–off retrievals. By contrast, the pathlength method shows broader scatter and a weaker systematic dependence on canopy height, particularly in forested areas. This broad variability likely reflects the increased sensitivity of the pathlength method to multiple scattering within deeper or denser snowpacks, as well as enhanced variability in photon pathlength distributions under complex terrain and vegetation conditions.
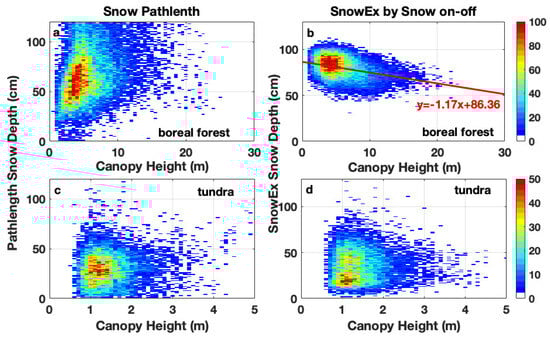
Figure 9.
Snow depth as a function of canopy height derived from the pathlength (a,c) and SnowEx snow-on–off (b,d) methods over boreal forest (a,b) and tundra (c,d) sites.
7. Conclusions
This study assessed ICESat-2 surface elevation accuracy and snow depth retrieval performance across Alaska tundra and boreal forest environments using SnowEx measurements as reference. Validation against SnowEx DTMs shows that ICESat-2 surface elevation products perform well over flat, sparsely vegetated tundra, with ATL08 consistently outperforming ATL06, while forested environments introduce larger uncertainties due to canopy effects.
Snow depth comparisons indicate that both the snow-on–off and pathlength methods provide reliable estimates in tundra environments. In contrast, the pathlength method demonstrates more robust performance in boreal forests, as it relies on photon scattering behavior within the snowpack rather than absolute surface elevation estimates.
These findings advance our understanding of ICESat-2’s capabilities for snowpack and surface monitoring and provide practical guidance for selecting optimal snow depth retrieval approaches across heterogeneous landscapes. Future work will focus on further refining these methods to better account for complex terrain and dense vegetation, including integration with customized products generated using the SlideRule Earth service [44] to enhance ICESat-2 surface elevation retrieval from photon clouds. In addition, machine learning approaches will be explored to process ICESat-2 photon data and improve snow depth retrievals using the pathlength method.
Author Contributions
Conceptualization, X.L. and Y.H.; methodology, Y.H. and X.L.; software, X.L.; validation, X.L., Y.H. and Z.F.; formal analysis, X.L.; writing—original draft preparation, X.L.; writing—review and editing, X.L., Y.H., N.K., A.O., T.K. and Z.F.; supervision, A.O. and N.K.; project administration, N.K.; funding acquisition, X.L. All authors have read and agreed to the published version of the manuscript.
Funding
This research was funded by the NASA ICESat-2 award, grant number 80NSSC21K0910, and the Terrestrial Hydrology Program. The authors thank the NASA ICESat-2 science teams and the National Snow and Ice Data Center (NSIDC) for providing the ATL03, ATL06, ATL08, and SnowEx datasets used in this study.
Data Availability Statement
The authors thank the NASA ICESat-2 science teams and the National Snow and Ice Data Center (NSIDC) for providing the ATL03, ATL06, ATL08, and SnowEx datasets used in this study. The ICESat-2 data used in this study are publicly available and can be freely accessed via NSIDC https://nsidc.org/data/icesat-2/products (accessed on 16 January 2026). SNOTEL data are available for download at https://wcc.sc.egov.usda.gov/reportGenerator/ (accessed on 16 January 2026).
Acknowledgments
Special thanks are extended to Craig Ferguson (NASA HQ) and Tom Neumann (NASA GSFC) for their support of the snow research. This work was supported by the NASA ICESat-2 award (80NSSC21K0910) and the Terrestrial Hydrology Program. The authors declare no conflicts of interest.
Conflicts of Interest
The authors declare no conflicts of interest.
Abbreviations
The following abbreviations are used in this manuscript:
| ACP | Arctic Coastal Plain, with latitude: 69.9762°N–70.1206°N and longitude: 148.869°W–148.5078°W |
| BCEF | Bonanza Creek Experimental Forest, with latitude: 64.6843°N–64.7525°N and longitude: 148.3455°W–148.2366°W |
| CPCRW | Caribou Poker Creek Watershed, with latitude: 65.1256°N–65.2446°N and longitude: 147.6806°W–147.3271°W |
| FLCF | Farmer’s Loop/Creamer’s Field, with latitude: 64.8580°N–64.8888°N and longitude: 147.7543°W–147.6618°W |
| UKT | Upper Kuparuk Toolik with latitude: 68.4684°N–68.6544°N and longitude: 149.6367°W–149.1634°W |
Appendix A
Table A1 summarizes ICESat-2 surface elevation statistics for July–September at ACP and UKT tundra sites from 2019 to 2024. Table A2 lists seven selected cases across the ACP, CPCRW, FLCP, BCEF, and UKT regions from 2022 to 2023. Figure A1, Figure A2, Figure A3, Figure A4, Figure A5, Figure A6, Figure A7, Figure A8, Figure A9, Figure A10, Figure A11, Figure A12, Figure A13 and Figure A14 show snow depth comparisons between SnowEx field measurements and ICESat-2 retrievals using two methods: the pathlength method and the on–off method. The pathlength method was applied to all ICESat-2 snow-on measurements, while the on–off method was used only when corresponding snow-off data were available.
Table A1.
ICESat-2 surface elevation statistics for July–September across different years at ACP and UKT tundra sites.
Table A1.
ICESat-2 surface elevation statistics for July–September across different years at ACP and UKT tundra sites.
| Region | Year | Product | Bias (m) | Median (m) | MAE (m) | RMSE (m) | N |
|---|---|---|---|---|---|---|---|
| ACP | 2019 | ATL06 | 0.44 | −0.18 | 0.80 | 2.86 | 2184 |
| ATL08 | −0.17 | −0.17 | 0.18 | 0.25 | 1812 | ||
| 2020 | ATL06 | −0.11 | −0.12 | 0.17 | 0.56 | 1978 | |
| ATL08 | −0.08 | −0.09 | 0.14 | 0.19 | 1900 | ||
| 2021 | ATL06 | −0.07 | −0.08 | 0.16 | 0.40 | 2208 | |
| ATL08 | −0.07 | −0.06 | 0.14 | 0.24 | 1648 | ||
| 2022 | ATL06 | −0.08 | −0.12 | 0.16 | 0.36 | 1776 | |
| ATL08 | −0.08 | −0.09 | 0.13 | 0.18 | 1414 | ||
| 2023 | ATL06 | −0.13 | −0.18 | 0.25 | 0.75 | 2919 | |
| ATL08 | −0.15 | −0.16 | 0.17 | 0.20 | 1838 | ||
| 2024 | ATL06 | −0.06 | −0.04 | 0.14 | 0.27 | 1357 | |
| ATL08 | −0.06 | −0.02 | 0.14 | 0.28 | 1314 | ||
| UKT | 2019 | ATL06 | 0.07 | 0.08 | 0.58 | 1.47 | 2892 |
| 2020 | ATL06 | −0.12 | −0.06 | 0.27 | 0.94 | 2470 | |
| ATL08 | −0.13 | −0.07 | 0.23 | 0.46 | 1564 | ||
| 2021 | ATL06 | −0.06 | −0.04 | 0.19 | 0.51 | 4962 | |
| ATL08 | −0.09 | −0.04 | 0.20 | 0.36 | 3844 | ||
| 2022 | ATL06 | −0.10 | −0.10 | 0.29 | 0.86 | 1866 | |
| ATL08 | −0.25 | −0.13 | 0.33 | 0.77 | 1291 | ||
| 2023 | ATL06 | 0.08 | 0.08 | 0.36 | 0.99 | 4993 | |
| ATL08 | 0.02 | 0.07 | 0.30 | 0.53 | 3677 | ||
| 2024 | ATL06 | 0.01 | −0.01 | 0.42 | 1.06 | 1834 | |
| ATL08 | −0.37 | −0.10 | 0.47 | 0.84 | 464 |
Table A2.
Cases for the snow depth comparisons between SnowEx and ICESat-2.
Table A2.
Cases for the snow depth comparisons between SnowEx and ICESat-2.
| Cases | SnowEx Snow On | ICESat-2 Snow On | ICESat-2 Snow Off | Regions |
|---|---|---|---|---|
| Case 1 | 12 March 2022 | 7 March 2022 | 3 September 2023 | ACP region Figure A1 and Figure A2 |
| Case 2 | 10 March 2023 | 5 March 2023 | 11 September 2023 | ACP region Figure A3 and Figure A4 |
| Case 3 | 11 March 2022 | 21 March 2022 | 22 September 2020 | CPCRW region Figure A5 and Figure A6 |
| Case 4 | 11 March 2023 | 19 March 2023 | No matched snow-off data | CPCRW region Figure A7 and Figure A8 |
| Case 5 | 11 March 2022 | 21 March 2022 | No matched snow-off data | FLCP region Figure A9 and Figure A10 |
| Case 6 | 11 March 2023 | 13 March 2023 | No matched snow-off data | BCEF region Figure A11 and Figure A12 |
| Case 7 | 13 March 2023 | 31 March 2023 | No matched snow-off data | UKT region Figure A13 and Figure A14 |

Figure A1.
Snow map from SnowEx on 12 March 2022, over the ACP region, showing ICESat-2 footprints from the strong beams: beam 1 (black), beam 2 (green), and beam 3 (red) measured on 7 March 2022.

Figure A2.
Snow depth comparisons along ICESat-2 strong beam 2 (upper panel) and beam 3 (lower panel) as shown in Figure A1. Blue dots indicate SnowEx measurements, red dots represent snow depth from the pathlength method, and green dots show snow depth from the snow-on–off method.

Figure A3.
Snow map from SnowEx on March 10, 2023, over the ACP region, showing ICESat-2 footprints from the strong beams: beam 1 (black), beam 2 (green), and beam 3 (red) measured on 5 March 2023.

Figure A4.
Snow depth comparisons along ICESat-2 strong beam 2 (upper panel) and beam 3 (lower panel) as shown in Figure A3. Blue dots indicate SnowEx measurements, red dots represent snow depth from the pathlength method, and green dots show snow depth from the snow-on–off method.

Figure A5.
Snow map from SnowEx on 11 March 2022, over CPCRW region, showing ICESat-2 footprints from the strong beams: beam 1 (black), beam 2 (green), and beam 3 (red) measured on 21 March 2022.

Figure A6.
Snow depth comparisons along ICESat-2 strong beam 1 (upper panel), beam 2 (middle), and beam 3 (lower panel) as shown in Figure A5. Blue dots indicate SnowEx measurements, red dots represent snow depth from the pathlength method, and green dots show snow depth from the snow-on–off method.

Figure A7.
Snow map from SnowEx on 11 March 2023, over CPCRW region, showing ICESat-2 footprints from the strong beams: beam 1 (black), beam 2 (green), and beam 3 (red) measured on 19 March 2023.

Figure A8.
Snow depth comparisons along ICESat-2 strong beam 1 (upper panel), beam 2 (middle), and beam 3 (lower panel) as shown in Figure A7. Blue dots indicate SnowEx measurements; red dots represent snow depth from the pathlength method.

Figure A9.
Snow map from SnowEx on March 11, 2022, over the FLCP region, showing ICESat-2 footprints from the strong beams: beam 1 (black), beam 2 (green), and beam 3 (red) measured on 21 March 2022.

Figure A10.
Snow depth comparisons along ICESat-2 strong beam 3, as shown in Figure A9. Blue dots indicate SnowEx measurements; red dots represent snow depth from the pathlength method.

Figure A11.
Snow map from SnowEx on 11 March 2023, over the BCEF region, showing ICESat-2 footprints from the strong beams: beam 1 (black), beam 2 (green), and beam 3 (red) measured on 13 March 2023.

Figure A12.
Snow depth comparisons along ICESat-2 strong beam 2, as shown in Figure A11. Blue dots indicate SnowEx measurements; red dots represent snow depth from the pathlength method.

Figure A13.
Snow map from SnowEx on 13 March 2023, over the UKT region, showing ICESat-2 footprints from the strong beams: beam 1 (black), beam 2 (green), and beam 3 (red) measured on 31 March 2023.

Figure A14.
Snow depth comparisons along ICESat-2 strong beam 1, as shown in Figure A13. Blue dots indicate SnowEx measurements; red dots represent snow depth from the pathlength method, and green dots show snow depth from the snow-on-DTM method.
References
- Ye, K.; Cohen, J.; Chen, H.W.; Zhang, S.; Luo, D.; Hamouda, M.E. Attributing Climate and Weather Extremes to Northern Hemisphere Sea Ice and Terrestrial Snow: Progress, Challenges and Ways Forward. NPJ Clim. Atmos. Sci. 2025, 8, 166. [Google Scholar] [CrossRef]
- Demil, G.; Haghighi, A.T.; Klöve, B.; Oussalah, M. Advances in Image-Based Estimation of Snow Variable: A Systematic Literature Review on Recent Studies. J. Hydrol. 2025, 654, 132855. [Google Scholar] [CrossRef]
- Bormann, K.J.; Brown, R.D.; Derksen, C.; Painter, T.H. Estimating Snow-Cover Trends from Space. Nat. Clim. Change 2018, 8, 924–928. [Google Scholar] [CrossRef]
- Gascoin, S.; Luojus, K.; Nagler, T.; Lievens, H.; Masiokas, M.; Jonas, T.; Zheng, Z.; Rosnay, P.D. Remote Sensing of Mountain Snow from Space: Status and Recommendations. Front. Earth Sci. 2024, 12, 1381323. [Google Scholar] [CrossRef]
- Fair, Z.; Vuyovich, C.; Neumann, T.A.; Larsen, C.; Stuefer, S.L.; Mason, M.; May, L.D. Characterizing ICESat-2 Snow Depths Over the Boreal Forests and Tundra of Alaska in Support of the SnowEx 2023 Campaign. ESS Open Arch. 2024, 61, e2024WR039076. [Google Scholar] [CrossRef]
- Pirazzini, R.; Leppänen, L.; Picard, G.; Lopez-Moreno, J.I.; Marty, C.; Macelloni, G.; Kontu, A.; von Lerber, A.; Tanis, C.M.; Schneebeli, M.; et al. European In-Situ Snow Measurements: Practices and Purposes. Sensors 2018, 18, 2016. [Google Scholar] [CrossRef]
- Deems, J.S.; Painter, T.H.; Finnegan, D.C. Lidar Measurement of Snow Depth: A Review. J. Glaciol. 2013, 59, 467–479. [Google Scholar] [CrossRef]
- Markus, T.; Cavalieri, D.J. Snow Depth Distribution Over Sea Ice in the Southern Ocean from Satellite Passive Microwave Data. In Antarctic Sea Ice: Physical Processes, Interactions and Variability; American Geophysical Union (AGU): Washington, DC, USA, 1998; pp. 19–39. ISBN 978-1-118-66824-5. [Google Scholar]
- Cavalieri, D.J.; Markus, T.; Comiso, J.C. AMSR-E/Aqua Daily L3 12.5 km Brightness Temperature, Sea Ice Concentration, & Snow Depth Polar Grids, Version 3; NASA National Snow and Ice Data Center Distributed Active Archive Center: Boulder, CO, USA, 2014. [Google Scholar] [CrossRef]
- Tedesco, M.; Narvekar, P.S. Assessment of the NASA AMSR-E SWE Product. IEEE J. Sel. Top. Appl. Earth Obs. Remote Sens. 2010, 3, 141–159. [Google Scholar] [CrossRef]
- Hall, D.K.; Riggs, G.A. Accuracy Assessment of the MODIS Snow Products. Hydrol. Process. 2007, 21, 1534–1547. [Google Scholar] [CrossRef]
- Hall, D.K.; Riggs, G.A.; Salomonson, V.V.; DiGirolamo, N.E.; Bayr, K.J. MODIS Snow-Cover Products. Remote Sens. Environ. 2002, 83, 181–194. [Google Scholar] [CrossRef]
- Stuefer, S.L.; Hale, K.; May, L.D.; Mason, M.; Vuyovich, C.; Marshall, H.-P.; Vas, D.; Elder, K. Snow Depth Measurements from Arctic Tundra and Boreal Forest Collected during NASA SnowEx Alaska Campaign. Sci. Data 2025, 12, 919. [Google Scholar] [CrossRef] [PubMed]
- Kim, E.; Gatebe, C.; Hall, D.; Newlin, J.; Misakonis, A.; Elder, K.; Marshall, H.P.; Hiemstra, C.; Brucker, L.; De Marco, E.; et al. NASA’s Snowex Campaign: Observing Seasonal Snow in a Forested Environment. In Proceedings of the 2017 IEEE International Geoscience and Remote Sensing Symposium (IGARSS), Fort Worth, TX, USA, 23–28 July 2017; pp. 1388–1390. [Google Scholar]
- Markus, T.; Neumann, T.; Martino, A.; Abdalati, W.; Brunt, K.; Csatho, B.; Farrell, S.; Fricker, H.; Gardner, A.; Harding, D.; et al. The Ice, Cloud, and Land Elevation Satellite-2 (ICESat-2): Science Requirements, Concept, and Implementation. Remote Sens. Environ. 2017, 190, 260–273. [Google Scholar] [CrossRef]
- Magruder, L.; Neumann, T.; Kurtz, N. ICESat-2 Early Mission Synopsis and Observatory Performance. Earth Space Sci. 2021, 8, e2020EA001555. [Google Scholar] [CrossRef] [PubMed]
- Magruder, L.A.; Neumann, T.; Kurtz, N.; Sutterley, T.C.; Hancock, D.; Vornberger, P.; Robbins, J.; Smith, B. Assessment of the Ice, Cloud, and Land Elevation Satellite-2 Performance Against Prime Mission Science Requirements. Earth Space Sci. 2025, 12, e2025EA004221. [Google Scholar] [CrossRef]
- Besso, H.; Shean, D.; Lundquist, J.D. Mountain Snow Depth Retrievals from Customized Processing of ICESat-2 Satellite Laser Altimetry. Remote Sens. Environ. 2024, 300, 113843. [Google Scholar] [CrossRef]
- Enderlin, E.M.; Elkin, C.M.; Gendreau, M.; Marshall, H.P.; O’Neel, S.; McNeil, C.; Florentine, C.; Sass, L. Uncertainty of ICESat-2 ATL06- and ATL08-Derived Snow Depths for Glacierized and Vegetated Mountain Regions. Remote Sens. Environ. 2022, 283, 113307. [Google Scholar] [CrossRef]
- Deschamps-Berger, C.; Gascoin, S.; Shean, D.; Besso, H.; Guiot, A.; López-Moreno, J.I. Evaluation of Snow Depth Retrievals from ICESat-2 Using Airborne Laser-Scanning Data. Cryosphere 2023, 17, 2779–2792. [Google Scholar] [CrossRef]
- Hu, X.; Hao, X.; Wang, J.; Huang, G.; Li, H.; Yang, Q. Can the Depth of Seasonal Snow Be Estimated From ICESat-2 Products: A Case Investigation in Altay, Northwest China. IEEE Geosci. Remote Sens. Lett. 2022, 19, 2000405. [Google Scholar] [CrossRef]
- Lu, X.; Hu, Y.; Zeng, X.; Stamnes, S.A.; Neuman, T.A.; Kurtz, N.T.; Yang, Y.; Zhai, P.-W.; Gao, M.; Sun, W.; et al. Deriving Snow Depth from ICESat-2 Lidar Multiple Scattering Measurements: Uncertainty Analyses. Front. Remote Sens. 2022, 3, 891481. [Google Scholar] [CrossRef]
- Hu, Y.; Lu, X.; Zeng, X.; Stamnes, S.A.; Neuman, T.A.; Kurtz, N.T.; Zhai, P.; Gao, M.; Sun, W.; Xu, K.; et al. Deriving Snow Depth From ICESat-2 Lidar Multiple Scattering Measurements. Front. Remote Sens. 2022, 3, 855159. [Google Scholar] [CrossRef]
- Hu, Y.; Lu, X.; Zeng, X.; Gatebe, C.; Fu, Q.; Yang, P.; Weimer, C.; Stamnes, S.; Baize, R.; Omar, A.; et al. Linking Lidar Multiple Scattering Profiles to Snow Depth and Snow Density: An Analytical Radiative Transfer Analysis and the Implications for Remote Sensing of Snow. Front. Remote Sens. 2023, 4, 1202234. [Google Scholar] [CrossRef]
- Kurtz, N.T.; Farrell, S.L. Large-Scale Surveys of Snow Depth on Arctic Sea Ice from Operation IceBridge. Geophys. Res. Lett. 2011, 38, L20505. [Google Scholar] [CrossRef]
- Broxton, P.; Zeng, X.; Dawson, N. Daily 4 km Gridded SWE and Snow Depth from Assimilated In-Situ and Modeled Data over the Conterminous US, Version 1; NASA National Snow and Ice Data Center Distributed Active Archive Center: Boulder, CO, USA, 2019. [Google Scholar] [CrossRef]
- Brown, R.D.; Brasnett, B. Canadian Meteorological Centre (CMC) Daily Snow Depth Analysis Data, Version 1; NASA National Snow and Ice Data Center Distributed Active Archive Center: Boulder, CO, USA, 2010. [Google Scholar] [CrossRef]
- Neumann, T.; Brenner, A.; Hancock, D.; Robbins, J.; Saba, J.; Harbeck, K.; Gibbons, A.; Lee, J.; Luthcke, S.; Rebold, T. ICE, CLOUD, and Land Elevation Satellite—2 (ICESat-2) Project Algorithm Theoretical Basis Document (ATBD) for Global Geolocated Photons ATL03. NASA Goddard Space Flight CenterGreenbelt Md. 2018. Available online: https://icesat-2.gsfc.nasa.gov/science/data_products/previous_release (accessed on 16 January 2026).
- Lu, X.; Hu, Y.; Yang, Y.; Vaughan, M.; Palm, S.; Trepte, C.; Omar, A.; Lucker, P.; Baize, R. Enabling Value Added Scientific Applications of ICESat-2 Data with Effective Removal of Afterpulses. Earth Space Sci. 2021, 8, e2021EA001729. [Google Scholar] [CrossRef] [PubMed]
- Lu, X.; Hu, Y.; Yang, Y. Ocean Subsurface Study from ICESat-2 Mission. In Proceedings of the 2019 Photonics & Electromagnetics Research Symposium—Fall (PIERS-Fall), Xiamen, China, 17 December 2019; pp. 910–918. [Google Scholar]
- Lu, X.; Hu, Y.; Yang, Y.; Bontempi, P.; Omar, A.; Baize, R. Antarctic Spring Ice-Edge Blooms Observed from Space by ICESat-2. Remote Sens. Environ. 2020, 245, 111827. [Google Scholar] [CrossRef]
- Smith, B.; Adusumilli, S.; Csatho, B.M.; Felikson, D.; Fricker, H.; Gardner, A.; Holschuh, N.; Lee, J.; Nilsson, J.; Paolo, F.; et al. ATLAS/ICESat-2 L3A Land Ice Height, Version 6; National Snow and Ice Data Center: Boulder, CO, USA, 2023. [Google Scholar]
- Neuenschwander, A.; Pitts, K. The ATL08 Land and Vegetation Product for the ICESat-2 Mission. Remote Sens. Environ. 2019, 221, 247–259. [Google Scholar] [CrossRef]
- Larsen, C. SnowEx23 Airborne Lidar-Derived 0.25M Snow Depth and Canopy Height, Version 1; NASA National Snow and Ice Data Center Distributed Active Archive Center: Boulder, CO, USA, 2024; Available online: https://nsidc.org/sites/default/files/documents/user-guide/snex23_lidar-v001-userguide_2.pdf (accessed on 16 January 2026).
- Vuyovich, C.; Stuefer, S.; Durand, M.; Marshall, H.P.; Osmanoglu, B.; Elder, K.; Vas, D.; Gelvin, A.; Larsen, C.F.; Pedersen, S.; et al. NASA SnowEx 2023 Experiment Plan. 2022. Available online: https://snow.nasa.gov/sites/default/files/users/user194/NASASnowEx23_ExperimentPlan_2023_draft_21Nov2022.pdf (accessed on 16 January 2026).
- Kokhanovsky, A.A.; Zege, E.P. Scattering Optics of Snow. Appl. Opt. 2004, 43, 1589–1602. [Google Scholar] [CrossRef] [PubMed]
- Neumann, T.A.; Brenner, A.; Hancock, D.; Robbins, J.; Saba, J.; Harbeck, K.; Gibbons, A.; Lee, J.; Luthcke, S.B.; Rebold, T. ATLAS/ICESat-2 L2A Global Geolocated Photon Data, Version 5; NASA National Snow and Ice Data Center Distributed Active Archive Center: Boulder, CO, USA, 2021. [Google Scholar] [CrossRef]
- Shean, D.E.; Bhushan, S.; Smith, B.E.; Besso, H.; Sutterley, T.C.; Swinski, J.-P.; Henderson, S.T.; Neumann, T.A.; Williams, J.B. Evaluating and Improving Seasonal Snow Depth Retrievals with Satellite Laser Altimetry. In Proceedings of the AGU Fall Meeting, New Orleans, LA, USA, 13–17 December 2021; p. C33B-04. [Google Scholar]
- Sun-Mack, S.; Hu, Y.; Lu, X.; Chen, Y.; Omar, A. Neural Network-Based Snow Depth Retrieval from AMSR-2 Brightness Temperatures Using ICESat-2 Measurement as Ground Truth. Front. Remote Sens. 2025, 6, 1591276. [Google Scholar] [CrossRef]
- Kelly, R. The AMSR-E Snow Depth Algorithm: Description and Initial Results. J. Remote Sens. Soc. Jpn. 2009, 29, 307–317. [Google Scholar] [CrossRef]
- Serreze, M.C.; Clark, M.P.; Armstrong, R.L.; McGinnis, D.A.; Pulwarty, R.S. Characteristics of the Western United States Snowpack from Snowpack Telemetry (SNOTEL) Data. Water Resour. Res. 1999, 35, 2145–2160. [Google Scholar] [CrossRef]
- Herbert, J.N.; Raleigh, M.S.; Small, E.E. Using a Random Forest Model to Combine Airborne Lidar and Snotel Data for Daily Estimates of Snow Depth Across Mountain Drainage Basins of Colorado. Water Resour. Res. 2025, 61, e2024WR039775. [Google Scholar] [CrossRef]
- Fleming, S.W.; Zukiewicz, L.; Strobel, M.L.; Hofman, H.; Goodbody, A.G. SNOTEL, the Soil Climate Analysis Network, and Water Supply Forecasting at the Natural Resources Conservation Service: Past, Present, and Future. JAWRA J. Am. Water Resour. Assoc. 2023, 59, 585–599. [Google Scholar] [CrossRef]
- Shean, D.; Swinski, J.-P.; Smith, B.; Sutterley, T.; Henderson, S.; Ugarte, C.; Lidwa, E.; Neumann, T. SlideRule: Enabling Rapid, Scalable, Open Science for the NASA ICESat-2 Mission and Beyond. J. Open Source Softw. 2023, 8, 4982. [Google Scholar] [CrossRef]
Disclaimer/Publisher’s Note: The statements, opinions and data contained in all publications are solely those of the individual author(s) and contributor(s) and not of MDPI and/or the editor(s). MDPI and/or the editor(s) disclaim responsibility for any injury to people or property resulting from any ideas, methods, instructions or products referred to in the content. |
© 2026 by the authors. Licensee MDPI, Basel, Switzerland. This article is an open access article distributed under the terms and conditions of the Creative Commons Attribution (CC BY) license.