Highlights
What are the main findings?
- The lower temperature sensitivity of the 1.5 μm band makes it suitable for H216O detection, minimizing measurement errors.
- Differential absorption lidar has been proven to be capable of simultaneous remote sensing of H216O, HD16O, and obtaining vertical profiles of the isotope ratio δD.
What is the implication of the main finding?
- The study contributes to improved temporal and spatial resolution in HD16O/H216O remote sensing, aiding in better observations of the lower troposphere.
- The realization of this research plays a key role in improving our understanding of the global water cycle.
Abstract
A novel multi-wavelength differential absorption lidar operating at 1.5 μm band is proposed and theoretically analyzed for simultaneous remote sensing of vertical profiles of H216O, HD16O, and the isotopic ratio δD. The spectral band is compatible with mature, commercially available fiber-optic components, ensuring practical implementability. By employing the 1976 U.S. Standard atmosphere and considering the temperature dependence of H216O, the systematic error induced by a +1 K temperature uncertainty within the 2 km altitude is limited to 0.81% through appropriate absorption line selection. Simulations of atmospheric backscattered signals with a time resolution of 30 min and a range resolution of 120 m show that random error remains below 0.16% up to 2 km. The simultaneous retrieval errors of H216O and HD16O mixing ratio profiles at 2 km are 0.13 g/kg (3.19%) and 1.69 × 10⁻⁴ g/kg (18.02%), respectively, from which the δD is successfully and reliably retrieved. The results provide essential technical guidance for implementing high-resolution, isotopologue-resolved lidar observations in atmospheric science.
1. Introduction
Atmospheric water vapor, the most abundant greenhouse gas, is crucial to Earth’s energy balance and hydrological cycle through latent heat transport, cloud formation, convection, and large-scale circulation [1,2]. Accurate vertical profiling of water vapor is essential for improving our understanding of key atmospheric processes such as cloud microphysics and turbulent mixing, and for reducing uncertainties in weather forecasting isotopic ratio and climate models [3,4]. Moreover, the isotopic composition of atmospheric moisture provides valuable insights into the history and origin of water in the atmosphere. Stable water isotopes, such as HD16O and H218O, undergo fractionation during phase changes, allowing them to serve as natural tracers for investigating evaporation, condensation, transport, and mixing processes [5]. The isotopic ratio of HD16O to H216O, typically expressed in δD notation relative to the Vienna Standard Mean Ocean Water (VSMOW) [6]. Precise δD measurements can offer independent constraints on numerical models and improve the representation of water cycling. To fully exploit this potential, high spatiotemporal resolution observational data of water vapor and its isotopologues are essential. On the one hand, high temporal resolution allows the tracking of rapid changes, which is crucial for understanding short-term processes such as evaporation, condensation, and air mass mixing. On the other hand, high vertical resolution is needed to resolve fine-scale structures and thus facilitates the study of local and regional dynamics.
Traditionally, in situ instruments provide high-precision measurements of atmospheric water vapor isotopologues, capturing high-frequency temporal variability [7]. The HD16O/H216O ratio is routinely monitored through in situ measurements from ground stations and aircraft sampling [8,9]. Meanwhile, passive remote sensing techniques, such as satellite-based Fourier Transform Infrared spectrometers, are deployed on satellite platforms to achieve global HD16O and H216O retrievals with broad spatial coverage [10], or on ground-based platforms to provide column-averaged measurements at specific locations [11,12,13]. However, these approaches are constrained by coarse vertical resolution and reduced sensitivity in the lower troposphere. Consequently, a significant gap remains in the capability to achieve continuous, high-resolution, range-resolved retrievals of vertical profiles for both water vapor and its isotopologues.
Compared to in situ and passive remote sensing techniques, lidar provides a promising approach for range-resolved measurements with high spatiotemporal resolution [14,15,16,17,18]. While Raman lidar has proven effective for estimating atmospheric HD16O/H216O profiles [19], the application remains constrained by the inherently low Raman cross-sections. Differential absorption lidar (DIAL) is a powerful tool for gas remote sensing. However, traditional dual-wavelength systems are fundamentally capable of measuring only a single gas, such as either HD16O or H216O. Recent research has employed wavelength-tuned DIAL to separately measure vertical profiles of HD16O and H216O [20]. Nevertheless, the measurements are typically performed sequentially, limiting the ability to capture simultaneous isotopic variations. Advances in multi-wavelength DIAL have enabled the simultaneous profiling of multiple gases. This capability has been successfully proved to measure gas pairs such as CO2 and H216O, CH4 and H216O, and CO2 and HD16O [21,22,23,24]. Despite these developments, a lidar system capable of simultaneously detecting both H216O and HD16O profiles with sufficient sensitivity and vertical resolution for accurate δD estimation remains scarcely reported in existing studies. This limits the capacity to observe key processes such as isotope fractionation during boundary layer convection at appropriate spatial and temporal scales.
In this study, we propose a novel multi-wavelength DIAL system near 1.5 μm. Theoretical analysis demonstrates that the system is capable of simultaneously measuring the vertical profiles of H216O, HD16O, and δD with high spatial resolution. The current analysis relies on the lidar retrieval method, without the incorporation of experimental data. Therefore, future research will require additional experimental observations to further validate these results and expand the potential applications in atmospheric sciences. By complementing sparse observation networks and overcoming the limitations of insufficient spatial resolution and the difficulty of simultaneous measurements of water vapor and its isotopologues, this method may contribute to ongoing efforts to enhance our understanding of the water cycle and improve climate prediction capabilities.
2. Methodology
2.1. System Description
The proposed system extends the concept of the previously developed multi-wavelength DIAL for CO2 and HD16O measurement [25], incorporating optimizations that enable the simultaneous retrieval of H216O and HD16O vertical profiles. As shown in Figure 1, the system employs a broadband tunable laser as the probe source and a single-frequency, narrow-linewidth laser as the reference source. The probe laser is tuned to a wavelength range that covers the absorption features of both H216O and HD16O for multi-wavelength scanning. The reference wavelength operates at a fixed wavelength where absorptions by other atmospheric interference gases are negligible. To ensure frequency stability during the scanning process, the wavelength of the probe laser needs to be locked. Previous studies have shown that a tunable laser can be stabilized to an optical frequency comb with an absolute frequency reference through phase-locking or injection-locking techniques [26,27]. In this study, the probe laser was heterodyned with an optical frequency comb via a beam splitter (BS), and the resulting beat signal is monitored by a balanced detector (BD) for frequency locking. Although such frequency-comb-based locking methods are rarely applied in lidar systems, in our previous work we successfully achieved a frequency stability better than 0.5 MHz using this technique, which satisfies the accuracy requirements for gas absorption measurements [25].
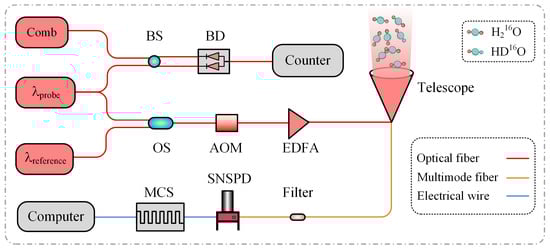
Figure 1.
Optical layout of the DIAL system. BS: beam splitter; BD: balanced detector; OS, optical switch; AOM: acousto-optic modulator; EDFA: erbium-doped fiber amplifier; SNSPD: superconducting single-photon detector; MCS: multi-channel scaler.
Meanwhile, the probe laser is sequentially scanned across discrete wavelengths, with each wavelength time-division multiplexed with the reference beam through an optical switch (OS). These alternating emissions of probe and reference beams enable real-time correction for atmospheric fluctuations and system instability. Both beams are modulated into pulses by an acousto-optic modulator (AOM, Smart Science & Technology, Chongqing, China) and subsequently amplified using an erbium-doped fiber amplifier (EDFA, GuangZai, Hangzhou, China) within the operating wavelength range. Then, the pulsed beams are vertically transmitted into the atmosphere through a telescope. Since the probe wavelengths cover the absorption lines of H216O and HD16O, the corresponding backscattered signals experience varying degrees of attenuation. In contrast, the reference beam located in a non-absorbing spectral region remains largely unaffected. The backscattered signals from both beams are collected by the receiving telescope and combined using wavelength-division multiplexing into a multimode fiber. A superconducting single-photon detector (SNSPD, Photon Technology, Jiaxing, China) is used for high-sensitivity detection, with signals recorded by a multi-channel scaler (MCS, GuangZai, Hangzhou, China) and analyzed to retrieve H216O and HD16O concentrations from the spectral differences between the probe and reference signals.
2.2. Spectral Selection
It is essential to carefully select the scanning wavelength range of the probe laser to avoid overlapping with absorption lines of other atmospheric gases, reduce sensitivity to temperature sensitivity, and ensure optimal optical depth. Figure 2a shows the absorption spectra of H216O, HD16O, and other greenhouse gases with strong infrared absorption within the wavelength range of 1550 to 3000 nm. The assumed gas mixing ratios are 7.75 g/kg for H216O, 2.11 × 10⁻³ g/kg for HD16O, 0.42 g/kg for CO2, 2.00 × 10⁻³ g/kg for CH4, 0.33 × 10⁻³ g/kg for N2O, respectively. Notably, within the two shaded regions marked as Option 1 and Option 2, both H216O and HD16O exhibit prominent and closely absorption features, while interference from other gases remains relatively minimal in these spectral ranges.
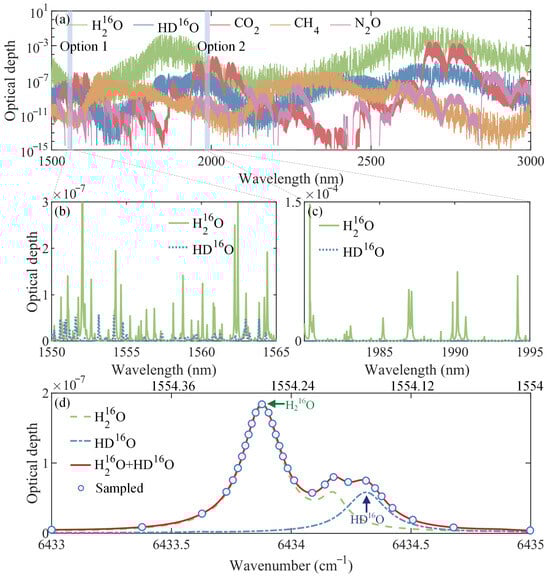
Figure 2.
(a) Unit optical depth of main greenhouse gases within the wavelength range of 1550–3000 nm. Unit optical depth of H216O and HD16O from (b) 1550–1565 nm, (c) 1980–1995 nm, (d) 1554.48–1554.00 nm (6433–6435 cm−1).
To facilitate a more detailed analysis of these two regions, Figure 2b,c present magnified views. In Option 2 (Figure 2c), H216O exhibits a pronounced absorption near 1.9 μm, whereas the substantially weaker absorption of HD16O limits the feasibility of simultaneous isotopologue detection. In contrast, in Option 1 (Figure 2b) centered around 1.5 μm, both gases display weaker but comparable absorption strengths, which indicates a greater potential for simultaneous detection. In addition, this region further benefits from mature fiber-optic technology, ensuring the ready availability of optical components and seamless system integration.
Figure 2d illustrates a representative spectral window centered at 1.5 μm band (6433–6435 cm−1), containing a strong peak of H216O (1), a weaker secondary peak of H216O (2), and a distinct peak of HD16O (1). These features form a composite absorption pattern with the potential to simultaneously retrieve two species and their isotopic ratios. In this study, 30 non-uniformly spaced sampling wavelengths are selected to balance detection efficiency with spectral information retention. The corresponding system parameters are summarized in Table 1, with detailed explanations of the parameter selection provided in the Supplementary Materials.

Table 1.
System parameters.
2.3. Algorithms
The backscattered signals corresponding to 30 pairs probe and reference wavelengths are simulated and expressed using the lidar equation as
where E is the pulse energy, ηo is the total optical transmittance given by the product of the transmitter and receiver transmittances, with the receiver transmittance including a 75% telescope-to-fiber coupling efficiency, a 0.7 dB filter insertion loss and 90% transmission of other fiber components and connectors used in the simulation. ηq is the quantum efficiency, Ar is the area of the telescope, Z is the height, O is the geometrical overlap factor, τ is the pulse width, β is the volume backscattered coefficient including atmospheric aerosol particles (βa) and molecules (βm), Tatm is the transmission, which is given by
with αa and αm representing the extinction coefficient of aerosol and the extinction coefficient of molecules except H216O and HD16O. βa, βm, αa and αm are simulated based on Equations (S1)–(S6) in the Supplementary Materials. The absorption coefficient α of H216O and HD16O is calculated based on the spectral parameters using the Voigt line shape g(ν) as [23]
where Nd is the number density, ν0 represents the wavenumber at the center of the line, g(ν) is the convolution of a Lorentzian and a Gaussian line shape, which depends on both atmospheric temperature and pressure. S is the spectral line intensity which can be written as
where S0 is the line strength at P0 = 1 atm and T0 = 273 K, h is the Planck constant, c is the speed of light, k is the Boltzmann constant, E″ is the lower-state energy related to temperature sensitivity. Accordingly, the absorption coefficient spectra are calculated using Equations (2)–(4) and then substituted into Equation (1) for the simulation of lidar backscattered signals. The key system and spectral parameters used are summarized in Table 1 and Table 2, respectively. The temperature, pressure, and vertical H216O mixing ratio profiles are obtained from the 1976 U.S. Standard atmosphere model, as depicted in Figure S1 in the Supplementary Materials. This atmosphere model is particularly suitable for mid-latitude regions, as it represents an intermediate state between winter and summer conditions. The corresponding HD16O mixing ratio profile is derived based on a specified isotopic ratio δD reported [11], with δD expressed as [20]
where RSMOW is defined as 3.1152 × 10⁻⁴ according to Standard Mean Ocean Water.
To better reflect real measurement conditions, Poisson noise is added to the simulated signals in Equation (1). The signals corresponding to each wavelength are accumulated at intervals of 30 s to improve the signal-to-noise ratio (SNR) given by SNR = ⟨N⟩/⟨∆N⟩, with ⟨N⟩ and ⟨∆N⟩ representing the mean signal and mean noise in a range gate after shots averaging. The retrieved relative systematic error of the absorption coefficient by introducing the uncertainties of systematic error sources and the random error are given by Equations (6) and (7), respectively [28]:
where δx is the assumed uncertainty of the specific input systematic error sources, ∆Z = Z2 − Z1 is the range resolution. ρ(Non, Noff) is the cross-correlation between Non and Noff.
Table 2.
Spectral parameters [29]. γair and γself: Air-broadened and self-broadened Lorentzian half-width at half-maximum P0 = 1atm and T0 = 296 K.
Table 2.
Spectral parameters [29]. γair and γself: Air-broadened and self-broadened Lorentzian half-width at half-maximum P0 = 1atm and T0 = 296 K.
| Formula | ν0 (cm−1) | λ0 (nm) | γair (cm−1·atm−1) | γself (cm−1·atm−1) | S0 (cm−1/(molec·cm−2)) | E″ (cm−1) |
|---|---|---|---|---|---|---|
| H216O (1) | 6433.8877 | 1554.270 | 0.0950 | 0.352 | 3.00 × 10⁻²⁵ | 782.41 |
| H216O (2) | 6434.1873 | 1554.198 | 0.0607 | 0.315 | 4.89 × 10⁻²⁶ | 1631.25 |
| HD16O (1) | 6434.3160 | 1554.167 | 0.1002 | 0.469 | 1.05 × 10⁻²⁵ | 46.17 |
During the retrieval process, the absorption coefficient spectra of H216O and HD16O, derived from 30 simulated backscattered signals, are multiplied by the range resolution ∆Z to obtain the optical depth, which is then fitted using the least-squares method. A three-peak fitting method is applied to decompose the mixed absorption optical depth spectra, separating the spectral features of H216O (1), H216O (2) and HD16O (1), and obtaining the integrated areas, respectively. The integrated area of each fitted gas absorption spectrum is determined as
where the subscript i denotes the three absorption lines, namely H216O (1), H216O (2) and HD16O (1). Then, the corresponding gas mixing ratios of H216O and HD16O are determined from the fitted areas of the main absorption lines H216O (1) and HD16O (1) by combining Equations (3) and (8).
3. Results
The retrieval systematic errors of gas mixing ratio profiles are influenced by uncertainties in atmospheric conditions and the DIAL system. Critical system uncertainties primarily arise from calibration errors associated with the relative laser pulse energy eon,off at different wavelengths and the relative sensitivity don,off of the receiver channels. These errors propagate linearly into the retrieved gas absorption coefficient, with the relationship given by 2δα/α = δe/e = δd/d, where δe and δd represent the pulse energy difference and the receiver sensitivity difference between probe and reference wavelengths, respectively. To maintain a low overall error budget, it is preferable for the relative accuracy of each parameter to be better than 0.02%, as suggested in [30]. Although achieving this value is currently challenging, it is essential during the experimental process to monitor the transmitted energy per pulse and the receiver optical efficiency as accurately as possible. In this study, the theoretical simulation primarily focuses on the uncertainties that are difficult to calibrate in experiments, specifically the effects of temperature, pressure, and laser frequency uncertainties. The absorption coefficient spectra are first calculated for each range bin using the 1976 U.S. Standard atmosphere and spectral parameters from HITRAN, and assuming uncertainties of +1 K in temperature, +1 hPa in pressure, and +0.5 MHz in frequency at each altitude. The resulting absorption coefficient spectra are then substituted into Equation (6) to evaluate the corresponding systematic errors.
In general, the absorption cross-section of H2O exhibits a strong temperature dependence, as reflected by a high E″ value. The absorption lines selected here feature E″ values of 782.41 cm−1 for H216O and 46.17 cm−1 for HD16O, respectively, exhibiting lower temperature sensitivity compared with those used in current studies. Figure 3a shows the calculated relative systematic errors with an input temperature uncertainty of +1 K within 2 km altitude. The result indicates that the main H216O peak reaches a maximum temperature error of 0.81% and maintains larger errors than HD16O, which is consistent with the respective E″ values. Systematic error associated with a pressure uncertainty of +1 hPa with 2 km altitude is illustrated in Figure 3b, with all error values being positive. The reference wavelength exhibits a relatively large error of 0.25% and the H216O and HD16O peaks show minimal errors, highlighting the greater sensitivity of the HD16O to pressure variations in the lower atmosphere. In the frequency sensitivity analysis shown in Figure 3c, retrieval errors at the centers of both absorption peaks are close to zero and exhibit symmetric positive and negative distributions around each peak. As altitude increases, the errors at the peak centers and off-wavelength remain relatively stable, whereas more pronounced variations occur at the wings of the absorption lines, with the maximum error reaching 0.02%. Overall, the analyses of systematic errors demonstrate that temperature uncertainties exert the most significant influence on retrieval accuracy, whereas pressure and frequency uncertainties introduce comparatively smaller errors. The choice of absorption lines with relatively low E′′ values effectively mitigates temperature sensitivity, ensuring that systematic errors remain within acceptable limits within 2 km height.
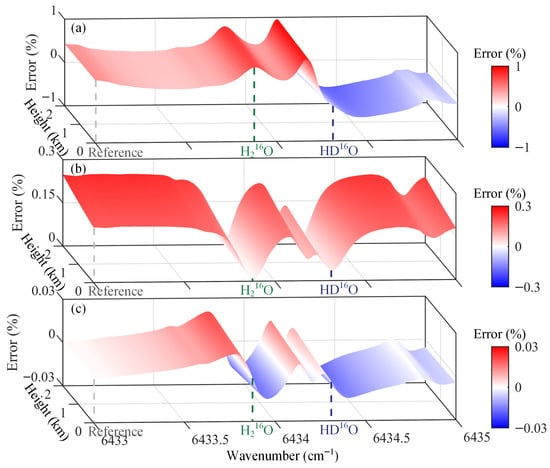
Figure 3.
The relative systematic errors for gas mixing ratio profiles retrieval with (a) temperature uncertainty of +1 K, (b) pressure uncertainty of +1 hPa, (c) frequency uncertainty of +0.5 MHz. The gray, green, and blue dashed lines mark the positions of the reference wavenumber, the central wavenumber of main H216O, and the central wavenumber of HD16O, respectively.
In addition, commonly used atmospheric models for mid-latitude regions also include the Mid-Latitude Summer (MLS) and Mid-Latitude Winter (MLW) models. Although different atmospheric models exhibit distinct temperature, pressure, and H216O profiles (Figure S1), Figure 4 illustrates that the errors arising from temperature and frequency uncertainties vary slightly across the models but remain generally consistent. And the errors resulting from pressure uncertainty exhibit even smaller variations. Moreover, for different atmospheric models, the MLW characterized by lower temperature and H216O content, exhibits a slightly larger error response to temperature uncertainties compared with the other two models. Additionally, negative uncertainties produce systematic errors equal in magnitude but opposite in sign (Figure S2).
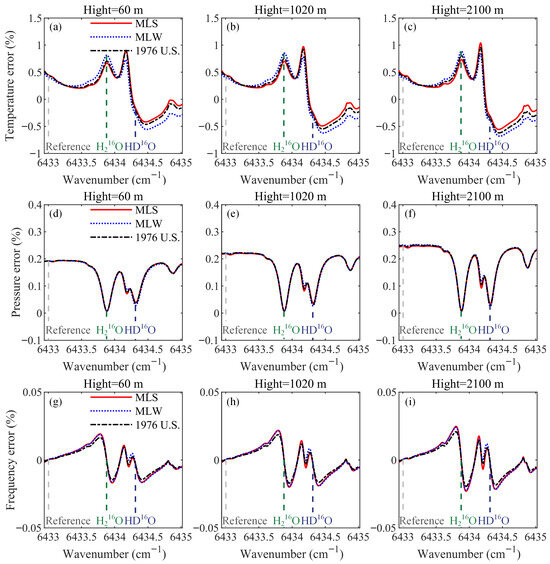
Figure 4.
The relative systematic errors caused by temperature uncertainties of +1 K (a–c), pressure uncertainties of +1 hPa (d–f), and frequency uncertainties of +0.5 MHz (g–i) at altitudes of 60 m, 1020 m, and 2100 m under different atmospheric models. The gray, green, and blue dashed lines mark the positions of the reference wavenumber, the central wavenumber of main H216O, and the central wavenumber of HD16O, respectively.
To evaluate the performance of the selected absorption lines for H216O and HD16O measurements in DIAL applications, atmospheric backscattered signals are simulated at the chosen sampling wavelengths, and the corresponding SNR and random errors are analyzed using the 1976 U.S. Standard atmosphere. The temporal resolution of each scan is 30 min, achieved through an alternating accumulation of 30 s for each on-line and off-line wavelength pair. With a pulse width τ of 800 ns, the range resolution ΔR = cτ/2 is 120 m, where c is the speed of light. Using a longer pulse width increases the number of photons received per pulse, which helps to improve the SNR.
The result in Figure 5a shows that the SNR decreases with altitude, with more pronounced attenuation at the absorption peaks of H216O and HD16O compared to other wavelengths. Consequently, Figure 5b shows that the relative random error increases with height, reaching a maximum of about 0.16% at the off-line wavelength near 2 km, while the minimum error occurs at the line center.
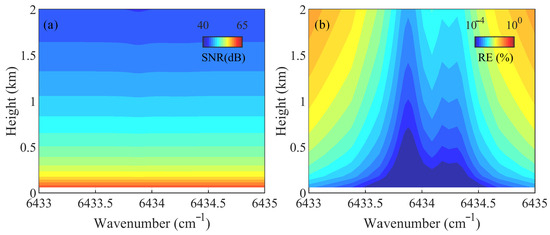
Figure 5.
(a) SNR and (b) relative random error of the simulated DIAL backscattered signals.
It is worth noting that under polluted conditions, the high aerosol concentration near the surface enhances backscattering while also introducing stronger extinction. The results show that, at a detection height of 2 km, the enhanced signal is sufficient to compensate for the attenuation, allowing high-quality signal acquisition within the target observation range. As a result, the corresponding random error is smaller than that under clean atmospheric conditions (Figure S3). However, in extreme cases of severe pollution, the random error rapidly increases with altitude, and the lidar detection range becomes limited (Figure S4). Therefore, future experimental studies under various atmospheric conditions are crucial.
In addition, the H216O profile is a key factor influencing random errors, primarily by affecting the absorbed optical depth. Under the simulation conditions defined by the parameters listed in Table 1 and Table 2, higher H216O concentrations correspond to smaller random errors (Figure S5). In order to more intuitively compare the influence of H216O content on the inversion process, Figure 6 shows the mixed absorption optical depth spectra of H216O and HD16O at different height of 60 m, 1020 m and 2100 m under different atmospheric models including MLW, 1976 U.S. Standard, and MLS, retrieved from the simulated DIAL backscattered signals.
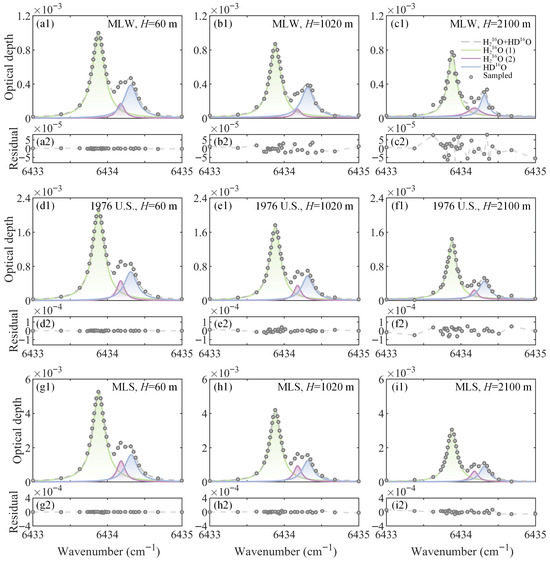
Figure 6.
Optical depths and fitting residuals of H216O and HD16O at different heights of H = 60 m, 1020 m and 2100 m with a range resolution of 120 m under the Mid-latitude Winter (MLW) model (a1–c1,a2–c2); the 1976 U.S. Standard model (d1–f1,d2–f2); and the Mid-latitude Winter (MLW) model (g1–i1,g2–i2). The green, blue, and purple shaded areas represent H216O (1), H216O (2), and HD16O, respectively. The residual coordinates are adjusted for H216O content for easier comparison.
The spectra are decomposed using a three-peak Voigt fitting function. The fitting residual is defined as the difference between the derived and the Voigt-fitted spectra at each sampling wavelength, which serves as an indicator of the fitting performance. As height increases, both contents of H216O and HD16O gradually decrease, and the corresponding fitted areas also exhibit a declining trend. The fitting residuals increase with height, and the residuals at the absorption line center are significantly larger than those in the wings. At the same altitude, smaller Voigt fitting residuals are obtained for the MLS due to the higher H216O content, whereas larger residuals are obtained for the MLW due to the lower H216O levels. Additionally, the fitting residuals for the MLW increase significantly at 2 km.
Then, the fitted integrated areas of the separated spectral lines, obtained under the 1976 U.S. Standard atmosphere representing an intermediate state between MLW and MLS, are used to derive the vertical profiles of H216O and HD16O mixing ratios, as well as the δD profile. The standard deviations of the retrieved mixing ratios are determined by the fitting error of the integrated absorption area, which inherently incorporates the effects of both systematic and random errors at all sampling wavelengths through the spectral fitting process. In general, larger fitting residuals result in greater errors in the fitted areas, leading to increased standard deviation in the retrieved mixing ratios. The standard deviation of δD is then determined based on Equation (S7) in the Supplementary Materials, which accounts for the uncertainties in both H216O and HD16O. The results shown in Figure 7 indicate that the retrieved values generally follow the expected profile defined by the input a priori values, with deviations increasing with altitude. Owing to a stronger absorption of H216O, the standard deviation in mixing ratio is smaller than that of HD16O, yielding errors at 2 km of about 0.13 g/kg (3.19%) and 1.69 × 10⁻⁴ g/kg (18.02%), respectively. Furthermore, the retrieved mixing ratio profiles of H216O and HD16O enable a reliable derivation of δD, particularly evident at an altitude of 2 km.
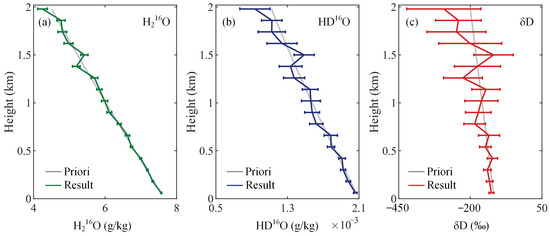
Figure 7.
(a) Retrieved mixing ratio of H216O. (b) Retrieved mixing ratio of HD16O. (c) Retrieved δD. The error bars are ±1 standard deviation.
4. Conclusions
In this study, a multi-wavelength DIAL system operating at 1.5 μm is proposed, and its feasibility for simultaneous range-resolved profiling of water vapor isotopologue is analyzed theoretically. The proposed system employs a broadband tunable laser to scan absorption lines of H216O and HD16O, with frequency stabilization ensured by heterodyning with an optical frequency comb and real-time correction using a reference laser. The selected spectral lines effectively minimize interference from other atmospheric species, thereby ensuring reliable retrievals. Systematic error analysis shows that uncertainties in temperature and pressure dependent absorption cross-sections, together with laser frequency instabilities, introduce acceptable biases. Simulations of DIAL backscattered signals under the given system parameters further reveal that random errors are dominated by SNR limitations. The retrieved profiles of H216O and HD16O generally show good agreement with the input a priori distributions. Importantly, the retrieved number densities of H216O and HD16O enable the effective derivation of δD within 2 km altitude, demonstrating the capability of DIAL for isotopic composition measurements. It is worth noting that, in addition to the errors from the theoretical simulations, calibration errors during the experimental process further affect the inversion results, particularly the pulse energy and the optical efficiency, both of which contribute linearly to the overall error budget. To minimize calibration errors, refining monitoring techniques and implementing precise calibration methods in future experiments is crucial for improving accuracy in subsequent studies. While the theoretical results presented in this study require further validation through future experiments, the proposed system opens new opportunities for applications in atmospheric dynamics, hydrological cycle investigations, and climate research.
Supplementary Materials
The following supporting information can be downloaded at https://www.mdpi.com/article/10.3390/rs18020212/s1: Figure S1: Atmospheric temperature, pressure, and H216O profiles of different atmospheric models within 2 km altitude; Figure S2: The relative systematic errors for gas mixing ratio profiles retrieval with temperature uncertainty of −1 K, pressure uncertainty of −1 hPa, frequency uncertainty of −0.5 MHz; Figure S3: Relative random errors of H216O and HD16O in clean and polluted atmospheres. Figure S4: Relative random errors of H216O and HD16O corresponding to the 1976 U.S. Standard atmosphere under severe pollution; Figure S5: SNR and random error of the simulated DIAL backscattered signals under the MLW model, the 1976 U.S. Standard atmosphere and the MLS model.
Author Contributions
Conceptualization, S.Y.; methodology, S.Y. and Z.Z.; software, S.Y.; validation, Z.Z. and H.X.; formal analysis, S.Y. and Z.Z.; investigation, S.Y.; resources, S.Y., Z.Z. and H.X.; data curation, S.Y.; writing—original draft preparation, S.Y.; writing—review and editing, Z.Z. and H.X.; visualization, S.Y.; supervision, S.Y. and Z.Z. All authors have read and agreed to the published version of the manuscript.
Funding
This research was funded by the National Natural Science Foundation of China (42405138, 42305147), and the Natural Science Foundation of Jiangsu Province (BK20230428).
Data Availability Statement
The data presented in this study are available on request from the corresponding author.
Conflicts of Interest
The authors declare no conflicts of interest.
References
- Soden, B.J.; Jackson, D.L.; Ramaswamy, V.; Schwarzkopf, M.D.; Huang, X. The radiative signature of upper tropospheric moistening. Science 2005, 310, 841–844. [Google Scholar] [CrossRef] [PubMed]
- Gao, Z.; Zhang, J.; Yu, M.; Liu, Z.; Yin, R.; Zhou, S.; Zong, L.; Ning, G.; Xu, X.; Guo, Y.; et al. Role of Water Vapor Modulation From Multiple Pathways in the Occurrence of a Record-Breaking Heavy Rainfall Event in China in 2021. Earth Space Sci. 2022, 9, e2022EA002357. [Google Scholar] [CrossRef]
- Kindel, B.C.; Pilewskie, P.; Schmidt, K.S.; Thornberry, T.; Rollins, A.; Bui, T. Upper-troposphere and lower-stratosphere water vapor retrievals from the 1400 and 1900 nm water vapor bands. Atmos. Meas. Tech. 2015, 8, 1147–1156. [Google Scholar] [CrossRef]
- Ismail, S.; Browell, E.V. Airborne and spaceborne lidar measurements of water vapor profiles: A sensitivity analysis. Appl. Opt. 1989, 28, 3603–3615. [Google Scholar] [CrossRef] [PubMed]
- Galewsky, J.; Steen-Larsen, H.C.; Field, R.D.; Worden, J.; Risi, C.; Schneider, M. Stable isotopes in atmospheric water vapor and applications to the hydrologic cycle. Rev. Geophys. 2016, 54, 809–865. [Google Scholar] [CrossRef]
- Worden, J.; Bowman, K.; Noone, D.; Beer, R.; Clough, S.; Eldering, A.; Fisher, B.; Goldman, A.; Gunson, M.; Herman, R.; et al. Tropospheric Emission Spectrometer observations of the tropospheric HDO/H2O ratio: Estimation approach and characterization. J. Geophys. Res. Atmos. 2006, 111, D16309. [Google Scholar] [CrossRef]
- Wen, X.F.; Sun, X.M.; Zhang, S.C.; Yu, G.R.; Sargent, S.D.; Lee, X. Continuous measurement of water vapor D/H and 18O/16O isotope ratios in the atmosphere. J. Hydrol. 2008, 349, 489–500. [Google Scholar] [CrossRef]
- Steen-Larsen, H.C.; Johnsen, S.J.; Masson-Delmotte, V.; Stenni, B.; Risi, C.; Sodemann, H.; Balslev-Clausen, D.; Blunier, T.; Dahl-Jensen, D.; Ellehøj, M.D.; et al. Continuous monitoring of summer surface water vapor isotopic composition above the Greenland Ice Sheet. Atmos. Chem. Phys. 2013, 13, 4815–4828. [Google Scholar] [CrossRef]
- Sodemann, H.; Aemisegger, F.; Pfahl, S.; Bitter, M.; Corsmeier, U.; Feuerle, T.; Graf, P.; Hankers, R.; Hsiao, G.; Schulz, H.; et al. The stable isotopic composition of water vapour above Corsica during the HyMeX SOP1 campaign: Insight into vertical mixing processes from lower-tropospheric survey flights. Atmos. Chem. Phys. 2017, 17, 6125–6151. [Google Scholar] [CrossRef]
- Boesch, H.; Deutscher, N.M.; Warneke, T.; Byckling, K.; Cogan, A.J.; Griffith, D.W.; Notholt, J.; Parker, R.J.; Wang, Z. HDO/H2O ratio retrievals from GOSAT. Atmos. Meas. Tech. 2013, 6, 599–612. [Google Scholar] [CrossRef]
- Ehhalt, D.H.; Rohrer, F.; Fried, A. Vertical profiles of HDO/H2O in the troposphere. J. Geophys. Res. Atmos. 2005, 110, D13301. [Google Scholar] [CrossRef]
- Wu, P.; Shan, C.; Wang, W.; Liu, C.; Zhu, Q.; Zeng, X.; Liang, B.; Xie, Y. Remote sensing of H2O and HDO column based on Fourier transform infrared spectroscopy. In Proceedings of the First International Conference on Spatial Atmospheric Marine Environmental Optics (SAME 2023), Shanghai, China, 7–9 April 2023; Volume 12706, pp. 20–29. [Google Scholar]
- Wu, P.; Shan, C.; Liu, C.; Xie, Y.; Wang, W.; Zhu, Q.; Zeng, X.; Liang, B. Ground-based remote sensing of atmospheric water vapor using high-resolution FTIR spectrometry. Remote Sens. 2023, 15, 3484. [Google Scholar] [CrossRef]
- Hamperl, J.; Capitaine, C.; Dherbecourt, J.B.; Raybaut, M.; Chazette, P.; Totems, J.; Grouiez, B.; Régalia, L.; Santagata, R.; Evesque, C.; et al. Differential absorption lidar for water vapor isotopologues in the 1.98 μm spectral region: Sensitivity analysis with respect to regional atmospheric variability. Atmos. Meas. Tech. 2021, 14, 6675–6693. [Google Scholar] [CrossRef]
- Shi, T.; Han, G.; Ma, X.; Gong, W.; Pei, Z.; Xu, H.; Qiu, R.; Zhang, H.; Zhang, J. Potential of Ground-Based Multiwavelength Differential Absorption LiDAR to Measure δ13C in Open Detected Path. IEEE Geosci. Remote Sens. Lett. 2021, 19, 7003204. [Google Scholar] [CrossRef]
- Imaki, M.; Hirosawa, K.; Yanagisawa, T.; Kameyama, S.; Kuze, H. Wavelength selection and measurement error theoretical analysis on ground-based coherent differential absorption lidar using 1.53 µm wavelength for simultaneous vertical profiling of water vapor density and wind speed. Appl. Opt. 2020, 59, 2238–2247. [Google Scholar] [CrossRef]
- Howes, N.; Innocenti, F.; Finlayson, A.; Dimopoulos, C.; Robinson, R.; Gardiner, T. Remote Measurements of Industrial CO2 Emissions Using a Ground-Based Differential Absorption Lidar in the 2 µm Wavelength Region. Remote Sens. 2023, 15, 5403. [Google Scholar] [CrossRef]
- Mariani, Z.; Hicks-Jalali, S.; Strawbridge, K.; Gwozdecky, J.; Crawford, R.W.; Casati, B.; Lemay, F.; Lehtinen, R.; Tuominen, P. Evaluation of Arctic water vapor profile observations from a differential absorption lidar. Remote Sens. 2021, 13, 551. [Google Scholar]
- Liberti, G.L.; Dionisi, D.; Cheruy, F.; Risi, C. Feasibility study to measure HDO/H2O atmospheric profiles through a Raman Lidar. EPJ Web Conf. 2018, 176, 05032. [Google Scholar]
- Hamperl, J.; Dherbecourt, J.B.; Raybaut, M.; Totems, J.; Chazette, P.; Régalia, L.; Grouiez, B.; Geyskens, N.; Aouji, O.; Amarouche, N.; et al. Range-resolved detection of boundary layer stable water vapor isotopologues using a ground-based 1.98 µm differential absorption LIDAR. Opt. Express 2022, 30, 47199–47215. [Google Scholar] [CrossRef]
- Stroud, J.R.; Wagner, G.A.; Plusquellic, D.F. Multi-frequency differential absorption LIDAR (DIAL) system for aerosol and cloud retrievals of CO2/H2O and CH4/H2O. Remote Sens. 2023, 15, 5595. [Google Scholar]
- Abshire, J.B.; Ramanathan, A.; Riris, H.; Mao, J.; Allan, G.R.; Hasselbrack, W.E.; Weaver, C.J.; Browell, E.V. Airborne measurements of CO2 column concentration and range using a pulsed direct-detection IPDA lidar. Remote Sens. 2013, 6, 443–469. [Google Scholar]
- Yu, S.; Zhang, Z.; Xia, H.; Dou, X.; Wu, T.; Hu, Y.; Li, M.; Shangguan, M.; Wei, T.; Zhao, L.; et al. Photon-counting distributed free-space spectroscopy. Light Sci. Appl. 2021, 10, 212. [Google Scholar] [CrossRef]
- Shangguan, M.; Guo, X.; Lin, S.; Lee, Z. Simultaneous column-averaged CO2, temperature, and HDO measurement by absorption spectroscopy lidar: Algorithm. IEEE Trans. Geosci. Remote Sens. 2024, 63, 4100112. [Google Scholar]
- Yu, S.; Zhang, Z.; Li, M.; Xia, H. Multi-frequency differential absorption lidar incorporating a comb-referenced scanning laser for gas spectrum analysis. Opt. Express 2021, 29, 12984–12995. [Google Scholar] [CrossRef]
- Ahtee, V.; Merimaa, M.; Nyholm, K. Precision spectroscopy of acetylene transitions using an optical frequency synthesizer. Opt. Lett. 2009, 34, 2619–2621. [Google Scholar] [CrossRef]
- Park, S.E.; Kim, E.B.; Park, Y.H.; Yee, D.S.; Kwon, T.Y.; Park, C.Y.; Moon, H.S.; Yoon, T.H. Sweep optical frequency synthesizer with a distributed-Bragg-reflector laser injection locked by a single component of an optical frequency comb. Opt. Lett. 2006, 31, 3594–3596. [Google Scholar] [CrossRef] [PubMed]
- Yu, S.; Guo, K.; Li, S.; Han, H.; Zhang, Z.; Xia, H. Three-dimensional detection of CO2 and wind using a 1.57 µm coherent differential absorption lidar. Opt. Express 2024, 32, 21134–21148. [Google Scholar] [CrossRef]
- Gordon, I.E.; Rothman, L.S.; Hargreaves, E.R.; Hashemi, R.; Karlovets, E.V.; Skinner, F.M.; Conway, E.K.; Hill, C.; Kochanov, R.V.; Tan, Y.; et al. The HITRAN2020 molecular spectroscopic database. J. Quant. Spectrosc. Radiat. Transf. 2022, 277, 107949. [Google Scholar] [CrossRef]
- Ehret, G.; Kiemle, C.; Wirth, M.; Amediek, A.; Fix, A.; Houweling, S. Space-borne remote sensing of CO2, CH4, and N2O by integrated path differential absorption lidar: A sensitivity analysis. Appl. Phys. B 2008, 90, 593–608. [Google Scholar] [CrossRef]
Disclaimer/Publisher’s Note: The statements, opinions and data contained in all publications are solely those of the individual author(s) and contributor(s) and not of MDPI and/or the editor(s). MDPI and/or the editor(s) disclaim responsibility for any injury to people or property resulting from any ideas, methods, instructions or products referred to in the content. |
© 2026 by the authors. Licensee MDPI, Basel, Switzerland. This article is an open access article distributed under the terms and conditions of the Creative Commons Attribution (CC BY) license.