Highlights
What are the main findings?
- The Swin Transformer dual-branch deformable boundary network (STDBNet) proposed in this study improves the recognition performance for irregular terraces and small-scale targets, achieving significantly higher extraction accuracy (OA = 95.26%, MIoU = 86.84%) compared to mainstream semantic segmentation models.
- We constructed an annual spatiotemporal dataset of terraced fields on the Loess Plateau, covering nine time periods from 2017 to 2025, which enables a systematic analysis of their spatiotemporal variation characteristics. The terraces are predominantly distributed in low-altitude areas with gentle slopes, exhibiting a significant spatial coupling relationship with terrain gradient.
What are the implications of the main findings?
- By integrating the Swin Transformer architecture, a dual-branch attention mechanism, and boundary-assisted supervision, the STDBNet model significantly enhances feature recognition accuracy for irregular terraces in complex terrain, offering a robust technical solution for terrace mapping and monitoring.
- The high-resolution annual terraced field time-series dataset, along with the spatiotemporal evolution characteristics it reveals, provides reliable data support and a scientific basis for studying soil and water conservation processes and optimizing ecological management on the Loess Plateau.
Abstract
Terrace construction is a critical engineering practice for soil and water conservation as well as sustainable agricultural development on the Loess Plateau (LP), China, where high-precision dynamic monitoring is essential for informed regional ecological governance. To address the challenges of inadequate extraction accuracy and poor model generalization in time-series terrace mapping amid complex terrain and spectral confounding, this study proposes a novel Swin Transformer-based Terrace Dual-Branch Deformable Boundary Network (STDBNet) that seamlessly integrates multi-source remote sensing (RS) data with deep learning (DL). The STDBNet model integrates the Swin Transformer architecture with a dual-branch attention mechanism and introduces a boundary-assisted supervision strategy, thereby significantly enhancing terrace boundary recognition, multi-source feature fusion, and model generalization capability. Leveraging Sentinel-2 multi-temporal optical imagery and terrain-derived features, we constructed the first 10-m-resolution spatiotemporal dataset of terrace distribution across the LP, encompassing nine annual periods from 2017 to 2025. Performance evaluations demonstrate that STDBNet achieved an overall accuracy (OA) of 95.26% and a mean intersection over union (MIoU) of 86.84%, outperforming mainstream semantic segmentation models including U-Net and DeepLabV3+ by a significant margin. Further analysis reveals the spatiotemporal evolution dynamics of terraces over the nine-year period and their distribution patterns across gradients of key terrain factors. This study not only provides robust data support for research on terraced ecosystem processes and assessments of soil and water conservation efficacy on the LP but also lays a scientific foundation for informing the formulation of regional ecological restoration and land management policies.
1. Introduction
As a typical artificial landform created by humans to adapt to mountainous and hilly environments [1], terraces have emerged as a pivotal management strategy for mitigating the impacts of climate change and anthropogenic disturbances in ecologically fragile regions such as the Loess Plateau (LP), China [2,3]. Terracing is achieved by transforming sloped terrain into leveled terrace platforms, which not only effectively expands the area of arable land but also fulfills the core functions of soil and water conservation and soil fertility maintenance [4]. Research indicates that terracing globally can reduce runoff and sediment loss by 41.9% and 52%, respectively, while increasing crop yields and soil moisture by 44.8% and 12.9%, respectively [5]. Moreover, terraces can enhance ecosystem services and related functions by restoring vegetation and degraded habitats, thereby improving the sustainability of both ecosystems and the broader environment [6]. In recent years, the implementation of soil and water conservation initiatives and high-standard farmland development programs has led to significant changes in both the quantity and spatial distribution of terraced fields [7]. However, the current lack of high-precision spatiotemporal distribution data on terraces in the LP has introduced greater uncertainty into future terrace research. Consequently, mapping such high-precision time-series terrace data is essential.
In recent years, with the rapid advancement of remote sensing (RS) and computer technologies, terrace mapping has transitioned from labor-intensive and costly visual interpretation to more efficient and accurate intelligent classification methods driven by RS data [8,9,10]. Currently, three primary technical approaches are employed for terrace extraction: (1) visual interpretation [11], (2) terrace feature extraction [12], and (3) object classification-based methods [13,14]. Visual interpretation can achieve high accuracy and controllability by incorporating expert knowledge and manual experience; Nevertheless, its inefficiency and high costs limit its applicability to large-scale studies [15]. Feature extraction-based methods, while interpretable and low in hardware requirements, suffer from poor generalization and struggle to handle complex, noisy scenarios [16]. For instance, Dai et al. [17] proposed an automatic method for delineating terraced ridges by integrating edge detection and terrain analysis. The approach combines multi-source RS data with both image edges and terrain features, thereby enhancing the accuracy and robustness of terrace boundary recognition. However, it remains sensitive to image quality, relies on empirical parameter tuning, and is computationally intensive, posing challenges for generalization and efficiency in large-scale or time-series terrace extraction. Object-based classification methods can effectively capture the shape and texture characteristics of terraces and mitigate the salt-and-pepper noise effect. Nevertheless, these methods are highly dependent on the quality of image segmentation, exhibit low processing efficiency, show limited adaptability to diverse terrace types, and achieve constrained accuracy in temporal terrace extraction [18]. Capolupo et al. [19] extracted terraced fields by integrating spectral, textural, and terrain indices within an object-based classification framework, achieving high classification accuracy. The method required complex parameter configurations, was sensitive to effects of shadow and vegetation cover, and demonstrated notable limitations when applied in diverse or challenging conditions within the study area.
Traditional terrace extraction methods have poor generalization capabilities and lack effective recognition of topographical and spectral regions where terrace distribution is more complex. This poses a challenge to high-precision time-series terrace extraction. In contrast, Deep Learning (DL), through its end-to-end learning mechanism, enables the automatic extraction of multi-layered, highly abstract, and discriminative features from RS imagery [20]. This facilitates more efficient, accurate, and generalizable automatic identification of terraces in diverse and complex scenarios [21,22,23]. An increasing number of researchers have begun employing DL approaches for terrace extraction [24,25]. For instance, Zhao et al. [10] successfully extracted terraced fields in the complex environments of southern China using a DL model (NLDF-Net) that integrated an improved attention mechanism with a dual-feature fusion module. Nevertheless, the model did not incorporate terrain information, and its generalization capability was not sufficiently validated across diverse geographical contexts. Similarly, Li et al. [26] successfully generated the first global terrace map at a 10-m resolution using a DL model; however, the study was constrained by sample imbalance and limited spatiotemporal generalization, resulting in reduced accuracy when extracting terraces in complex terrain and under challenging spectral conditions.
Although DL-based research on terrace extraction has achieved some remarkable progress, the complex morphology, topography, and spectral characteristics of terraces in the LP pose significant challenges in achieving high-precision mapping of time-series terrace spatial distributions using multi-source RS data [27]. To address this, this study focused on the LP of China, a region with a high density of terrace distribution, and extracted terrace spatial distribution data for nine periods from 2017 to 2025 using the STDBNet (Swin Transformer-based Terrace Dual-Branch Deformable Boundary Network) model. The main aims of this research are to: (1) construct a multi-source information collaborative framework that fuses Sentinel-2 time-series RS images, high-precision DEM, and slope terrain data to enhance terrace identification under complex topographic conditions; (2) develop a STDBNet model, a novel terrace extraction model that incorporates the Swin Transformer architecture, a dual-branch attention mechanism, and a boundary-assisted supervision strategy, collectively improving multi-scale feature perception and temporal generalization of terrace morphology and boundary delineation; (3) generate an annual terrace distribution dataset for the LP spanning 2017 to 2025, providing continuous, consistent, and high-precision spatial data to support time-series regional monitoring of terraced land; (4) analyze the spatiotemporal evolution of terraces over the past nine years and their distribution patterns across terrain gradients. Our results can offer a scientific basis for sustainable land management, ecological restoration, and the formulation of soil and water conservation policies in LP of China.
2. Data and Methodology
2.1. Study Area
The Loess Plateau (LP) (33°43′N–41°16′N, 100°54′E–114°33′E) (Figure 1) is one of the ecologically fragile regions in the world, highly susceptible to severe soil erosion [28]. The area is predominantly underlain by Quaternary aeolian loess deposits, which have formed distinctive loess landforms, such as plateaus, ridges, and hills. The region features a complex topography with elevations varying from 60 to 5300 m, exhibiting a general trend of lower elevations in the southeast and higher elevations in the northwest [29]. Precipitation is strongly seasonal, with summer rainfall accounting for 55–78% of the annual total. The high frequency of rainstorms intensifies surface runoff and significantly increases the risk of soil erosion [30].
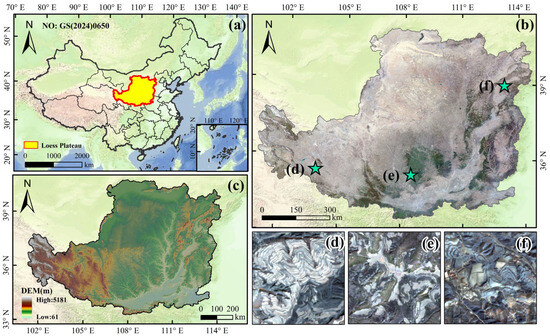
Figure 1.
Location and overview of the LP. (a) Spatial location of the LP, (b) Sentinel-2 image of the LP, (c) DEM data of the LP, (d–f) selected enlarged images of the Sentinel-2 image of the LP. Note: The county map is based on the standard map released by the Ministry of Natural Resources of the People’s Republic of China [No. GS (2024) 0605].
Although terraced fields have long served as a critical soil and water conservation measure on the LP, significantly enhancing soil fertility and increasing crop productivity [5] (Figure 1d–f), they are increasingly facing abandonment and degradation in the ongoing modernization [3]. Furthermore, the Outline of the Comprehensive Management Plan for the LP (2010–2030) set a target of converting 2.608 million hectares of sloping farmland into terraces, underscoring the continued strategic importance of terrace construction. Given this complex context of simultaneous loss and expansion, combined with the inherent spatial fragmentation, complex topography, and spectral similarity to surrounding land covers, high-precision dynamic monitoring of terraces remains a significant challenge.
2.2. Data Source and Preprocessing
This study leveraged the Google Earth Engine (GEE) platform to systematically process Sentinel-2 multispectral surface reflectance (SR) data and ALOS DEM data acquired between 1 January 2017 and 31 June 2025, for terrace feature extraction across the LP. To address the limitations of relying solely on spectral information for accurate identification [31], we integrated the high temporal and spatial resolution spectral features of Sentinel-2 with topographic structural information derived from the ALOS DEM, thereby enhancing the accuracy of terrace detection. To verify the necessity of incorporating terrain features, we conducted a comparative experiment, with results presented in Table 2 of Section 3.1. These findings substantiate our final strategy of multi-source feature fusion.
2.2.1. Sentinel-2 Image Preprocessing
This study utilized Sentinel-2 satellite imagery (European Space Agency, ESA) as the primary RS data source. The Sentinel-2A and 2B satellites are equipped with a Multispectral Imager (MSI) that captures 13 spectral bands ranging from visible to shortwave infrared wavelengths, offering a maximum spatial resolution of 10 m and a 5-day revisit cycle, thereby enabling robust spatiotemporal monitoring capabilities. We employed the COPERNICUS/S2_SR surface reflectance product, which was processed using the Sen2Cor algorithm and includes radiometric, atmospheric, and geometric corrections. To mitigate contamination from clouds, cloud shadows, and snow cover, pixel-level masking was applied using the Scene Classification Layer (SCL). Finally, Sentinel-2 images for each year from 2017 to 2025 were selected based on cloud cover. When cloud cover exceeded 30% between January and March, the time window was extended to May, enabling the generation of an annual composite image comprising RGB bands (B2, B3, B4) at a spatial resolution of 10 m (Figure 1b). This approach established a high-quality basis for distinguishing the spectral characteristics of terraced and non-terraced farmland.
2.2.2. DEM Data and Land Cover Data
This study employed ALOS World 3D-12.5-m DEM data, released by the Japan Aerospace Exploration Agency (JAXA), as the primary topographic data source. The dataset underwent radiometric correction, geometric correction, and noise filtering to ensure data quality. To align with the spatial resolution of Sentinel-2 imagery, the DEM was resampled to 10 m, enabling accurate representation of terraced topography (Figure 1c). This DEM served not only for topographic correction of optical imagery but also facilitated the differentiation of terrace features by quantifying variations in terrain structure. This capability is particularly valuable in areas with bare soil or sparse vegetation cover, where spectral information alone is insufficient for reliable identification, thereby providing a critical basis for refining subsequent terrace extraction results.
Land cover data was obtained from the ESRI 2017–2024 global 10-m-resolution land cover product (https://livingatlas.arcgis.com/landcoverexplorer/(accessed on 20 December 2025)) [32]. Generated using Sentinel-2 imagery and a DL-based semantic segmentation approach, this dataset achieved an overall accuracy of 85% and was utilized for post-processing of terrace extraction results in this study.
2.2.3. Construction of Training and Validation Datasets
To ensure the generalization capability of DL models for terrace extraction across the complex and heterogeneous LP, this study selected 13 representative regions (Figure 2a) encompassing a total area of 11,205.79 km2, based on key geographic, climatic, topographic, and spectral characteristics. Terraced areas were labeled as 1 (black), and non-terraced areas as 0 (white). The labels were subsequently cross-checked and confirmed through consensus to ensure accuracy and reliability. After converting vector labels into raster format, image-label pairs were extracted using a 256 × 256 pixel sliding window (Figure 2b–d). To further improve model robustness, data augmentation techniques including rotation, horizontal and vertical flipping, mirroring, and salt-and-pepper noise addition were applied. The final dataset comprises 16,330 samples, with 13,064 allocated for training and 3266 for validation. Representative sample examples are presented in Figure 2.
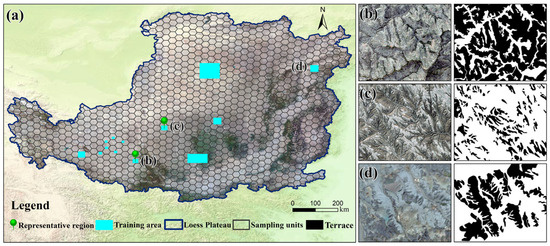
Figure 2.
Spatial distribution of training samples and visualization of typical regions for the terrace extraction model. (a) Spatial distribution of model training data. (b–d) Sentinel-2 images and corresponding labeled examples from representative terraced regions.
2.3. Methods
To address the challenges associated with terrace extraction on the LP from 2017 to 2025, which include cloud cover and terrain shadowing, significant spatiotemporal heterogeneity in spectral and topographic characteristics, difficulties in identifying small-scale terraces, limited model generalization, and insufficient computational efficiency, this study proposed a novel terrace extraction framework (Figure 3).
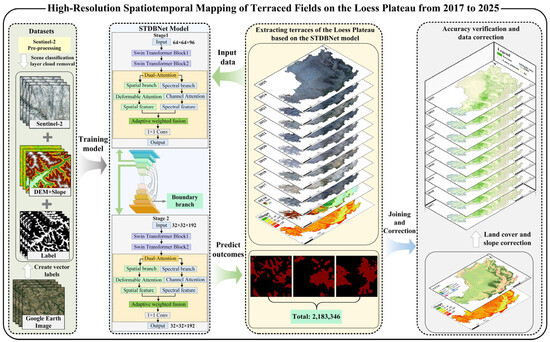
Figure 3.
Flowchart of terrace extraction on the LP from 2017 to 2025 based on multi-source RS.
The framework integrates multi-temporal Sentinel-2 optical data and terrain-derived features as inputs, and incorporates hierarchical Swin Transformer modules within a U-shaped encoder–decoder architecture to enhance global contextual modeling. A dual-branch attention mechanism was introduced to improve the fusion of spatial structure with multi-source spectral and terrain features, using deformable window attention for spatial adaptation and channel attention for feature recalibration. Additionally, a boundary-assisted supervision strategy was embedded to refine the accuracy of terrace boundary delineation. This design enabled efficient capture and robust extraction of terrace features from multi-source, multi-temporal RS imagery, thereby significantly improving the accuracy and generalization of time-series terrace mapping in complex environments. The model was trained using 2020 Sentinel-2 imagery, reference labels derived from co-temporal Google Earth high-resolution images, ALOS DEM, and its derived slope data. The trained model parameters were then applied to predict terrace distributions from 2017 to 2025, enabling consistent and high-precision time-series terrace information extraction.
2.3.1. STDBNet Model Design
In recent years, DL-based semantic segmentation models have been widely adopted for object extraction from RS imagery [33,34]. U-Net, a representative example, employs a symmetrical encoder–decoder architecture integrated with skip connections to achieve high-precision pixel-level localization [35]. However, in RS applications, these models still face challenges including limited global contextual modeling, inefficient integration of high- and low-level features, ambiguous boundary delineation, and inadequate fusion of multi-source information [36,37].
To improve the accuracy and robustness of terrace extraction in the complex environment of the LP, this study proposed the Swin Transformer-based Terrace Dual-Branch Deformable Boundary Network model (STDBNet) (Figure 4). Building upon the symmetric encoder–decoder architecture of U-Net, the model integrates the global contextual modeling capabilities of the Swin Transformer with the local feature extraction strengths of convolutional neural networks [38]. The Swin Transformer utilizes local window self-attention and shifted window mechanisms to enhance representational capacity while reducing computational complexity, making it well-suited for high-resolution dense prediction tasks. However, the within-window self-attention operates globally within each window, which constrains its ability to effectively model irregular shapes, boundary details, and small objects. Moreover, the architecture primarily depends on self-attention and MLP layers, lacking an explicit mechanism for fusing multi-source features. It further incorporated a dual-branch attention mechanism and a boundary-assisted supervision strategy to construct a deep segmentation framework that effectively fuses spatial, spectral, and boundary information, thereby enabling precise delineation of both terrace areas and their boundaries.
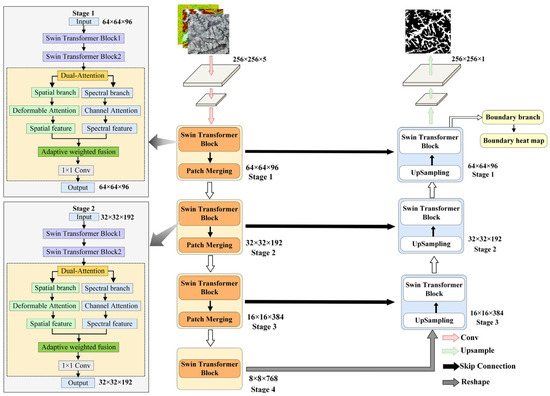
Figure 4.
Schematic diagram of the STDBNet model architecture.
The encoder employed a four-stage hierarchical architecture. Through patch partitioning and progressive downsampling, it constructed a hierarchical feature representation that evolves from low-level local features to high-level semantic features. In the shallow stages (Stages 1–2), each stage incorporated both standard window attention and shifted window attention modules, which captured local structural details and cross-window contextual correlations, respectively, thereby mitigating boundary fragmentation. Dual-branch spatial and spectral attention modules were embedded in these stages to enhance the identification of discriminative features. The spatial branch utilized a deformable window attention mechanism with dynamic offsets to perceive complex geometric structures. The spectral branch introduced a channel attention mechanism that enhances key channel responses of multi-source spectral and topographic features through global average pooling and fully connected layers. The outputs from both branches were adaptively fused via 1 × 1 convolution to generate multi-source enhanced features. In the deep stages (Stages 3–4), a standard Swin Transformer architecture was adopted, where patch merging operations progressively downsample the feature maps to 16 × 16 × 384 and 8 × 8 × 768, respectively, reducing computational complexity while strengthening global semantic representation.
The decoder fuses features from each encoder stage via skip connections, effectively integrating high-level semantic information with low-level spatial details. To further enhance boundary delineation accuracy, an auxiliary boundary supervision branch was incorporated into the intermediate layers of the decoder. This branch explicitly guided the model to learn terrace boundary characteristics through parallel heatmap prediction. Finally, following transposed convolution and feature refinement, a 256 × 256 resolution probability map for terrace segmentation was generated.
2.3.2. Model Training
The training experiments for the proposed model were conducted in Python using the PyTorch 2.3.1 framework. The hardware platform consisted of an Intel Xeon Platinum 8275CL CPU and an NVIDIA GeForce RTX 4080 SUPER GPU. Training was performed with the Adam optimizer, using an initial learning rate of 1 × 10⁻⁵, a batch size of 16, and a total of 200 epochs. All other hyperparameters were maintained at their default values. The training loss and performance metrics are presented in Figure 5.
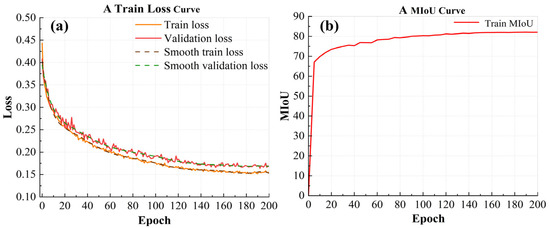
Figure 5.
Schematic diagram of the STDBNet model training process. (a) Loss curves for the training and validation sets. (b) MIoU trend in the training set.
2.3.3. STDBNet Model Evaluation
To evaluate model performance, the trained STDBNet model was applied to the test set for prediction. The predicted results were compared pixel by pixel with the actual labels, which were visually interpreted by experts based on high-resolution Google Earth imagery from 2020, to quantify classification errors. Confusion matrices were computed to derive evaluation metrics including overall accuracy (OA), mean intersection over union (MIoU), precision, recall, and F1-score, enabling quantitative comparison of terrace extraction performance across the five models (Table 1). For this binary classification task, the confusion matrix was configured as a 2 × 2 matrix, encompassing four fundamental components: true positives (TP), true negatives (TN), false positives (FP), and false negatives (FN). In addition to these metrics, the extraction results were further validated and refined using high-resolution DEM and land cover data to enhance the reliability and credibility of the final outputs.

Table 1.
Model evaluation metrics and their corresponding calculation formulas.
2.4. Post-Processing
This study utilized the DEM and land cover data described in Section 2.2.2 to post-process and refine the terrace extraction results for the LP from 2017 to 2025. First, a slope map was derived from the DEM and integrated with the land cover data through spatial overlay. Using the initial terrace distribution map as a mask, land cover type and slope attributes were evaluated on a pixel-by-pixel basis. Pixels classified as roads, buildings, or water bodies, or exhibiting a slope less than 2° [6], were reclassified as non-terraced (assigned a value of 0); all other pixels were retained as terraced (assigned a value of 1).
3. Results
3.1. Comparative Analysis of Model Performance
To assess the necessity of incorporating topographic features in terrace extraction, we designed a comparative experiment to evaluate the impact of integrating digital elevation model (DEM) and slope data on model performance. The results demonstrate that the inclusion of topographic features significantly enhances classification accuracy, with OA and MIoU increasing by 2.34% and 1.51%, respectively (Table 2). The integration of topographic information improves the model’s capability to delineate terrace structures and boundaries, particularly in regions with complex terrain and spectrally similar land cover, where it exhibits greater robustness. These findings support the adoption of a multi-source input framework that combines spectral and topographic features for high-accuracy terrace mapping.
Table 2.
Model performance evaluation under different input feature configurations.
To systematically evaluate terrace extraction performance, this study compared the effectiveness of four semantic segmentation models, STDBNet, U-Net, DeepLabV3+, and PSPNet, using both visual interpretation and quantitative metrics. The results are presented in Figure 6 and Table 3. At the visual interpretation level, based on spectral and topographic characteristics, this study selected hilly areas with sparse vegetation and bare ground, hilly regions with dense vegetation cover, and river valley areas (Figure 6a–c). STDBNet, leveraging its hierarchical Swin Transformer architecture and dual-branch attention mechanism, achieved superior extraction performance. The model produced terrace segmentation results with clear boundaries and structurally intact patterns, showing high consistency with the actual spatial distribution. It was particularly effective in identifying fragmented terrace patches, even in areas with complex terrain. The results from U-Net and DeepLabV3+ exhibited morphological fragmentation and blurred boundaries, with limited capability in recognizing small-scale terraces. Due to structural limitations, PSPNet suffered from significant under-detection and over-merging, leading to substantial loss of spatial detail. Quantitative analysis further confirmed the visual evaluation results (Table 3). STDBNet achieved an OA of 91.32% and a MIoU of 84.07%, significantly outperforming the other models. U-Net’s OA and MIoU were 6.43% and 9.71% lower than those of STDBNet, respectively. The performance gap for DeepLabV3+ was even larger, with reductions of 7.73% in OA and 10.42% in MIoU; its recall reached only 80.14%, indicating a high rate of missed detections. PSPNet delivered the lowest performance, with OA and MIoU decreasing by 12.62% and 16.02%, respectively. It showed substantial deficiencies across all evaluation metrics, and its overall performance was markedly inferior to that of the other models.
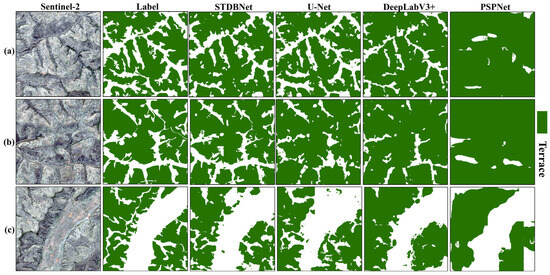
Figure 6.
Comparison of terrace extraction results on the LP using different semantic segmentation models. (a) Extraction results in a hilly area with mixed vegetation and bare land. (b) Extraction results in a vegetated hilly area. (c) Extraction results in a river valley area.
Table 3.
Evaluation results of terrace extraction accuracy derived from the models (unit: %).
Combining visual evaluation and quantitative analysis, STDBNet demonstrated superior performance in the terraced field semantic segmentation task, enabling high-precision and high-fidelity extraction of terraced field information. In contrast, the U-Net, DeepLabV3+, and PSPNet models exhibited varying degrees of performance bottlenecks in terms of extraction accuracy, structural completeness, and detail preservation, leading to a progressive decline in their overall performance.
3.2. Correction and Refinement of Terrace Data Products
This study conducted post-processing on the LP terrace data from 2017 to 2025, initially extracted using the STDBNet model (Figure 7). Before correction, the original results achieved an OA, F1-score, and MIoU of 91.32%, 90.12%, and 84.07%, respectively. After stepwise refinement using land cover and terrain slope data, all evaluation metrics showed significant improvement. OA increased by 1.73% after land cover correction and by an additional 2.21% after slope correction, reaching 95.26%; F1-score rose by 1.46% and 1.74%, respectively, ultimately achieving 93.32%; MIoU improved by 1.08% and 1.69%, respectively, reaching 86.84%. To visually illustrate the impact of correction on spatial extent, a representative region (first row) was selected as an example (Figure 7a–e). The model initially predicted a terraced area of 151.82 km2, which was reduced to 150.46 km2 after land cover data correction. Subsequent correction using slope data further refined the estimate to 148.25 km2. This trend aligned with the quantitative metrics, indicating that terrain slope correction plays the most significant role in eliminating non-terraced pixels, such as flat construction land and naturally gentle slopes. While land cover data correction effectively removed certain water bodies and built-up areas, its effectiveness remained limited due to the high spectral similarity between vegetated terraces and grassland farmland. In summary, the multi-source data collaborative correction strategy substantially enhanced the accuracy and reliability of the final terrace distribution map.
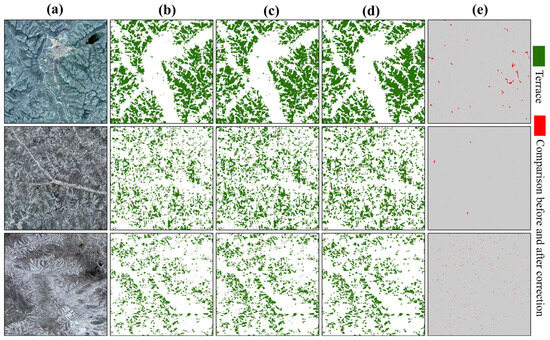
Figure 7.
Comparison of multi-source data for terraced fields in different typical regions before and after correction. (a) Sentinel-2 imagery. (b) Initial terrace extraction results from the STDBNet model. (c) Results after land cover data-based correction. (d) Results after integrated correction using both land cover and slope data. (e) Visual comparison of terrace maps before and after final refinement. Each row illustrates the correction process for a representative region.
3.3. Analysis of Spatial Distribution Characteristics of Terraces on the LP
3.3.1. Spatial Distribution Patterns of Terraces on the LP
Based on multi-source RS data and DL-based extraction results, this study further analyzed the spatiotemporal distribution and dynamic changes in terraces on the LP from 2017 to 2025 (Figure 8).
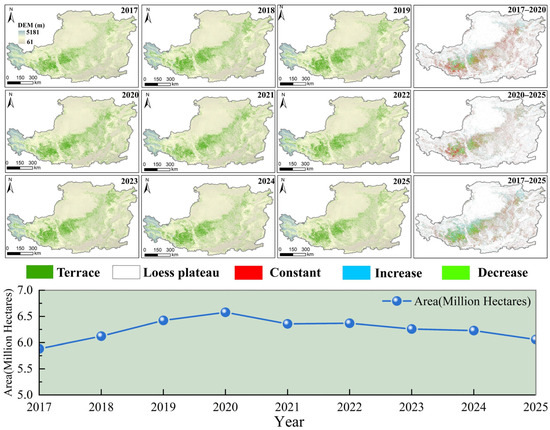
Figure 8.
Spatiotemporal distribution characteristics and area statistics of terraces on the LP from 2017 to 2025. The fourth column, from top to bottom, presents the spatial distribution of changes in terraced fields on the Loess Plateau for the period 2017–2020, the second for 2020–2025, and the third for the full period 2017–2025.
Terraces are concentrated in the hilly and gully regions of the central, western, and eastern LP, such as western Shanxi, northern Shaanxi, and eastern Gansu. These areas are characterized by fragmented terrain and steep slopes, and are highly susceptible to soil erosion, resulting in a densely distributed and fragmented terrace landscape. In contrast, terraces are sparsely distributed and exhibit more regular shapes in the flat regions of the LP due to the relatively gentle topography. The spatial pattern of terraces is strongly influenced by geomorphic conditions and shows high consistency with areas prone to severe soil erosion, reflecting human adaptive strategies for managing fragile ecological environments. Over time, the spatial distribution of terraces has remained largely stable, with persistent clustering in core areas, demonstrating the long-term adaptability of terrace systems to local terrain conditions.
From a spatial perspective, the distribution of terraced fields on the Loess Plateau is strongly coupled with regional topographic characteristics, exhibiting an overall stable pattern concentrated in the central and southern regions as well as hilly gully areas. Over time, from 2017 to 2020, the terrace landscape was predominantly characterized by stable areas (red), with only minor local changes. The areas with reduced area (green) primarily correspond to small-scale projects involving the conversion of farmland to forest and grassland and high-standard farmland construction, whereas the areas with increased area (blue) are associated with terraced management of scattered sloping farmland. From 2020 to 2025, stable areas continued to dominate, with no significant extension in the spatial extent of gains or losses. This stability is attributed to the ongoing implementation of ecological restoration policies and routine maintenance of existing terraces. Across the entire study period, the overall spatial configuration of terraces remained largely unchanged, with only limited local adjustments. This persistence can be primarily explained by the role of terraces as a key intervention integrating soil and water conservation with agricultural production, which has long been adapted to local natural conditions and farming practices. Secondly, the coordinated management of ecological and agricultural policies has effectively balanced environmental protection goals with land use stability, thereby constraining large-scale changes in terrace extent.
In terms of area changes, terraced fields generally exhibited a fluctuating trend from 2017 to 2025, characterized by an initial increase followed by a gradual decline. From 2017 to 2020, the terraced field area increased continuously from 5.88 million hectares to 6.58 million hectares, with particularly pronounced growth between 2017 and 2019, likely attributable to the concentrated implementation of soil and water conservation projects. After 2021, the area began to decrease, declining from 6.36 million hectares to 6.06 million hectares by 2025. This trend may be influenced by factors such as optimization of land use structure and adjustments in terraced field management and protection policies.
From 2017 to 2025, overall, the spatial distribution of terraces on the LP was closely coupled with the local geomorphology, while temporally exhibiting a dynamic pattern of initial growth followed by gradual decline. This spatiotemporal evolution provides an important spatial foundation for assessing the effectiveness of soil and water conservation measures and optimizing regional land use policies.
3.3.2. Characteristics of Terraced Field Distribution in Relation to Topographic Gradient
Based on the spatial distribution data of terraces on the LP from 2017 to 2025, this study further analyzed their distribution patterns across different terrain factor gradients (Figure 9).
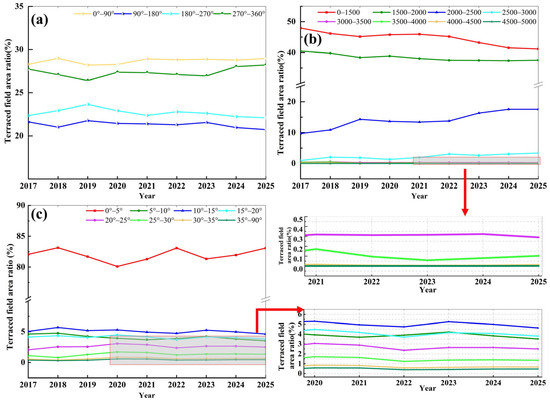
Figure 9.
Temporal distribution characteristics of terraced fields on the LP across different topographic gradients from 2017 to 2025: (a) aspect, (b) elevation gradient, and (c) slope.
Terraces exhibited a distinct low-altitude distribution pattern, primarily concentrated below 1500 m, accounting for 41.15–47.96% of the total area. The 1500–2000-m elevation band represented the second major distribution zone, contributing 37.44–40.47%. The proportion of terraced area decreased with increasing elevation, with the 2000–2500-m range accounting for 9.68–17.58%. Areas above 2500 m constituted less than 3.5%, and those above 3500 m account for less than 0.1%. This distribution was closely associated with favorable conditions in low-altitude regions, including a mild climate, thick soil layers, relatively accessible irrigation, and suitability for agricultural cultivation. In contrast, high-elevation areas faced constraints such as fragmented terrain, cold climatic conditions, and limited arable land resources, which hindered large-scale terrace development. Over time, the proportion of terraces in low-altitude areas has fluctuated and gradually declined, while that in mid-elevation zones (2000–2500 m) has increased (Figure 9b). This shift may be attributed to the construction and consolidation of high-slope terraces driven by ecological restoration policies.
In terms of slope, terraces were highly concentrated in areas with gentle slopes of 5° or less, accounting for over 80% each year. Terraces on slopes between 5° and 20° accounted for 3.5–5.7%, while those on steep slopes above 20° constituted less than 5% of the total area. Among these, terraces with slopes of 25° or greater represented less than 1.7% (Figure 9c). These findings indicate that the distribution of terraces across the LP is predominantly on gentle slopes, with moderate slopes playing a supplementary role. This pattern arises because gentle slopes facilitate mechanized farming and the construction of farmland infrastructure, leading to improved soil retention, lower engineering costs, and reduced maintenance requirements for terrace implementation. In contrast, steep slopes are generally unsuitable for large-scale terrace development due to terrain instability, severe soil erosion, and high construction costs.
In terms of aspect, terraces were relatively evenly distributed, with a slight concentration on eastern (0–90°) and northern slopes (270–360°). The proportions on southern (90–180°) and western slopes (180–270°) were slightly lower, and no significant temporal trend was observed (Figure 9a). In contrast, the southern and western slopes were exposed to stronger solar radiation and higher evaporation due to arid conditions, resulting in less favorable farming environments.
4. Discussion
4.1. Comparison with Existing Terrace Data Products
After reviewing existing terrace data products for the LP, this study selected the China Terrace Map (CTM) [39] and the Terrace Distribution Map of the LP (TDMLP) [40] as reference datasets for comparison. Two complementary approaches were employed to evaluate the three LP terrace data products. First, a comparative analysis was conducted based on spatial resolution, terrace extraction methods, training and validation datasets, and reported accuracy metrics. Second, the consistency and discrepancies among the extraction methods were assessed through case studies in selected regions.
In terms of product characteristics, the three data sources differ in spatial resolution, input data, and methodological approaches. This study leveraged Sentinel-2 imagery, DEM, and slope data, and employed the STDBNet model, which is designed for complex and heterogeneous spectral signatures, land cover types, and terrain conditions, to generate a 10-m-resolution terraced field dataset for the LP from 2017 to 2025. The CTM, based on Landsat-8 and SRTM DEMs, utilized a random forest algorithm to produce a 30-m-resolution national-scale product. TDMLP, using Google Maps imagery as its primary data source, generated a 1.89-m-resolution map for the LP through the U-Net++ model. Regarding sampling strategies, this study selected 13 representative regions via unsupervised clustering combined with stratified sampling. CTM adopted hexagonal random sampling, whereas TDMLP used entire counties as sampling units. Accuracy evaluation revealed that the user accuracy, producer accuracy, and IoU of the proposed product increased by 15.32%, 23.83%, and 29.03%, respectively, compared to those of CTM indicating significantly improved classification consistency.
The second method evaluated the terrace extraction performance of the three models across representative regions (Figure 10). In terms of spatial distribution, all three products successfully identified the major terrace areas; however, notable discrepancies were observed in regions with complex terrain. The overall spatial patterns (Figure 10a–c) indicate that our results align most closely with the geomorphological characteristics of the LP, with terrace distribution strongly coupled to topographic relief in gully areas. For instance, in the hilly and gully regions of the LP, our mapped terrace patches closely follow the actual terrain morphology, whereas TDMLP (Figure 10b) and CTM (Figure 10c) exhibit significant over-extraction, identifying numerous false terraces in non-terraced landforms, which contradicts the actual landscape configuration. In localized selected areas (Figure 10d–h), our approach accurately captured scattered terrace patches, with minimal false positives in sparsely terraced zones. In contrast, both CTM and TDMLP show blurred boundaries and merging of fragmented terrace features. Furthermore, the STDBNet model proposed in this study achieved an OA, Recall, Precision, and F1-Score exceeding 90%, and an MIoU greater than 80% based on confusion matrix analysis. These evaluation metrics demonstrate high extraction accuracy and reliability of the generated terrace dataset. Finally, using Figure 10d as a case, the terrace area extracted in this study is 12.60 km2, which is 6.45 km2 and 7.92 km2 less than that of TDMLP (19.05 km2) and CTM (20.52 km2), respectively. This indicates that our model offers distinct advantages in precise boundary delineation and detection of dispersed terraces. Therefore, the results of this study are more accurate, credible, and reliable.
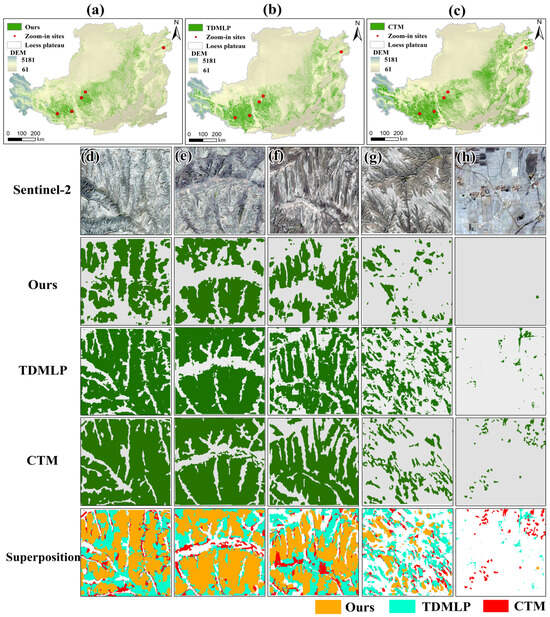
Figure 10.
Comparison of terrace data products across the LP: (a) spatial distribution from this study, (b) TDMLP, (c) CTM, and (d–h) detailed distributions in representative regions. The bottom row presents a spatial comparison among the three datasets.
4.2. Model Performance Analysis
This study developed the STDBNet model to address the challenges of terrace extraction on the LP, including complex landform structures, blurred ridge boundaries, and difficulties in fusing multi-scale features. The model integrates a dual-branch attention mechanism to effectively coordinate spatial and spectral information. It incorporates deformable convolution to enhance geometric modeling of irregular terrace boundaries and employs a boundary-assisted supervision mechanism to improve detail preservation. The results demonstrate that the model exhibits strong robustness across diverse landform units, such as hills and valleys. The overall classification accuracy increases by 2.46% compared to a recent terrace extraction method based on Sentinel-2 imagery [26], and by 6.43%, 7.73%, and 12.62% relative to the U-Net, DeepLabV3+, and PSPNet baseline models, respectively. These results confirm the effectiveness of tailoring DL architectures to specific geomorphological contexts.
From a model architecture perspective, the performance improvement of STDBNet primarily arises from its hybrid design integrating a vision Transformer and a convolutional neural network. The Swin Transformer, serving as the backbone network, exhibits strong global semantic representation capabilities [37]. This study further enhances its adaptability to curved terrace boundaries by incorporating a deformable attention mechanism. However, relying solely on the Transformer architecture may lead to the neglect of local details, particularly under conditions of uneven sample distribution. To address this limitation, the dual-branch attention mechanism embedded in the model effectively integrates the strengths of CNNs in capturing fine-grained local features, thereby establishing a feature representation framework that synergistically combines global and local information. Multi-region validation demonstrates that this architectural design achieves an optimal balance between boundary precision and regional coherence, enhancing the model’s generalization ability and stability across diverse landform types while mitigating the risk of overfitting associated with excessive model complexity [41].
4.3. STDBNet Model Error Analysis and Future Research Work
Although the STDBNet model demonstrates strong performance in extracting time-series terraces on the LP, its results still exhibit certain limitations, primarily manifested in three aspects: data quality, model architecture, and regional landscape heterogeneity factors that collectively represent the main constraints of this study.
In terms of data quality, the temporal phasing and spatial resolution of RS imagery, along with the accuracy of auxiliary datasets, constitute key sources of error. Sentinel-2 imagery may lead to spectral confusion between terraced fields and surrounding land cover types during specific vegetation phenological stages. Although a 10-m resolution satisfies most recognition requirements, small and fragmented terrace patches are often undetected. Furthermore, inherent inaccuracies in the land cover data used for post-processing corrections negatively impact their reliability. Additionally, the representativeness and annotation quality of training samples constrain the model’s generalization capability [42].
In terms of model architecture, limitations in feature extraction and uncertainties during the training process jointly affect classification accuracy. Given the high morphological, spectral, and topographical diversity of terraced fields, the model’s capacity to accurately identify small terraces and curved boundaries in complex landscapes remains limited, resulting in misclassification of spectrally similar land cover types, such as grassland and cultivated land, and omission of fragmented terrace patches.
The intense landscape heterogeneity of the LP further exacerbates identification challenges. The region features a fragmented topography, with terraces widely dispersed across the terrain. Small terrace patches are easily confused with adjacent topographic units such as gullies and bare slopes, resulting in boundary misclassification or omission. Moreover, the spectral signatures of terraces overlap with those of grasslands and cultivated land during different phenological stages. Additionally, certain artificial structures exhibit high morphological and spectral similarity to terraces. These phenomena, such as “same object, different spectrum” and “different objects, same spectrum”, interfere with the model’s discriminative capability.
To address the aforementioned limitations, future research can focus on the following improvements: (1) enhance the model’s capability to extract features from diverse terrace types by incorporating more sophisticated convolutional architectures and skip connection mechanisms, thereby improving detail preservation and background suppression [43]; (2) implement a multi-scale feature fusion strategy to integrate spectral and contextual information across hierarchical levels, enhancing adaptability to both spectral heterogeneity and homogeneity [44]; (3) investigate the integration of multi-source, high-dimensional topographic data such as curvature and topographic position index to enhance the capability of deep learning models in accurately identifying terraces, particularly small-scale terraces and morphologically complex landforms, from high-resolution imagery [25]; and (4) integrate high-resolution RS data, such as drone imagery, particularly in complex terrain areas, to improve recognition accuracy and boundary delineation for small-scale terraces [45]. Based on a high-resolution time-series dataset of terraced fields and by integrating climate, policy, and socioeconomic data, this study quantitatively examines the spatiotemporal dynamics and driving factors of terraced field area changes across different altitudes and slope gradients [4]. Through comprehensive optimization across data, samples, and model design, further improvements in the accuracy and reliability of terrace extraction are anticipated.
5. Conclusions
This study addresses the technical challenges of high-precision temporal mapping of terraces in the complex environment of the LP. We propose the STDBNet model, which integrates multi-source RS data within a DL framework. By incorporating the Swin Transformer architecture, a dual-branch attention mechanism, and a boundary-assisted supervision strategy, the proposed model enables accurate terrace boundary delineation and effective fusion of multi-source features, resulting in the first 10-m-resolution spatiotemporal dataset of terrace distribution across the LP, encompassing nine annual periods from 2017 to 2025. The model demonstrates exceptional performance, achieving 95.26% OA and 86.84% MIoU, substantially outperforming established semantic segmentation benchmarks including U-Net and DeepLabV3+. These results confirm the model’s strong capability in handling complex terrain and spectral variations for precise terrace identification. Analysis of the derived dataset reveals distinct spatiotemporal patterns in terrace distribution across the LP. Temporally, the terrace area showed a fluctuating trend, characterized by an initial increase followed by a gradual decline over the 2017–2025 period. Spatially, terraces were predominantly found in low-elevation areas with gentle slopes (≤5°), with relatively uniform distribution across slope aspects. These patterns reflect both the natural topographic constraints and the ongoing human modifications shaping the terrace landscape. The research provides an extensible technical framework for automated terrace mapping in complex environments and delivers the first high-resolution, multi-temporal terrace dataset for the LP. These contributions establish a reliable foundation for monitoring terrace dynamics, assessing soil erosion, and evaluating ecological restoration effects [46]. Furthermore, the findings offer scientific support for formulating regional soil and water conservation strategies and promoting sustainable agricultural landscape management, underscoring the study’s relevance for ecological assessment and land-use policy.
Author Contributions
G.K.: writing—original draft, writing—review & editing, methodology, formal analysis, data curation, conceptualization. J.X.: writing—original draft, conceptualization. B.L.: writing—review & editing, formal analysis, methodology. B.W.: writing—original draft, data curation. C.H.: writing—review & editing, data curation. H.Y.: writing—review & editing, conceptualization. All authors have read and agreed to the published version of the manuscript.
Funding
This work was supported by the Gansu Provincial Science and Technology Planning Project (23ZDFA018, 25YFFA007), the Western Light Project of the Chinese Academy of Sciences (xbzglzb2022018), and the Gansu Province Longyuan Youth Talent Program, which funded this project.
Data Availability Statement
The 10-m-resolution spatiotemporal distribution dataset of terraced fields on the Loess Plateau (2017–2025) is accessible for download at https://zenodo.org/records/18052358 (accessed on 23 December 2025).
Conflicts of Interest
The authors declare that they have no conflicts of interest.
References
- Chen, L.; Wei, W.; Tong, B.; Liu, Y.; Liu, Z.; Chen, S.; Chen, D. Long-term terrace change and ecosystem service response in an inland mountain province of China. Catena 2024, 234, 107586. [Google Scholar] [CrossRef]
- Li, X.H.; Yang, J.; Zhao, C.Y.; Wang, B. Runoff and sediment from orchard terraces in southeastern China. Land Degrad. Dev. 2014, 25, 184–192. [Google Scholar] [CrossRef]
- Wen, X.; Zhen, L. Soil erosion control practices in the Chinese Loess Plateau: A systematic review. Environ. Dev. 2020, 34, 100493. [Google Scholar] [CrossRef]
- Wei, W.; Chen, D.; Wang, L.; Daryanto, S.; Chen, L.; Yu, Y.; Feng, T. Global synthesis of the classifications, distributions, benefits and issues of terracing. Earth-Sci. Rev. 2016, 159, 388–403. [Google Scholar] [CrossRef]
- Deng, C.; Zhang, G.; Liu, Y.; Nie, X.; Li, Z.; Liu, J.; Zhu, D. Advantages and disadvantages of terracing: A comprehensive review. Int. Soil Water Conserv. Res. 2021, 9, 344–359. [Google Scholar] [CrossRef]
- Liu, X.; Xin, L.; Lu, Y. National scale assessment of the soil erosion and conservation function of terraces in China. Ecol. Indic. 2021, 129, 107940. [Google Scholar] [CrossRef]
- Zhang, Y.; Shi, M.; Zhao, X.; Wang, X.; Luo, Z. Methods for automatic identification and extraction of terraces from high spatial resolution satellite data (China-GF-1). Int. Soil Water Conserv. Res. 2017, 5, 17–25. [Google Scholar] [CrossRef]
- Guo, H.; Sun, L.; Yao, A.; Chen, Z.; Feng, H.; Wu, S.; Siddique, K.H. Abandoned terrace recognition based on deep learning and change detection on the Loess Plateau in China. Land Degrad. Dev. 2023, 34, 2349–2365. [Google Scholar] [CrossRef]
- Sun, W.; Zhang, Y.; Mu, X.; Li, J.; Gao, P.; Zhao, G.; Chiew, F. Identifying terraces in the hilly and gully regions of the Loess Plateau in China. Land Degrad. Dev. 2019, 30, 2126–2138. [Google Scholar] [CrossRef]
- Zhao, Y.; Zou, J.; Liu, S.; Xie, Y. Terrace Extraction Method Based on Remote Sensing and a Novel Deep Learning Framework. Remote Sens. 2024, 16, 1649. [Google Scholar] [CrossRef]
- Agnoletti, M.; Cargnello, G.; Gardin, L.; Santoro, A.; Bazzoffi, P.; Sansone, L.; Belfiore, N. Traditional landscape and rural development: Comparative study in three terraced areas in northern, central and southern Italy to evaluate the efficacy of GAEC standard 4.4 of cross compliance. Ital. J. Agron. 2011, 6, 121–139. [Google Scholar] [CrossRef]
- Luo, L.; Li, F.; Dai, Z.; Yang, X.; Liu, W.; Fang, X. Terrace extraction based on remote sensing images and digital elevation model in the loess plateau, China. Earth Sci. Inform. 2020, 13, 433–446. [Google Scholar] [CrossRef]
- Kan, G.; Gong, J.; Wang, B.; Li, X.; Shi, J.; Ma, Y.; Zhang, J. A Refined Terrace Extraction Method Based on a Local Optimization Model Using GF-2 Images. Remote Sens. 2024, 17, 12. [Google Scholar] [CrossRef]
- Yu, M.; Rui, X.; Xie, W.; Xu, X.; Wei, W. Research on automatic identification method of terraces on the loess plateau based on deep transfer learning. Remote Sens. 2022, 14, 2446. [Google Scholar] [CrossRef]
- Ferrarese, F.; Pappalardo, S.E.; Cosner, A.; Brugnaro, S.; Alum, K.; Dal Pozzo, A.; De Marchi, M. Mapping agricultural terraces in Italy. Methodologies applied in the MAPTER project. In World Terraced Landscapes: History, Environment, Quality of Life; Springer International Publishing: Cham, Switzerland, 2018; pp. 179–194. [Google Scholar] [CrossRef]
- Li, Y.; Gong, J.; Wang, D.; An, L.; Li, R. Sloping farmland identification using hierarchical classification in the Xi-He region of China. Int. J. Remote Sens. 2013, 34, 545–562. [Google Scholar] [CrossRef]
- Dai, W.; Na, J.; Huang, N.; Hu, G.; Yang, X.; Tang, G.; Xiong, L.; Li, F. Integrated edge detection and terrain analysis for agricultural terrace delineation from remote sensing images. Int. J. Geogr. Inf. Sci. 2020, 34, 484–503. [Google Scholar] [CrossRef]
- Zhao, H.; Fang, X.; Ding, H.; Strobl, J.; Xiong, L.; Na, J.; Tang, G. Extraction of terraces on the Loess Plateau from high-resolution DEMs and imagery utilizing object-based image analysis. ISPRS Int. J. Geo-Inf. 2017, 6, 157. [Google Scholar] [CrossRef]
- Capolupo, A.; Kooistra, L.; Boccia, L. A novel approach for detecting agricultural terraced landscapes from historical and contemporaneous photogrammetric aerial photos. Int. J. Appl. Earth Obs. Geoinf. 2018, 73, 800–810. [Google Scholar] [CrossRef]
- Safonova, A.; Ghazaryan, G.; Stiller, S.; Main-Knorn, M.; Nendel, C.; Ryo, M. Ten deep learning techniques to address small data problems with remote sensing. Int. J. Appl. Earth Obs. Geoinf. 2023, 125, 103569. [Google Scholar] [CrossRef]
- Liu, Z.; Li, N.; Wang, L.; Zhu, J.; Qin, F. A multi-angle comprehensive solution based on deep learning to extract cultivated land information from high-resolution remote sensing images. Ecol. Indic. 2022, 141, 108961. [Google Scholar] [CrossRef]
- Yang, R.; Zhong, Y.; Su, Y. Multi-E2E: An end-to-end urban land-use mapping framework integrating high-resolution remote sensing images and multi-source geographical data. Remote Sens. Environ. 2025, 330, 114966. [Google Scholar] [CrossRef]
- Zhou, J.; Gu, X.; Gong, H.; Yang, X.; Sun, Q.; Guo, L.; Pan, Y. Intelligent classification of maize straw types from UAV remote sensing images using DenseNet201 deep transfer learning algorithm. Ecol. Indic. 2024, 166, 112331. [Google Scholar] [CrossRef]
- Ding, H.; Na, J.; Jiang, S.; Zhu, J.; Liu, K.; Fu, Y.; Li, F. Evaluation of three different machine learning methods for object-based artificial terrace mapping—A case study of the loess plateau, China. Remote Sens. 2021, 13, 1021. [Google Scholar] [CrossRef]
- Liu, Z.; Chen, G.; Tang, B.; Wen, Q.; Tan, R.; Huang, Y. Regional scale terrace mapping in fragmented mountainous areas using multi-source remote sensing data and sample purification strategy. Sci. Total Environ. 2024, 925, 171366. [Google Scholar] [CrossRef]
- Li, Y.; Tian, F.; Zhang, M.; Zeng, H.; Ahmed, S.; Qin, X.; Wu, B. A 10-meter global terrace mapping using sentinel-2 imagery and topographic features with deep learning methods and cloud computing platform support. Int. J. Appl. Earth Obs. Geoinf. 2025, 139, 104528. [Google Scholar] [CrossRef]
- Wu, B.; Tian, F.; Nabil, M.; Bofana, J.; Lu, Y.; Elnashar, A.; Zhu, W. Mapping global maximum irrigation extent at 30m resolution using the irrigation performances under drought stress. Glob. Environ. Change 2023, 79, 102652. [Google Scholar] [CrossRef]
- Liu, R.; Yang, L.; Shi, Z.; Xing, M. Assessment of the applicability of multi-satellite precipitation products on the Loess Plateau over the past four decades. Int. J. Appl. Earth Obs. Geoinf. 2025, 141, 104634. [Google Scholar] [CrossRef]
- Fang, W.; Huang, S.; Huang, Q.; Huang, G.; Wang, H.; Leng, G.; Guo, Y. Probabilistic assessment of remote sensing-based terrestrial vegetation vulnerability to drought stress of the Loess Plateau in China. Remote Sens. Environ. 2019, 232, 111290. [Google Scholar] [CrossRef]
- Liu, Z.; Shao, M.A.; Wang, Y. Effect of environmental factors on regional soil organic carbon stocks across the Loess Plateau region, China. Agric. Ecosyst. Environ. 2011, 142, 184–194. [Google Scholar] [CrossRef]
- Qu, T.; Wang, H.; Li, X.; Luo, D.; Yang, Y.; Liu, J.; Zhang, Y. A fine crop classification model based on multitemporal Sentinel-2 images. Int. J. Appl. Earth Obs. Geoinf. 2024, 134, 104172. [Google Scholar] [CrossRef]
- Karra, K.; Kontgis, C.; Statman-Weil, Z.; Mazzariello, J.C.; Mathis, M.; Brumby, S.P. Global land use/land cover with Sentinel 2 and deep learning. In Proceedings of the 2021 IEEE International Geoscience and Remote Sensing Symposium IGARSS, Brussels, Belgium, 11–16 July 2021; IEEE: Piscataway, NJ, USA; pp. 4704–4707. [Google Scholar] [CrossRef]
- Ma, L.; Liu, Y.; Zhang, X.; Ye, Y.; Yin, G.; Johnson, B.A. Deep learning in remote sensing applications: A meta-analysis and review. ISPRS J. Photogramm. Remote Sens. 2019, 152, 166–177. [Google Scholar] [CrossRef]
- Sun, Y.; Tian, Y.; Xu, Y. Problems of encoder-decoder frameworks for high-resolution remote sensing image segmentation: Structural stereotype and insufficient learning. Neurocomputing 2019, 330, 297–304. [Google Scholar] [CrossRef]
- Ronneberger, O.; Fischer, P.; Brox, T. U-Net: Convolutional Networks for Biomedical Image Segmentation. In Proceedings of the Medical Image Computing and Computer-Assisted Intervention–MICCAI 2015: 18th International Conference, Munich, Germany, 5–9 October 2015. [Google Scholar] [CrossRef]
- Chen, R.; Zhou, Y.; Wang, Z.; Li, Y.; Li, F.; Yang, F. Towards accurate mapping of loess waterworn gully by integrating google earth imagery and DEM using deep learning. Int. Soil Water Conserv. Res. 2024, 12, 13–28. [Google Scholar] [CrossRef]
- He, X.; Zhou, Y.; Zhao, J.; Zhang, D.; Yao, R.; Xue, Y. Swin transformer embedding UNet for remote sensing image semantic segmentation. IEEE Trans. Geosci. Remote Sens. 2022, 60, 1–15. [Google Scholar] [CrossRef]
- Liu, Z.; Lin, Y.; Cao, Y.; Hu, H.; Wei, Y.; Zhang, Z.; Lin, S.; Guo, B. Swin transformer: Hierarchical vision transformer using shifted windows. In Proceedings of the IEEE/CVF International Conference on Computer Vision 2021, Online, 11–17 October 2021; pp. 10012–10022. [Google Scholar] [CrossRef]
- Cao, B.; Yu, L.; Naipal, V.; Ciais, P.; Li, W.; Zhao, Y.; Gong, P. A 30-meter terrace mapping in China using Landsat 8 imagery and digital elevation model based on the Google Earth Engine. Earth Syst. Sci. Data Discuss. 2020, 13, 2437–2456. [Google Scholar] [CrossRef]
- Lu, Y.; Li, X.; Xin, L.; Song, H.; Wang, X. Mapping the terraces on the Loess Plateau based on a deep learning-based model at 1.89 m resolution. Sci. Data 2023, 10, 115. [Google Scholar] [CrossRef] [PubMed]
- Lalitha, V.; Latha, B.J.M.T.P. A review on remote sensing imagery augmentation using deep learning. Mater. Today Proc. 2022, 62, 4772–4778. [Google Scholar] [CrossRef]
- Liu, B.; Zhang, B.; Feng, H.; Wu, S.; Yang, J.; Zou, Y.; Siddique, K.H. Ephemeral gully recognition and accuracy evaluation using deep learning in the hilly and gully region of the Loess Plateau in China. Int. Soil Water Conserv. Res. 2022, 10, 371–381. [Google Scholar] [CrossRef]
- Wang, X.; Hu, Z.; Shi, S.; Hou, M.; Xu, L.; Zhang, X. A deep learning method for optimizing semantic segmentation accuracy of remote sensing images based on improved UNet. Sci. Rep. 2023, 13, 7600. [Google Scholar] [CrossRef] [PubMed]
- Huang, X.; Wang, H.; Li, X. A multi-scale semantic feature fusion method for remote sensing crop classification. Comput. Electron. Agric. 2024, 224, 109185. [Google Scholar] [CrossRef]
- Zhao, F.; Xiong, L.Y.; Wang, C.; Wang, H.R.; Wei, H.; Tang, G.A. Terraces mapping by using deep learning approach from remote sensing images and digital elevation models. Trans. GIS 2021, 25, 2438–2454. [Google Scholar] [CrossRef]
- Yang, H. China’s soil plan needs strong support. Nature 2016, 536, 375. [Google Scholar] [CrossRef] [PubMed]


Disclaimer/Publisher’s Note: The statements, opinions and data contained in all publications are solely those of the individual author(s) and contributor(s) and not of MDPI and/or the editor(s). MDPI and/or the editor(s) disclaim responsibility for any injury to people or property resulting from any ideas, methods, instructions or products referred to in the content. |
© 2025 by the authors. Licensee MDPI, Basel, Switzerland. This article is an open access article distributed under the terms and conditions of the Creative Commons Attribution (CC BY) license.