Highlights
What are the main findings?
- A reproducible multi-source fusion and illuminance inversion framework links satellite nighttime radiance, field illuminance, and perception surveys to enable city-scale mapping of perceived safety.
- Space-type models quantify the illuminance–safety relationship and yield recommended ground-illuminance ranges.
What are the implications of the main findings?
- Provides an operational remote-sensing pathway for evidence-based urban lighting evaluation and planning, supporting safer and low-carbon nightscape design.
- The method is transferable and scalable to other cities for continuous monitoring and policy support, improving reproducibility and uptake within the remote-sensing community.
Abstract
A well-designed nighttime lighting environment not only enhances pedestrian comfort and urban vitality but also serves as a crucial factor in creating safe and livable urban spaces. However, existing studies on pedestrian safety at night remain relatively limited both domestically and internationally, and most rely primarily on ground-based measurements, making large-scale spatial analyses difficult to achieve. This study integrates night-time remote sensing, ground measurements and perception evaluations to analyze the light environments of three public space types—roads, business districts and squares—in Dalian, China. A light environment safety perception model and corresponding map are constructed to support optimization of lighting design in urban nightscapes. The main contributions are as follows: (1) subjective and objective research conducted on the night light environment safety perception of urban public space in Dalian; (2) fitting models are developed for each space type to relate measured illuminance to perceived safety, yielding recommended ground illuminance ranges: roads (4.02–10.10 lx), business districts (5.05–38.3 lx), and squares (6.46–12.52 lx); (3) models linking nighttime radiation data to measured illuminance are established, enabling the generation of an illuminance inversion map for Dalian. Based on this, safety classification maps for roads, business districts, and squares are produced. These are integrated with the residential area safety map to form a comprehensive safety classification map of Dalian’s urban area.
1. Introduction
Night lighting can provide reliable security for people to engage in production work and daily activities, which is one of the important infrastructures [1,2]. It not only affects the shape of the city but also affects the physical and mental health of pedestrians [3]. Currently, night lighting is mainly designed based on various standards. The international standard CIE115-2010 [4] classifies the sidewalks and divides the corresponding lighting levels according to the categories. The evaluation indicators include the average illumination of the road surface, the minimum horizontal illumination and the semi-cylindrical illumination. However, lighting design is not merely the aggregation of brightness; the latest CIE Statement [5] explicitly points out that “light is not without cost.” The original intent of nocturnal lighting is to enhance visual comfort and safety perception, effectively reducing safety incidents and increasing the feeling of safety (FoS) for the public, particularly for vulnerable road users such as pedestrians and cyclists. Nevertheless, inappropriate lighting design can lead to a series of negative effects, including energy waste, visual adaptation interference, and light trespass, thus emphasizing the necessity of curbing the spread of light pollution while ensuring societal functions. A number of countries use CIE standard as a guide to formulate night lighting standards according to local conditions and national conditions [6,7,8,9]. But there are few relevant research results on pedestrian safety perception of night lighting in urban public space, and the existing standard specifications have not verified its practical applicability. In addition to meeting the basic lighting needs, nightscape lighting design needs to be further optimized to enhance pedestrian safety.
At night, pedestrian safety is closely related to good sidewalk lighting [10]. Several studies have shown that improved lighting can reduce crime rates, especially in densely populated areas [11], and that providing more lighting is critical to the needs of pedestrians [12]. Lighting may influence the impression of public places [13]. Pedestrians can enhance the confidence of walking alone at night through good sidewalk lighting because they can perceive the safety of the surrounding environment [14,15,16] and reduce concerns about crime [17,18,19]. Existing studies have enriched the cognitive foundation regarding the impact of the nocturnal light environment on safety perception across dimensions such as illuminance, correlated color temperature (CCT), vegetation, pathway structure, and behavioral perception. S. Fotios et al. used the day-to-night method to assess and found that increasing road lighting illuminance can significantly enhance pedestrians’ sense of safety and confidence when walking at night [20]. Xu X et al. went further, proposing a method for recommending safe walking routes utilizing smartphone light sensor data [21]. Nevertheless, illuminance is not the sole factor influencing safety perception [22,23]. Many scholars have also emphasized the critical role of light quality. N. V. Bystryantseva et al. found that lighting settings, particularly CCT, significantly affect pedestrian comfort, perceived safety, and route choice [24]. Kwang Hoon Kim et al. proposed quantitative lighting standards based on crime prevention principles, highlighting the key importance of vertical illuminance and color rendering index (CRI) for facial recognition [25]. Studies have shown that specific CCT, such as 4500 K, can enhance perceived safety [26], and that virtual reality (VR) can be used to systematically evaluate the combined effects of illuminance and CCT on users’ psychological responses [27]. Arco van Beek et al. further investigated the influence of light color (chromaticity) on path selection, finding that pedestrians distinctly tend to follow pathways illuminated by a specific light color [28]. The synergistic effects of environmental factors are also important. Johan Rahm found that the quality of greenery and street lighting influences people’s route choices at night, with some participants feeling compelled to take detours [29]. To address the challenge of balancing energy efficiency and safety, Younjoo Cho et al. developed the Connected Lighting Safety System (CSLS) to alleviate pedestrians’ psychological fears [30]; Hyo Kang et al. designed a ‘dynamic tracking lighting’ mode, which was shown to enhance pedestrians’ sense of reassurance more effectively than conventional low-illuminance modes [31], providing a novel solution for smart urban lighting.
Although the existing studies have deepened the academic understanding of the complex relationship between the nocturnal light environment and pedestrian safety perception, existing findings still face critical methodological bottlenecks, which severely restrict their application in urban planning practice. Specifically, previous research relies heavily on traditional ground fixed-point measurements and localized questionnaire surveys. This highly time-consuming and spatially limited data acquisition method is insufficient to support systematic analysis at the urban scale. Furthermore, existing studies generally focus on a single optical variable, lacking systematic research that integrates multiple variables such as optical metrics with non-optical metrics. Additionally, current conclusions often remain as qualitative descriptions specific to particular scenarios, lacking universal quantitative prediction models applicable to diverse spatial types. Consequently, they fail to provide clear and quantified parametric guidance for urban lighting design oriented towards safety perception. Exploring how to utilize remote sensing technology to achieve multi-scale, scalable research on the nocturnal light environment and safety perception has thus become an urgent research direction.
Traditionally, studies of urban night lighting have relied primarily on satellite-based remote sensing data. Low-resolution datasets such as DMSP-OLS [32] and medium-resolution VIIRS imagery have laid the foundation for large-scale spatiotemporal monitoring of urban lighting [33,34,35]. With the advent of high-resolution nighttime light (NTL) sensors such as Luojia-1-01 [36,37], Jilin-1 [38,39], and SDGSAT-01 [1,40,41], researchers are now able to capture fine-scale illumination features at the level of roads, neighborhoods, and other micro-scale urban structures. Nonetheless, relying solely on remote sensing data makes it difficult to accurately invert the actual perceptions of pedestrians at ground level. Furthermore, the data remains susceptible to limitations in spectral response, interference from the blue light component of Light Emitting Diodes (LEDs) on remote sensing detection, and the effects of environmental obstruction [42,43]. To overcome the limitations of a singular observation perspective, nocturnal urban lighting research in recent years has increasingly relied on the synergistic integration of remote sensing and ground-based measurements. Meanwhile, advances in ground-based measurement technologies have provided increasingly precise calibration and validation capabilities for remote sensing data. Ground observations obtained from instruments such as illuminance meters [44,45], Sky Quality Meters (SQMs) [46,47], and Unmanned Aerial Vehicle (UAV)-mounted spectrometers [1,48] enable a detailed examination of error sources in remote sensing retrievals, including variations in light intensity, CCT, and spectral composition. Furthermore, these measurements offer valuable empirical foundations for establishing quantitative relationships between radiance and illuminance. At present, the integration of remote sensing and ground-based measurements is evolving toward multi-source fusion and higher spatial precision. Research scales have gradually shifted from macro-level assessments of total urban illumination to micro-level investigations of neighborhood and street lighting environments [49,50,51]. Lin et al. combined subjective perception data with satellite-derived radiance and ground-based illuminance measurements to construct a comprehensive analytical framework linking physical indicators with human psychological responses [40]. Zhang et al. employed an integrated approach using remote sensing and UAV observations to reveal the influence of local lighting patterns on nighttime activity spaces [1]. Meanwhile, improving modeling and retrieval accuracy has become another major focus in fusion research. Chen et al. proposed an urban functional zone classification model based on high-resolution remote sensing and NTL imagery, which leverages deep neural networks to enhance classification accuracy [52]. Significant progress has been made in Satellite–Ground integrated observation technology. However, current research on data fusion lacks a universal quantitative inversion model capable of effectively connecting macroscopic remote sensing data with microscopic pedestrian safety perception results. This deficiency is particularly evident in the insufficient applicability and scalability across diverse types of urban public spaces.
To systematically quantify the complex relationship between nighttime lighting and safety perception in public spaces, and to address the current gap in multi-source data integration, this study develops a Satellite–Ground collaborative analytical framework that integrates remote sensing, field measurements, and pedestrian safety-perception assessments. Taking various types of urban public spaces in Dalian as case sites, the framework couples NTL remote-sensing data with on-site measurements to establish a quantitative association model between residents’ safety perception and remotely sensed nighttime illumination. Using visual analytics, it generates illuminance inversion maps and graded safety-perception maps for Dalian’s central urban area. These outputs are further combined with the research team’s existing residential-area perception maps to produce a more comprehensive citywide safety-perception atlas, providing scientific and actionable evidence for nighttime lighting planning and optimization aimed at enhancing perceived safety.
2. Materials and Methods
2.1. Study Area
This study focuses on the nighttime lighting environment of urban public spaces in Dalian. Located at the southernmost tip of Northeast China and surrounded by the sea on three sides, Dalian is an important coastal hub city in China. As a key international shipping and logistics center in Northeast Asia, Dalian benefits from its natural deep-water harbor and well-developed transportation network, serving as a crucial node in the national “Belt and Road” Initiative. Moreover, the city holds multiple strategic designations, including a national-level new area and a pilot free trade zone, and exerts nationwide influence in fields such as advanced manufacturing, maritime finance, and cultural tourism. The nighttime lighting environment of Dalian ranks at a medium level among China’s 36 major cities, making it a case of considerable research value [53].
The research targets the representative and densely populated core districts of Dalian, namely Zhongshan, Xigang, Shahekou, and Ganjingzi, while excluding offshore islands. Luojia1-01, designed by Wuhan University, provides the nighttime lighting data that serve as the primary source. Using the total lighting radiation values and the per-square-kilometer brightness values of each administrative sub-district within the four districts (Figure 1), samples were selected from areas with both high and low mean and total radiation levels to ensure coverage across different types of lighting environments. Considering factors such as population density, economic development, and geographic location, nine roads, three squares, and three business districts were chosen as research samples (Figure 2), thereby ensuring their comparative value.
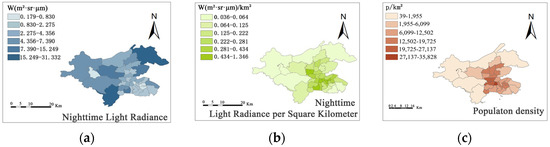
Figure 1.
Overview of sub-districts in central city zone of Dalian: (a) NTL radiance l; (b) NTL radiance per square kilometer; (c) population density.
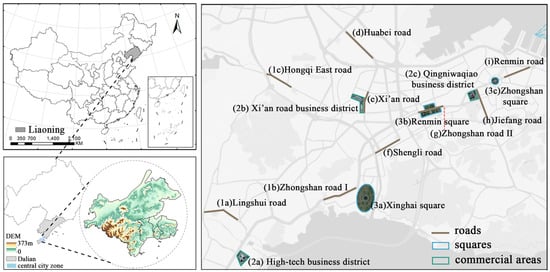
Figure 2.
Research location.
2.2. The Data
2.2.1. Luojia1-01 NTL Data
As the first dedicated NTL dataset, Luojia-1-01 produces global NTL imagery with a 15-day revisit cycle and a spatial resolution of 130 m, offering substantial improvements in resolution and temporal monitoring compared with previously used DMSP and VIIRS datasets [54,55]. It therefore holds considerable research potential for studies of urban NTL environments. This study employs Luojia1-01 imagery from March 2019. The relatively low temperatures and sparse foliage in March ensured that the shielding effect of vegetation on light signals was significantly weaker compared to other seasons, thereby minimizing the attenuation of the light signal caused by ground-level obstruction. To enhance the accuracy of the raw data, the Luojia1-01 NTL imagery underwent denoising, radiometric correction, and geometric correction.
- Noise reduction: Large-scale water vector data—such as those from the Bohai Bay area, which is far from urban centers—were selected as masks to extract the mean radiance value (DNmin average) from the corresponding Luojia-1-01 pixels. Using the Raster Calculator in ArcGIS 10.8.2, this DNmin average value was uniformly subtracted from all pixels within the study area. The specific formula is as follows:
- 2.
- Radiometric correction: Since the raw Luojia1-01 NTL imagery is intended for quantitative metrics, the radiative brightness value converted from the image pixel’s Digital Number (DN) is adopted as the measurement index. The conversion formula is as follows:
L = DN3/2 × 10−10
- 3.
- Geometric correction: Due to the capture method of the Luojia1-01 NTL imagery from space, unavoidable geographical errors exist. Therefore, geometric correction is performed using the Georeferencing tool in ArcGIS 10.8.2. Based on the Dalian city map in Google Earth as the base map, twenty distinctive landmark points are manually selected as Ground Control Points for the correction (Figure 3).
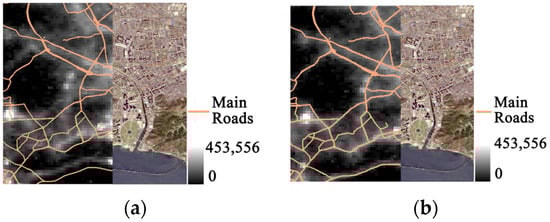 Figure 3. Comparison of night light image geometric coordinates correction before and after correction in luojia-01, Dalian: (a) before geometric correction; (b) after geometric correction.
2.2.2. Measurement Data
Field surveys of optical and non-optical measurement indicators were conducted concurrently across ten sunny, cloudless nights in March 2024 to ensure data quality and [7] alignment with satellite overpass conditions [56]. By integrating field measurements of lighting in squares, roads, and business districts with results from subjective surveys, this study identifies lighting environment indicators for different types of public spaces that meet pedestrians’ safety perception needs, and summarizes the common characteristics of Dalian’s nighttime lighting environment in public spaces.
To minimize the error in spatial matching between the night-light remote sensing imagery and the measurement points, the measurement layout utilized a 130m x 130m grid as the Minimum Measurement Unit (MMU). These MMUs were uniformly distributed across the study area, following the rule that the maximum spacing between units should not exceed three grids, and the minimum spacing should not be less than one grid. Each measurement unit was further sampled at four sub-measurement points, and this final mean value was adopted as the measurement result for the unit. The specific total number of units was adjusted according to the actual scale of the public space (Figure 4). Furthermore, to avoid interference from direct light (or direct illumination), the measurement points generally circumvented the areas directly beneath light fixtures.
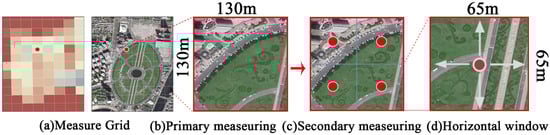
Figure 4.
Alignment relationship between remote sensing data and measured grids.
The evaluation of measurement data mainly referred to the parameters specified in CJJ 45-2015 Standard for Lighting Design of Urban Roads and JGJ/T 163-2008 Specification for Design of Urban Nightscape Lighting [6,7].
- Optical measurement indicators
Optical measurement indicators primarily include horizontal illuminance, vertical illuminance, semi-cylindrical illuminance, uniformity, CCT, CRI, glare level, Loss of the Night Network (LoNNe) index, and spectral values. The measurement methods are based on the guidelines of EN 13201-4-2015 [57], with specific procedures following those established by previous researchers in the study group [53]. To minimize measurement errors, optical indicators such as horizontal illuminance, vertical illuminance, and semi-cylindrical illuminance are measured along the four cardinal directions (0°, 90°, 180°, and 270°), and take the average value. For the full set of measurement data, refer to Table S1.
- 2.
- Non-optical measurement indicators
The non-optical measurement indicators consist of safety perception assessment and environmental quantification. During the survey, the spatial environment was documented through on-site observation, environmental annotation, and street-view photography, while questionnaires were distributed to passing pedestrians to collect safety perception data. To ensure representativeness, respondents covered different genders and age groups. Approximately 6–7 questionnaires were distributed at each measurement point, yielding a total of 2306 valid responses: 952 from roads, 784 from business districts, and 570 from squares. Safety perception was assessed using a four-point Likert scale, ranging from 1 to 4 (Table 1) [58]. Refer to Supplementary Table S2 for the full survey questionnaire.

Table 1.
Questionnaire design.
To ensure the reliability and accuracy of the research findings, the questionnaires underwent reliability and validity analyses. For reliability, Cronbach’s α coefficient was used to assess internal consistency. The α coefficients for the four items in roads, business districts, and squares were 0.835, 0.818, and 0.809, respectively, all exceeding 0.8, indicating high reliability of the questionnaire and supporting the use of the data for further analysis. For validity, factor analysis was conducted. The KMO values for roads, business districts, and squares were 0.794, 0.756, and 0.739, respectively, and Bartlett’s test of sphericity was significant in all cases (p < 0.001), demonstrating good construct validity and confirming the suitability of the data for factor analysis.
Environmental quantification included vegetation coverage and traffic flow, scored on a 0–2 scale. The values were recorded based on the actual conditions observed at each measurement point (Table 2).
Table 2.
Environment information.
2.3. Research Work
This study establishes a safety perception evaluation model for public space lighting environments by analyzing field measurements of various urban public space lighting conditions and corresponding safety perceptions. Combined with an illuminance inversion model, a safety perception evaluation classification map of Dalian City is developed. The specific path of the research is featured in Figure 5.
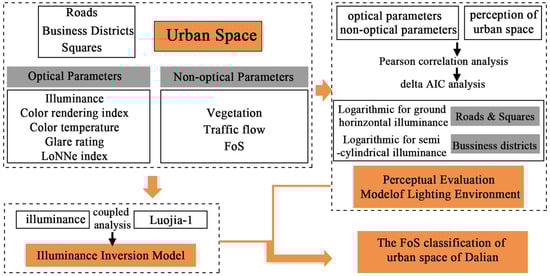
Figure 5.
Research framework.
3. Results
3.1. Quantitative Analysis of the Current Situation of Light Environment in Different Types of Urban Spaces
A total of 304 measuring points across 9 roads, 3 squares and 3 business districts in Dalian were measured for optical properties and perceived evaluation of non-optical properties. A comparative analysis of the light environment characteristics among these typical roads, squares, and business districts is presented in Figure 6 and Figure 7.
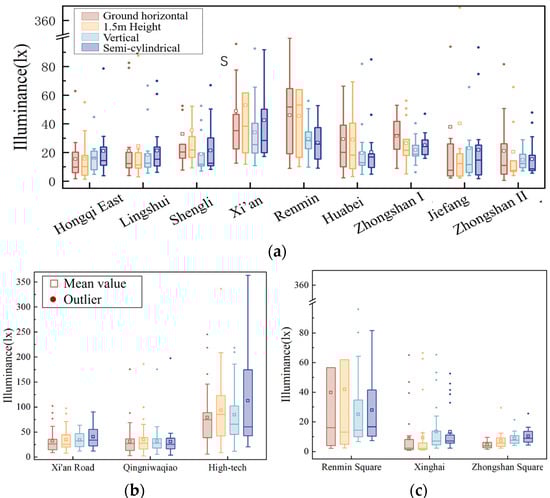
Figure 6.
Comparative analysis of measured illuminance parameters across different types of urban public spaces: (a) roads, (b) business districts, (c) squares.
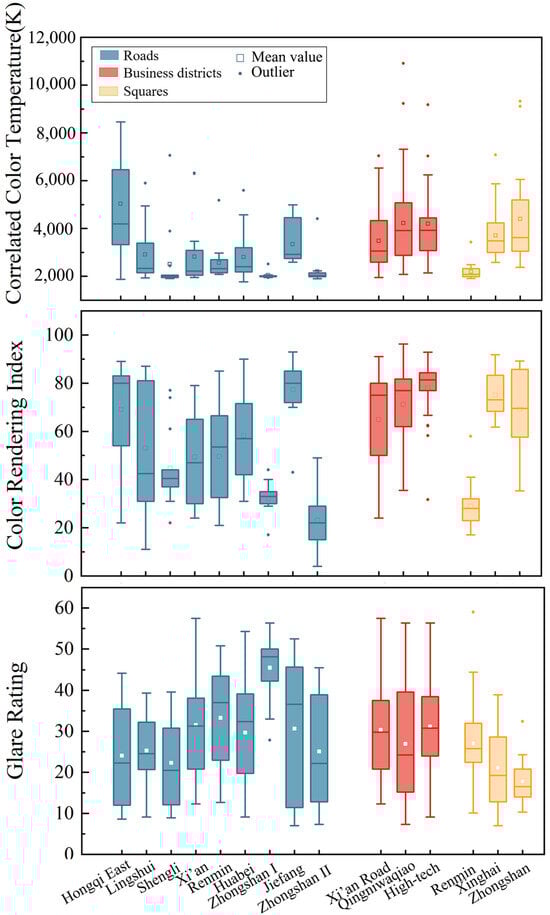
Figure 7.
Integrated comparison of lighting quality indicators across various urban spaces.
3.1.1. Roads
The overall light environment of the nine roads in Dalian basically meets illuminance standards, yet significant differences exist among different types of roads. Detailed photometric parameters are provided in Table 3 and Table 4. As illustrated in Figure 6a, high-illuminance roads such as Xi’an Road and Renmin Road, located in commercial surroundings, exhibit an average illuminance exceeding 45 lx with good uniformity due to the influence of environmental light. In contrast, road sections including Hongqi East Road and Zhongshan Road are affected by tree shading or outdated luminaires, where illuminance at some measuring points drops below 2 lx, resulting in noticeable dark zones. Regarding light color quality, Figure 7 reveals that susceptibility to luminous pollution from commercial signs causes drastic fluctuations in CCT on some roads, disrupting the uniformity of the nightscape; however, the CCT for most roads remains predominantly in the medium-to-low range of 2000–4000 K. With the exception of Jiefang Road, most roads primarily utilize high-pressure sodium lamps, leading to generally low CRI, which adversely affects facial recognition and obstacle detection for pedestrians. Glare is not a significant issue.
Table 3.
Descriptive statistics of research indicators for roads.
Table 4.
Descriptive statistics of research indicators for roads.
3.1.2. Business Districts
Refer to Table 5, Business districts are characterized by ‘high illuminance and high color rendering index,’ exhibiting the highest overall visual vitality and perceived safety among the three space types. As shown in Figure 6b, the average illuminance level in business districts is significantly higher than that of roads and squares. Specifically, the High-tech Zone demonstrates a mean ground horizontal illuminance as high as 79.23 lx, with peak values in certain areas exceeding 200 lx, attributed to the superposition of interior lighting from shops and high-intensity luminous signage. Even in back alleys with relatively lower illuminance, the baseline brightness remains sufficient to maintain good visibility. Benefiting from the widespread application of LEDs, the CRI in business districts is maintained at a high and stable level, forming a sharp contrast with road areas and enhancing both the commercial atmosphere and color reproduction. CCTis predominantly distributed in the medium-to-high range of 3000–5000 K, creating a vibrant nighttime atmosphere. Despite the extremely high ambient brightness, glare ratings are generally controlled below 45 and do not deteriorate with increased illuminance, indicating a well-achieved balance between brightness and visual comfort in the lighting design (Figure 7).
Table 5.
Descriptive statistics of research indicators for business districts.
3.1.3. Squares
Squares are characterized by moderate-to-low illuminance but exhibit excellent glare control, with a distinct divergence in CRI performance. The overall illuminance levels in squares fall between those of low-illuminance roads and business districts, primarily ranging from 10 to 60 lx. As shown in Figure 6c, the average illuminance in Xinghai and Zhongshan Squares is less than 10 lx, as these areas rely primarily on landscape lighting to provide atmospheric rather than functional high-intensity illumination. Integrating Table 6 with Figure 7, it is evident that the CRI in squares is not universally low as observed in road environments. Xinghai and Zhongshan Squares exhibit higher CRI due to the extensive use of landscape LED lighting; conversely, Renmin Square remains at a lower level as it relies primarily on high-mast high-pressure sodium lamps. Despite insufficient illuminance in some squares, their glare control is comparable to the high standards found in business districts and superior to parts of the road environment. Regarding CCT, the squares display a diverse distribution ranging from warm yellow to neutral light, depending on their specific functional positioning.
Table 6.
Descriptive statistics of research indicators for squares.
3.2. Correlation Analysis Between Measured Values and Perceived Evaluation
3.2.1. Establishment of the FoS Evaluation Model
This paper employs correlation analysis, AIC incremental experiments, and multiple linear regression methods to identify the most significant factors influencing Fos [40,59].
Firstly, to explore the correlation between pedestrian safety and various public space lighting conditions, SPSS Statistics 27 was used to analyze the Pearson correlation between subjective safety evaluations and objective environmental measurement values, as shown in Table 7. The results indicate that the feeling of safety is related to factors such as the ground horizontal illuminance, 1.5 m height illuminance, vertical illuminance, semi-cylindrical illuminance, CRI, CCT, traffic flow, vegetation coverage and so on.
Table 7.
Descriptive statistics of research indicators for urban space.
The ground horizontal illuminance, 1.5 m horizontal illuminance, vertical illuminance, and semi-cylindrical illuminance all exhibit a significant strong correlation with the perceived safety evaluation. A collinearity analysis was conducted on these four independent variables, and the variance inflation factor (VIF) was found to be greater than 5, indicating a strong linear relationship among them. This high degree of correlation suggests that it would be difficult to determine the individual impact of each independent variable on the dependent variable if they were directly used in the regression model. Therefore, this study fitted the perceived safety values of roads, business districts, and squares with various illuminance indicators, respectively, and selected the parameter with the highest fitting degree from four candidates to construct regression equations, as presented in Table 8. The results indicate that the logarithmic curve of ground horizontal illuminance showed the highest fit with road safety perception, with an R2 value of 0.767. For business districts, the logarithmic curve of semi-cylindrical illuminance demonstrated the strongest correlation with perceived safety, achieving an R2 of 0.703. In the case of squares, the logarithmic curve of ground illuminance provided the best fit for safety perception, with an R2 value as high as 0.840.
Table 8.
R2 of the fitting equation for safety perception.
The Akaike Information Criterion (AIC) is an objective and accurate method for measuring the degree of discrepancy between subjective information and objective data. The delta AIC experiment can be used to evaluate the degree of influence of various factors on perceived evaluation values—that is, their contribution rate. SPSS software can perform statistics on the residual sum of squares to further calculate the change in AIC. Specifically, all influencing factors are first included in the regression analysis of the perceptual evaluation. Each factor is then removed one at a time, and the difference in AIC values between the reduced model and the full model is calculated. The larger this difference, the higher the contribution rate of the corresponding influencing factor. An AIC delta experiment was conducted on several influencing factors that showed significant correlation. The experimental results regarding safety perception evaluation are presented in the table. As illustrated in Figure 8, a larger increase in AIC after removing a factor (indicated by the blue area) corresponds to a higher contribution rate of that factor.
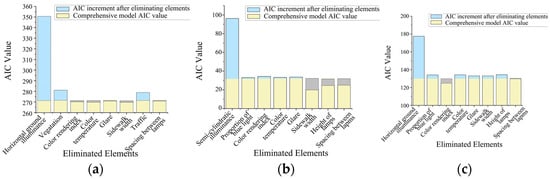
Figure 8.
AIC incremental experiment: (a) roads, (b) business districts, (c) squares.
Based on the ranking of the contribution rates of influencing factors to perceived safety, models for the evaluation of perceived safety in different types of public spaces were constructed.
For roads, Model 1 performed a regression analysis between horizontal illuminance at ground level and perceived safety ratings. Model 2 was expanded to include vegetation volume as an additional variable. Building upon Model 2, Model 3 further incorporated traffic volume into the regression analysis. As shown in Table 9.
Table 9.
Development of a FoS evaluation model for roads.
The FoS model for roads is
FoSi = 1.259 + 0.710 × ln(ILi) − 0.012 × VDi + 0.110 × TIi
In Formula 3, FoSi denotes the perceived safety evaluation value at survey point i; ILi denotes the ground horizontal illuminance at survey point i; VDi denotes the amount of vegetation at survey point i, which is evaluated on a three-point scale; TIi denotes the traffic volume at survey point i, which is calculated based on the traffic flow passing by within 5 min.
For business districts, the factors with the highest contribution rates are semi-cylindrical illuminance, CRI, LoNNe index, and CCT. Model 1 performed a regression analysis between semi-cylindrical illuminance and perceived safety ratings. Model 2 was expanded to include the CRI. Model 3 further incorporated the LoNNe index, and Model 4 additionally introduced CCT into the regression framework. As shown in Table 10.
Table 10.
Development of a FoS evaluation model for business districts.
The FoS model for business district is
FoSi = 2.848 + 0.292 × ln Eli + 0.001 × Ra − 0.004 × Bi + 1.89 × 10⁻⁵ × Ti
In Formula 4, FoSi denotes the perceived safety evaluation value at survey point i; ELi denotes the semi-cylindrical illuminance at survey point i; Bi denotes the LoNNe index at survey point i; and Ti denotes the CCT at survey point i.
For squares, Model 1 conducted a regression analysis between horizontal illuminance at ground level and perceived safety ratings. Model 2 was expanded to include LoNNe index. Building upon Model 2, Model 3 further incorporated CCT into the analytical framework. As shown in Table 11.
Table 11.
Development of a FoS evaluation model for squares.
The FoS model for square is
FoSi = 1.868 + 0.422 × ln(ILi) − 0.004 × VDi + 5.14 × 10⁻⁵ × Ti
In Formula 5, FoSi denotes the perceived safety evaluation value at survey point i; ILi denotes the ground horizontal illuminance at survey point i; VDi denotes the LoNNe index at survey point i; and Ti denotes the CCT at survey point i.
3.2.2. Recommended Ranges for Illuminance Parameters
The recommended ranges for illuminance parameters were established by setting traffic volume and vegetation coverage to their respective median values based on the survey data. According to the established FoS models, the variation in the overall perceived safety values for roads, business districts, and squares in Dalian with changes in ground horizontal illuminance or semi-cylindrical illuminance was plotted, as shown in Figure 9.
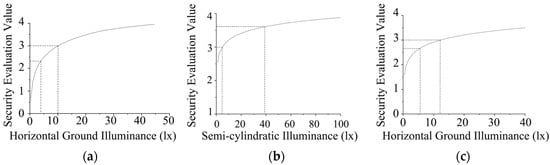
Figure 9.
The changes inf Fos evaluation value in various public areas of Dalian with illuminance: (a) Roads; (b) Business districts; (c) Squares.
As illuminance increases, the rate of growth in perceived safety ratings gradually decreases. Once illuminance reaches a certain level, the increase in safety perception significantly slows down. Beyond this point, higher lighting levels contribute little to further enhancing perceived safety, while leading to unnecessary energy waste.
Based on the relationship between the FoS value and illuminance, this study proposes recommended illuminance ranges for different functional areas in Dalian. When the FoS value for roads reaches the average value (2.31), the corresponding minimum illuminance is 4.02 lx. When the FoS value reaches a relatively high level (3.0), the corresponding illuminance is 10.10 lx. Thus, the recommended illuminance range for roads is 4.02–10.10 lx. For business districts, where both illuminance and perceived safety are generally high, the upper limit of the recommended range is set at 38.3 lx, corresponding to the average FoS value (3.6). The lower limit is set at 5.05 lx, corresponding to FoS value is 3.0. The recommended illuminance range for commercial districts is therefore 5.05–38.3 lx. In squares, an average FoS value of 2.73 corresponds to an illuminance of 6.46 lx, while an FoS value of 3.0 corresponds to 12.52 lx. Hence, the recommended illuminance range for plazas is 6.46–12.52 lx. as shown in Table 12.
Table 12.
Recommended range of overall ground level illuminance in urban areas in Dalian.
To validate the reasonableness of the illuminance range derived from the perception model, this study conducted a quantitative comparison between the recommended values and the corresponding standard illuminance values stipulated in the current national lighting standards, as shown in Table 13.
Table 13.
Comparison of recommended illuminance range with national standard illuminance requirements.
The results indicate that the recommended illuminance values proposed by this study, which are based on pedestrian safety perception, are generally lower than the national standards, a difference particularly evident in roads and squares. In contrast, the recommended illuminance range for business districts exhibits a wide span, which is associated with the high heterogeneity of lighting needs in commercial spaces and the dependence of commercial activities on high illuminance levels.
This suggests that while satisfying residents’ safety perception, the current illuminance standards still possess a certain margin. Energy-saving potential can be realized by moderately lowering the illuminance level in local areas. Specifically, in areas where illuminance is excessively high and the corresponding perceived safety increase tends to flatten, reducing the illuminance will not cause a loss of safety perception but rather curb energy waste and light pollution. Furthermore, the perception-based recommended illuminance range provides data support for the construction of smart cities, enabling future lighting control to shift from uniform standards toward a more refined and human-centric regulatory framework.
3.2.3. Establishment of the Lighting Environment Inversion Models
This section aims to investigate the relationship between illuminance and the radiance measured by Luojia-01 satellite, and to establish inversion models based on ground horizontal illuminance and semi-cylindrical illuminance. The space–ground collaborative approach for NTL environment inversion effectively integrates the technical advantages of both satellite and ground-based data, offering a novel solution for achieving large-scale and high-precision urban NTL environment monitoring.
In GIS, the radiance values at the selected sample points within the case study area were extracted and subsequently subjected to regression analysis alongside ground-measured values, aiming to identify the regression equation with the best fit. A Pearson correlation analysis was first conducted between the measured horizontal illuminance values on the ground and the radiance values from the Luojia-01 satellite. The analysis yielded a correlation coefficient of 0.837 (p = 0.000 < 0.01), indicating a statistically significant positive correlation between ground-based horizontal illuminance and satellite-derived radiance. A total of six commonly used models were introduced in this regression analysis process, as detailed in Table 14. The results indicate that the cubic polynomial regression model exhibited the highest R2 value, demonstrating the best goodness-of-fit between illuminance and radiance values.
Table 14.
Model summary and parameter estimates.
Finally, the cubic polynomial model is selected as the mathematical inversion model for ground horizontal illuminance in Dalian. The model is
Eh = −0.00085L3 + 0.02018L2 + 1.79074L + 5.5898,
Among them, Eh denotes the retrieved value of ground horizontal illuminance, with the unit of lx; L denotes the radiance value of Luojia-1, with the unit of W/(m2·sr·cm).
Similarly, the quadratic function model is selected as the mathematical inversion model for the semi-cylindrical illuminance in Dalian. The model is
Eh = 9.801 + 1.240 × L − 0.007 × L2,
Among them, Eh denotes the retrieved value of semi-cylindrical illuminance, with the unit of lx; L denotes the radiance value of Luojia-1, with the unit of W/(m2·sr·cm).
3.2.4. Validation of the Inversion Model
This section verifies the accuracy of the illuminance inversion model and the security inversion model [60]. Four indicators, namely Mean Squared Error (MSE) [61], Root Mean Squared Error (RMSE) [62], Mean Absolute Error (MAE) [63,64,65], and Mean Relative Error (MRE) [45], were adopted, respectively, for verification. The smaller the value is, the more accurate the numerical values predicted by the model are. The verification results are shown in Table 15.
Table 15.
Different model evaluation indicators.
As shown by the data in the table, the values of RMSE, MAE, and MRE for the public space safety perception inversion model all approach zero. This indicates that the model has a high degree of fit and can effectively reflect the relationship between subjective safety perception and the objective light environment. However, the error values for the illuminance inversion model are relatively large, which suggests an objective uncertainty in the absolute accuracy of the remote sensing inversion results.
This error in the illuminance inversion model is the result of the combined effect of spatial scale differences, spectral response mismatch, and environmental noise.
Although the 130m spatial resolution of Luojia 1-01 is far superior to DMSP/OLS and NPP/VIIRS, there is still a significant discrepancy between the Luojia data and the measured data in terms of spatial scale. In this study, a 130 m *130 m area was used as the MMU, and four measurement points were set up within each unit, with multiple repeated measurements being taken and averaged. This was done to minimize the bias caused by the scale difference as much as possible, yet a certain negative impact still exists.
A core reason for the error in the illuminance inversion model is the difference in the spectral response characteristics between the sensor and the ground illuminance meter [66], a difference that is amplified, especially in urban public spaces dominated by High-CCT LED lighting. Ground illuminance meters measure illuminance based on the photopic luminous efficiency function V (λ), which simulates the sensitivity of the human eye to light, peaks at 555 nm, and has low sensitivity to short-wavelength blue light [67]. In contrast, the Luojia 1-01 sensor records broadband radiance (approximately 460–980 nm), essentially measuring the total radiant energy, and its response curve exhibits a systemic difference from the V (λ) function in terms of bandwidth and sensitivity [68]. High-CCT LEDs typically exhibit a strong spectral peak in the blue light region (around 450 nm) [69]. Because the Luojia 1-01 sensor can fully capture the blue light radiation component of the LEDs, while the illuminance meter significantly attenuates this signal, the relationship between satellite radiance and ground illuminance becomes non-linear and dependent on the light source’s spectrum. Consequently, in LED-lit areas, the estimation residual of the inversion model for the actual ground illuminance is systematically increased [66].
Complex urban environments, such as interference from tree cover, building shadows, and temporary light sources like vehicles and billboards, all introduce random noise into both the satellite imagery and instantaneous ground measurements, thereby affecting the goodness of fit of the model.
Despite the aforementioned uncertainties, the core objective of this study lies in the identification and visualization of the macroscopic spatial pattern. The measured values show a significant correlation with the Luojia 1-01 satellite radiance values, and this level of error is acceptable in similar urban night light remote sensing inversion studies. Therefore, it can serve as a tool for macroscopic trend analysis and hierarchical assessment, providing a basis for the graded management and optimization decisions regarding the urban light environment.
3.3. Construction of the Inversion Maps
3.3.1. Construction of the Light Environment Inversion Maps
Using the grid calculator and the above formulas (Formulas 6 and 7) to convert the radiance into illuminance values, the horizontal illuminance distribution map and the semi-cylindrical illuminance distribution map for the main urban area of Dalian are obtained, as shown in Figure 10. From the figure, it can be observed that the night-time illuminance in Dalian City is distributed in a scattered pattern. The areas with high illuminance values are primarily located in regions such as Zhongshan Square, People’s Square, Xinghai Square, the High-tech district, Dalian North Station, and the airport. The southeast side of Zhongshan District and the south side of Xigang District are large green park areas, where the illuminance values are relatively low. The west side of Ganjingzi District is mountainous terrain, where the illuminance values are also relatively low.
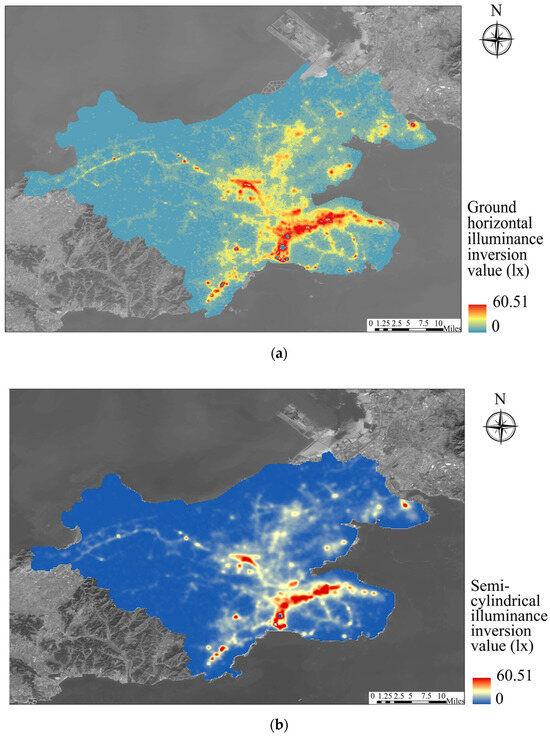
Figure 10.
The inversion map of light environment in the main urban areas of Dalian: (a) ground horizontal; (b) semi-cylindrical.
3.3.2. Construction of FoS Inversion Maps
Using the grid calculator and the above formulas (Formulas 3–5), the ground horizontal illuminance or semi-cylindrical illuminance is converted into a regional safety perception map, as shown in Figure 11. To clarify the spatial distribution of different safety perception evaluation levels across the administrative districts of Dalian’s main urban areas, the safety perception values are divided into three categories: areas with poor evaluation mean values, regarded as having poor security (<2); areas with safety perception evaluation mean values between the average and better levels, regarded as having average security (2 ≤ FoS ≤ 3); and areas with FoS evaluation mean values at the better level, regarded as having better security (FoS > 3).
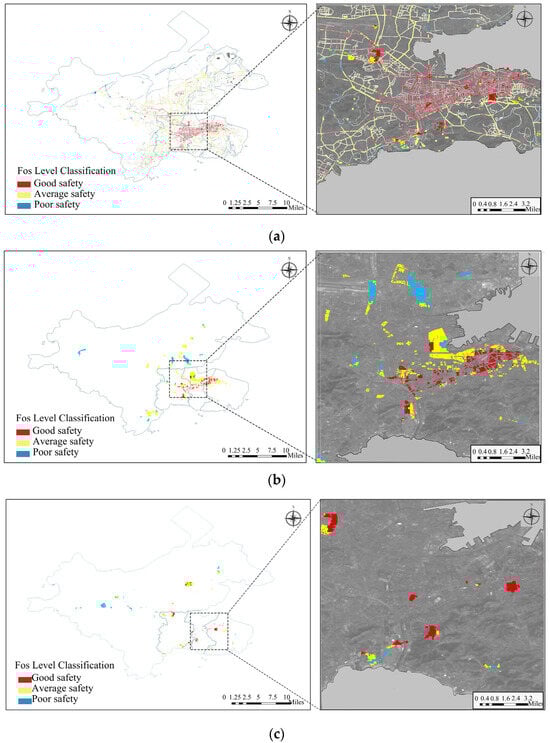
Figure 11.
Regional Fos classification map of Dalian: (a) roads; (b) business districts; (c) squares.
The FoS maps of the three functional areas, along with the residential area security map developed by the research group, are overlaid to create the security classification map of Dalian, as shown in Figure 12. As can be observed from the map, the distribution of the feeling of safety in Dalian City gradually decreases from Zhongshan Square, Zhongshan Road, and Dalian Airport towards the surrounding areas, with the lowest feeling of safety found in the southwest of Ganjingzi District and the southeast of Zhongshan District.
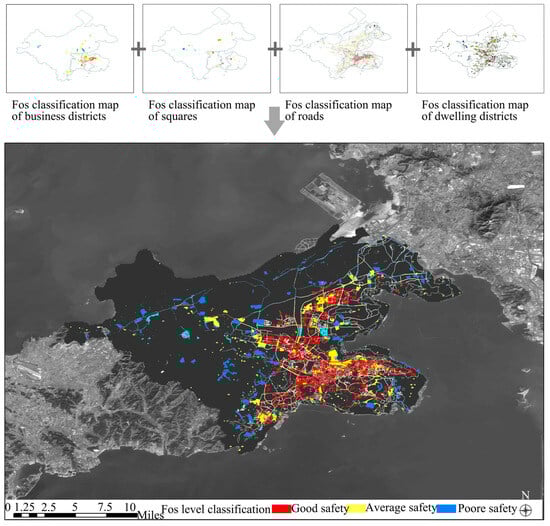
Figure 12.
Security classification map of Dalian.
3.3.3. Analysis of Fos Across Administrative Districts in Dalian
To clarify the spatial distribution of security in the main urban area of Dalian City, and based on the safety perception map of Dalian City shown in Figure 11, the proportion of areas with different security evaluation levels in each administrative region was plotted, as shown in Figure 13. The overall security evaluation level in Ganjingzi District is the lowest among the four administrative regions. This is due to the presence of mountainous terrain, limited population activity, and a large industrial area. Additionally, there are fewer commercial facilities, and roads in this district receive the least lighting, resulting in a lower overall level of road illumination compared to the other three districts. Affected by factors such as population, economy, and geographical environment, the radiance value of night-time lighting in Ganjingzi District is relatively low, leading to a decline in the feeling of safety. The overall level of security in Shahekou District is the highest among the four administrative regions, with 97% of areas achieving a feeling of safety above the medium level. The overall security level in Xigang District is second only to Shahekou District, with 94% of areas achieving a feeling of safety above the medium level, of which 57% reach a high level of security. Zhongshan District is similar to Xigang District, with 94% of areas achieving a feeling of safety above the medium level, and 47% reaching a high level. From the figure, it can be seen that the overall level of safety in each administrative region is ranked as follows: Shahekou District > Xigang District > Zhongshan District > Ganjingzi District.
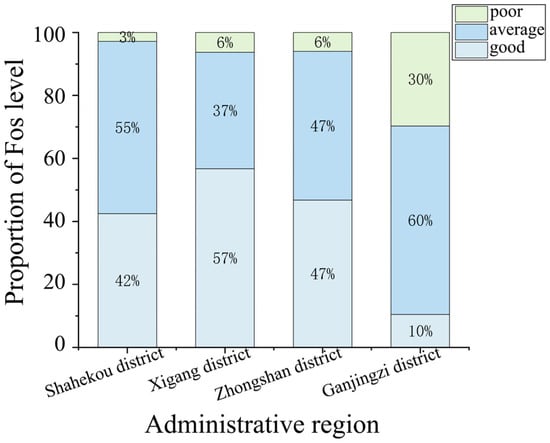
Figure 13.
The proportion of Fos level in the main urban areas of Dalian City.
4. Discussion
4.1. Comparison of Principal Findings with Previous Studies
From the perspective of pedestrian perception, this study systematically investigated the coupling relationships among ground-measured illuminance, subjective perception of safety, and Luojia-01 NTL imagery. Furthermore, illuminance–safety fitting models were constructed for various types of urban public spaces in Dalian. Consistent with existing literature [13,70], illuminance was identified as the dominant physical driver of FoS, but a significant effect of diminishing marginal returns was observed [19,71,72]. Once illuminance exceeds a specific threshold, the increase in FoS plateaus. Consequently, further increasing illuminance yields negligible perceptual benefits and instead leads to energy wastage and light pollution.
To validate the rationality of the illuminance thresholds proposed in this study, we quantitatively compared the recommended intervals with national standards and research by other scholars in different cities [40,44,73] (as illustrated in Figure 14). The results indicate that the recommended lower limits for roads and squares in Dalian in this study are slightly lower than the national standards and the results reported by Lin et al. [40] in Beijing. This may be attributed to Dalian’s unique hilly topography and vegetation occlusion, which have improved residents’ adaptability to low-illuminance environments. This cross-city comparison intuitively indicates that there is an adjustable margin between actual public demand and rigid norms, suggesting that urban lighting possesses potential for energy conservation.
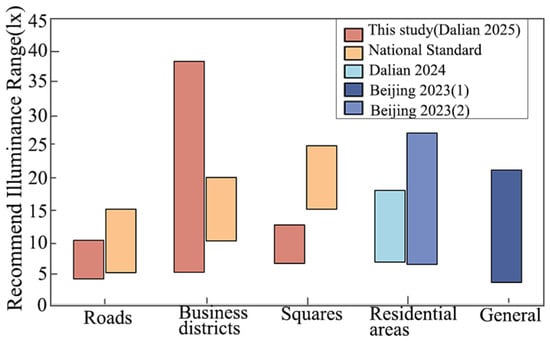
Figure 14.
The comparison of the recommended intervals with national standards and recent research [40,44,73].
This study also revealed the spatial heterogeneity of perceptual drivers. In business districts, semi-cylindrical illuminance showed superior explanatory power for safety perception compared to horizontal illuminance, corroborating the demand for three-dimensional environmental perception in complex activity spaces. While Liu et al. [23] utilized SDGSAT-1 to characterize lighting patterns across functional zones in Beijing, this study builds upon that by explicitly linking objective radiometric characteristics with subjective perception, effectively bridging the gap between physical measurements and subjective responses.
Methodologically, this study adopted the “Satellite–Ground–Perception” framework but achieved two key advancements. First, this study used Luojia-1 data; despite differences in spectral response, this strongly demonstrates the transferability of the core methodology across different nighttime light datasets. Second, this study moved beyond generic public space models to develop category-specific models for roads, squares, and business districts, providing more operational and zoned design guidance than a single aggregated model.
This study further confirms that the FoS at night is not determined solely by lighting but is the result of the synergistic interaction between the light environment and the built environment (as shown in Figure 15). In terms of functional zones, business districts achieved the highest safety perception, attributed to the combination of high-intensity lighting and high vitality. Squares, despite having lower illuminance metrics due to vegetation influence, maintained a relatively high level of safety due to stable social crowds. Conversely, road areas received the lowest scores, indicating that a singular supply of lighting is insufficient to completely alleviate pedestrians’ nighttime anxiety. Macroscopically, the spatial distribution of safety perception aligns closely with the distinct ‘high-southeast, low-northwest’ illuminance pattern of Dalian’s main urban area, further corroborating the consistency between nighttime lighting and perception results.
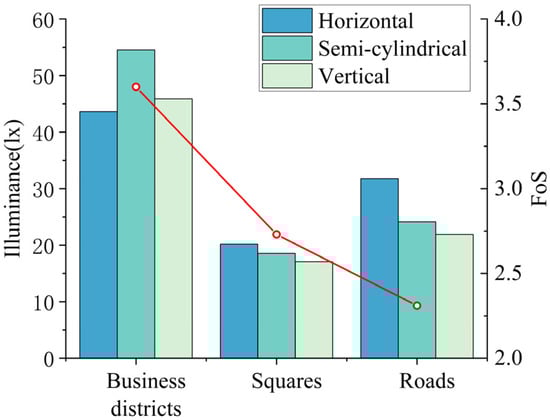
Figure 15.
The comparison of nighttime illuminance and perceived safety in various functional zones.
4.2. Limitations and Future Prospects
While this study provides insights into the relationship between the urban light environment and public safety perception, several limitations should be noted:
- There are multi-dimensional discrepancies between Luojia-01 satellite data and ground measurement data. Spatially, an inherent scale mismatch exists between the satellite’s 130 m planar observation data and ground-based point measurements. Even though a multi-point and multi-directional measurement strategy was adopted within each ground unit, fully characterizing the complex lighting heterogeneity within a pixel remains challenging. Secondly, disparities in sensor spectral response functions result in differential responses to the same light source—particularly high -CCT LEDs rich in blue light—thereby introducing systematic spectral bias. Furthermore, occlusion effects caused by urban terrain relief and vegetation can further interfere with satellite signal reception, increasing the uncertainty of the inversion model. Future research should consider integrating UAV hyperspectral observations or utilizing NTL remote sensing data with higher spatial resolution to construct a more precise “satellite–ground” collaborative observation system.
- Due to the operational lifecycle of the Luojia-1-01 satellite, available NTL imagery is restricted to the 2018–2019 period, whereas the ground measurement campaign for this study was conducted in 2024. This temporal interval constitutes a limitation that may introduce potential uncertainties regarding the retrieval of absolute radiance values. However, the overall impact of this lag on the research conclusions is assessed to be within an acceptable range. First, the sampling sites selected for this study are located in the core built-up areas of Dalian, where the urban spatial structure is highly mature and stable, with minimal infrastructure flux. Second, influenced by the COVID-19 pandemic (2020–2023) and macroeconomic factors, the main urban area of Dalian did not undergo large-scale urban lighting system renovations or massive demolition and construction projects during the study period. Consequently, although slight fluctuations in absolute brightness values may occur at individual points, the macroscopic spatial pattern and the relative hierarchy of the urban light environment have remained structurally consistent.
- To establish the relationship between radiance values and illuminance, this study only compared and selected several fundamental empirical models. While such models possess the advantage of intuitiveness, they have limited capability in capturing complex non-linear relationships inherent in the urban NTL environment, such as light source mixtures and multiple scattering effects. Future work should explore machine learning approaches (e.g., Random Forest) or deep learning models. These methods excel at uncovering complex patterns and interaction features within the data, promising to significantly enhance the accuracy and robustness of the inversion process.
- Although spatial and temporal constraints were imposed during the questionnaire design to ensure the environmental relevance of evaluations, rigorous attention testing procedures were not implemented. Consequently, the possibility of invalid responses arising from participants rushing to complete the survey cannot be entirely ruled out. This may introduce unquantifiable random error into the safety perception scores. In subsequent research, measures such as incorporating attention check questions and optimizing the questionnaire interaction workflow should be adopted to further bolster the quality and reliability of subjective perception data.
5. Conclusions
This study adopts a comprehensive evaluation method combining field measurements with resident perception. Nine typical roads, three core business districts, and three major squares in Dalian were selected for on-site investigation, and a differentiated comparative analysis was conducted on the current status of the light environment across different types of public spaces. Through correlation analysis of measured parameters, key indicators influencing safety perception in each functional zone were identified. Subsequently, category-specific evaluation models for light environment safety perception in urban public spaces were constructed, and recommended illuminance ranges satisfying pedestrian safety were derived. On this basis, by coupling the NTL remote sensing inversion model with the safety perception evaluation model, a spatial distribution map of safety perception in Dalian’s main urban area was generated. This provides scientific data support for identifying lighting blind spots and formulating light environment optimization strategies. The results are as follows:
- Illuminance is the dominant factor influencing safety perception, but it exhibits a clear saturation threshold. Perceptual needs vary across functional zones: business districts rely more on semi-cylindrical illuminance to meet the demands for three-dimensional perception, whereas roads and squares are primarily influenced by horizontal illuminance.
- The study derived recommended illuminance ranges for urban public spaces: 4.02–10.10 lx for roads, 5.05–38.3 lx for business districts, and 6.46–12.52 lx for squares. As these values are overall lower than the current national standards, it suggests that there is substantial potential for energy conservation in Dalian without compromising residents’ sense of safety.
- Safety perception is the result of the synergistic interaction between lighting and the environment. Business districts achieve the highest safety perception due to the combined effect of “high illuminance + high vitality”, whereas roads score the lowest due to insufficient singular lighting provision. Macroscopically, the distribution of safety perception in Dalian’s main urban area aligns closely with the illuminance pattern, presenting a spatial characteristic of being “high in the southeast and low in the northwest.”
Future research is expected to expand the application of remote sensing technologies by incorporating additional urban cases and spatial types, with the aim of further optimizing the remote sensing models that link the lighting environment and safety perception. Furthermore, the potential for incorporating real-time dynamic monitoring data and multi-dimensional perception indicators will be explored to enhance the timeliness and interpretability of these models. By integrating smart lighting design, the findings are anticipated to contribute to the optimization of light environments and the improvement of nighttime space quality, thereby providing scientific support for human-centered urban lighting planning.
Supplementary Materials
The following supporting information can be downloaded at: https://www.mdpi.com/article/10.3390/rs18010032/s1, Table S1: Field-measured lighting data; Table S2: Questionnaire.
Author Contributions
Conceptualization, M.L. and H.Z.; methodology, M.L.; software, H.Z.; validation, M.L. and H.Z.; formal analysis, R.L.; investigation, C.W.; resources, M.L.; data curation, C.W. and F.J.; writing—original draft preparation, J.L.; writing—review and editing, M.L. and H.Z.; visualization, H.Z. and R.L.; supervision, M.L.; project administration, M.L.; funding acquisition, M.L. All authors have read and agreed to the published version of the manuscript.
Funding
This research was funded by The National Natural Science Foundation of China, grant number 52178067.
Data Availability Statement
To ensure the reproducibility and transparency of this study, the raw data and the questionnaire scales used herein have been compiled and submitted as Supplementary Material accompanying this manuscript. All datasets and analytical results generated in this research are available from the corresponding author upon reasonable request.
Acknowledgments
The authors would like to express their appreciation to editors and the anonymous reviewer for their valuable and constructive comments to improve our manuscript.
Conflicts of Interest
The authors declare that they have no known competing financial interests or personal relationships that could have appeared to influence the work reported in this paper.
Abbreviations
The following abbreviations are used in this manuscript:
| Abbreviation | Full name |
| NTL | Nighttime Light |
| FoS | Feeling of Safety |
| CCT | Correlated Color Temperature |
| CRI | Color Rendering Index |
| MMU | Minimum Measurement Unit |
| UAV | Unmanned Aerial Vehicle |
| LoNNe | Loss of the Night Network |
| LED | Light Emitting Diode |
| RMSE | Root Mean Square Error |
| MAE | Mean Absolute Error |
| MSE | Mean Squared Error |
| MRE | Mean Relative Error |
| DN | Digital Number |
References
- Zhang, B.G.; Liu, M.; Li, R.C.; Liu, J.; Feng, L.; Zhang, H.; Jiao, W.L.; Lang, L. Evaluation of Urban Microscopic Nighttime Light Environment Based on the Coupling Observation of Remote Sensing and UAV Observation. Remote Sens. 2024, 16, 3288. [Google Scholar] [CrossRef]
- Boyce, P.R. The benefits of light at night. Build. Environ. 2019, 151, 356–367. [Google Scholar] [CrossRef]
- Gupta, P.; Kolhe, N.P.; Vyas, S. Coupling and coordination association between night light intensity and women safety—A comparative assessment of Indian metropolitan cities. J. Clean. Prod. 2024, 481, 144135. [Google Scholar] [CrossRef]
- CIE 115-2010; Lighting of Roads for Motor and Pedestrain Traffic. International Commission on Illumination (CIE): Vienna, Austria, 2010.
- CIE. CIE Position Statement on Obtrusive Light and Light Pollution; International Commission on Illumination (CIE): Vienna, Austria, 2025. [Google Scholar]
- JGJ/T 163-2008; Standard of Lighting Design of Urban Nightscape. Standardization Administration of China: Beijing, China, 2008.
- CJJ 45-2015; Standard for Lighting Design of Urban Road. Standardization Administration of China: Beijing, China, 2015.
- BSI. Light and Lighting—Lighting of Work Places-Part 2: Outdoor Work Places; BSI Standards Publication: London, UK, 2014. [Google Scholar]
- ANSI/IES RP-8-18; Design of Roadway Facility Lighting. American National Standards Institute: Washington, DC, USA; Illuminating Engineering Society: New York, NY, USA, 2018; Volume 27, pp. 183–197.
- Zhang, X.; Liu, S.J. The Elements Analysis and Quantitative Evaluation Method of Psychological Security in Public Space: Taking Wuhan University Campus as an Example. Huazhong Archit. 2020, 38, 85–93. [Google Scholar] [CrossRef]
- Tagliabue, L.C.; Cecconi, F.R.; Moretti, N.; Rinaldi, S.; Bellagente, P.; Ciribini, A. Security Assessment of Urban Areas through a GIS-Based Analysis of Lighting Data Generated by IoT Sensors. Appl. Sci. 2020, 10, 2174. [Google Scholar] [CrossRef]
- Svechkina, A.; Trop, T.; Portnov, B.A. How Much Lighting is Required to Feel Safe When Walking Through the Streets at Night? Sustainability 2020, 12, 3133. [Google Scholar] [CrossRef]
- Son, D.; Im, B.; Her, J.; Park, W.; Kang, S.; Kim, S. Street lighting environment and fear of crime: A simulated virtual reality experiment. Virtual Real. 2024, 29, 8. [Google Scholar] [CrossRef]
- van Rijswijk, L.; Haans, A. Illuminating for Safety: Investigating the Role of Lighting Appraisals on the Perception of Safety in the Urban Environment. Environ. Behav. 2018, 50, 889–912. [Google Scholar] [CrossRef]
- Himschoot, E.A.; Crump, M.C.; Buckley, S.; Cai, C.; Lawson, S.; White, J.; Beeco, A.; Taff, D.; Newman, P. Feelings of safety for visitors recreating outdoors at night in different artificial lighting conditions. J. Environ. Psychol. 2024, 97, 102374. [Google Scholar] [CrossRef]
- Jedon, R.; Haans, A.; van den Akkerveken, I.; de Kort, Y. Is it the darkness that you fear? The impact of anxiety on pedestrian tolerance for darkness. J. Environ. Psychol. 2025, 106, 102720. [Google Scholar] [CrossRef]
- Chalfin, A.; Hansen, B.; Lerner, J.; Parker, L. Reducing Crime Through Environmental Design: Evidence from a Randomized Experiment of Street Lighting in New York City. J. Quant. Criminol. 2022, 38, 127–157. [Google Scholar] [CrossRef]
- Son, D.; Hyeon, T.; Park, Y.; Kim, S. Analysis of the relationship between nighttime illuminance and fear of crime using a quasi-controlled experiment with recorded virtual reality. Cities 2023, 134, 104184. [Google Scholar] [CrossRef]
- Navarrete-Hernandez, P.; Dong, Y.; Moresco, E. When daylight fades: How nighttime, sociodemographics, and urban zones shape safety perceptions of the built environment. Landsc. Urban Plan. 2025, 264, 105460. [Google Scholar] [CrossRef]
- Fotios, S.; Monteiro, A.L.; Uttley, J. Evaluation of pedestrian reassurance gained by higher illuminances in residential streets using the day-dark approach. Light. Res. Technol. 2019, 51, 557–575. [Google Scholar] [CrossRef]
- Xu, X.T.; Sasaki, W.; Yu, C.C.; Takama, Y. Proposal of Collecting Lighting Situation of Roads at Night for Recommendation of Safety Walking Route Using Smartphone. In Proceedings of the IEEE/SICE International Symposium on System Integration (SII), Tokyo, Japan, 13–15 December 2014; pp. 414–418. [Google Scholar] [CrossRef]
- Trop, T.; Tavory, S.S.; Portnov, B.A.A. Factors Affecting Pedestrians’ Perceptions of Safety, Comfort, and Pleasantness Induced by Public Space Lighting: A Systematic Literature Review. Environ. Behav. 2023, 55, 3–46. [Google Scholar] [CrossRef]
- Liu, S.; Zhou, Y.; Wang, F.; Wang, S.; Wang, Z.; Wang, Y.; Qin, G.; Wang, P.; Liu, M.; Huang, L. Lighting characteristics of public space in urban functional areas based on SDGSAT-1 glimmer imagery:A case study in Beijing, China. Remote Sens. Environ. 2024, 306, 114137. [Google Scholar] [CrossRef]
- Bystryantseva, N.V.; Antonov, R.A.; Balaev, A.F. Assessment of the impact of street lighting on usage activity of pedestrian traffic spaces on the example of the square in Saint Petersburg. In Proceedings of the International Conference on Construction, Architecture and Technosphere Safety (ICCATS), Sochi, Russia, 6–12 September 2020; Volume 962. [Google Scholar] [CrossRef]
- Kim, K.H.; Hwang, T.; Kim, G. The Role and Criteria of Advanced Street Lighting to Enhance Urban Safety in South Korea. Buildings 2024, 14, 2305. [Google Scholar] [CrossRef]
- Llinares, C.; Higuera-Trujillo, J.L.; Montañana, A.; Castilla, N. Improving the Pedestrian’s Perceptions of Safety on Street Crossings. Psychological and Neurophysiological Effects of Traffic Lanes, Artificial Lighting, and Vegetation. Int. J. Environ. Res. Public Health 2020, 17, 8576. [Google Scholar] [CrossRef] [PubMed]
- Masullo, M.; Cioffi, F.; Li, J.; Maffei, L.; Ciampi, G.; Sibilio, S.; Scorpio, M. Urban Park Lighting Quality Perception: An Immersive Virtual Reality Experiment. Sustainability 2023, 15, 2069. [Google Scholar] [CrossRef]
- van Beek, A.; Feng, Y.; Duives, D.C.; Hoogendoorn, S.P. Studying the impact of lighting on the pedestrian route choice using Virtual Reality. Saf. Sci. 2024, 174, 106467. [Google Scholar] [CrossRef]
- Rahm, J.; Sternudd, C.; Johansson, M. “In the evening, I don’t walk in the park”: The interplay between street lighting and greenery in perceived safety. URBAN Des. Int. 2021, 26, 42–52. [Google Scholar] [CrossRef]
- Cho, Y.; Jeong, H.; Choi, A.; Sung, M. Design of a Connected Security Lighting System for Pedestrian Safety in Smart Cities. Sustainability 2019, 11, 1308. [Google Scholar] [CrossRef]
- Kang, H.; Sharston, R.; Shen, J.; Hayes, R. When a Stranger Approaches at Night: The Impact of Adaptive Street Lighting on Safety Perception. Leukos 2025, 21, 141–163. [Google Scholar] [CrossRef]
- Li, X.; Li, D.; Xu, H.; Wu, C. Intercalibration between DMSP/OLS and VIIRS night-time light images to evaluate city light dynamics of Syria’s major human settlement during Syrian Civil War. Int. J. Remote Sens. 2017, 38, 5934–5951. [Google Scholar] [CrossRef]
- Xu, P.F.; Wan, Q.; Jin, J.; Jin, P.B. An increase in nighttime light detected for protected areas in mainland China based on VIIRS DNB data. Ecol. Indic. 2019, 107, 105615. [Google Scholar] [CrossRef]
- Shi, K.; Yu, B.; Huang, Y.; Hu, Y.; Yin, B.; Chen, Z.; Chen, L.; Wu, J. Evaluating the Ability of NPP-VIIRS Nighttime Light Data to Estimate the Gross Domestic Product and the Electric Power Consumption of China at Multiple Scales: A Comparison with DMSP-OLS Data. Remote Sens. 2014, 6, 1705–1724. [Google Scholar] [CrossRef]
- Chen, Z.; Yu, B.; Yang, C.; Zhou, Y.; Yao, S.; Qian, X.; Wang, C.; Wu, B.; Wu, J. An extended time series (2000-2018) of global NPP-VIIRS-like nighttime light data from a cross-sensor calibration. Earth Syst. Sci. Data 2021, 13, 889–906. [Google Scholar] [CrossRef]
- Liu, X.; Li, X. Luojia nighttime light data with a 130m spatial resolution providing a better measurement of gridded anthropogenic heat flux than VIIRS. Sust. Cities Soc. 2023, 94, 104565. [Google Scholar] [CrossRef]
- Wang, M.; Wu, Q.; Xiao, J.; Li, D.; Yang, F. Luojia 3-01 Satellite-Real-Time Intelligent Service System for Remote Sensing Science Experiment Satellite. IEEE J. Sel. Top. Appl. Earth Observ. Remote Sens. 2024, 17, 8250–8257. [Google Scholar] [CrossRef]
- Chen, Z.; Zhang, Y.; Zang, P.; Liu, Z.; Zhao, W. Mapping the grassland quality of the flooded plain based on Jilin-01 images with a red-edge spectral band. Front. Earth Sci. 2023, 10, 1024680. [Google Scholar] [CrossRef]
- Watson, C.S.; Elliott, J.R.; Cordova, M.; Menoscal, J.; Bonilla-Bedoya, S. Evaluating night-time light sources and correlation with socio-economic development using high-resolution multi-spectral Jilin-1 satellite imagery of Quito, Ecuador. Int. J. Remote Sens. 2023, 44, 2691–2716. [Google Scholar] [CrossRef]
- Lin, Z.R.; Jiao, W.L.; Liu, H.C.; Long, T.F.; Liu, Y.K.; Wei, S.R.; He, G.J.; Trop, T.; Portnov, B.A.; Liu, M.; et al. Modelling the Public Perception of Urban Public Space Lighting Based on SDGSAT-1 Glimmer Imagery: A Case Study in Beijing, China. Sust. Cities Soc. 2023, 88, 104272. [Google Scholar] [CrossRef]
- Guo, H.D.; Dou, C.Y.; Chen, H.Y.; Liu, J.B.; Fu, B.H.; Li, X.M.; Zou, Z.M.; Liang, D. SDGSAT-1: The world’s first scientific satellite for sustainable development goals. Sci. Bull. 2023, 68, 34–38. [Google Scholar] [CrossRef]
- Guo, J.Y.; Zhang, F.; Zhao, H.; Pan, B.X.; Mei, L.L. Global reconstruction of three decades of fine-grained nighttime light data with analysis of large-scale infrastructure and landmarks. Remote Sens. Environ. 2025, 331, 115036. [Google Scholar] [CrossRef]
- Cui, Z.Y.; Kerekes, J.P. Impact of Wavelength Shift in Relative Spectral Response at High Angles of Incidence in Landsat-8 Operational Land Imager and Future Landsat Design Concepts. IEEE Trans. Geosci. Remote Sens. 2018, 56, 5873–5883. [Google Scholar] [CrossRef]
- Liu, M.; Li, R.C.; Zhang, B.G.; Jiao, W.L.; Luo, T.; Portnov, B.A.; Trop, T.; Liu, J.; Zhang, H. Evaluation of perception and analysis of energy saving potential of nighttime illumination in different types of residential areas: A case study of Dalian, China. Sust. Cities Soc. 2024, 114, 105753. [Google Scholar] [CrossRef]
- Xu, Y.; Huang, Y.; Ding, W.; Zhou, Y.; Shen, Y.; Wan, Y.; Su, P.; Tao, F.; Sun, Y. Exposure to real-ambient bedroom light at night delayed circadian rhythm in healthy Chinese young adults: A cross-sectional study. Environ. Res. 2024, 251, 118657. [Google Scholar] [CrossRef]
- Kotarba, A.Z.; Chacewicz, S.; Zmudzka, E. Night sky photometry over Warsaw (Poland) evaluated simultaneously with surface-based and satellite-based cloud observations. J. Quant. Spectrosc. Radiat. Transf. 2019, 235, 95–107. [Google Scholar] [CrossRef]
- Zheng, S.; Chen, Y.; Eziz, A.; Kurban, A.; van de Voorde, T.; De Maeyer, P. Machine-Learning-Based Monitoring of Night Sky Brightness Using Sky Quality Meters and Multi-Source Remote Sensing. Remote Sens. 2025, 17, 1332. [Google Scholar] [CrossRef]
- Liu, S.B.; Jin, X.L.; Bai, Y.; Wu, W.B.; Cui, N.B.; Cheng, M.H.; Liu, Y.D.; Meng, L.; Jia, X.; Nie, C.W.; et al. UAV multispectral images for accurate estimation of the maize LAI considering the effect of soil background. Int. J. Appl. Earth Obs. Geoinf. 2023, 121, 103383. [Google Scholar] [CrossRef]
- Bian, J.; Khan, T.A.; Li, A.; Zhao, J.; Deng, Y.; Lei, G.; Zhang, Z.; Nan, X.; Naboureh, A.; Khan, M.U. A new spatiotemporal fusion model for integrating VIIRS and SDGSAT-1 Nighttime light data to generate daily SDGSAT-1 like observations. Int. J. Digit. Earth 2025, 18, 2472912. [Google Scholar] [CrossRef]
- Liu, M.; Li, R.C.; Li, Y.W.; AL-Mowallad, E.; Wu, C.L.; Wang, W.J. Nighttime light intensity and brightness suitability in urban functional zones. Sci. Rep. 2025, 15, 25113. [Google Scholar] [CrossRef]
- Liu, M.; Li, R.C.; Zhang, B.G.; Li, Y.W. Supply-demand relationship between nighttime lighting and urban vitality based on multi-source data. Indoor Built Environ. 2025, 23, 1420326X251383004. [Google Scholar] [CrossRef]
- Chen, J.Y.; Chen, Y.B.; Zheng, Z.H.; Ling, Z.X.; Meng, X.X.; Kuang, J.Y.; Shi, X.H.; Yang, Y.F.; Chen, W.T.; Wu, Z.F. Urban Functional Zone Classification Based on High-Resolution Remote Sensing Imagery and Nighttime Light Imagery. Remote Sens. 2025, 17, 1588. [Google Scholar] [CrossRef]
- Liu, Y. Model Construction and Optimization Design of Residential Area Lighting Integrating Public. Master’s Thesis, Dalian University of Technology, Dalian, China, 2021. [Google Scholar]
- Guo, W.; Zhang, J.; Zhao, X.; Li, Y.; Liu, J.; Sun, W.; Fan, D. Combining Luojia1-01 Nighttime Light and Points-of-Interest Data for Fine Mapping of Population Spatialization Based on the Zonal Classification Method. IEEE J. Sel. Top. Appl. Earth Observ. Remote Sens. 2023, 16, 1589–1600. [Google Scholar] [CrossRef]
- Sun, L.; Wang, J.; Chang, S. Population Spatial Distribution Based on Luojia 1-01 Nighttime Light Image: A Case Study of Beijing. Chin. Geogr. Sci. 2021, 31, 966–978. [Google Scholar] [CrossRef]
- Liu, M.; Li, W.; Zhang, B.; Hao, Q.; Guo, X.; Liu, Y. Research on the influence of weather conditions on urban night light environment. Sust. Cities Soc. 2020, 54, 101980. [Google Scholar] [CrossRef]
- EN 13201-4-2015; Road Lighting—Part 4: Methods of Measuring Lighting Performance. European Committee for Standardization (CEN): Brussels, Belgium, 2015.
- Liu, M.; Liu, X.S.; Zhang, B.G.; Li, Y.W.; Luo, T.; Liu, Q.Y. Analysis of the evolution of urban nighttime light environment based on time series. Sust. Cities Soc. 2022, 78, 103660. [Google Scholar] [CrossRef]
- Portnov, B.A.; Fotios, S.; Saad, R.; Kliger, D. Establishing optimal illuminance for pedestrian reassurance using segmented regression. Light. Res. Technol. 2024, 56, 260–273. [Google Scholar] [CrossRef]
- Sun, M.J.; Tian, Y.; Tang, L.; Li, X. A K-means regression prediction model based neural network data set. Technol. Innov. Appl. 2024, 14, 74–80. [Google Scholar] [CrossRef]
- Sun, S.J.; Liu, F.C.; Zhou, Y.; Li, R. Geographically weighted regression residual Kriging method applicable for. Trans. Oceanol. Limnol. 2023, 45, 34–42. [Google Scholar] [CrossRef]
- Yang, P.; Gu, C.S.; Dong, J.S.; Hu, Y.; Chen, Y. Geotechnical parameters prediction based on multiple regression model and information entropy. Chin. J. Undergr. Space Eng. 2023, 19, 1782–1790. [Google Scholar] [CrossRef]
- Li, Y.G.; Yang, J.; Qin, D.W. Accurate and interpretable PM2.5 prediction based on GC-AE-RegLSTM. J. Comput. Sci. 2025, 91, 102687. [Google Scholar] [CrossRef]
- Victor, W.; Somasundaram, D.; Gnanadason, K. Adaptive particle swarm optimization-based deep neural network for productivity enhancement of solar still. Environ. Sci. Pollut. Res. 2022, 29, 24802–24815. [Google Scholar] [CrossRef]
- Abd Elaziz, M.; El-Said, E.; Elsheikh, A.H.; Abdelaziz, G.B. Performance prediction of solar still with a high-frequency ultrasound waves atomizer using random vector functional link/heap-based optimizer. Adv. Eng. Softw. 2022, 170, 10314. [Google Scholar] [CrossRef]
- Mander, S.; Alam, F.; Lovreglio, R.; Ooi, M. How to measure light pollution-A systematic review of methods and applications. Sust. Cities Soc. 2023, 92, 104465. [Google Scholar] [CrossRef]
- Czyzewski, D.; Fryc, I. The Influence of Luminaire Photometric Intensity Curve Measurements Quality on Road Lighting Design Parameters. Energies 2020, 13, 3301. [Google Scholar] [CrossRef]
- Li, X.; Liu, Z.; Chen, X.; Sun, J. Assessing the Ability of Luojia 1-01 Imagery to Detect Feeble Nighttime Lights. Sensors 2019, 19, 3708. [Google Scholar] [CrossRef]
- Menendez-Velazquez, A.; Garcia-Delgado, A.B.; Morales, D. Human-Centric Lighting: Rare-Earth-Free Photoluminescent Materials for Correlated Color Temperature Tunable White LEDs. Int. J. Mol. Sci. 2023, 24, 3602. [Google Scholar] [CrossRef]
- Kazemidemneh, M. Evaluation of Women’s Perceived Safety After Dark Using VR (Virtual Reality) Technology, 2025. Available online: https://hdl.handle.net/2097/44800 (accessed on 15 December 2025).
- Wei, L.; Bizjak, G.; Kobav, M.B. Evaluating the impact of road lighting on pedestrian reassurance through the day-dark approach. Light. Res. Technol. 2025, 57, 264–277. [Google Scholar] [CrossRef]
- Zhang, L.C.; Yan, Y.H. Research Progress on Lighting of Pedestrian Space for the Elderly. China Illum. Eng. J. 2023, 34, 114–120. [Google Scholar] [CrossRef]
- Wen, C.H.; Long, T.F.; Jiao, W.L.; Lin, Z.R.; Liu, Y.K. Public Perception Evaluation and Simulation Optimization of Street Lighting in Typical Residential Areas of Beijing. China Illum. Eng. J. 2023, 34, 114–125. [Google Scholar] [CrossRef]


Disclaimer/Publisher’s Note: The statements, opinions and data contained in all publications are solely those of the individual author(s) and contributor(s) and not of MDPI and/or the editor(s). MDPI and/or the editor(s) disclaim responsibility for any injury to people or property resulting from any ideas, methods, instructions or products referred to in the content. |
© 2025 by the authors. Licensee MDPI, Basel, Switzerland. This article is an open access article distributed under the terms and conditions of the Creative Commons Attribution (CC BY) license.