Highlights
What are the main findings?
- Three distinct radar facies (F1–F3) were successfully identified from GPR profiles and correlated with sediment properties, enabling high-resolution discrimination of subsurface sedimentary units.
- The Hilbert instantaneous phase method achieved the highest accuracy in sediment interface detection, with relative errors below 6% in 64% of sediment layers and positioning errors under 5 cm in most horizons.
What are the implication of the main findings?
- The integration of radar facies interpretation with borehole data provides a reliable approach for inferring lithological properties in deep strata where GPR signal quality declines.
- The demonstrated performance of the Hilbert-based method supports its use as a robust tool for high-precision, non-invasive subsurface mapping in similar coastal depositional environments.
Abstract
The tidal mudflat of the South Yellow Sea is characterized by complex sediment environments that preserve rich paleoenvironmental signals, making it an important area for understanding land–sea interactions and promoting sustainable coastal development. Thus, accurate identification of sediment sequences and layer thicknesses becomes crucial for interpreting sediment dynamics and paleoenvironmental reconstruction. While borehole data have elucidated local sediment facies, their spatially discontinuous nature hinders a holistic reconstruction of regional depositional history. To overcome this limitation, ground-penetrating radar (GPR) surveys were conducted across the tidal mudflat of the South Yellow Sea, enabling systematic correlation between radar reflection patterns and sediment architectures. Based on the relationship between the dielectric permittivity and wave velocity, short-time Fourier transform (STFT) was applied to derive the peak-weighted average frequency in the frequency domain for individual soil layers, revealing its dependence on dielectric properties. Sediment interfaces and layer thicknesses were determined using three methods: the radar image waveform method, the Hilbert spectrum instantaneous phase method, and the generalized S-transform time–frequency analysis method. The results indicate the following: (1) GPR enables high-fidelity imaging of subsurface stratigraphy, successfully resolving three distinct radar facies: F1: high-amplitude, horizontal, continuous reflections with parallel waveforms; F2: moderate-to-high-amplitude, sinuous continuous reflections with parallelism; and F3: medium-amplitude, discontinuous chaotic reflections. (2) All three methods effectively characterize subsurface soil stratification, but positioning accuracy decreases systematically with depth. Excluding anomalous errors at one site, the relative error for most layers within the 1 m depth is below 15%, and remains ≤25% at the 1–2 m depth. Beyond the 2 m depth, reliable stratification becomes unattainable due to severe signal attenuation. (3) Comparative analysis demonstrates that the Hilbert spectral instantaneous phase method significantly enhances GPR signals, achieving an optimal performance with positioning errors consistently below 5 cm for most soil layers. The application of this approach along the tidal mudflat of the South Yellow Sea significantly enhances the precision of sediment layer boundary identification. Our analysis systematically interpreted radar facies, demonstrating the effectiveness of the Hilbert spectrum instantaneous phase method in delineating soil stratification. These findings offer reliable technical support for interpreting GPR data in comparable sediment environments.
1. Introduction
The tidal mudflat geological evolution of the South Yellow Sea has been largely con-trolled by global sea-level fluctuations since the beginning of the Holocene []. A major turning point occurred between AD 1128 and 1855, when the Yellow River diverted into the Huaihe system, delivering substantial amounts of terrigenous sediment to the sea. This sedimentation profoundly reshaped the coastal depositional environment and resulted in a highly heterogeneous spatial distribution of sedimentary facies []. The area retains valuable archives of environmental change, providing a critical natural laboratory for investigating land–sea interactions. Extensive studies have been conducted in recent decades focusing on stratigraphic sequence division, reconstruction of paleo-depositional environments, and the evolution of sediment systems. Traditionally, the understanding of sedimentary layers has primarily relied on their geometric morphology and structural attributes, which are largely derived from observations of natural erosion exposures, mechanical drill cores, and artificially excavated soil profiles. Research into the Quaternary evolution of the Jiangsu coast demonstrates a clear progression from foundational stratigraphic identification to quantitative process analysis. The work by Yang et al. [] established a robust stratigraphic framework by integrating lithological and geochemical data from boreholes, which successfully identified the four major marine transgressions and served as a cornerstone for subsequent studies. Building directly upon this foundation, Yang et al. [] introduced a quantitative dimension by applying an end-member mixing model to elucidate sediment source contributions and source-to-sink dynamics during the Holocene. Further refining the paleoenvironmental narrative, Shu et al. [] employed multi-proxy analyses to reconstruct the complex history of land–sea interactions, providing a more integrated environmental perspective. Most recently, the focus has shifted to deltaic morphodynamic processes, with Xue et al. [] revealing the millennial-scale evolution and controlling factors of the abandoned Yellow River Delta. Although previous research has elucidated the stratigraphic facies and sedimentary environment evolution of the region, most borehole-based analyses remain constrained to vertical profiles at discrete points, offering limited horizontal continuity. This fragmented spatial coverage hinders a holistic understanding of the depositional system and complicates reconstructing regional sedimentary evolution with confidence. While these approaches offer valuable visual interpretations of soil architecture [], they each come with significant limitations. High-quality natural outcrops are only sporadically distributed across certain landscapes, whereas borehole drilling and artificial profiling are often hampered by low efficiency, substantial cost, and poor spatial continuity []. These inherent methodological constraints impede high-resolution, large-scale analysis of sediment systems.
In contrast to the conventional exploration techniques described earlier, ground-penetrating radar (GPR) enables non-invasive investigation of shallow subsurface structures. The method stands out for its high resolution, efficient automated data acquisition, ease of use, and cost-effectiveness. Owing to these advantages, particularly its non-destructive character and rapid surveying capabilities, GPR has been increasingly employed in near-surface soil studies in recent years [,,]. In a seminal study conducted in 1980, Johnson and colleagues utilized GPR to profile fine sand layers in Florida, marking one of the earliest successful applications of the method in near-surface surveying []. Their work not only demonstrated the feasibility of GPR in detecting subsurface structures but also laid the groundwork for subsequent investigations into soil organic horizons and permafrost layers. Building on this foundation, researchers including Collins and Mokma [,] employed targeted GPR profiling to identify continuous thin soil strata, further revealing the technique’s capacity to delineate subtle stratigraphic interfaces with clarity. Concurrently, an increasing number of researchers have applied GPR to soil horizon surveys. Roth et al. [] further advanced this field by delineating distinct soil layers through coherent reflections in radar images, broadening the interpretative framework for subsurface characterization. In a pioneering work study of GPR application in China, the technique was successfully implemented by Xu et al. [], who utilized Fourier transform to process GPR signals for soil horizon delineation in saline–alkali lands in Jilin Province, China. This study served as a cornerstone for subsequent investigations by Chinese scientists. In recent years, the applications of GPR in China have expanded to encompass a variety of subsurface environments, including saline–alkali soils [], karst slopes [], red soil regions [], and cultivated plow pan layers []. This progress has been driven particularly by refinements in multi-frequency antenna applications and sophisticated signal processing techniques. The adaptability of these approaches to complex terrains has been demonstrated in studies such as that by Wang et al. [], who successfully mapped karst slopes, and Liu et al. [], who established critical correlations between soil properties and horizon thickness in Northeast China. These field investigations highlight a shift from mere detection toward quantitative interpretation of subsurface characteristics. Concurrently, progress in numerical modeling and signal analysis has provided a robust theoretical foundation for interpreting radar data. For instance, the finite-difference time-domain (FDTD) model by Ardekani et al. [] offers a framework for simulating radar responses in stratified media, while advanced processing techniques, such as the Hilbert transform applied by Wu et al. [] and the combined envelope detection with short-time Fourier transform (STFT) employed by Li et al. [], have markedly improved the accuracy of layer interface identification and thickness estimation. The study by Li et al. [], achieving high precision in agricultural soils, exemplifies the successful convergence of methodological innovation and practical application. However, the practical performance of these methods, especially their detection depth and accuracy in layer identification in real-world environments, remains questionable. These considerable uncertainties highlight the need for a systematic comparative assessment. In response, this study evaluates three soil stratification techniques: the radar image waveform method, the Hilbert spectrum instantaneous phase method, and the generalized S-transform time–frequency method related to GPR applications. Sedimentary layer thicknesses derived from each method were calculated and rigorously validated against borehole core data, enabling a realistic appraisal of GPR’s potential for clarifying sedimentary architectures. By offering methodological benchmarks and practical insights, this work aims to support future studies in similar coastal depositional settings. Sediment layer thicknesses derived from each method were calculated and rigorously validated against borehole core data, enabling a realistic appraisal of GPR’s potential for clarifying sediment architectures. Therefore, we address the following objectives: (1) to detect sediment interfaces and layer thicknesses via the radar image waveform method, Hilbert spectrum instantaneous phase method, and generalized S-transform time–frequency analysis method; (2) to analyze the relationship between dielectric permittivity and frequency-domain peak-weighted average frequency derived from (STFT); and (3) to calculate sediment stratification profiles and layer thicknesses and assess the performance disparities in sediment thickness variation. The results of this study will offer reliable technical support for interpreting GPR data in comparable sediment environments and provide insight for understanding land–sea interactions.
2. Materials and Methods
2.1. Research Area
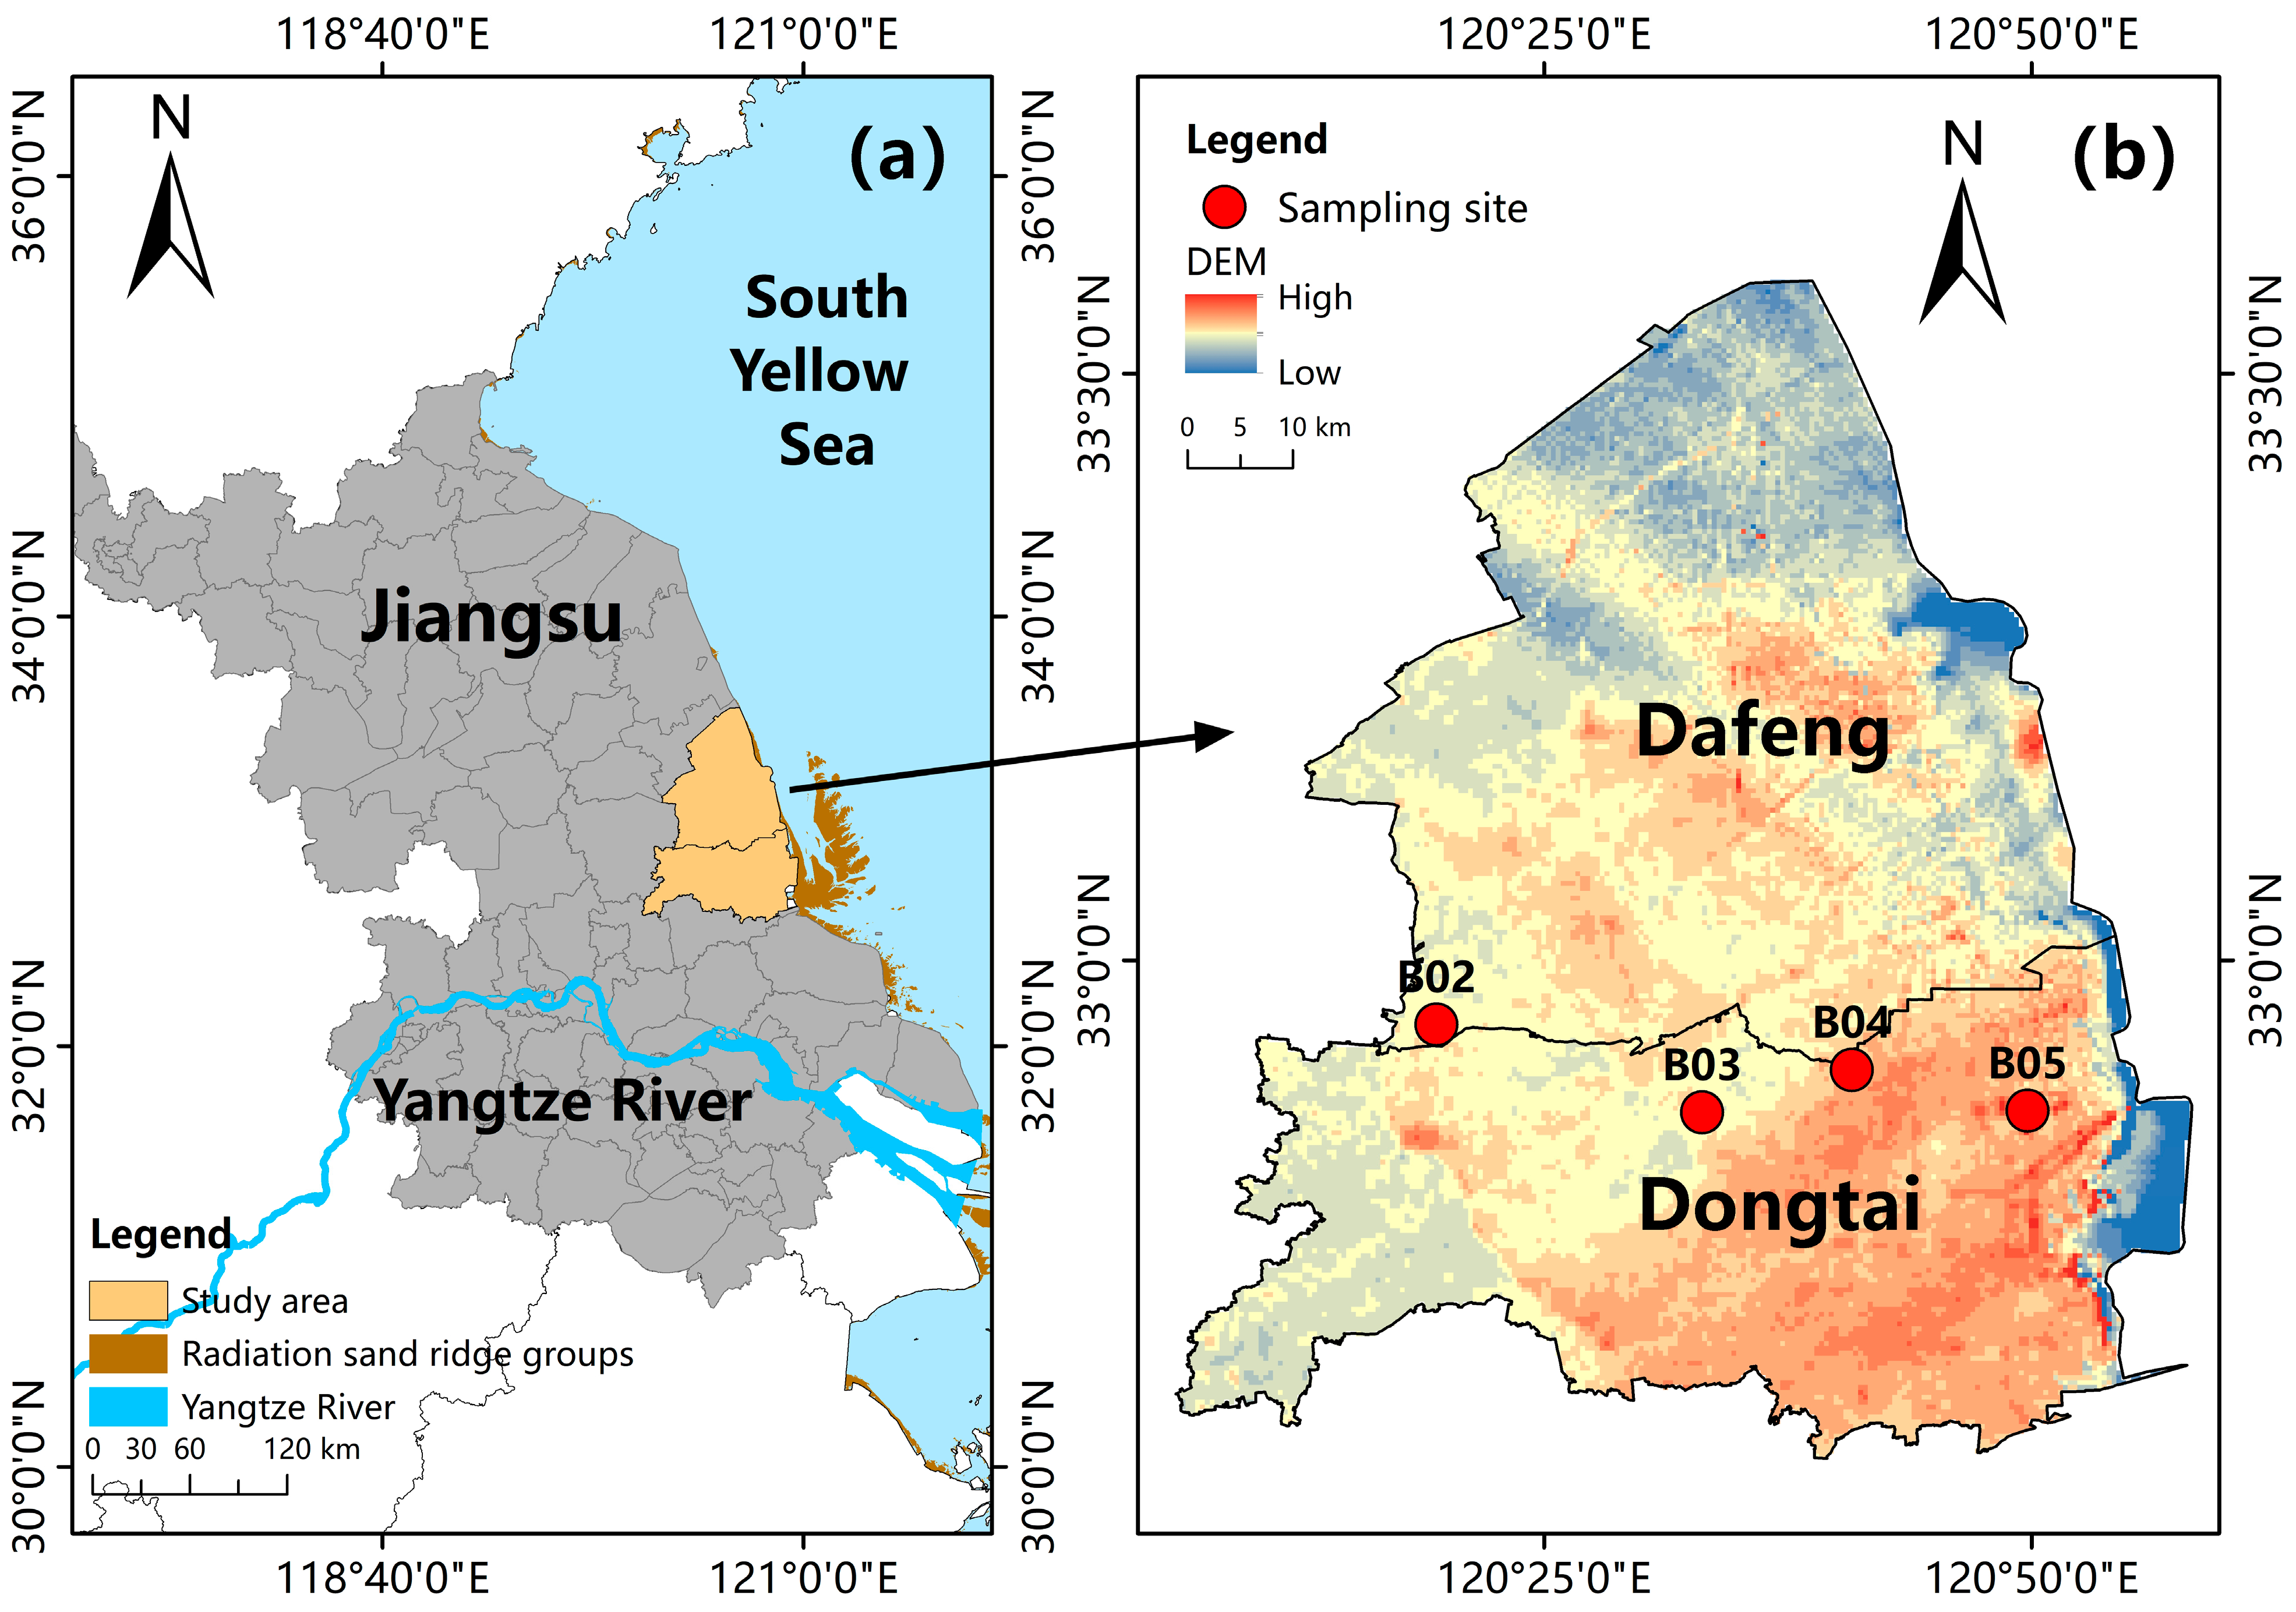
The study area is located on the eastern continental shelf of Jiangsu Province, China (Figure 1), covering latitudes between 32°35′N and 33°35′N and longitudes from 120°5′E to 120°55′E, with a total area of approximately 6616 km2. Four sampling sites were arranged along a transect perpendicular to the shoreline. This layout was designed specifically to investigate the influence of distance from the sea on the characteristics of the sediment layers. The topography generally slopes downward from south to north. Under a transitional temperate–subtropical climate strongly moderated by maritime influences, the region experiences four distinct seasons. Mean annual temperatures range from 12 °C to 15 °C, with annual precipitation averaging 900–1200 mm. Seasonal wind patterns shift noticeably: northerly winds dominate in winter, while southerly winds prevail during the summer months [].
Figure 1.
Overview of the eastern coastal area of Jiangsu Province. (a) Geographical location of the study area; (b) distribution of sampling sites (B02–B05).
Hydrodynamically influenced by the rotational tidal system of the South Yellow Sea and the progressive tidal wave from the East China Sea, the offshore zone is characterized by fan-shaped sand ridge complexes that extend radially toward the north, northeast, east, and southeast. These dynamic processes enhance the supply of fine-grained sediments, leading to the prevalence of silt, clayey silt, and silty sand–soil types that collectively shape a distinctive silty–clayey coastal environment []. The coastal evolution of this region has been significantly shaped by historical sediment inputs from the Yellow and Yangtze Rivers, especially following the Yellow River’s capture of the Huai River course between AD 1128 and 1855. Over the subsequent centuries, human activities such as reclamation and cultivation have led to the formation of tidal solonetz soils, with localized salinization continuing to affect certain areas [].
2.2. Research Data
2.2.1. Ground-Penetrating Radar Data
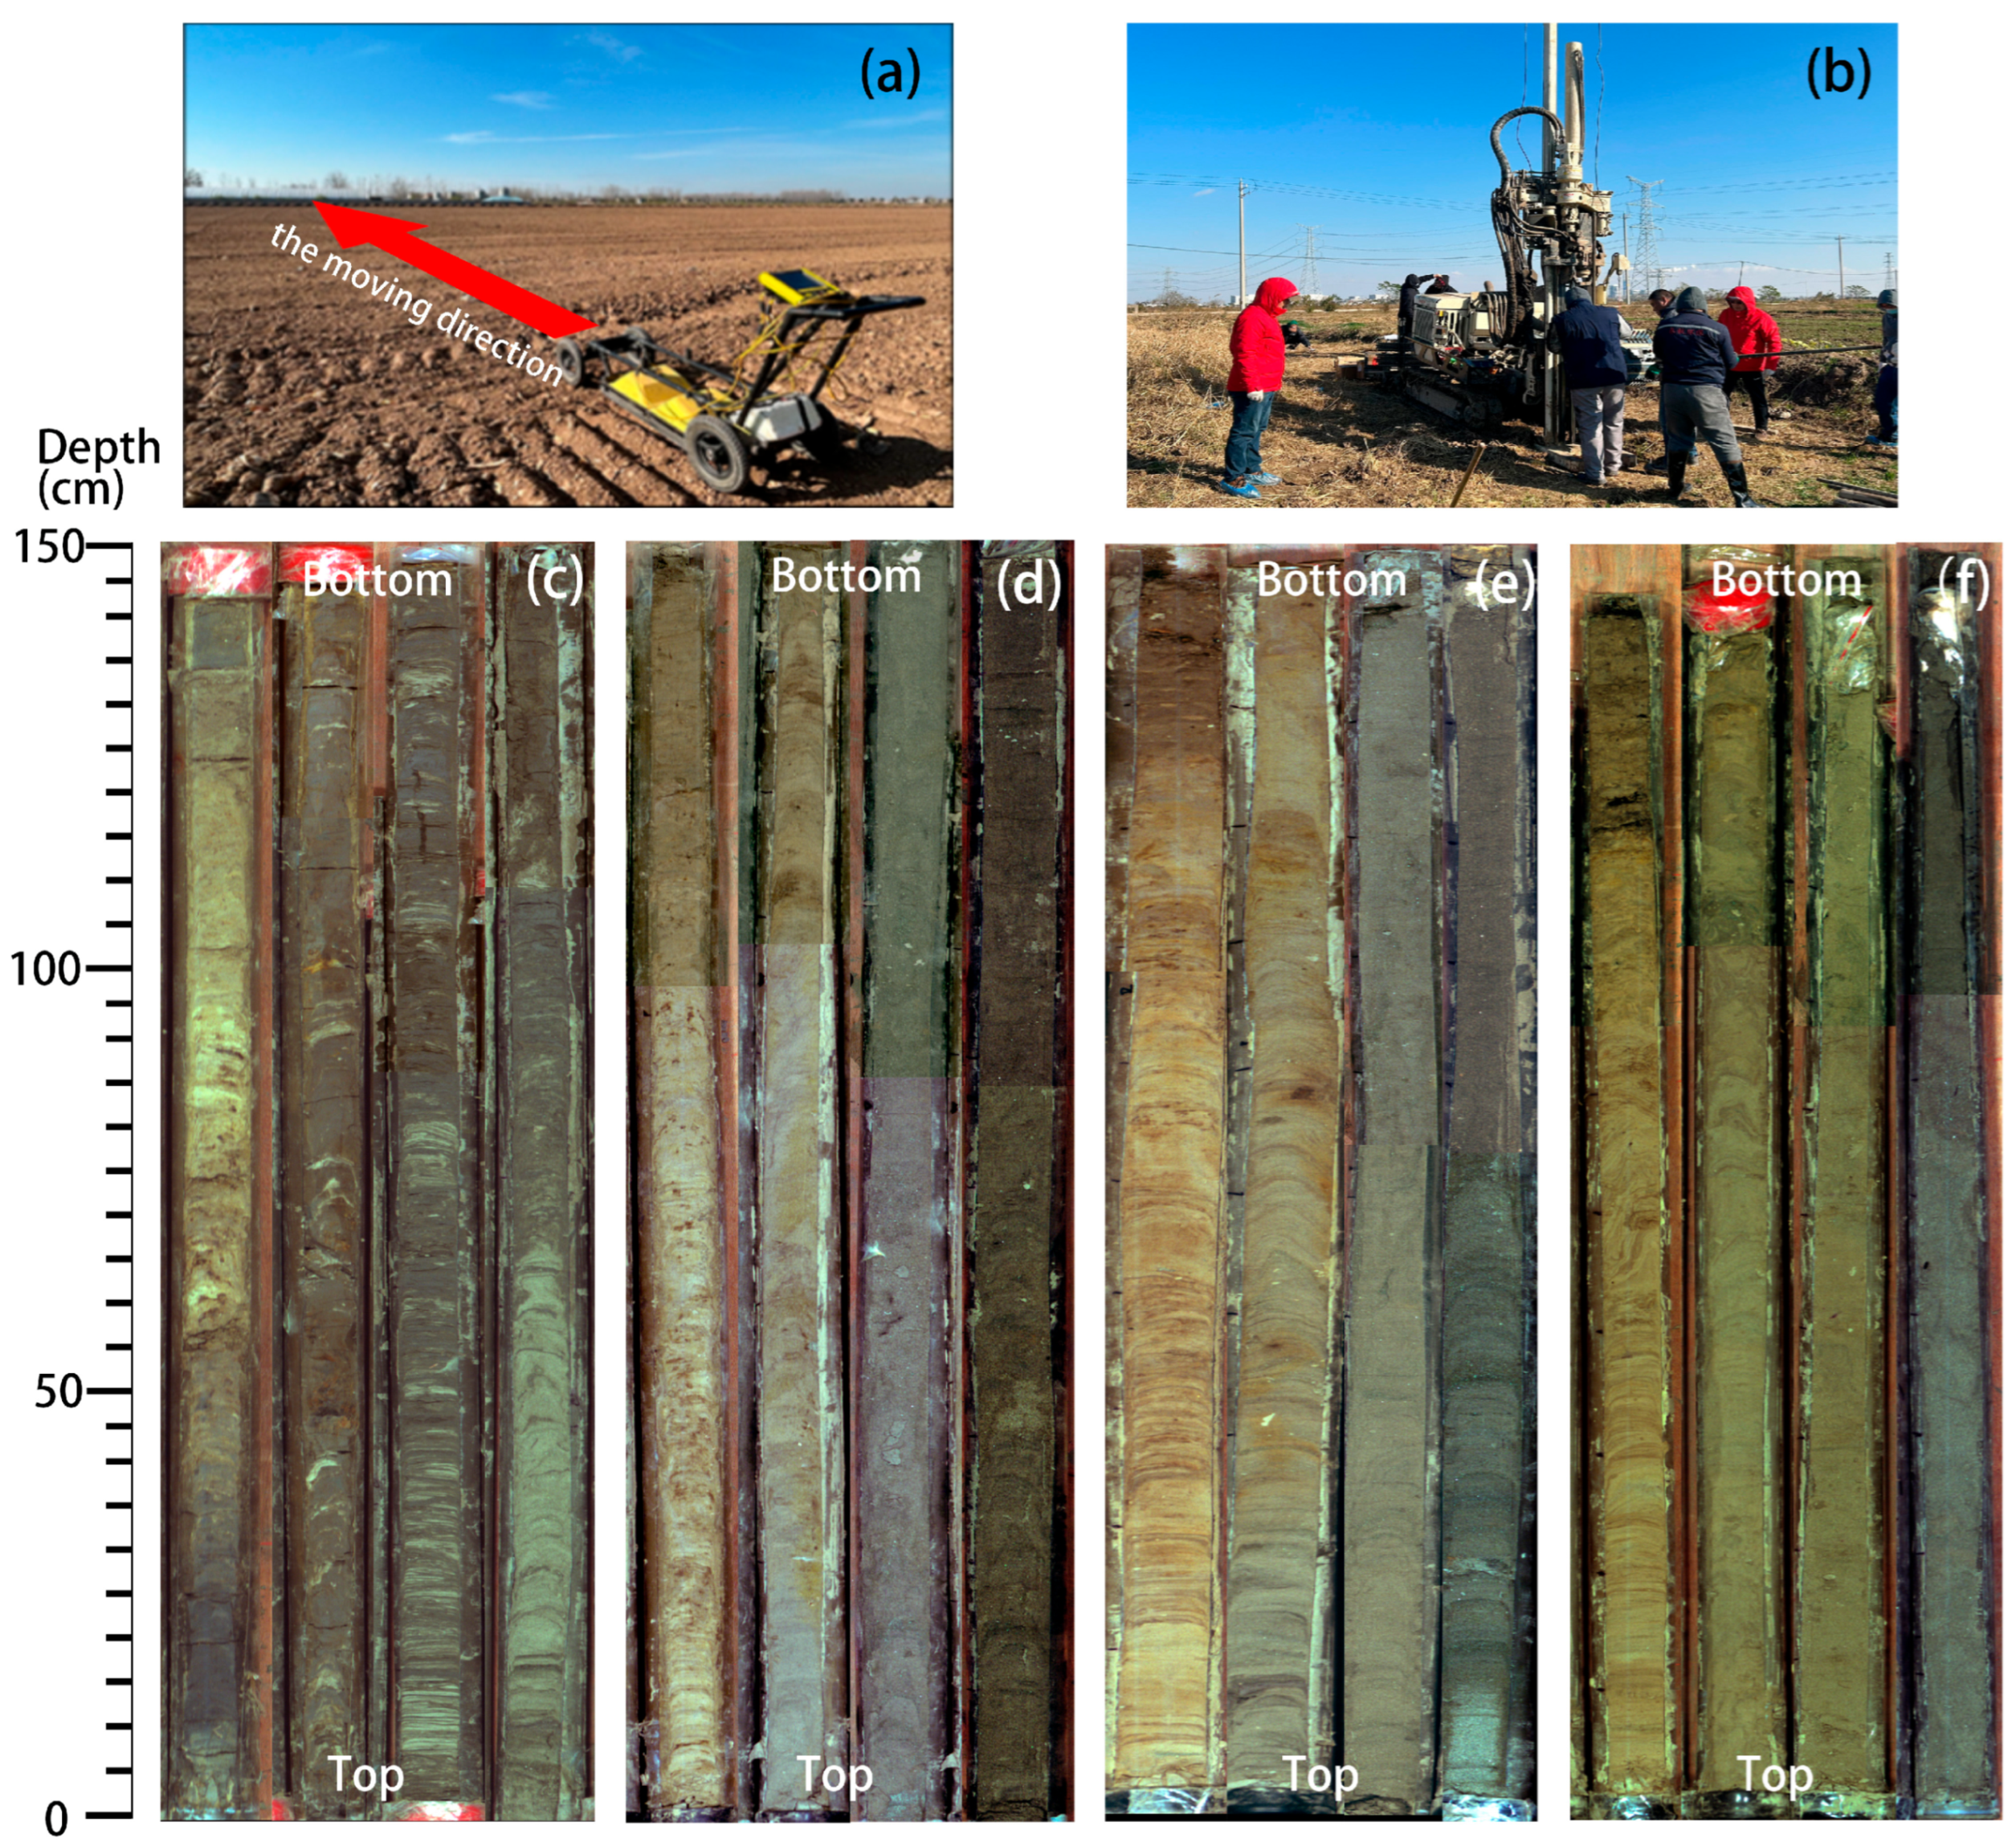
In November 2024, field surveys were carried out to assess the performance of GPR under real-world conditions (Figure 2a). To investigate the variation in sedimentary layers from inland to coastal areas, and following consultations with local residents and preliminary site reconnaissance that verified the sediment layers to be free from severe anthropogenic disturbance, four locations were chosen for GPR profiling and borehole sampling. The survey employed a single-channel pulse EKKO PRO system (Sensors & Software Inc., Mississauga, ON, Canada), comprising paired transmitter and receiver antennas along with a central control unit. Radar amplitudes were recorded at discrete points along predetermined transects, and subsurface reflection profiles were constructed by stacking amplitude traces. The integrated DVL-500 display unit allowed real-time visualization and preliminary interpretation, providing immediate insight into groundwater levels, sediment moisture, internal structures, and stratigraphic layering []. Data were acquired using the profiling method (common-offset reflection mode). The transmitter and receiver antennas were maintained at a fixed separation of 1 m. Multiple survey lines (profiles), each approximately 50 m in length, were deployed along the observation plane, and data were collected multiple times along each line. Key acquisition parameters were set as follows: antenna frequency = 250 MHz, pulse voltage = 400 V, step interval = 0.2 m, and time window = 100 ns.
Figure 2.
Field soil exploration activities and borehole profiles across sampling sites. (a) GPR data acquisition; (b) borehole sampling operations; (c–f) soil profiles at sites B02~B05, revealing distinct horizon boundaries and lithological variations.
2.2.2. Borehole Data
To verify the accuracy of the GPR-derived interpretations, borehole sampling was performed along the same survey lines using a Geoprobe 54LT track-mounted drilling system (Geoprobe Systems, Salina, KS, USA). This remotely operated rig utilizes high-frequency direct-push technology, with an impact rate of at least 1920 blows per minute and a strike force exceeding 80 kN (20,000 lbs), allowing the retrieval of minimally disturbed soil cores (Figure 2b). A dual-tube assembly (inner and outer barrels) ensures efficient penetration and recovery of intact samples while maintaining high operational throughput. Soil stratigraphy was delineated in the field by experienced analysts based on visual and tactile properties including color, texture, and mechanical characteristics, with simultaneous measurement of layer-specific dielectric constants. Segmented cores were subsequently subjected to detailed laboratory analyses to quantify key properties such as particle size distribution, depositional age, salinity, and organic content.
2.3. Research Methods
Regarding the identification of sedimentary thickness variation, the following three methods are mainly used to determine the time-domain positions of soil layer interfaces: the radar image waveform method (Section 2.3.1), Hilbert spectrum instantaneous phase method (Section 2.3.2), and generalized S-transform time–frequency analysis method (Section 2.3.3). Concurrently, soil dielectric permittivity was estimated by applying short-time Fourier transform (Section 2.3.4).
2.3.1. Radar Image Waveform Method
During the operation, GPR emits electromagnetic pulses into the subsurface. As these waves encounter interfaces between soil layers exhibiting contrasting dielectric properties, they undergo partial reflection and refraction, producing return signals characterized by distinct morphological and amplitude variations []. The GPR utilizes three primary scanning modes: A-scan, B-scan, and C-scan. The A-scan represents individual waveform traces, plotting two-way travel time along the horizontal axis and signal amplitude vertically. B-scan images, on the other hand, assemble multiple A-scans along a transect, with the antenna position on the x-axis and two-way travel time on the y-axis. Within these profiles, soil layer interfaces can be discerned by tracing laterally continuous reflections and amplitude-based color gradients. Nevertheless, this technique remains inherently interpretive and operator-dependent, which can introduce uncertainty in determining the time-domain location of stratigraphic boundaries. To enhance objectivity and accuracy, this study integrated A-scan and B-scan analyses by selecting single-trace waveforms at 1/4, 1/2, and 3/4 positions along the survey lines. Waveform fluctuations and morphological characteristics are utilized to determine the two-way travel times of stratification interfaces.
2.3.2. Hilbert Spectrum Instantaneous Phase Method
During the GPR data acquisition, the system records all reflected signals returning from the subsurface. This process also amplifies the interference noise alongside target reflections, which often limits the reliability of radar imagery for detailed soil layer classification. The Hilbert transform provides a means to precisely extract signal phase and amplitude attributes []. Its instantaneous phase component is particularly effective at highlighting interfaces between different media by reinforcing phase continuity axes—especially within regions exhibiting strong reflection coherence. In this study, the Hilbert transform was applied to perform instantaneous phase analysis, enabling accurate identification of soil interface positions in the time domain, that is, determining the position of . For a given GPR signal , the Hilbert transform is defined as
where represents the original ground-penetrating radar signal; represents the signal after Hilbert transformation; and represents the round-trip travel time of the radar signal (ns).
The instantaneous phase of GPR signals is defined by
2.3.3. Generalized S-Transform Time–Frequency Analysis Method
Accurately determining sedimentary thickness from GPR profiles fundamentally depends on the precise localization of electromagnetic signal reflections in the time domain. While the conventional S-transform often suffers from limited resolution and inflexibility in practical settings, the generalized S-transform offers a more adaptable alternative. This is achieved through the introduction of tunable parameters, specifically a width factor and a shape factor. The width factor controls the overall breadth of the Gaussian window, while the shape factor governs the rate at which the window width changes with frequency. By modifying the shape (width and decay rate) of the Gaussian window, the method significantly enhances control over time–frequency resolution. It can be expressed as a two-dimensional function, , where adjustments to the parameters and enhance its temporal resolution, thereby refining the characterization of signal variations []. When applying the generalized S-transform to perform time–frequency analysis on a GPR signal , the transform is defined as
where represents the integration variable in the transformation; ω is the frequency parameter; is the window width exponent; is the window width proportion factor; and is the radar signal after the generalized S-transform.
2.3.4. Estimating Soil Dielectric Permittivity via STFT for Electromagnetic Wave Velocity and Sedimentary Thickness Determination
Soil profiles are inherently heterogeneous, leading to dynamic variations in GPR signals as depth increases. To capture these spectral changes, STFT is employed, which extracts localized frequency content near time using a specified window function []. This approach reveals how the frequency spectrum of the signal evolves with depth. From the resulting time–frequency representation , the frequency-domain peak-weighted average frequency is derived by emphasizing dominant spectral peaks through weighted averaging. After detecting the relative dielectric constant ε of the soil, a relationship between and was established. In this study, a Hanming window with 80% overlap was used to balance temporal resolution and spectral leakage. STFT is defined as follows:
where denotes the center position of the analysis window along the time axis; represents the window function extracting localized signals within a specified temporal range centered at ; is the short-time Fourier transformed radar signal; and designates the spectral-peak-weighted average frequency in the frequency domain.
The wave velocity of electromagnetic waves propagating in the soil can be calculated using the dielectric constant []:
where represents the speed at which electromagnetic waves propagate in a vacuum, and its value is .
Once the two-way travel time of electromagnetic waves has been determined for different soil layers using the interpretive techniques described above, the thickness of each soil layer can be calculated using the following expression:
where denotes the thickness of the -th soil layer; represents the electromagnetic wave propagation velocity in the -th layer; and is the two-way travel time for radar signals traversing the -th layer.
2.3.5. Data Processing Procedure
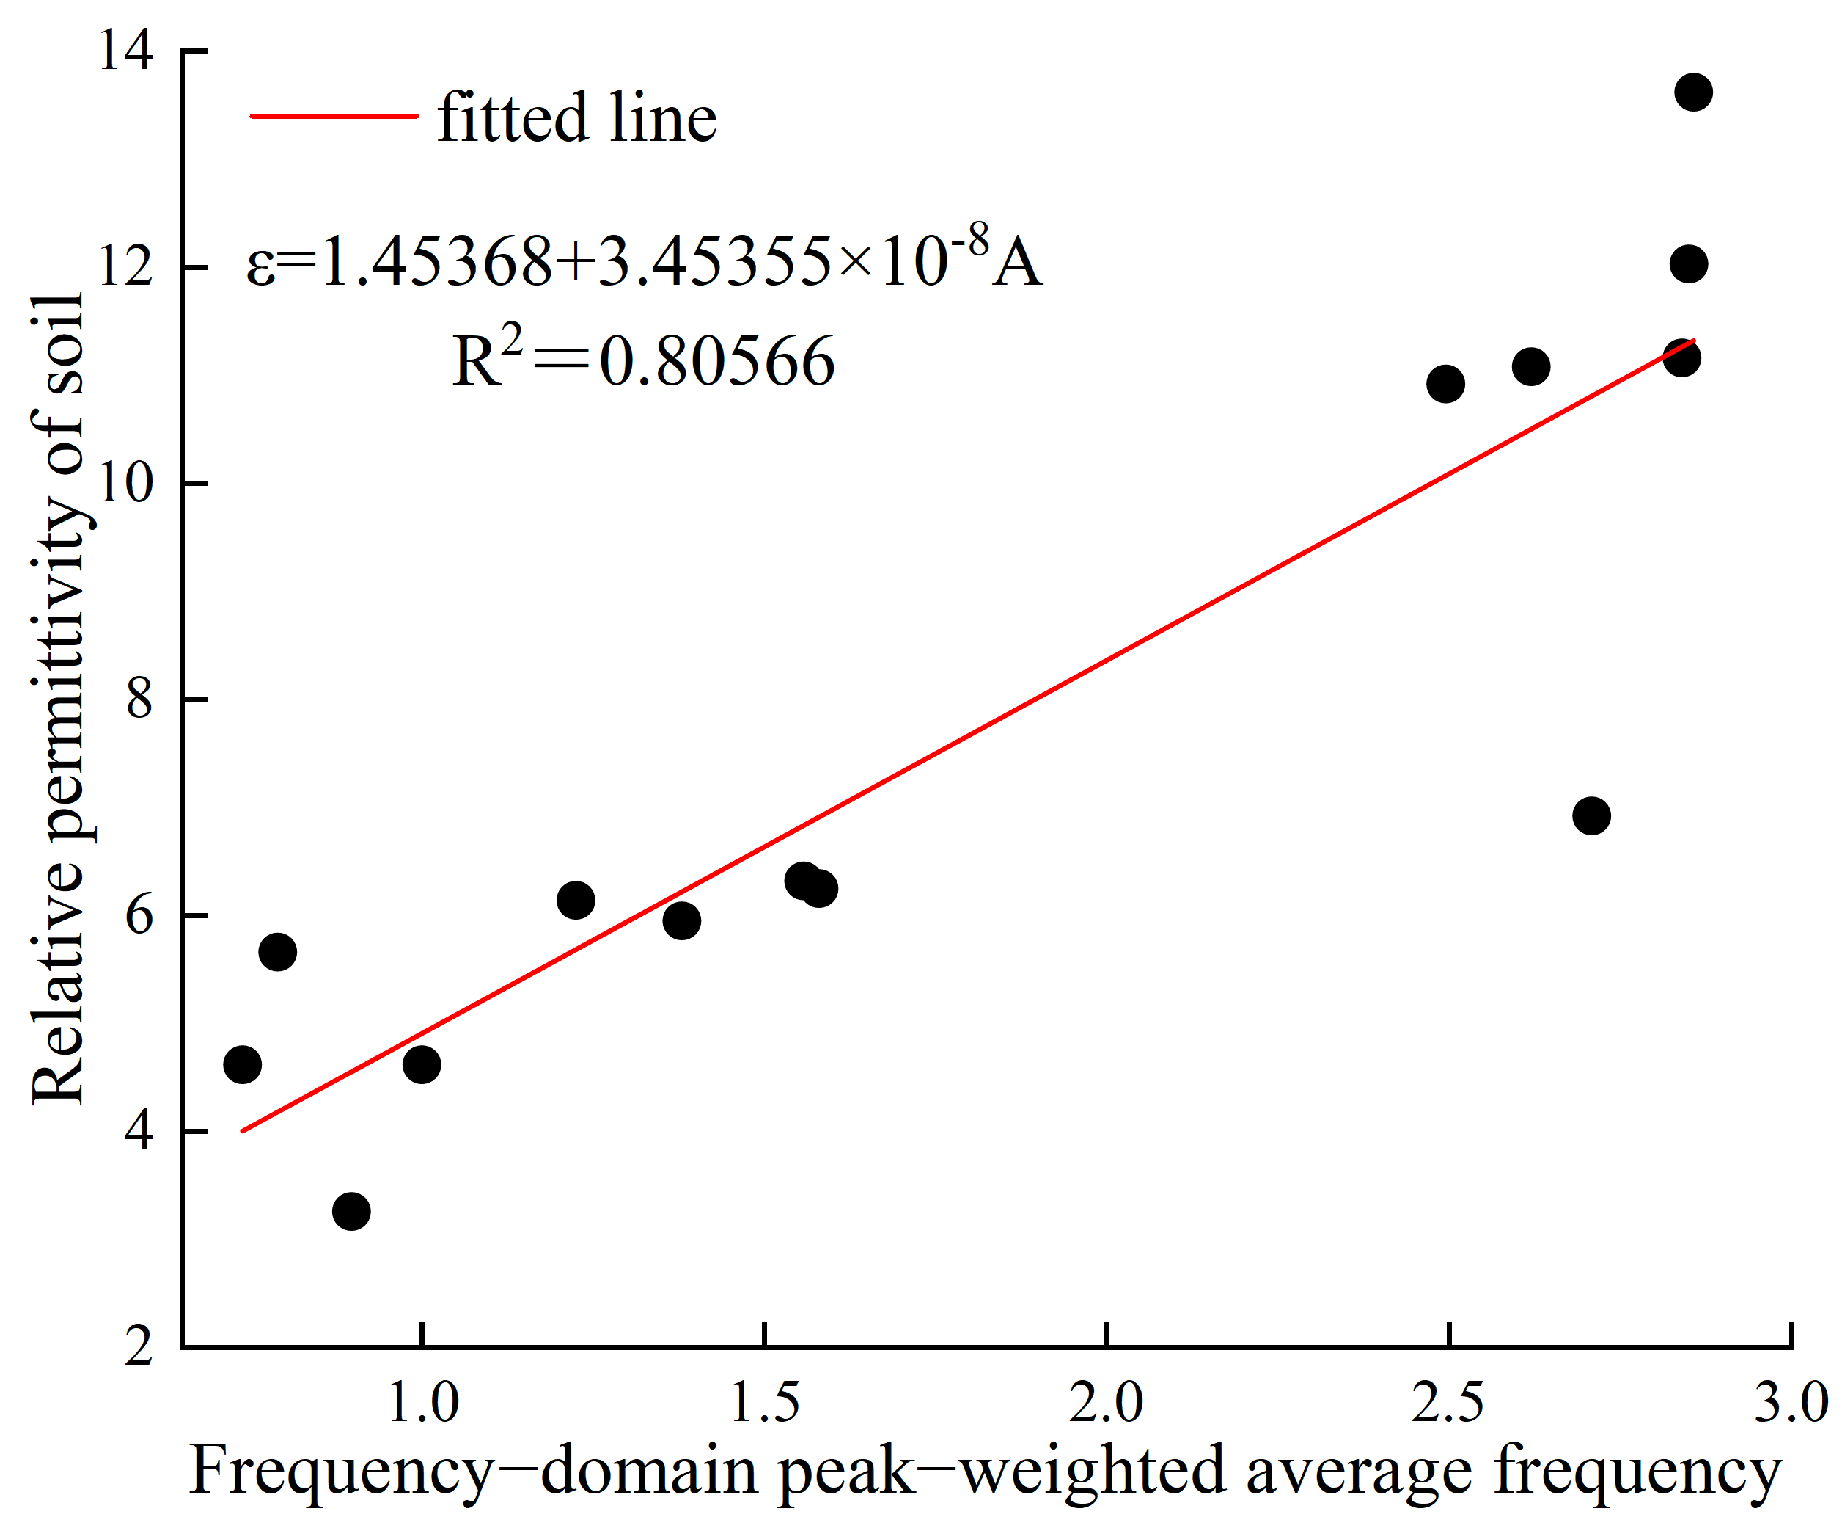
Soil profile identification was performed by field experts based on visual and tactile characteristics such as color, mechanical properties, texture, and bedding structures. Layer thicknesses were documented, and stratum-specific dielectric permittivity values were acquired using a portable instrument(Leupold & Stevens, Inc., Portland, OR, USA). During the data acquisition, direct signal calibration was carried out using the “Scope Mode” function to synchronize the initial signal fluctuation with the ground surface interface. By integrating GPR with a real-time DVL display screen, in situ documentation of multi-layered soil attributes was achieved at each sampling location. Using the relationship between soil dielectric permittivity and electromagnetic wave velocity, the short-time Fourier transform (STFT) method was applied to derive the peak-weighted average frequency in the frequency domain for each soil layer. A quantitative correlation between this frequency-based metric and the relative dielectric permittivity was built (Figure 3) (R2 ≈ 0.81), allowing for estimation of soil permittivity.
Figure 3.
The relationship between the frequency-domain peak-weighted average frequency and the relative dielectric constant of the soil.
Following data acquisition, the raw GPR signals underwent foundational preprocessing steps. DC offset was eliminated and background noise suppressed using adaptive thresholding. Gain compensation was applied to correct for signal attenuation, while bandpass filtering helped enhance subsurface reflections and reduce frequency-modulated interference. Time-zero correction was performed to align the initial wave arrival with the surface position, ensuring accurate propagation timing. The time domain of the soil layer interface was determined respectively through three different methods (the radar image waveform method, the Hilbert spectrum instantaneous phase method using Equations (1) and (2), and generalized S-transform time–frequency analysis using Equation (3)), and finally the thickness of each sedimentary layer was estimated.
3. Results
3.1. Radar Facies Analysis
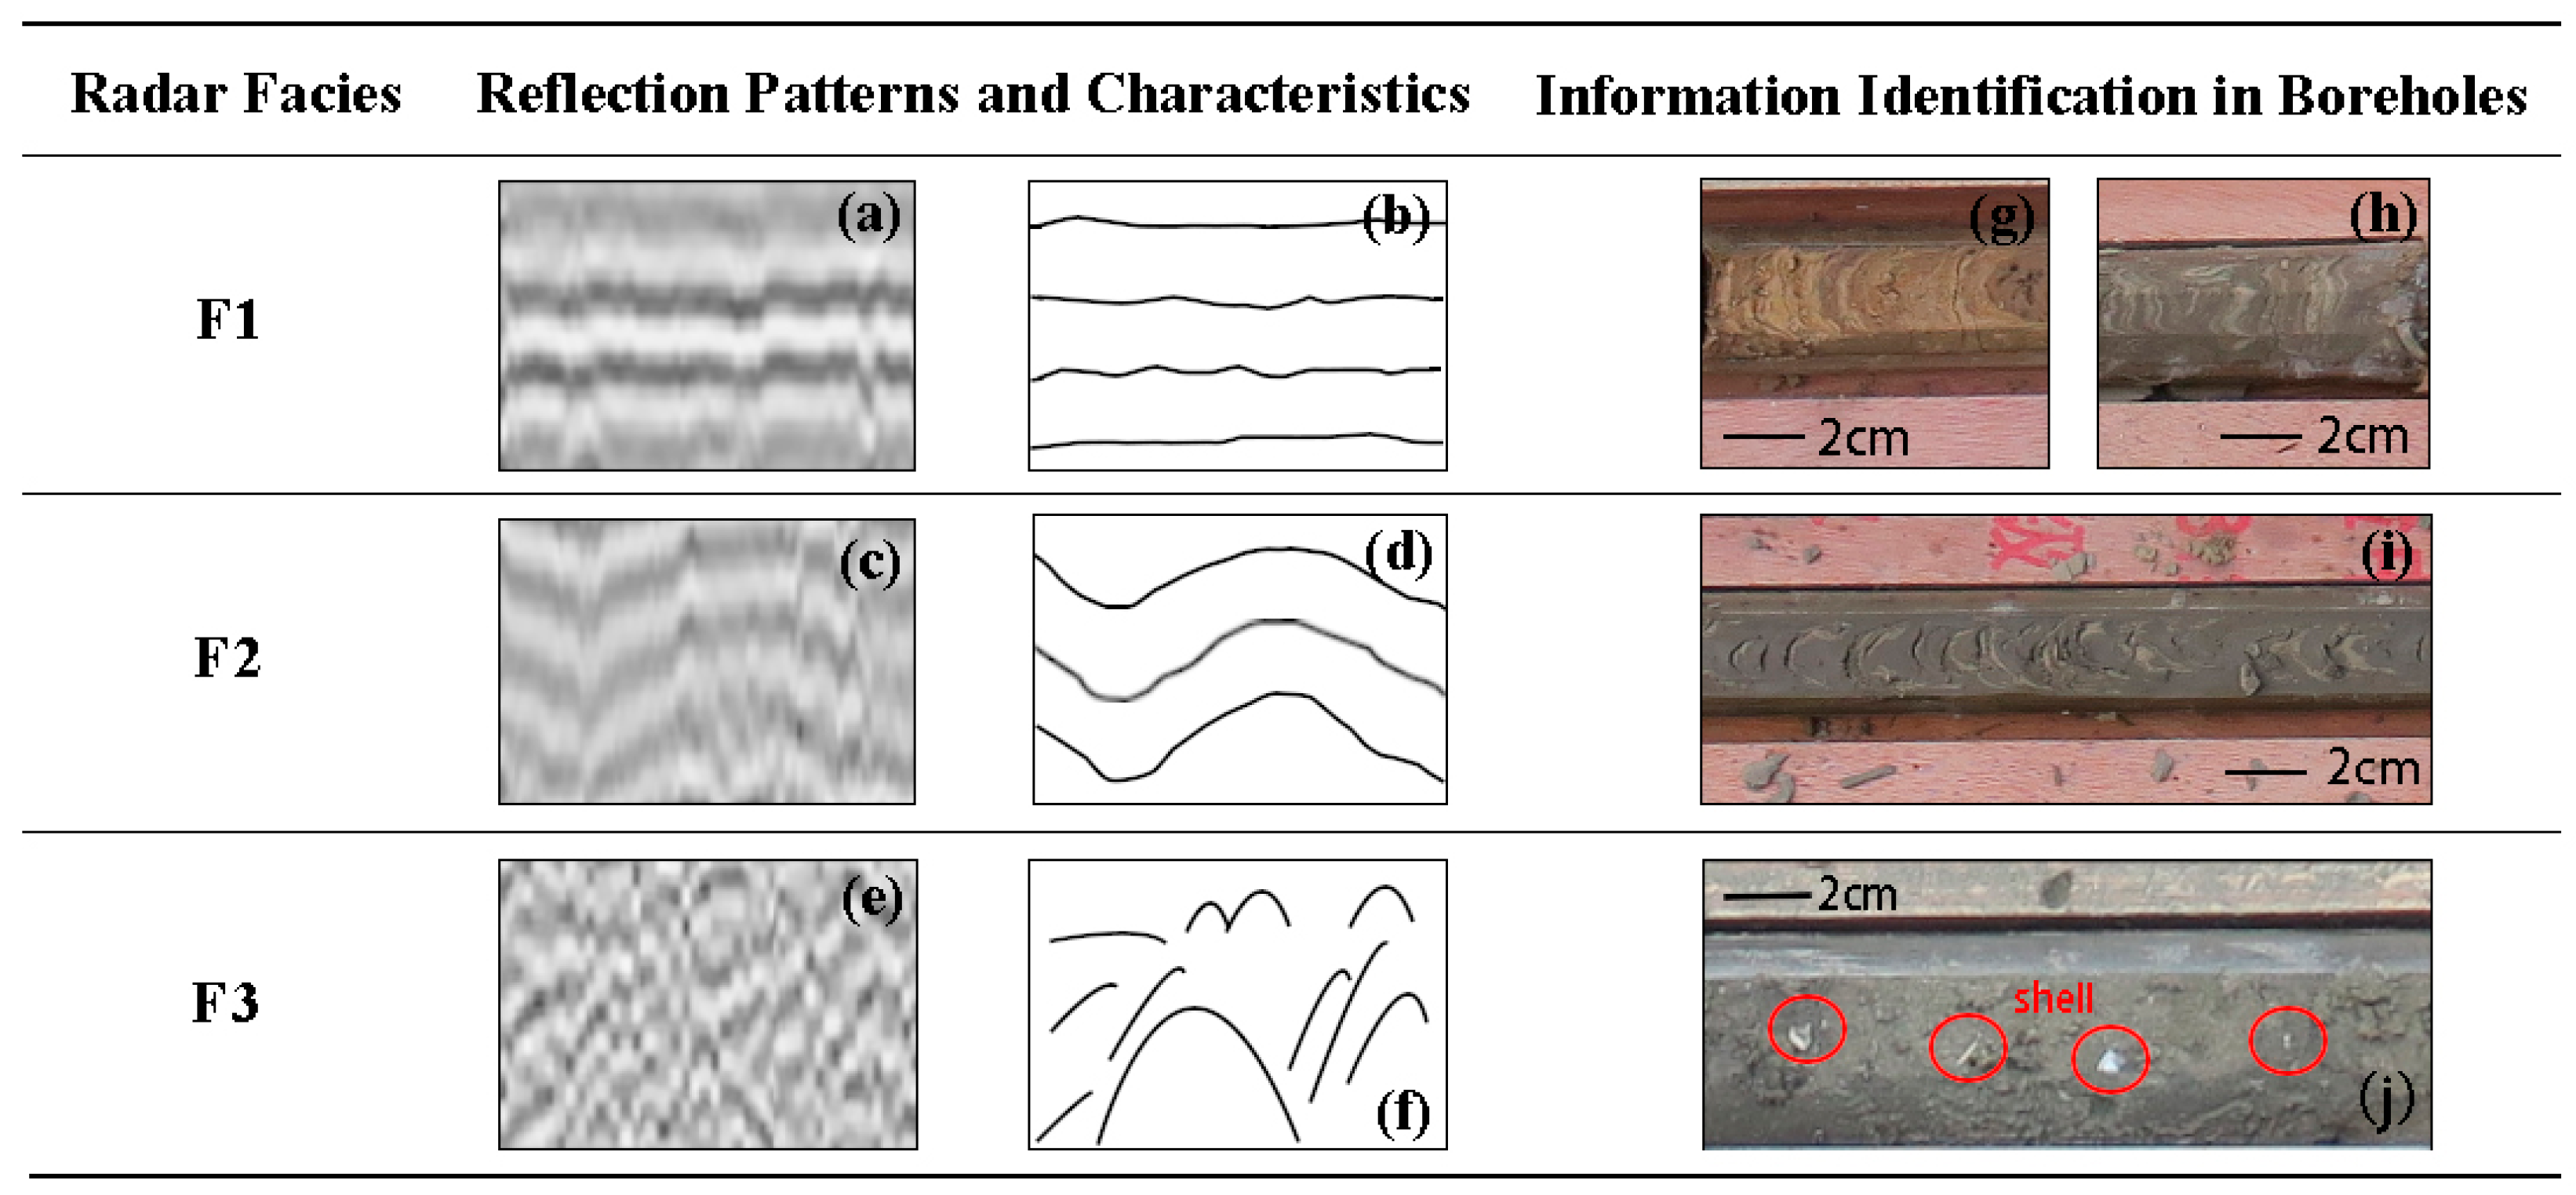
In GPR profiles, radar reflections convey information about bedding types and internal structures through their geometry and spatial distribution, often expressed as distinctive assemblages of reflections that vary in shape, amplitude, continuity, and dip []. Based on these reflective patterns and morphological traits, three radar facies types (F1–F3) have been distinguished within the studied profiles, described as follows.
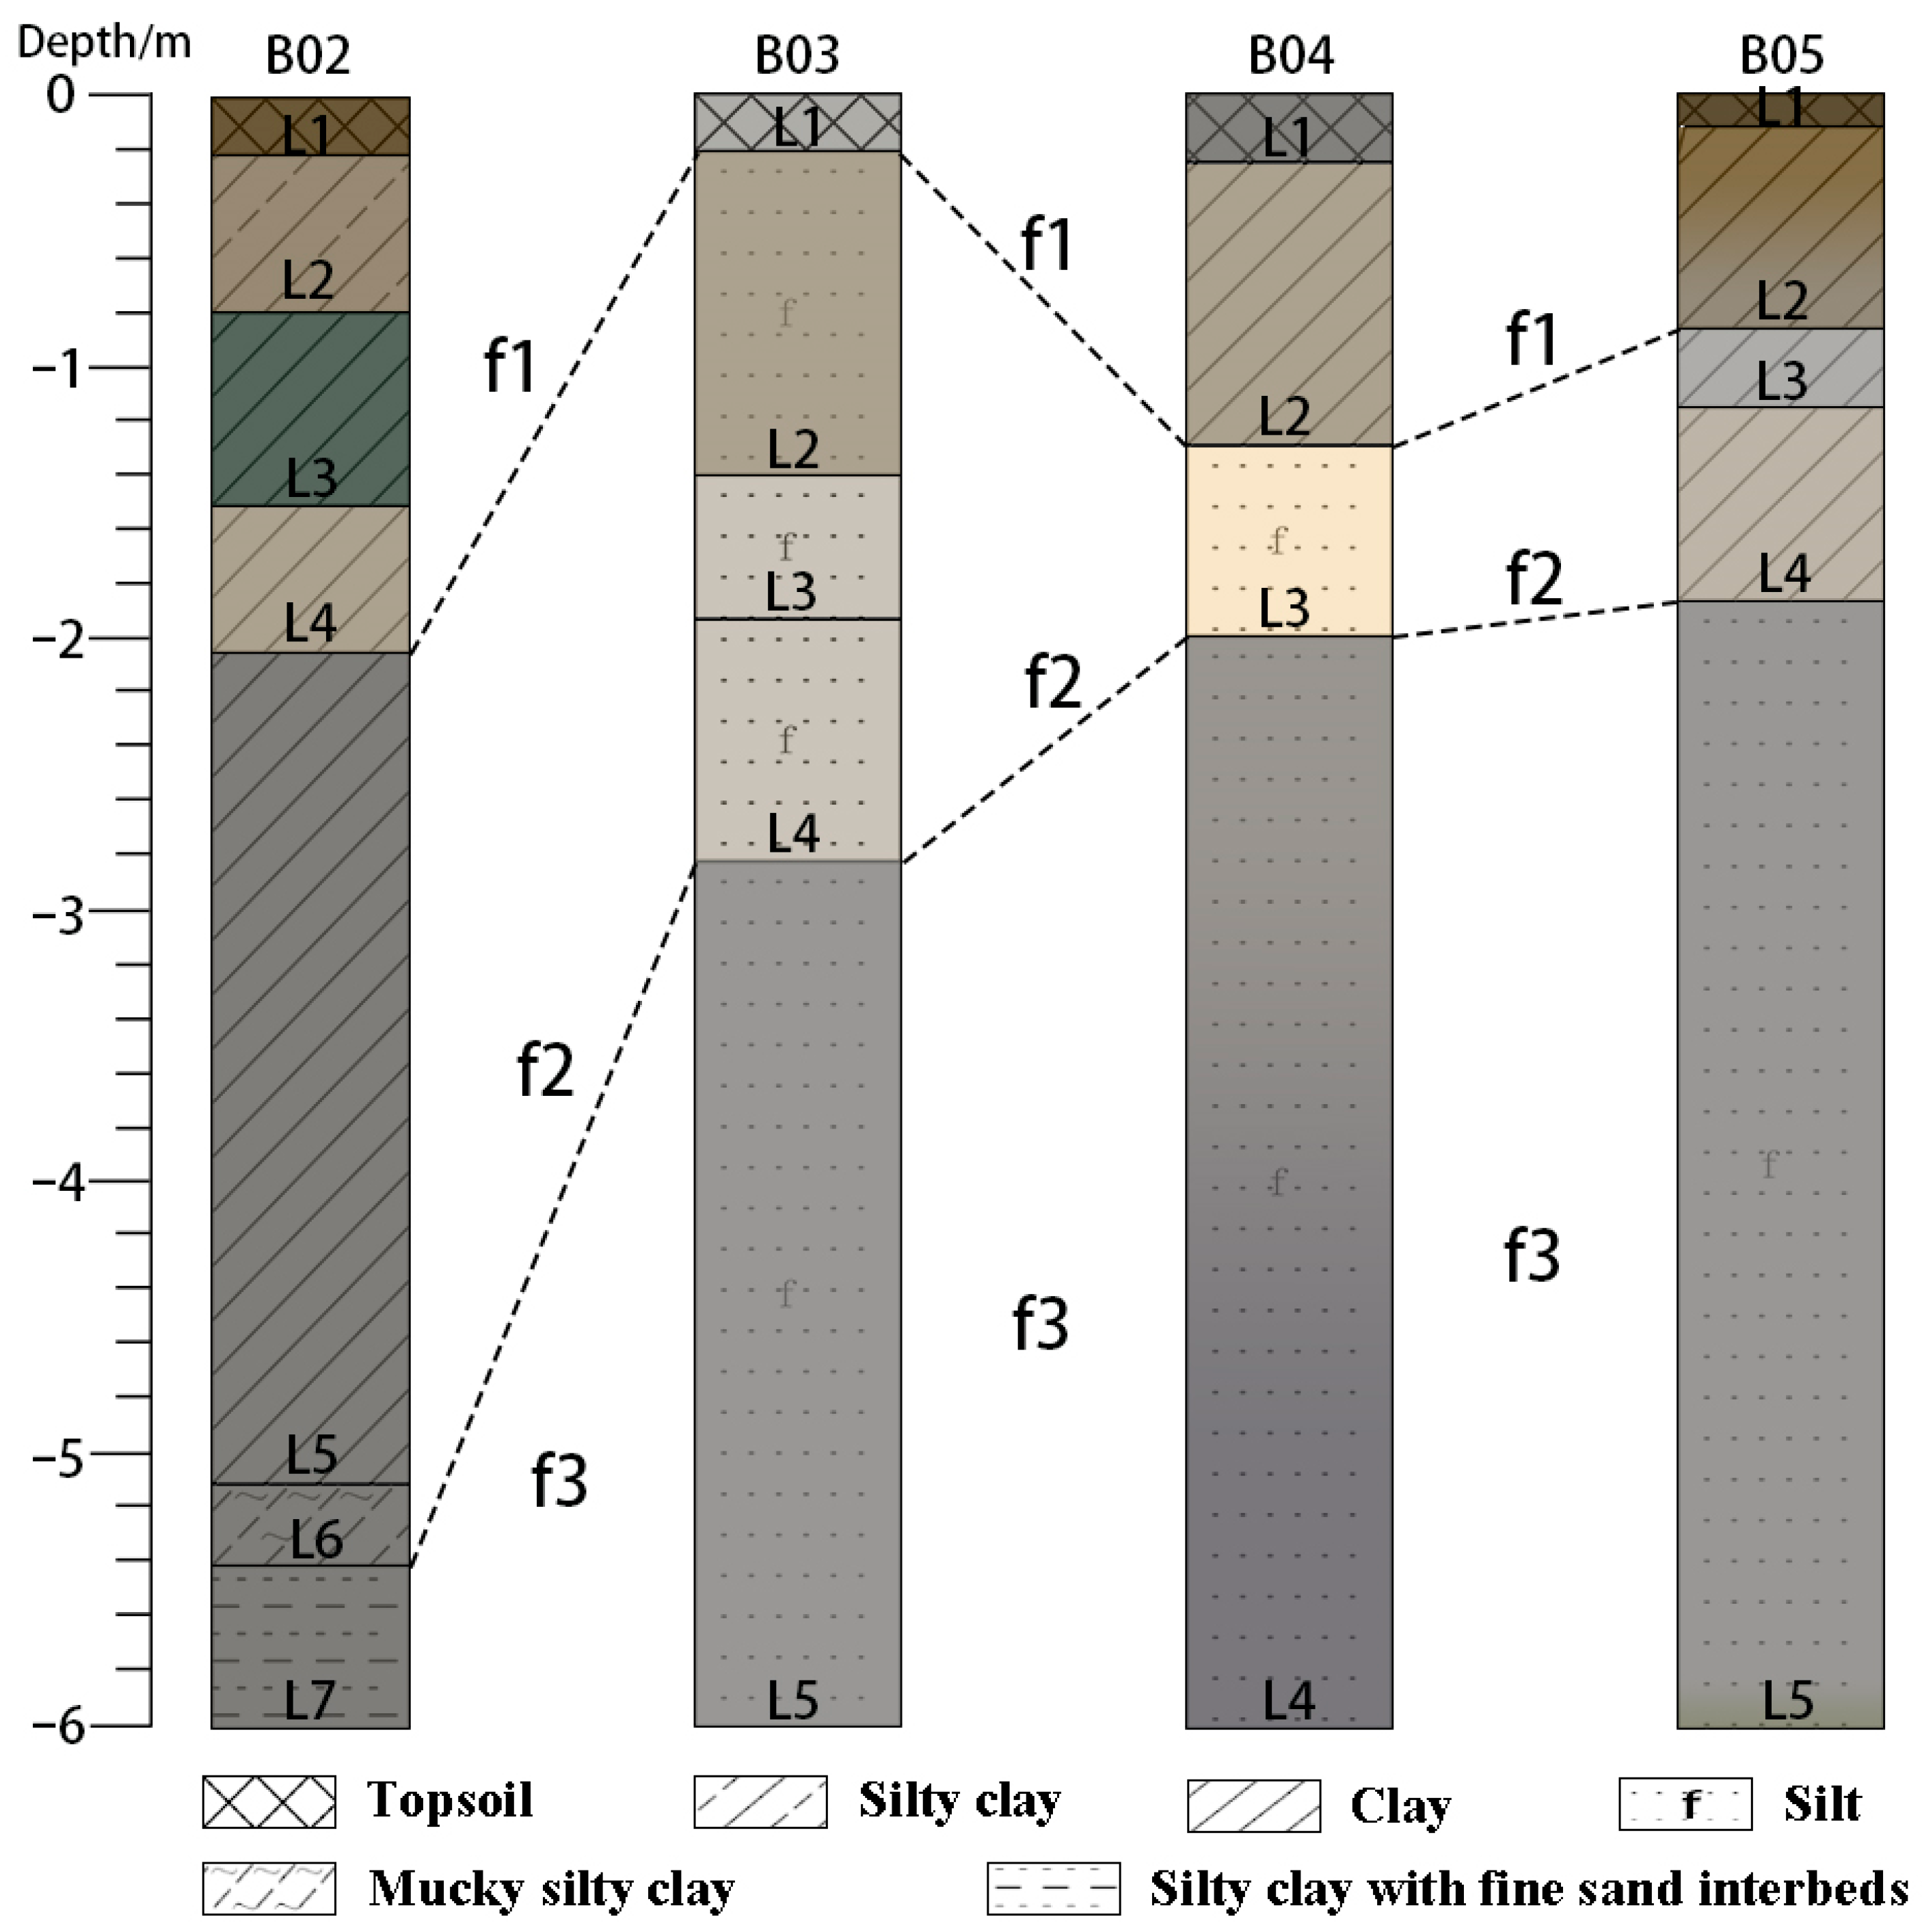
F1—Continuous horizontal or sub-horizontal reflections (Figure 4a,b). This configuration is typically associated with still-water or low-energy depositional settings, where sedimentation occurs gradually, forming vertically persistent layers. It reflects the development of horizontal bedding and is widely identified across all surveyed profiles, mainly occurring between depths of 0 and 0.8 m (Figure 5). The facies displays high-amplitude, continuous, parallel reflections and corresponds to horizontally banded structures in borehole logs, with layer thicknesses ranging from 0.2 to 0.5 cm. Sediments are primarily composed of clay and silty clay, exhibiting colors from yellowish-gray to brown. Occasional local sub-parallel reflections suggest minor dip variations, possibly linked to intermittent changes in sediment input.
Figure 4.
Correspondence between radar reflection patterns and borehole structure. (a,c,e) display selected radar facies from the GPR profile, with (b,d,f) showing the corresponding interpreted GPR line-drawings, respectively. The correlative soil information from boreholes is presented in (g–j).
Figure 5.
Stratigraphic profiles of soil layers in boreholes across sampling sites (stratification is carried out based on the visual and tactile characteristics of the soil such as color, mechanical properties, texture, and layering structure).
F2—Continuous sinuous or approximately wavy reflections (Figure 4c,d). This reflective configuration suggests the development of wavy bedding, often linked to cyclic changes in flow energy or variable sediment input. Channel migration or subtle topographic variations across riverbeds may further influence these depositional patterns. Observed in most profiles across the study area, it primarily occurs at 1–2 m depth (Figure 5). This facies displays moderately strong to high amplitudes, with reflections that are continuous and undulating, and whose waveforms remain largely parallel. In borehole cores, it correlates with wavy bedding, where sediments form chevron-shaped overlapping structures. These are primarily composed of clay and silt, interspersed with thin sandy interbeds, and exhibit colors ranging from grayish-yellow to gray (Figure 4i). Complex interbedding with other radar facies (e.g., the laterally continuous horizontal reflections of F1) further indicates superposition of multiple depositional events.
F3—Irregular and discontinuous reflection (Figure 4e,f). This facies is characterized by two distinct reflection types: (1) upward-convex hyperbolic echoes and (2) short, superimposed undulating reflection. These chaotic patterns are indicative of rapid depositional processes involving poorly sorted sediments, typically associated with high-energy sedimentary events. The hyperbolic reflections are likely caused by variations in grain size or scattering from intrusive bodies. The undulating reflections exhibit discontinuities, opposing dip angles (30°~60°), that define cross-bedding structures. Characterized by medium-amplitude, discontinuous chaotic reflections, this facies correlates with silty sediments containing minimal clay content, elevated moisture levels, and shell fragment inclusions in borehole cores, with predominantly gray hues (Figure 4j), exhibiting extremely poor sorting. It predominantly occurs below 2 m depth (Figure 5).
3.2. Radar Image Waveform Method for Sediment Thickness Delineation
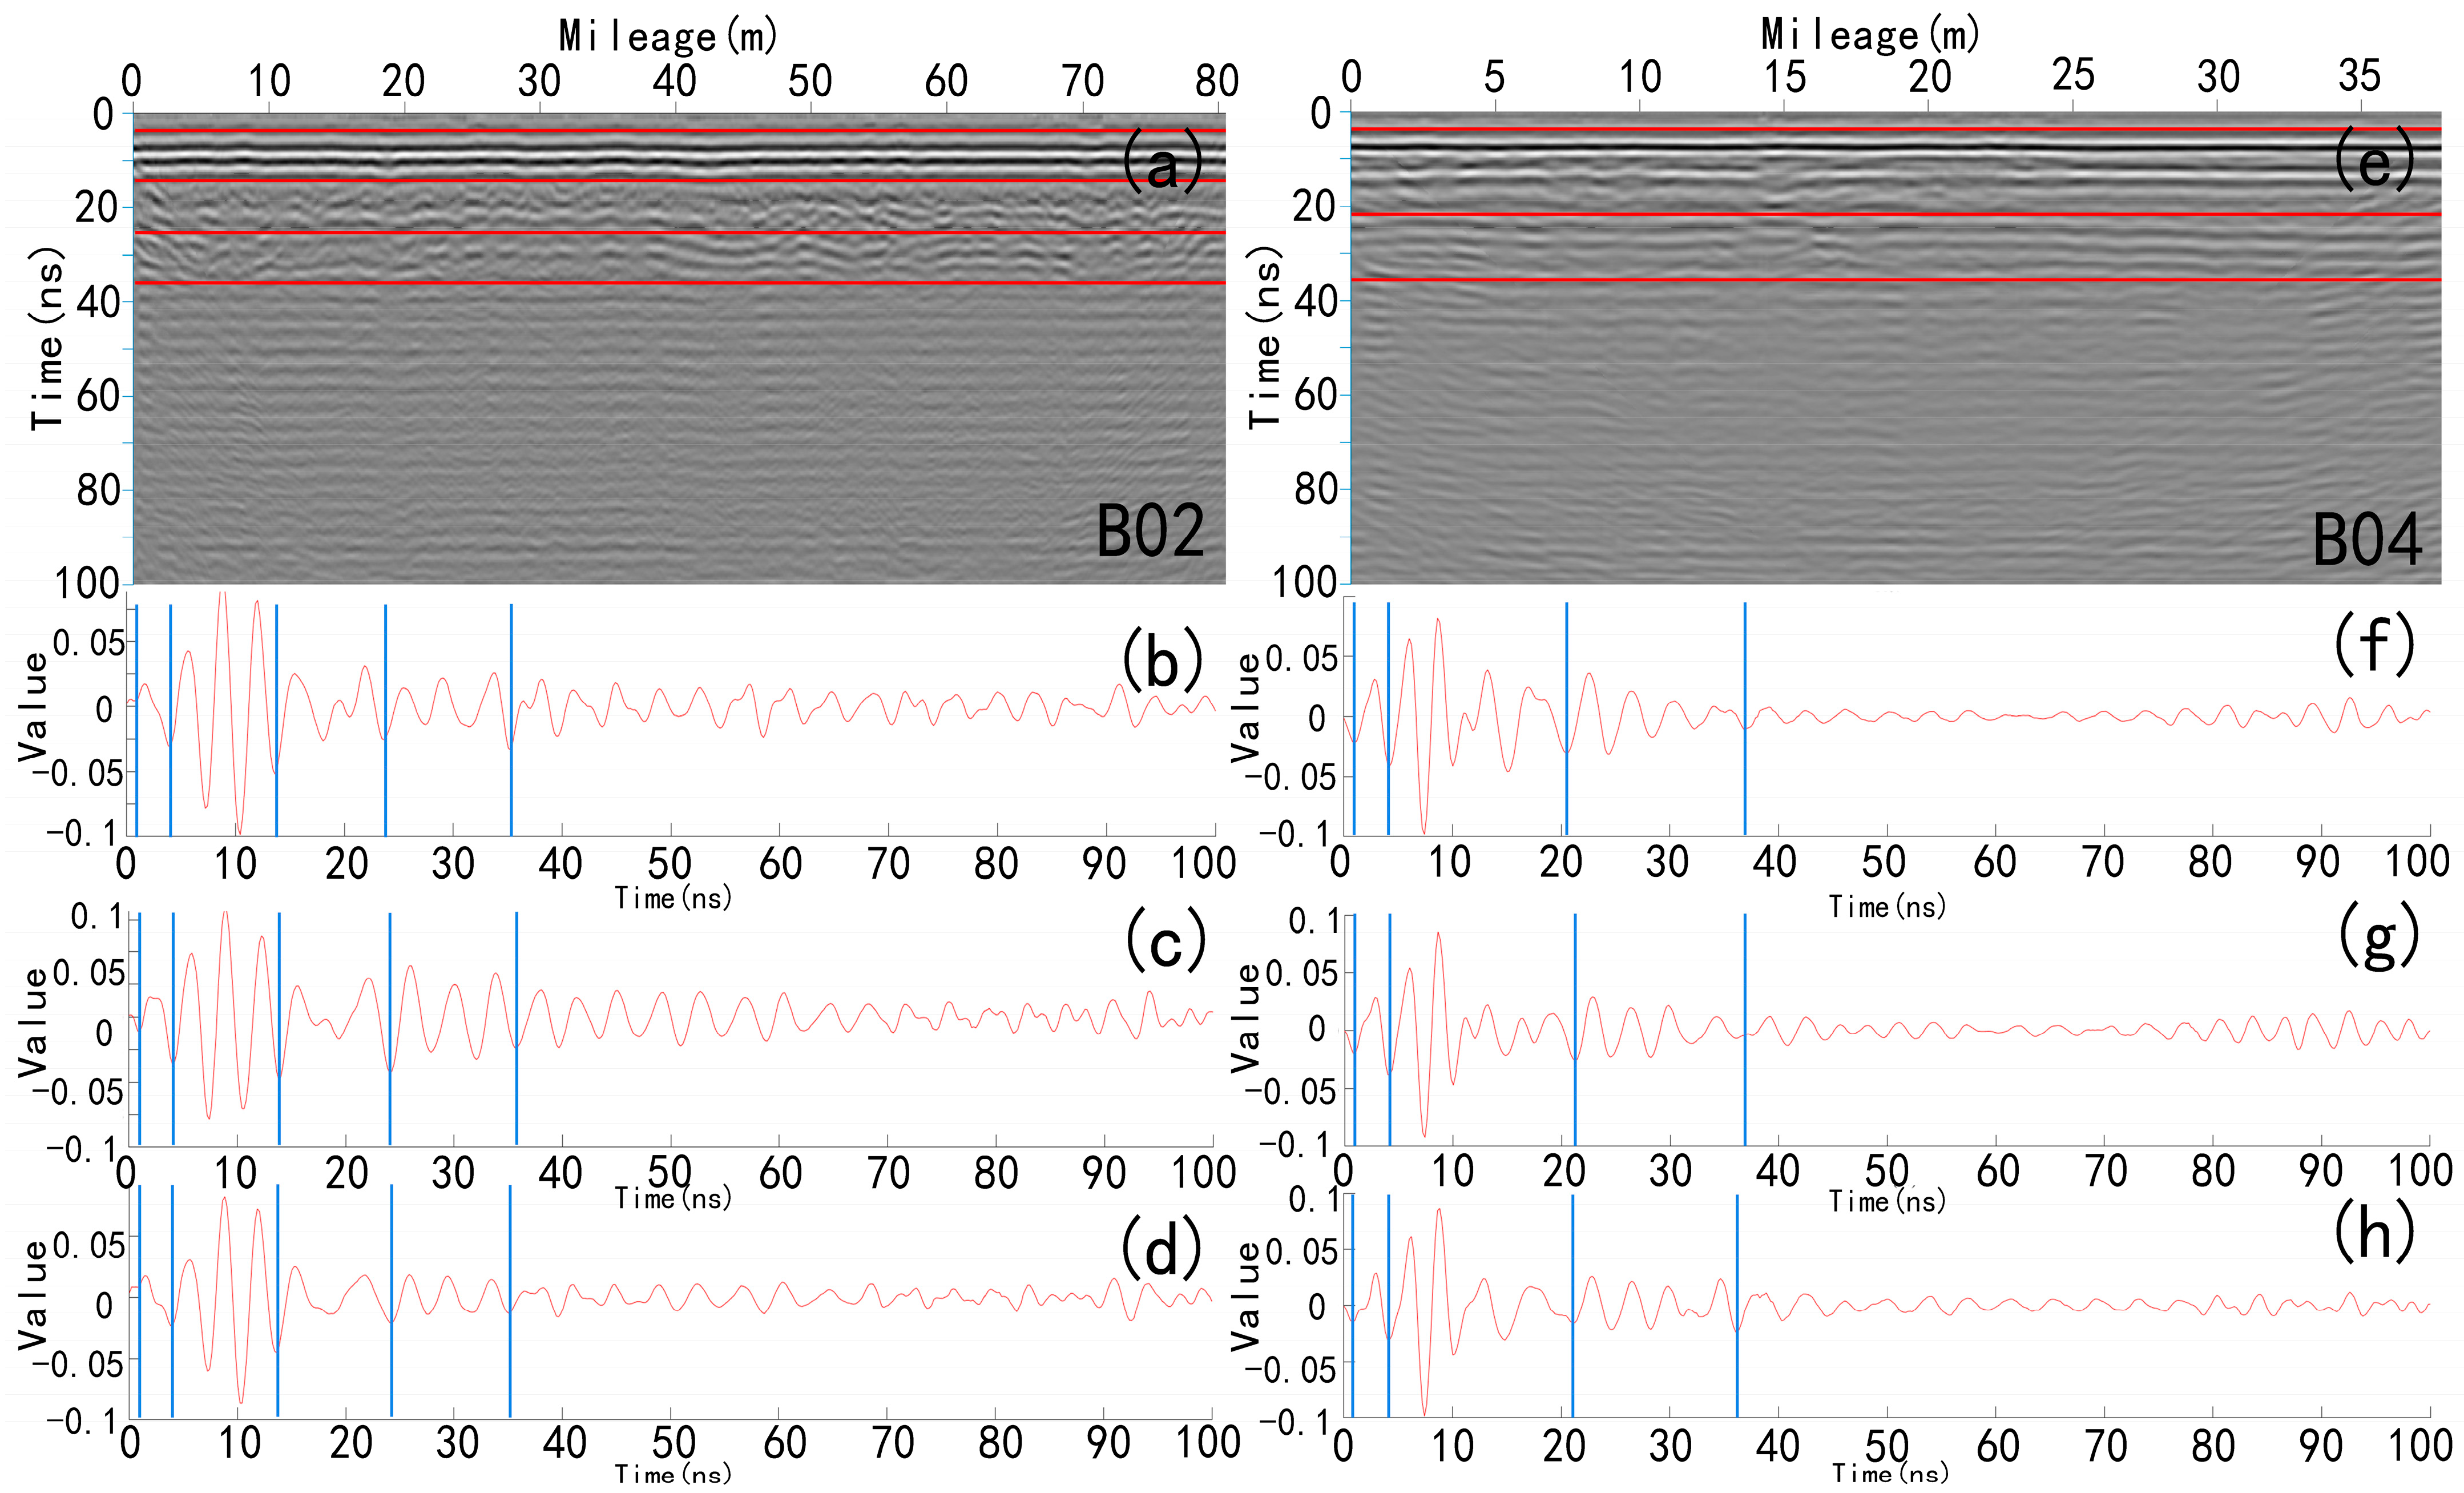
Accurate time-zero calibration is essential for reliable sedimentary thickness identification prior to detailed data interpretation. As shown in the waveform panels (Figure 6b–d,f–h), using the “Scope Mode” function calibrating the signal, the first signal deviations were recorded at 0.82 ns for site B02 and 1.00 ns for site B04, which are represented by the position of the first blue line from the left in each subpanel, establishing these time points as temporal references for all subsequent measurements. To capture spatial variability in soil architectures, the acquired GPR data were preprocessed, including filtering and gain adjustment, within the EKKO Project software. Both time-profile imagery (B-scans) and single-trace waveforms (A-scans) were generated at key positions along each survey line (approximately 1/4, 1/2, and 3/4 of the total length), enabling detailed analysis of the subsurface features. Methodologically validated in Section 2.3.1, representative GPR images from sites B02 and B04 are presented (Figure 6). These include radar time profiles (Figure 6a,e) and corresponding single-trace waveforms (Figure 6b–d,f–h). The single-trace waveforms elucidate morphological and amplitude characteristics of radar signals at specific transects, while time profiles constitute two-dimensional grayscale images formed by aligning sequential waveforms along survey lines. Pixel intensity in these images correlates directly with the reflection amplitude magnitude, where dark hues indicate stronger reflections due to higher electromagnetic impedance contrasts at the layer interfaces.
Figure 6.
Sedimentary thickness delineation results based on radar image waveform. (a) Radar time profile at site B02; (b–d) transect positions at 20 m, 40 m, and 60 m of B02 survey line; (e) radar time profile at site B04; (f–h) transect positions at 9.5 m, 19 m, and 28.5 m of B04 survey line. Red lines in (a,e) denote identified time-domain interfaces of soil layers; blue lines in (b–d,f–h) indicate layer boundaries at specified transects.
At approximately 4.01 ns depth in the B02 and B04 time profiles, corresponding single-trace waveforms exhibit significant amplitude variations with a positive phase reflection signature (i.e., an initial peak followed by a trough). This reflection is interpreted as the first soil layer interface, represented by the position of the second blue line from the left in each subpanel. Subsequently, within the 4.01~13.43 ns interval (B02) and 4.01–21.44 ns interval (B04), a continuous high-amplitude reflection zone (radar facies F1) is identified. This zone manifests as straight, dark regions in the time profiles (Figure 6a,e), indicating laterally continuous and planar soil layers. Corresponding single-trace waveforms (Figure 6b–d,f–h) display prominent peaks and troughs, delineating the second soil layer interface, which is represented by the third blue line in the figure. With increasing time (depth), the reflection signatures in radar time profiles undergo a transition: color intensity gradually diminishes, and reflections evolve into moderate-to-high-amplitude, continuous, approximately wavy patterns (radar facies F2) with reduced interfacial continuity, exhibiting sinuous discontinuities. For instance, in the B02 time profile (Figure 6a), inclined reflection interfaces observed at 10 m, 45 m, and 78 m mileage indicate transitional or significant alterations in soil properties (e.g., texture, moisture content) at these depths. Corresponding single-trace waveforms within the 13.43–35.07 ns range display pronounced amplitude fluctuations (Figure 6b–d), represented by the region between the third and fourth blue lines in the figure. Integrated field observations (Figure 5) and waveform analysis attribute this phenomenon to increased soil moisture content and gradual lithological transitions to gray clay, inducing dielectric permittivity contrasts.
Below approximately 35 ns depth in the time profiles (Figure 6a,e), which is the region after the first blue line when counting from the right in each subfigure, radar signals exhibit significant attenuation, with corresponding single-trace waveforms showing markedly reduced amplitudes (Figure 6b–d,f–h) and retaining only minor fluctuations. Although partial coherent reflections remain identifiable, their signal strength approaches the system noise floor, resulting in a substantially degraded signal-to-noise ratio. This introduces considerable uncertainty in objectively interpreting time-domain positions of deeper layer interfaces based on existing waveform data. However, integrated borehole core analysis (Figure 5) reveals that strata within this depth interval (>35 ns) primarily consist of gray silt with a fine-grained texture, containing trace clay content and shell fragment inclusions, corresponding to irregular, discontinuous chaotic reflections (radar facies F3). The high moisture content of the silt matrix and the dielectric contrast induced by shell fragments likely constitute the primary mechanisms for electromagnetic wave absorption and scattering, leading to the observed rapid signal attenuation in deeper strata. As shown in Table 1, the absolute errors between measured and radar-interpreted thicknesses range from 1 cm to 25 cm, with relative errors spanning 1.68% to 24.75%. Notably, with the exception of larger deviations in the L1 layer at sites B04 and B05 (Table 1), all other layers demonstrate a pronounced trend: thickness estimation errors increase progressively with greater soil depth. For instance, the deepest layer (L4) at site B02 exhibits a relative error of 24.75%.
Table 1.
Comparative analysis and error assessment of sedimentary thickness variation.
3.3. Hilbert Spectrum Instantaneous Phase Method for Sedimentary Thickness Delineation
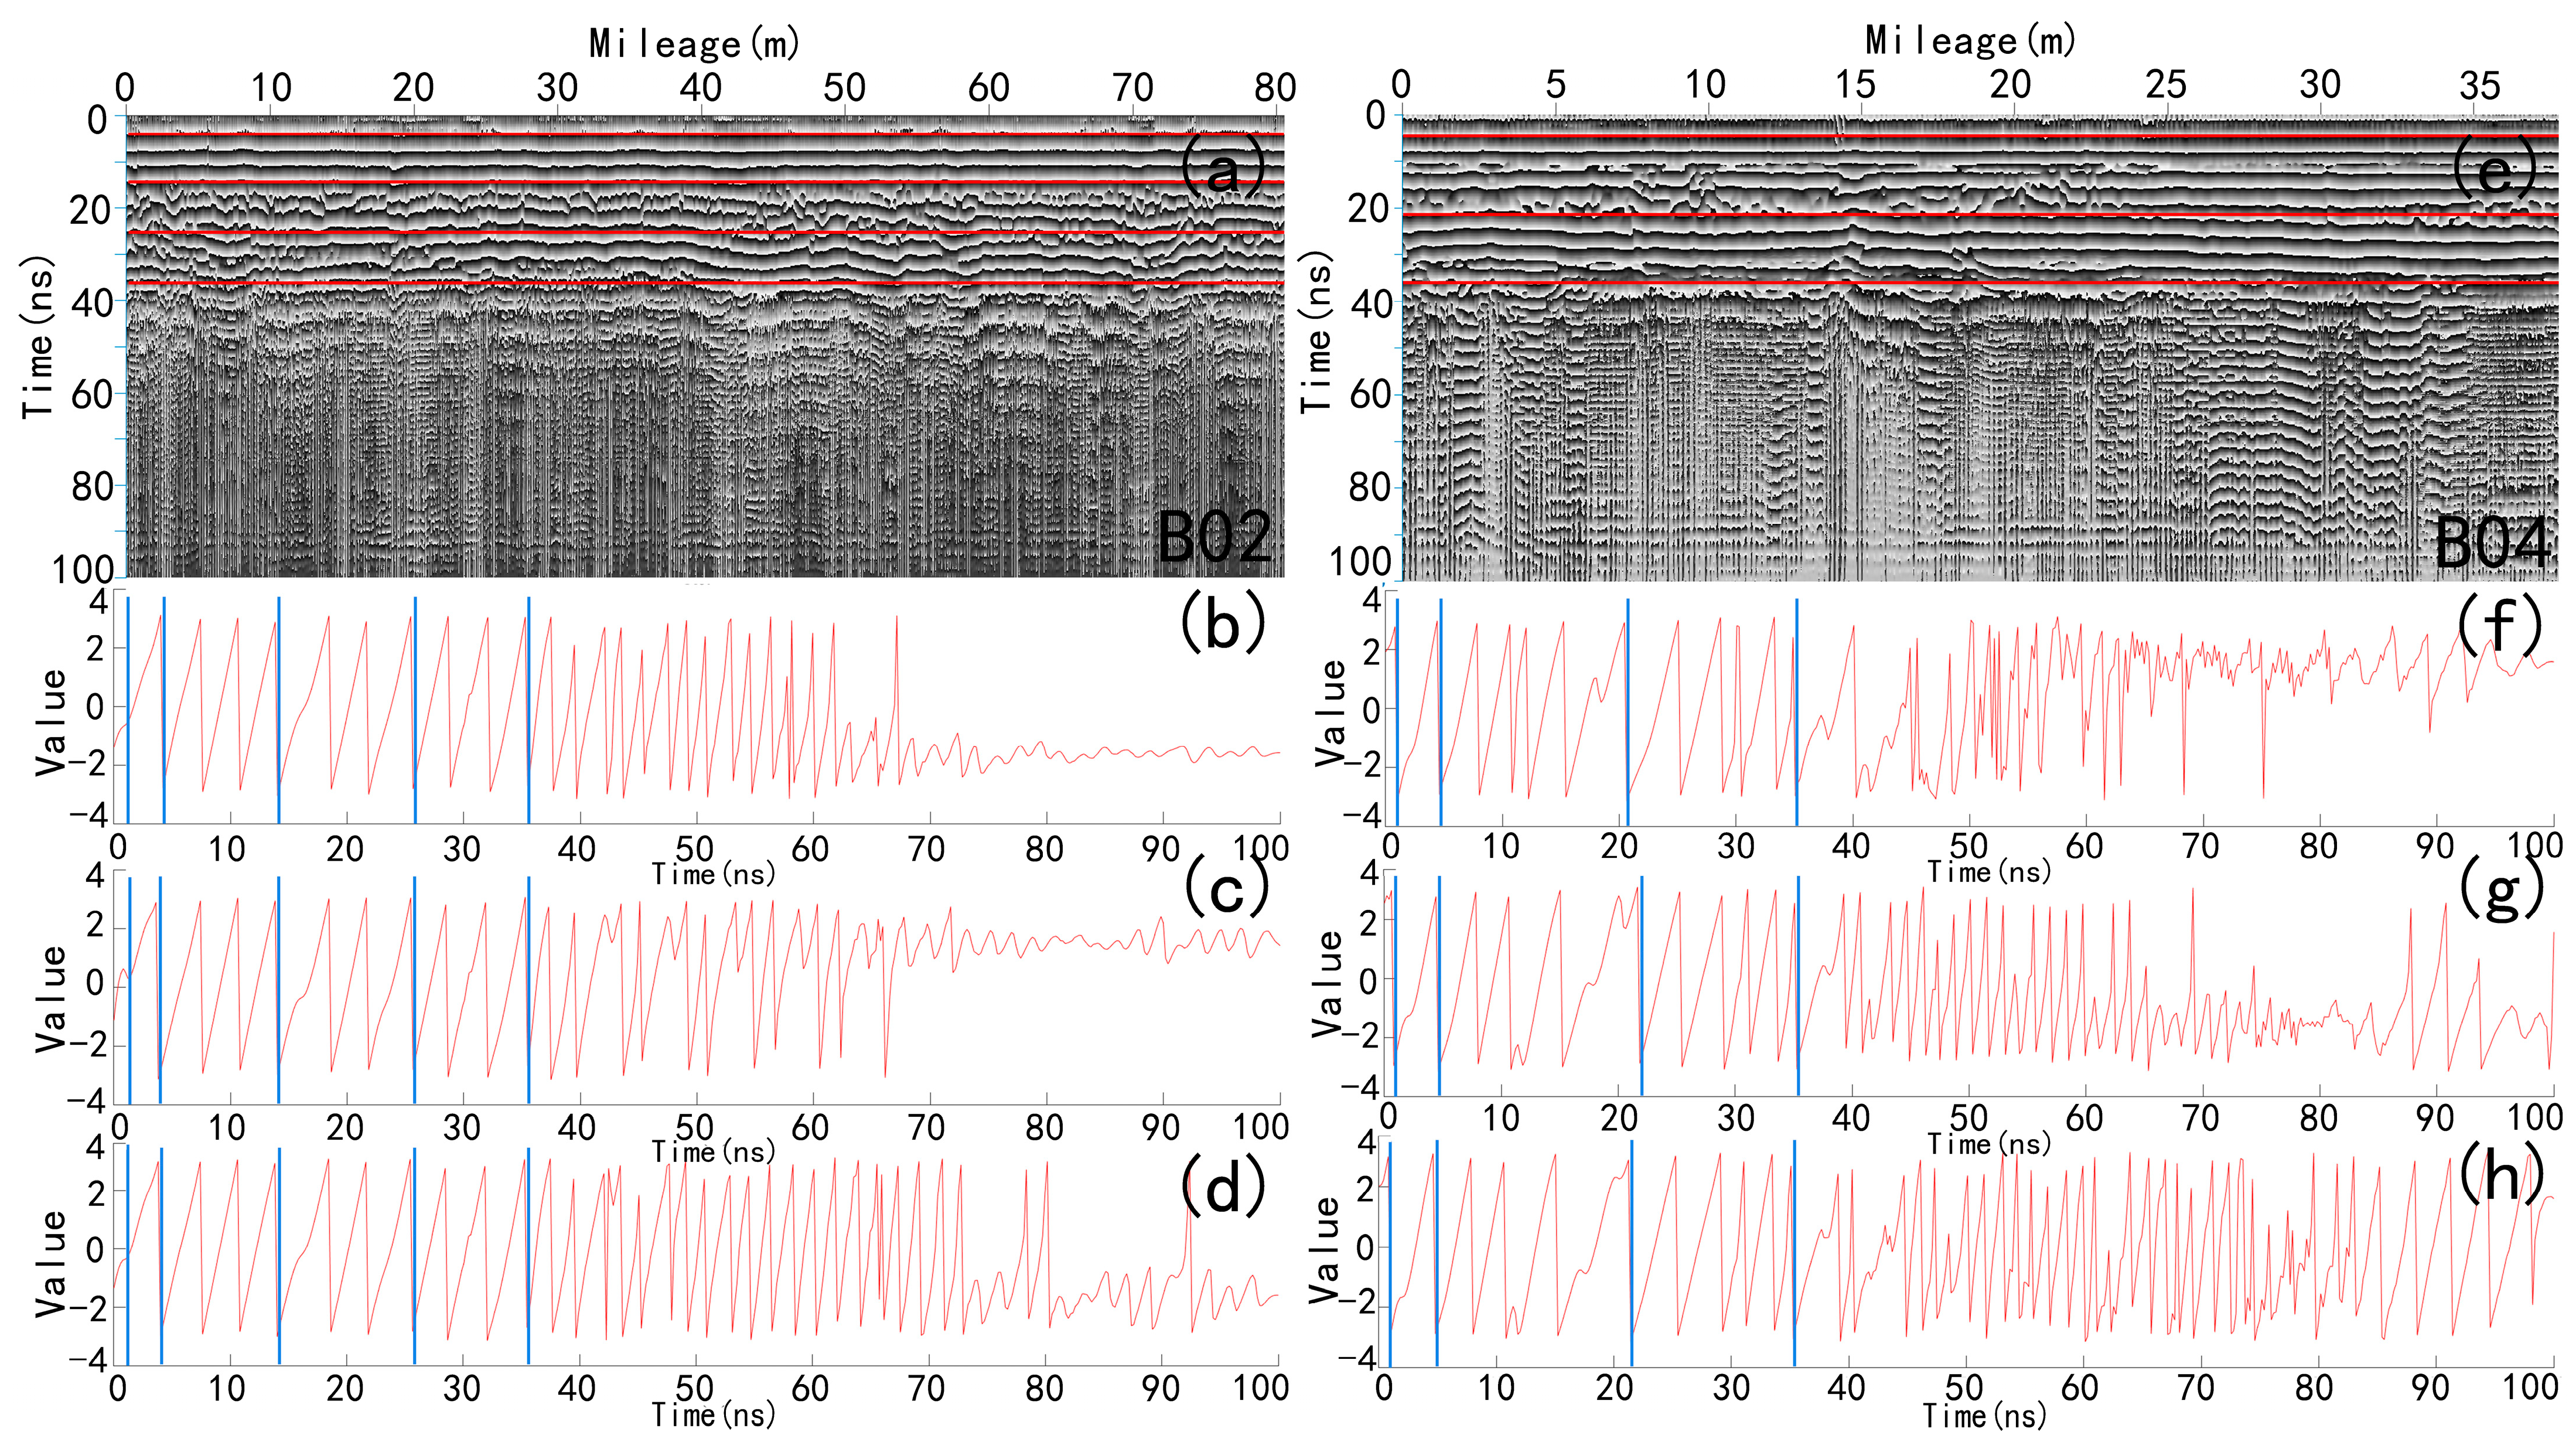
Following Hilbert transform processing, GPR signals exhibit enhanced contrast in weak reflections, revealing distinct phase discontinuities that reflect dielectric property contrasts between adjacent layers. This provides a physical basis for stratigraphic interface identification. To validate the efficacy of instantaneous phase information derived from the Hilbert transform in identifying time-domain positions of sedimentary layer interfaces (Section 2.3.2), multi-point analysis was conducted along survey lines. Taking sampling sites B02 and B04 as examples, single-trace waveforms were extracted at 1/4, 1/2, and 3/4 positions along each survey line (Figure 7b–d,f–h). Analysis reveals that instantaneous phase information derived from the Hilbert transform enables precise identification of ground interfaces, represented by the first blue line from the left in each subplot, with time-zero positions at 0.8 ns (B02) and 1.01 ns (B04), exhibiting high consistency with radar waveform imaging interpretations (Table 1). Based on phase discontinuity signatures and morphological variations in radar signals, sedimentary thickness identification was achieved. As shown in Table 1, the sediment thickness identification results derived from instantaneous phase analysis demonstrate high reliability, with the exclusion of site B03 due to data acquisition anomalies, yielding relative errors predominantly below 10% and absolute errors within 5 cm.
Figure 7.
Sedimentary thickness delineation results based on Hilbert spectrum instantaneous phase method. (a) Instantaneous phase profile at site B02; (b–d) transect positions at 20 m, 40 m, and 60 m along B02 survey line; (e) instantaneous phase profile at site B04; (f–h) transect positions at 9.5 m, 19 m, and 28.5 m along B04 survey line. Red lines in (a,e) denote time-domain interfaces of soil stratification; blue lines in (b–d,f–h) indicate layer boundaries at specified transects.
The results demonstrate the overall efficacy of this method for sedimentary thickness identification, exhibiting practical utility in field applications. However, data analysis reveals a critical limitation: the positioning accuracy of soil layer interfaces systematically decreases with increasing depth. Notably, signal distortion occurs below approximately 35 ns in instantaneous phase profiles (Figure 7a,e), a depth that corresponds to the position after the first blue line on the right in each subplot, and this distortion prevents precise phase identification. At these depths, radar facies are characterized by irregular, discontinuous chaotic reflections (radar facies F3). Corresponding single-trace waveforms (Figure 7b–d,f–h) show high-frequency, short-duration phase jumps with random variability that cannot be stably correlated with reflection signatures in profile images. Beyond 70 ns, signal randomness intensifies significantly, generating false alarms that increase misinterpretation risks of soil layer boundaries. Significant measurement errors at site B03 may be attributed to forest understory effects: A thick leaf litter layer and humus-rich soil induced strong scattering attenuation of electromagnetic waves in shallow subsurface layers. Concurrently, numerous excavated ditches created pronounced topographic undulations, causing mechanical vibrations during antenna movement that disrupted radiation pattern directivity and reception sensitivity. This interference substantially degraded signal transmission efficiency and echo signal-to-noise ratio.
3.4. Generalized S-Transform Time–Frequency Analysis Method for Sediment Thickness Delineation
As outlined in Section 2.3.3, the generalized S-transform offers marked improvements in both the accuracy and efficiency of GPR for detecting variations in sedimentary layer thickness. Its adaptive time–frequency resolution and enhanced noise resistance allow more reliable identification of thin interbeds and heterogeneous soil structures. These advantages are supported by two main mechanisms: (1) the time–frequency representation provides a clear visualization of signal energy distribution and attenuation trends over time (and thus with depth); (2) the synchro-squeezing step sharpens instantaneous frequency localization, helping pinpoint layer interfaces based on energy discontinuities and thus improving the overall robustness of stratigraphic interpretation.
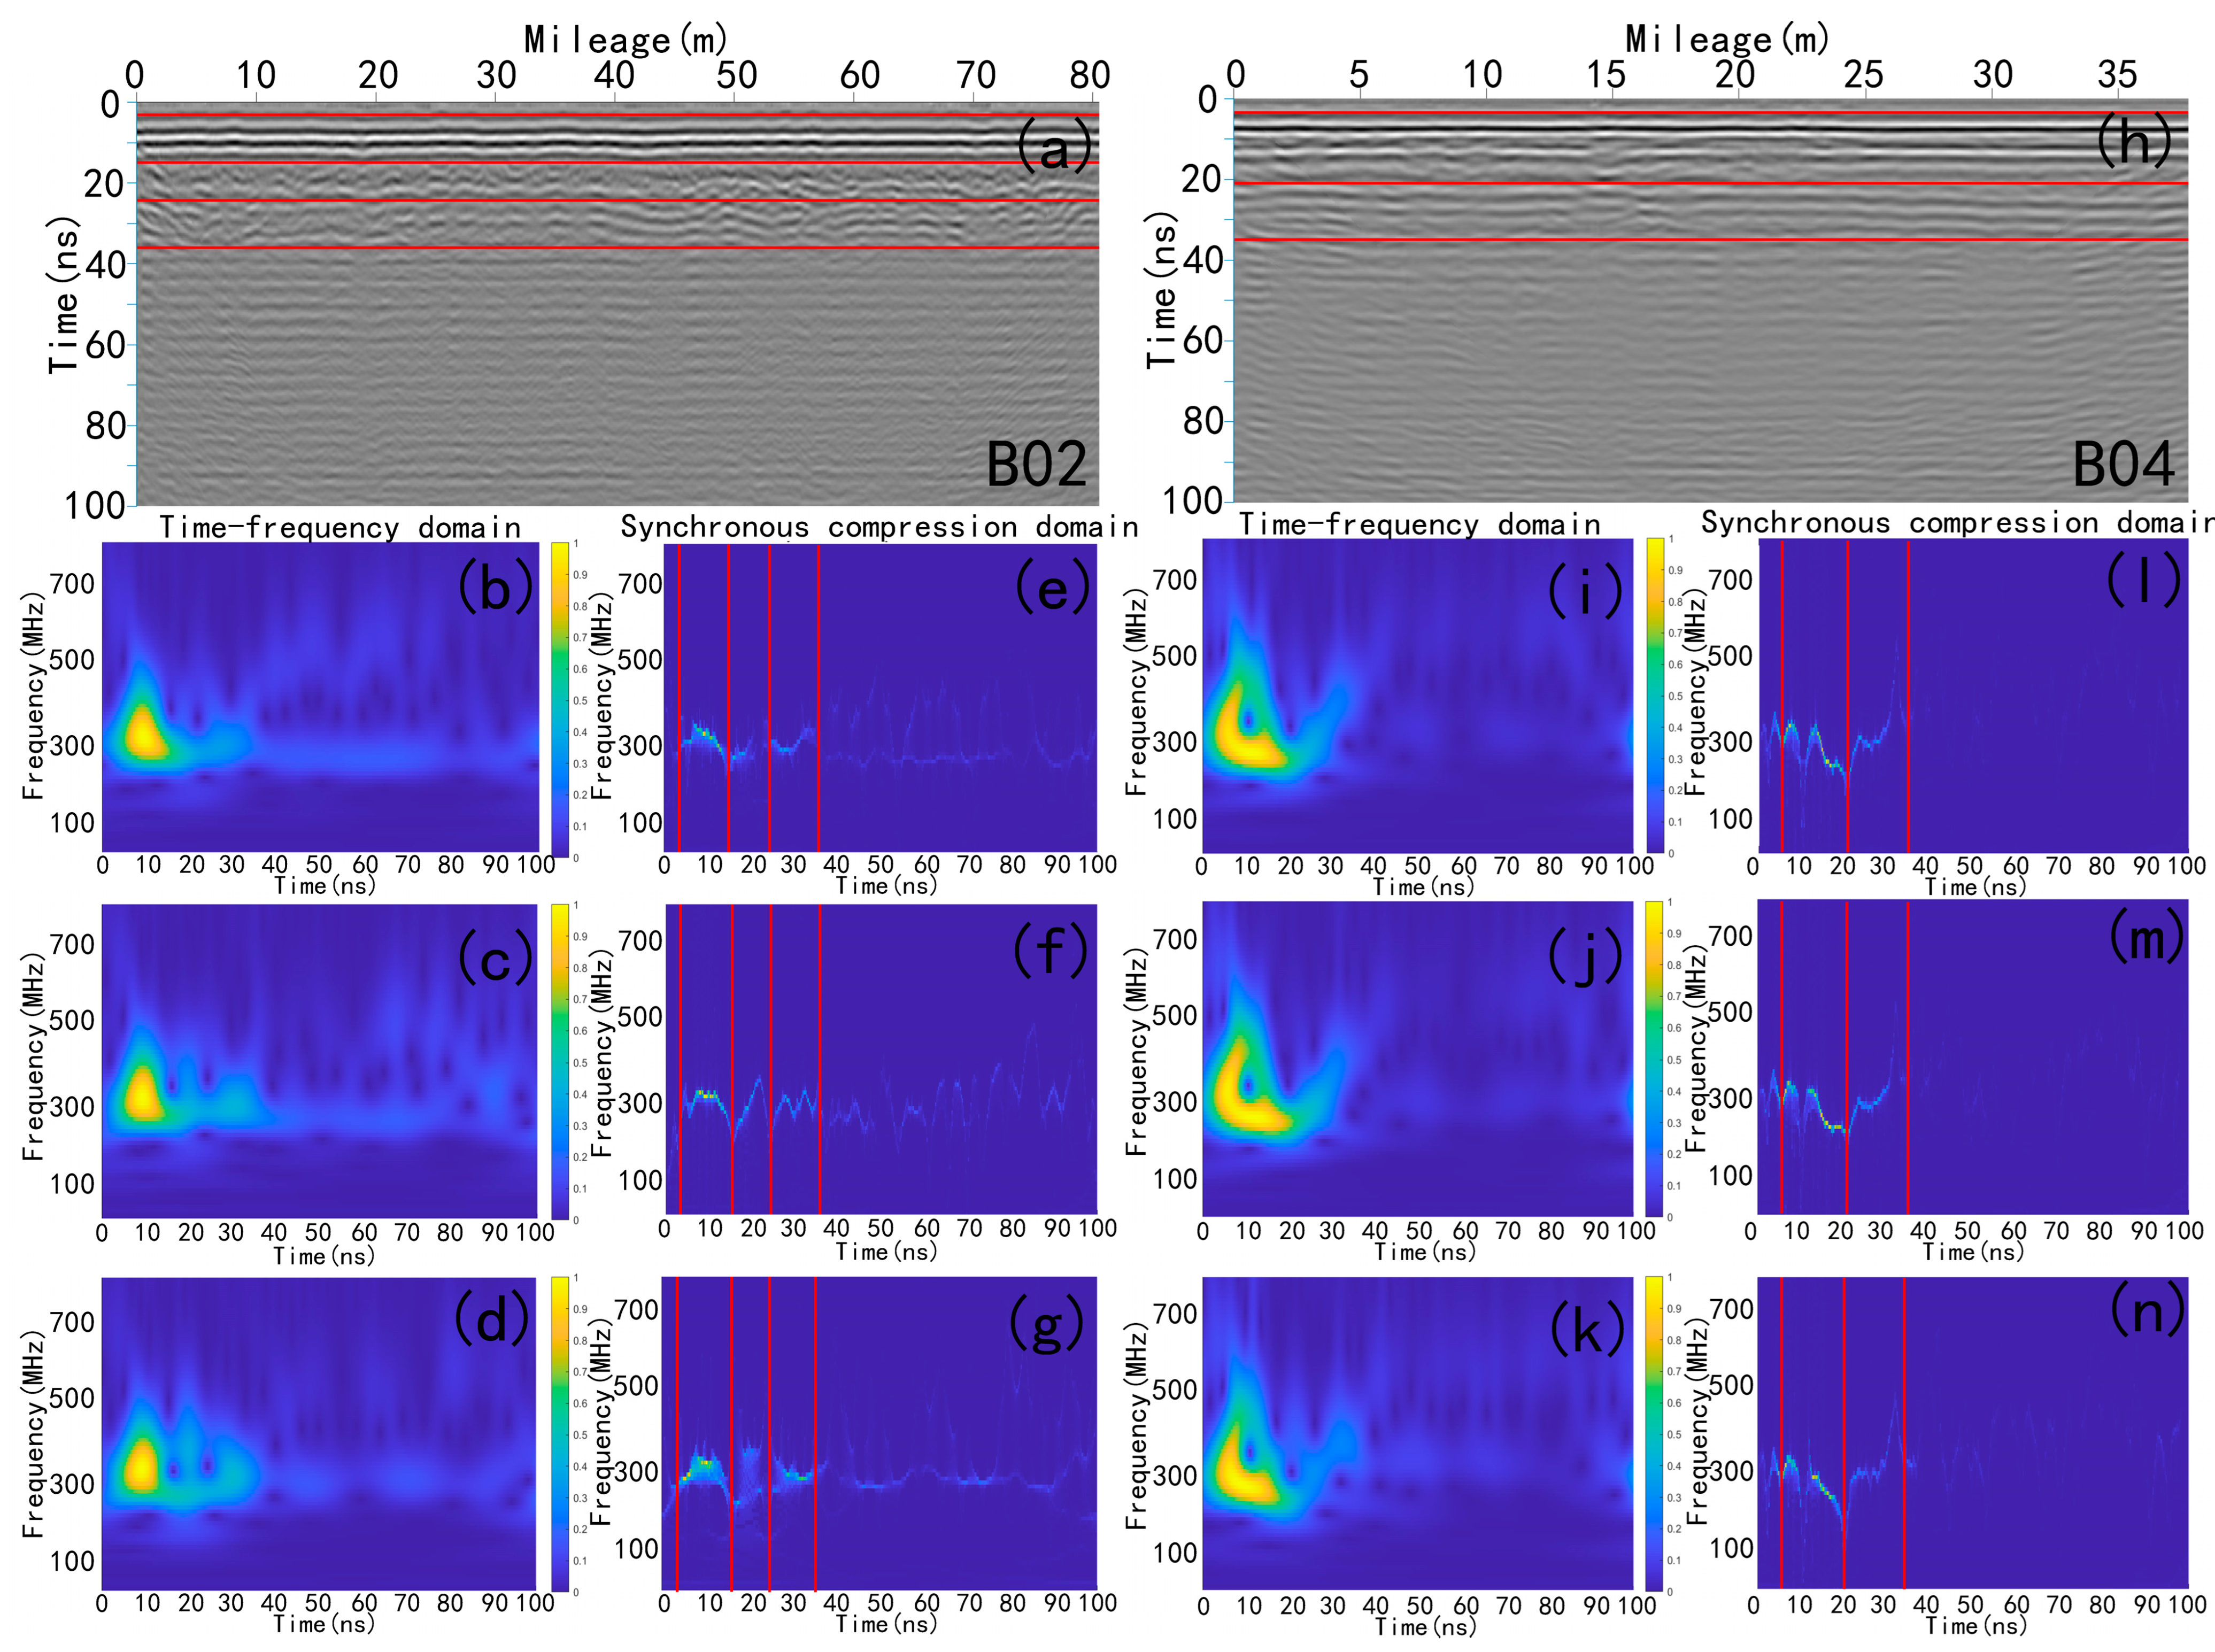
Taking sampling sites B02 and B04 as examples, the radar time profiles (Figure 8a,h), time–frequency domains (Figure 8b–d,i–k), and synchro-squeezed domains (Figure 8e–g,l–n) reveal the following patterns: Time–frequency domain analysis effectively identifies sediment layer interfaces through variations in signal energy trajectories. Observations indicate that the radar signal energy is primarily concentrated in the 250–350 MHz frequency band. Color-gradient intensity distributions reveal prominent high-energy zones (yellow regions) during 3.51–15.7 ns (B02) and 4.9–20.9 ns (B04), which align with high-amplitude reflection areas (dark zones) in the time profiles (Figure 8a,h). This indicates strong electromagnetic wave absorption and reflection within these depth intervals, yielding peak radar signal responses. Synchro-squeezed domain results further corroborate this finding: within identical depth intervals, the blue-purple curves representing instantaneous frequency exhibit significant fluctuations (Figure 8e–g,l–n). Energy discontinuity points in the synchro-squeezed energy distribution, combined with time–frequency characteristics, enable clear delineation of the primary sedimentary layer interface. With increasing depth, systematic energy attenuation occurs in both time–frequency and synchro-squeezed domains at 37.6 ns (B02) and 35.52 ns (B04). This phenomenon is attributed to enhanced electromagnetic wave scattering caused by elevated moisture content or intrusive bodies in deeper soil strata, significantly weakening reflected signal energy. Analysis based on Table 1 demonstrates the significant efficacy of the generalized S-transform method in sediment layer identification, enabling clear discrimination of distinct soil layer interfaces with absolute errors ranging from 0.002 to 0.39 m (Table 1). However, this method exhibits notable limitations in quantitative thickness assessment, with relative errors commonly exceeding 10% and reaching a maximum of 32.95%, indicating substantial discrepancies compared to actual geological profiles.
Figure 8.
Sedimentary thickness delineation results based on generalized S-transform time–frequency analysis. (a,h) Radar time profiles at sites B02 and B04, respectively (similar to Figure 6 a,e); (b–d,i–k) corresponding time–frequency domains; (e–g,l–n) synchro-squeezed transform domains; (b,e) at 20 m along the B02 survey line; (c,f) at 40 m along the B02 survey line; (d,g) at 60 m along the B02 survey line; (i,l) at 9.5 m along the B04 survey line; (j,m) at 19 m along the B04 survey line; (k,n) at 28.5 m along the B04 survey line. Red lines indicate identified time-domain interfaces of soil stratification. The color bar to the right depicts the concentration of the ground-penetrating radar signal energy. Warmer (yellow) colors signify areas of high energy concentration, and cooler (blue) colors represent regions of dispersed energy.
4. Discussion
4.1. Performance Analysis and Depth Attenuation of GPR Methods in Sediment Thickness Delineation Detection
Drawing on a comprehensive dataset from four sampling sites (B02–B05) encompassing 14 valid soil layers (Table 1), a comparative analysis highlights clear performance differences among the three sediment thickness detection methods. Both the radar image waveform method and the Hilbert spectrum instantaneous phase method demonstrate relatively high robustness, with mean relative errors of 8.65% and 9.28%, respectively. Notably, strong consistency is observed in both shallow (e.g., B02-L1; B03-L1) and intermediate layers (e.g., B02-L2, L3). The Hilbert method performs particularly well in deeper soil strata with abrupt interfaces, as evidenced in B04-L3 (relative error 4.42%) and B05-L4 (relative error 5.67%). In contrast, the generalized S-transform time–frequency analysis method shows greater variability in performance. While it achieves relatively high accuracy in certain shallow layers (B05-L1; B03-L1), it exhibits the largest errors in transitional zones, such as in B03-L2, where the relative error reaches 32.95%. Integrated comparison of relative errors across the methods shows that the radar image waveform approach yields errors below 7% in 64% of measurements, while the Hilbert spectrum instantaneous phase method consistently achieves small errors of under 6%. In contrast, the generalized S-transform exhibits an uneven performance profile, reflecting deeper divergences in its applicability across varying subsurface conditions. Given its operational reliability, the Hilbert instantaneous phase method is recommended as the primary tool for routine exploration and can be used in conjunction with the radar waveform method for stratigraphic validation and error reduction. On the other hand, the generalized S-transform time–frequency analysis may offer particular utility within certain depth ranges, and thus remains a valuable supplementary technique for specific scenarios.
The present study illustrates an inherent trade-off between the penetration depth and resolution in the GPR, with the resolution significantly degrading as the depth increases. Electromagnetic energy diminishes gradually due to scattering and absorption within the subsurface medium. Beyond a certain depth, usable signals weaken substantially while ambient noise becomes predominant, undermining confident target detection []. This phenomenon manifests as systematic deviations in the sediment layer thickness estimation. Results from the three methods in Table 1 collectively demonstrate increasing absolute and relative errors with depth. Consequently, the reliability of sediment thickness variation identification and interpretation significantly diminishes in deeper strata, ultimately causing partitioning omissions in specific horizons (e.g., L5–L7 layers in Figure 5). The 250 MHz center-frequency antenna employed in this study demonstrates an exceptional layer identification capability in shallow subsurface regions, with relative errors predominantly below 15% within 1 m depth and under 25% up to 2 m depth (Table 1). However, beyond 2 m depth (corresponding to radar signal time windows > 40 ns), rapid signal attenuation occurs due to medium absorption. This is evidenced by significantly degraded continuity of coherent reflections in the Hilbert spectral instantaneous phase profiles (Figure 7). Concurrently, the radar time profiles (Figure 6) reveal a transition to irregular, discontinuous chaotic reflection patterns beyond 35 ns, predominantly associated with silt-dominated strata exhibiting elevated moisture content and consequent strong electromagnetic wave interference.
4.2. Potential Factors Influencing Measurement Accuracy of Soil Layer Thickness and Stratigraphic Interpretation
Strong spatial heterogeneity and complex composition of soils induce irregular fluctuations in reflection interfaces along GPR survey lines (Figure 7a,e), significantly increasing the complexity of sediment horizon interpretation. To simplify calculations, this study established regression relationships between the dielectric permittivity of each soil layer and peak-weighted average frequency, assuming fixed permittivity values per layer. However, in field conditions, soil texture typically exhibits gradual transitions, causing continuous variations in the dielectric permittivity with depth. Consequently, electromagnetic wave propagation velocity changes dynamically, potentially introducing velocity estimation deviations and ultimately compromising sedimentary layer thickness estimation accuracy. This inherent simplification underscores a fundamental limitation of GPR for quantitative stratigraphic analysis in heterogeneous environments.
Meanwhile, a fundamental discrepancy exists between manual sediment horizon identification and the principles underlying GPR detection: field interpreters typically define layers based on physical attributes such as soil color, mechanical properties, and structural features, whereas GPR identifies interfaces through reflections caused by discontinuities in dielectric permittivity []. This difference in interpretive criteria can lead to inconsistencies, particularly under environmental disturbances such as variations in moisture and salinity. These conditions may produce electromagnetic anomalies unrelated to actual stratigraphic interfaces, resulting in false positives. For example, horizon mismatches were observed in the L1 layer at sites B04 and B05 (Table 1), where saline clay interbeds caused significant signal attenuation, masking true sediment boundaries.
4.3. Impact of Complex Surface and Underground Environments on GPR Data Quality
Field complexity and heterogeneity frequently induce anomalous mutations in the GPR signals due to vegetation cover, soil porosity development, topographic undulations, and spatial variations in salinity and moisture []. To mitigate such interference, data acquisition was scheduled post-harvest in autumn, prioritizing bare surfaces or post-wheat-harvested fields. Nevertheless, residual wheat straw remains unavoidable, while localized forest understory humus layers and micro-topographic undulations from ditch excavation induce mechanical vibrations during antenna movement, significantly degrading signal transmission efficiency. This explains site B03’s substantially higher relative error in sedimentary layer thickness compared to other sites. Furthermore, electromagnetic wave energy progressively attenuates with depth in the coastal study area, with groundwater and clay jointly exacerbating this decay through salinity ions elevating medium conductivity to enhance scattering []. Consequently, these factors may compromise sedimentary layer interface positioning accuracy, necessitating integration of multimethod validation tools to enhance stratification precision in future studies.
5. Conclusions
This study implemented ground-penetrating radar (GPR) surveys in typical field environments of coastal regions, systematically characterizing radar facies features and their correlations with sedimentary structures. By establishing a quantitative relationship between dielectric permittivity and frequency-domain peak-weighted average frequency derived from short-time Fourier transform (STFT) analysis, sedimentary stratification profiles and layer thicknesses were calculated. A comprehensive evaluation of three time–frequency analysis methods (the radar image waveform method, Hilbert spectrum instantaneous phase method, and generalized S-transform time–frequency analysis method) was conducted to assess their performance disparities in sedimentary thickness variation identification. The principal conclusions are summarized as follows:
- Three distinct radar facies were delineated from the ground-penetrating radar (GPR) profiles and their sedimentological interpretations were rigorously validated against borehole core data, thereby establishing relationships between radar signatures and soil characteristics, including texture and color indices. Facies 1 (F1) corresponds to high-amplitude, horizontal, continuous reflections with parallel waveforms, dominantly composed of clay and silty clay sediments exhibiting yellowish-gray to brownish hues. Facies 2 (F2) represents moderate-to-high-amplitude, sinuous continuous reflections with parallelism, primarily composed of clay and silt with thin sand interbeds, displaying grayish-yellow to gray hues. Facies 3 (F3) is characterized by medium-amplitude, discontinuous chaotic reflections, predominantly composed of gray silty sediments containing minimal clay content. Overall, these findings demonstrate the exceptional capability of ground-penetrating radar for high-fidelity imaging of subsurface geological structures, enabling precise discrimination of individual sedimentary units.
- This study demonstrates that the radar image waveform method, Hilbert spectrum instantaneous phase method, and generalized S-transform time–frequency analysis method all effectively characterize variations in subsurface sediment thickness. With the exception of anomalous errors at site B03 (caused by subsurface heterogeneity and topographic interference), relative errors for most layers remain below 15% at shallow depths (<1 m) and ≤25% within the 1–2 m range. However, comprehensive analysis also reveals a systematic limitation of GPR: the positioning accuracy of sediment layer interfaces progressively declines with depth. Beyond 2 m, the signal-to-noise ratio decreases markedly due to exponential attenuation of electromagnetic wave energy caused by medium absorption, which impedes precise layer delineation. To mitigate this depth-related constraint, the integration of radar facies interpretation with borehole core data offers an effective compensatory strategy for inferring lithological characteristics in deeper strata.
- Significant disparities emerged in the time-domain stratification performance among the three methods. Comparative analysis demonstrated that the Hilbert spectral instantaneous phase method consistently maintained relative errors of below 6% across 64% of the sediment layers at all sampling sites, achieving optimal performance with positioning errors of under 5 cm for most sediment horizons.
Author Contributions
Conceptualization, W.C. and C.Z.; data curation, C.Z.; formal analysis, W.C.; investigation, C.Z., G.Z., and X.L.; methodology, W.C. and C.Z.; supervision, C.Z.; validation, C.Z., G.Z., and X.L.; writing—original draft, W.C.; writing—review and editing, C.Z. and J.Z. All authors have read and agreed to the published version of the manuscript.
Funding
This work was supported by the key project of the National Natural Science Foundation (42130405), the Innovative and Jiangsu Innovation Research Group (JSSCTD202346), and research on the identification of genetic horizons in typical Chinese soil profiles based on imaging spectroscopy and machine learning methods (KYCX25_1566).
Institutional Review Board Statement
Not applicable.
Informed Consent Statement
Not applicable.
Data Availability Statement
The data presented in this study are available on request from the corresponding author.
Conflicts of Interest
The authors declare no conflicts of interest.
References
- Li, L.; Zhu, C.; Qin, Z.; Storozum, M.J.; Kidder, T.R. Relative sea level rise, site distributions, and Neolithic settlement in the early to middle Holocene, Jiangsu Province, China. Holocene 2018, 28, 354–362. [Google Scholar] [CrossRef]
- Liu, B.; Tan, C.; Yu, X.; Shan, X.; Li, S. Evolution model of a modern delta fed by a seasonal river in Daihai Lake, North China: Determined from ground-penetrating radar and trenches. Front. Earth Sci. 2019, 13, 262–276. [Google Scholar] [CrossRef]
- Yang, J.; Wang, Y.; Zhang, Z.; J, P.G.; Longjiang, M.; Wei, L.; Guo, W.; Li, S.; Xu, J.; Ji, X. Major element records of land-sea interaction and evolution in the past 2.58ma from the Baoying borehole sediments, northern Jiangsu plain, China. Quat. Sci. 2006, 26, 340–352. Available online: http://www.dsjyj.com.cn/en/article/id/dsjyj_8632 (accessed on 1 November 2025).
- Yang, Y.; Jia, J.; Zhou, L.; Gao, J.; Gao, W.; Shi, B.; Li, Z.; Wang, Y.P.; Gao, S. Quantitative reconstruction of Holocene sediment sources contributing to the central Jiangsu coast, China: New insights into source-to-sink processes. Earth Surf. Process. Landf. 2020, 45, 2463–2477. [Google Scholar] [CrossRef]
- Shu, Q.; Zhao, Y.; Hu, Z.; Yang, P.; Liu, Y.; Chen, Y.; Zhao, Z.; Zhang, M. Multi-proxy reconstruction of the Holocene transition from a transgressive to regressive coastal evolution in the northern Jiangsu Plain, East China. Palaeogeogr. Palaeoclimatol. Palaeoecol. 2021, 572, 110405. [Google Scholar] [CrossRef]
- Xue, C.; Yang, Y.; Xu, C.; Wang, M.; Gao, J.; Han, X.; Jia, J. Sedimentary records reveal two stages of evolution of the Abandoned Yellow River Delta from AD1128 to AD1855: Vertical accretion and land-forming. Anthr. Coasts 2023, 6, 8. [Google Scholar] [CrossRef]
- Shukla, S.B.; Chowksey, V.M.; Prizomwala, S.P.; Ukey, V.M.; Bhatt, N.P.; Maurya, D.M. Internal sedimentary architecture and coastal dynamics as revealed by ground penetrating radar, Kachchh coast, western India. Acta Geophys. 2013, 61, 1196–1210. [Google Scholar] [CrossRef]
- Han, X.; Liu, J.; Zhang, J.; Zhang, Z. Identifying soil structure along headwater hillslopes using ground penetrating radar based technique. J. Mt. Sci. 2016, 13, 405–415. [Google Scholar] [CrossRef]
- Zhu, X.; Fu, M.; Lu, H.; Wang, M.; Zhang, Y.; Ma, L.; Peng, W.; Ran, E. Acquiring the soil stratification of soda saline-alkali soils using ground penetrating radar. Trans. Chin. Soc. Agric. Eng. 2025, 41, 99–107. [Google Scholar] [CrossRef]
- Wunderlich, T.; Majchczack, B.S.; Wilken, D.; Segschneider, M.; Rabbel, W. What Is Beyond Hyperbola Detection and Characterization in Ground-Penetrating Radar Data?—Implications from the Archaeological Site of Goting, Germany. Remote Sens. 2024, 16, 4080. [Google Scholar] [CrossRef]
- Zajícová, K.; Chuman, T. O and A soil horizons’ boundaries detection using GPR under variable soil moisture conditions. Geoderma 2022, 422, 115934. [Google Scholar] [CrossRef]
- Johnson, R.W.; Glasscum, R.; Wojtasinski, R. Application of Ground Penetrating Radar to Soil Survey. Soil Surv. Horiz. 1982, 23, 17–25. [Google Scholar] [CrossRef]
- Mokma, D.L.; Schaetzl, R.J.; Doolittle, J.A.; Johnson, E.P. Ground-Penetrating Radar Study of Ortstein Continuity in Some Michigan Haplaquods. Soil Sci. Soc. Am. J. 1990, 54, 936–938. [Google Scholar] [CrossRef]
- Collins, M.E.; Schellentrager, G.W.; Doolittle, J.A.; Shih, S.F. Using Ground-penetrating Radar to Study Changes in Soil Map Unit Composition in Selected Histosols. Soil Sci. Soc. Am. J. 1986, 50, 408–412. [Google Scholar] [CrossRef]
- Roth, K.; Wollschlger, U. Exploring Soil Layers and Water Tables with Ground-Penetrating Radar. Pedosphere 2004, 14, 273–282. [Google Scholar]
- Xu, B.; Tian, G.; Zeng, Z.; Xue, J.; Wang, Z. Deli mitating boundary and interface of saline soil in baicheng area by using GPR. J. Chang. Univ. Sci. Technol. 2001, 31, 408–411. [Google Scholar] [CrossRef]
- Xue, J.; Zeng, Z.; Tian, G.; Wang, Z. The application of GPR to detecting the saline-alkali layer in west Jilin. Geophys. Geochem. Explor. 2005, 29, 421–424. [Google Scholar] [CrossRef]
- Wang, S.; Chen, H.; Fu, Z.; Nie, Y.; Wang, K. Estimation of thickness of soil layer on typical karst hillslopes using a ground penetrating radar. Acta Pedol. Sin. 2015, 52, 1024–1030. [Google Scholar] [CrossRef]
- Cao, Q.; Song, X.; Yang, S.; Wu, H.; Zhang, G. Identification of Plinthitic Red Earth Layers in Red Soil Regions Typical of South China with Ground genetrating Radar. Acta Pedol. Sin. 2019, 56, 813–824. [Google Scholar] [CrossRef]
- Hou, J.; Yan, Y.; Cong, P. Application of Technology of UAV-Mounted Ground Penetrating Radar in the Study of the Thickness of Soil Plow Layer. IOP Conf. Ser. Earth Environ. Sci. 2021, 719, 042074. [Google Scholar] [CrossRef]
- Liu, C.; Liu, G.; Li, H.; Wang, X.; Chen, H.; Dan, C.; Shen, E.; Shu, C. Using ground-penetrating radar to investigate the thickness of mollic epipedons developed from loessial parent material. Soil Tillage Res. 2021, 212, 105047. [Google Scholar] [CrossRef]
- Ardekani, M.R.; Druyts, P.; Lambot, S.; Coster, A.D.; Neyt, X. Recovering the structure of a layered soil, including layer thickness and dielectric permittivity, using the interfaces and objects backscatter detected in GPR B-scans. In Proceedings of the 15th International Conference on Ground Penetrating Radar, Brussels, Belgium, 30 June–4 July 2014; pp. 397–400. [Google Scholar]
- Wu, Q.; Yao, X.; Chen, X.; Zhao, M.; Zhao, H.; Yun, H. Nondestructive inspection method for soil profile configuration based on ground penetrating radar. Arid. Land Geogr. 2022, 45, 1860–1869. [Google Scholar] [CrossRef]
- Li, L.; Xue, F.; Chao, C.J.Z.; Dehai, Z.; Kening, W. Soil Layer Information Recognition for Ground Penetrating Radar Based on Envelope Detection and STFT Spectrum Analysis. J. Geo-Inf. Sci. 2020, 22, 316–327. [Google Scholar] [CrossRef]
- Zhang, C. Marine Comprehensive Investigation and Evaluation in the Offshore Area of Jiangsu Province; Science Press: Beijing, China, 2012. [Google Scholar]
- Meikele, R. Comprehensive Investigation of Coastal Zone and Salt Marsh Resources in Jiangsu Province; China Ocean Press: Beijing, China, 1986. [Google Scholar]
- Jin, W.; Yang, J.; Wang, X. Spatial distribution of organic carbon in coastal saline soil and its correlation with reclamation age. Trans. CSAE 2013, 29, 89–94. [Google Scholar] [CrossRef]
- Davis, J.L.; Annan, A.P. Ground-penetrating radar for high-resolution mapping of soil and rock stratigraphy. Geophys. Prospect. 1989, 37, 531–551. [Google Scholar] [CrossRef]
- Neal, A. Ground-penetrating radar and its use in sedimentology: Principles, problems and progress. Earth-Sci. Rev. 2004, 66, 261–330. [Google Scholar] [CrossRef]
- Gabor, D. Theory of communication. J. Inst. Electr. Eng. 1946, 93, 429–441. [Google Scholar] [CrossRef]
- Pinnegar, C.R.; Mansinha, L. Time-Local Spectral Analysis for Non-Stationary Time Series: The S-Transform for Noisy Signals. Fluct. Noise Lett. 2003, 03, L357–L364. [Google Scholar] [CrossRef]
- Maxwell, J.C. VIII. A dynamical theory of the electromagnetic field. Philos. Trans. R. Soc. Lond. 1865, 155, 459–512. [Google Scholar] [CrossRef]
- Słowik, M. Influence of measurement conditions on depth range and resolution of GPR images: The example of lowland valley alluvial fill (the Obra River, Poland). J. Appl. Geophys. 2012, 85, 1–14. [Google Scholar] [CrossRef]
- Wang, P.; Li, X.; Min, X.; Xu, S.; Zhao, G.; Fan, D. Investigating soil layers with ground penetrating radar in the modern Yellow River Delta of China. Near Surf. Geophys. 2024, 22, 339–357. [Google Scholar] [CrossRef]
- Lauro, S.E.; Mattei, E.; Barone, P.M.; Pettinelli, E.; Vannaroni, G.; Valerio, G.; Comite, D.; Galli, A. Estimation of subsurface dielectric target depth for GPR planetary exploration: Laboratory measurements and modeling. J. Appl. Geophys. 2013, 93, 93–100. [Google Scholar] [CrossRef]
Disclaimer/Publisher’s Note: The statements, opinions and data contained in all publications are solely those of the individual author(s) and contributor(s) and not of MDPI and/or the editor(s). MDPI and/or the editor(s) disclaim responsibility for any injury to people or property resulting from any ideas, methods, instructions or products referred to in the content. |
© 2025 by the authors. Licensee MDPI, Basel, Switzerland. This article is an open access article distributed under the terms and conditions of the Creative Commons Attribution (CC BY) license (https://creativecommons.org/licenses/by/4.0/).