Article

Geological Map of the Proclus Crater: A Study Case to Integrate Composition and Morpho-Stratigraphic Mapping on the Moon

1
IAPS, INAF, Via del Fosso del Cavaliere 100, 00133 Rome, Italy
2
Department of Physics and Earth Sciences, University of Parma, Viale delle Scienze 157/A, 43124 Parma, Italy
*
Author to whom correspondence should be addressed.
Remote Sens. 2025, 17(23), 3786; https://doi.org/10.3390/rs17233786
Submission received: 22 September 2025 / Revised: 13 November 2025 / Accepted: 18 November 2025 / Published: 21 November 2025

Highlights

What are the main findings?
  • Integrated geostratigraphic map permits us to discuss both the different morphologies and the compositional variation in Proclus crater, with specific geostratigraphic units.
  • Two geostratigraphic units permit the definition of subunits highlighting a high variability of mineral chemistry and relative abundances on freshly exposed portions of the walls.
What are the implications of the main finding?
  • The production of geostratigraphic maps permits the exploration of the geology within the crater, and a higher understanding from the map itself can be achieved in terms of target selection, exploration traverse definition, and evaluation of localized in situ resource utilization.
  • Spectral units, and the retrieved mineralogical variation, seem to suggest the presence of magma traps during the plagioclase floating within the lunar primary crust formation, and constituting heterogeneous terrains within the Highland.

Abstract

Planetary mapping has progressively evolved due to the increasing availability of high-quality data and advancements in analytical techniques applied to both surface and subsurface features. In particular, the enhanced spatial resolution and broader coverage provided by cameras and spectrometers aboard orbiting spacecraft around planetary bodies, now enable the production of more detailed geostratigraphic maps. Which maps go beyond the traditional planetary approach, with mineralogical data contributing significantly to the development of more comprehensive final products. Proclus crater is a fresh crater, 28 km in diameter, located on the northwest rim of the Crisium basin, where crystalline plagioclase, as well as pyroxenes and olivine, have been detected. Here, preliminarily, the geomorphological map showed the different surface textures and lineaments of the crater, and a spectral unit map highlighted the different spectral units present in the area. The spectral unit map has been produced by using supervised classification, where the spectral endmembers were extracted by the mean of an automatic tool. The mineralogical interpretation retrieved from spectral endmembers supports the definition of six main spectral units and, moreover, indicates how two of them could be divided into subunits. Those subunits show the systematic variation in plagioclase, low-Ca and high-Ca pyroxene, and their relative abundances. Finally, the geostratigraphic maps associate compositional heterogeneity with different units of the crater, suggesting that this crater was originally characterized by lithologies rich in plagioclase, but mixed with variable low amounts of mafic phases. Since Proclus is a relatively small crater and the units better exposing the mineral’s original heterogeneity are principally distributed in the walls, the spectral units seem to suggest the presence of magma traps during the plagioclase floating during the lunar primary crust formation and constitute heterogeneous terrains within the Highland.

1. Introduction

Planetary mapping evolved over time, initially relying on the interpretation of remote sensed data obtained from camera imagery. This approach enabled qualitative morpho-stratigraphic observations of the surfaces. The use of visible or infrared image datasets, primarily based on topographic features, albedo variations, and thermal inertia, has allowed researchers to the describe, delineate, and infer the stratigraphy of geomorphic units [1,2]. Consequently, the resulting products are often classified as “morpho-stratigraphic maps”. However, this approach presents limitations when applied to mission planning, particularly defining exploration targets, designing traverse paths, and evaluating localized in situ resource utilization opportunities [1,3,4].
In contrast, geological maps should ideally incorporate information on rock lithology and composition, structure, and other information. If some of them require in-field investigation, others could be supported, even if partially, by remote sensing data. For instance, spectral, color, and compositional information can be integrated into the map, thus generating a new product that could be associated with spectro-morphic or geo-stratigraphic maps [1,2,3,4].
Recently, different approaches have been followed to integrate these and morphological information into a unified mapping framework. This process typically begins by summarizing the spectral data to define a set of spectral units, which describe the spectral properties or inferred mineralogical composition of materials within a specific region. Once these spectral units are established, they can be incorporated into the morpho-stratigraphic maps, producing a new integrated map. This new map is generated by introducing new units or subunits, where needed, to incorporate the variation in composition among the same morpho-stratigraphic units or, on the other hand, similitude of composition among different morphologies [1,3].
Ref. [3] showed how spectral units (SU) defined by clustering of different parameters, which were calculated from multispectral color mosaics of Mercury, can be used to produce an integrated geostratigraphic map for specific regions on the Hermean planet. Ref. [4] followed a similar approach to produce spectral units by using a hyperspectral dataset from the Moon to define an integrated geostratigraphic map for the Tsiolkovskiy Crater.
Previously, Ref. [5] was investigating the spectral variability among each morpho-stratigraphic unit of the Daedalia Planum Lava Field on Mars with hyperspectral data. This permitted the definition of some spectral units among each lava flow, and using the identified endmembers to classify spectrally the same regions, and finally revised the maps integrating the two datasets.
In this study, we investigate an intermediate approach; we study separately the spectral properties and the morphological features of a specific lunar crater. Thus, we defined the SU independently from the morpho-stratigraphic map, as performed by [3,4]. But, we use a classification approach by analyzing the hyperspectral dataset of the selected regions, instead of clustering a set of spectral indexes, as performed in [5].
We selected the Proclus crater (16.1°N, 47.0°E), which is a Copernican age, 28 km in diameter, fresh crater, located on the northwest rim of the Crisium basin and east of Palus Somni (see Figure 1), as a case study. We chose this crater searching for a young crater where fresh material could be exposed, and the surface could be less affected by space weathering, which removes spectral information about different mineralogy. We were considering a case where morphology and spectral properties showed variability among the highlands to investigate the capability to produce an integrated map with a specific workflow. Proclus crater was already mapped and described in different Apollo mission reports (XI, XV, and XVII). In particular, the Apollo XV mission described that the inner walls were almost white and exhibited debris and large blocks, the outer ring was light gray, and the floor was very irregular and rough, medium gray, with few ridges and domes [6]. Thereafter, Refs. [7,8] showed spectra from the rim and walls of Proclus compatible with noritic anorthosites, and data from Mg/Al X-ray fluorescence for Proclus showed values compatible with Apollo XVI soils and anorthositic-gabbro samples [9]. Ref. [10] have recognized pure anorthosite (PAN) regions, and ref. [11] detected crystalline plagioclase in the crater’s northern wall, as well as pyroxenes and olivine, both adjacent to and separated from plagioclase regions. All this information drives our choice to investigate the capability to integrate the evidence of different morphologies and compositional variability in a new product, and to support the geological evolution due to Proclus crater formation. To reach this aim, we first compiled both a geomorphological and a spectral map of the crater that were subsequently integrated to produce a geostratigraphic map of the site.

2. Data and Methods

2.1. LROC and LRO Images

To develop the morpho-stratigraphic map of Proclus crater, LROC (Lunar Reconnaissance Orbiter Camera) data were used. In particular, two mosaics were taken into account as the main basemaps. The first basemap was a derived mosaic already available in the LRO catalog denominated “Proclus Crater low-Sun controlled NAC” (Narrow Angle Camera) mosaic. Such a mosaic was created by combining NAC images acquired on consecutive orbits, or occasionally over non-consecutive orbits under very similar lighting conditions (e.g., less than 5 degrees difference in incidence angle and the same sun direction) [12]. The Proclus mosaic was built using 8 different NAC images (see Table 1) and has a spatial resolution of 1 m/pixel. Since in this mosaic the western part of the crater is in shadow, we overlap a second basemap with a mosaic compiled by us using ISIS, including four NAC images (Table 1), with a spatial resolution of 1.3 m/pixel. This mosaic covers the western sector of Proclus with an illumination condition more suitable to map that part of the wall and of the floor.
Finally, LRO WAC mosaic of 100 m/pixel 47 was also considered to map the crater ejecta in all of their extent. The projected images were imported into the ArcGIS® 10.8.2 environment, and then, the geological features were digitalized as vector layers. The map was produced in equirectangular projection.

2.2. M3 Data

M3 is a pushbroom imaging spectrometer launched on 22 October 2008, onboard India’s Chandrayaan-1. It covers the 0.43–3.0 µm spectral region and acquired data in two modes, with different spectral and spatial resolution: target, with 260 spectral bands and 70 m/pixel for 25–50% of the lunar surface, and global, with 85 spectral bands and 140 m/pixel for the entire surface [13]. In this paper, we have selected the m3g20090202t024131 reflectance image, which is the only orbit that entirely maps both the crater and its surroundings in one M3 image. We also investigated the images m3g20090105t194305, m3g20090202t042831. These images were used to compare if the spectral information is compatible with the m3g20090202t024131, even if they do not cover the entire crater and surroundings. Once we highlighted that the spectral properties were consistent among the different images, we proceeded to map the mineralogy of the crater and proximal ejecta on the m3g20090202t024131.

2.3. Methods and Analytical Approach

2.3.1. Mapping Method for the Geomorphological Map

To compile the morpho-stratigraphic map, two future classes were considered: geological contacts and lineaments.
(1)
Geological contacts define the boundary of geologic units, that are surfaces characterized by the same characteristics, such as albedo/color, texture, and stratigraphic position. Contacts are classified as follows: certain, where the boundary between adjacent units is detected with confidence, and approximate, where it is not well defined.
(2)
Lineaments include the following: (i) crater rims, that define the crests of craters, (ii) fractures, that are breaks in the rocks due to tensile stresses by thermal contraction, (iii) strata, that are bedding planes parallel to each other, and (iv) terraces, that are relatively flat plains, offset by steep scarps facing the center of the crater. In the geological map, the terrace margins have been outlined.

2.3.2. Spectral Mapping and Definition of Mineralogy

The analysis process is divided into two main steps:
(1)
Spectral mapping of the endmembers indicating SU using the Spectral Angle Mapper (SAM), considering a selection of endmembers from the M3 image on the basis of differences in absorption processes resulting in the image classification;
(2)
Mineralogical analysis of the average spectra of each SU via deconvolution using Gaussian modeling and comparison with laboratory spectral analogs.
Spectral Mapping
To define the spectral map, we considered the SAM [14], using ENVI 6.1 software (NV5 ©), which was efficiently used to identify mineralogical variation on different planetary bodies (e.g., [5,15,16]). SAM is an automated, supervised method that determines the spectral similarity by calculating the angular distance between an unknown spectrum and endmember spectra, considering spectra as vectors in an n-dimensional space, where n is the number of bands. This method is insensitive to illumination and albedo, but it is sensitive to spectral variability, expressed as absorption band associations and slope variations, which identify the mineral diversity of a pixel.
As a supervised method, SAM needs the introduction of a spectra library as endmembers to classify the rest of the image. In this work, we proceeded in two steps to identify the endmembers:
(1)
We applied the Purity Pixel Index (PPI, [17]), the PPI algorithm records the extreme pixels, counting the total number of times each pixel is marked as extreme, and we identified seven clusters. The PPI has been applied following the approach used in [16], where the PPI is applied on a Minimum Noise Fraction (MNF) transform to reduce the impact of image noise, transforming the data into a lower-dimensional subspace. To ensure that no spectral information was removed, spectra after the application of MNF are compared with original spectra (see [16] for more details).
(2)
Then looking into the variability of the clusters identified by the PPI and the first results of SAM at low acceptance angles (>0.1 radians), four other endmembers were added; the implemented endmembers resulted in a mixing of previously identified units, which are geographically distributed in significant clusters.
Then, we report the result of SAM at an angle of 0.1 radians, which was enough to minimize the standard deviation (<0.1) for each endmember spectra of the classification and avoid unclassified units.
Mineralogical Analysis
An average spectrum was calculated for each spectral unit and then deconvolved applying the modified Gaussian model (MGM). Here, we removed the continuum using the software ORIGIN®(Version 2024b) considering the continuum line as the line joining the reflectance absolute maxima [18]. The MGM is a statistic-based method that relies on the assumption that different absorptions can be described with a modified Gaussian distribution superimposed onto a continuum. It is widely applied to mineral phase and mixture analysis, in particular for the electronic absorptions in laboratory data (e.g., [19,20,21,22,23,24,25,26,27,28]), as well as in planetary data (e.g., [15,16,29]). A number has been assigned to each Gaussian, as described in Table 2.
Then we also compared the spectral variability to ad hoc mafic and plagioclase-bearing analogs, with compositions plausible for the lunar surface, and variable particle sizes (36–63 µm, 63–125 µm, and 125–250 µm, from [26,30,31]). Furthermore, we considered data from [20,21,22,23] to increase the information about the mafic mineralogy.
Since terrestrial and lunar spectra are characterized by different continua due to the space weathering condition acting on the lunar surface, we compared spectra after continuum removal.

2.3.3. Geostratigraphical Mapping

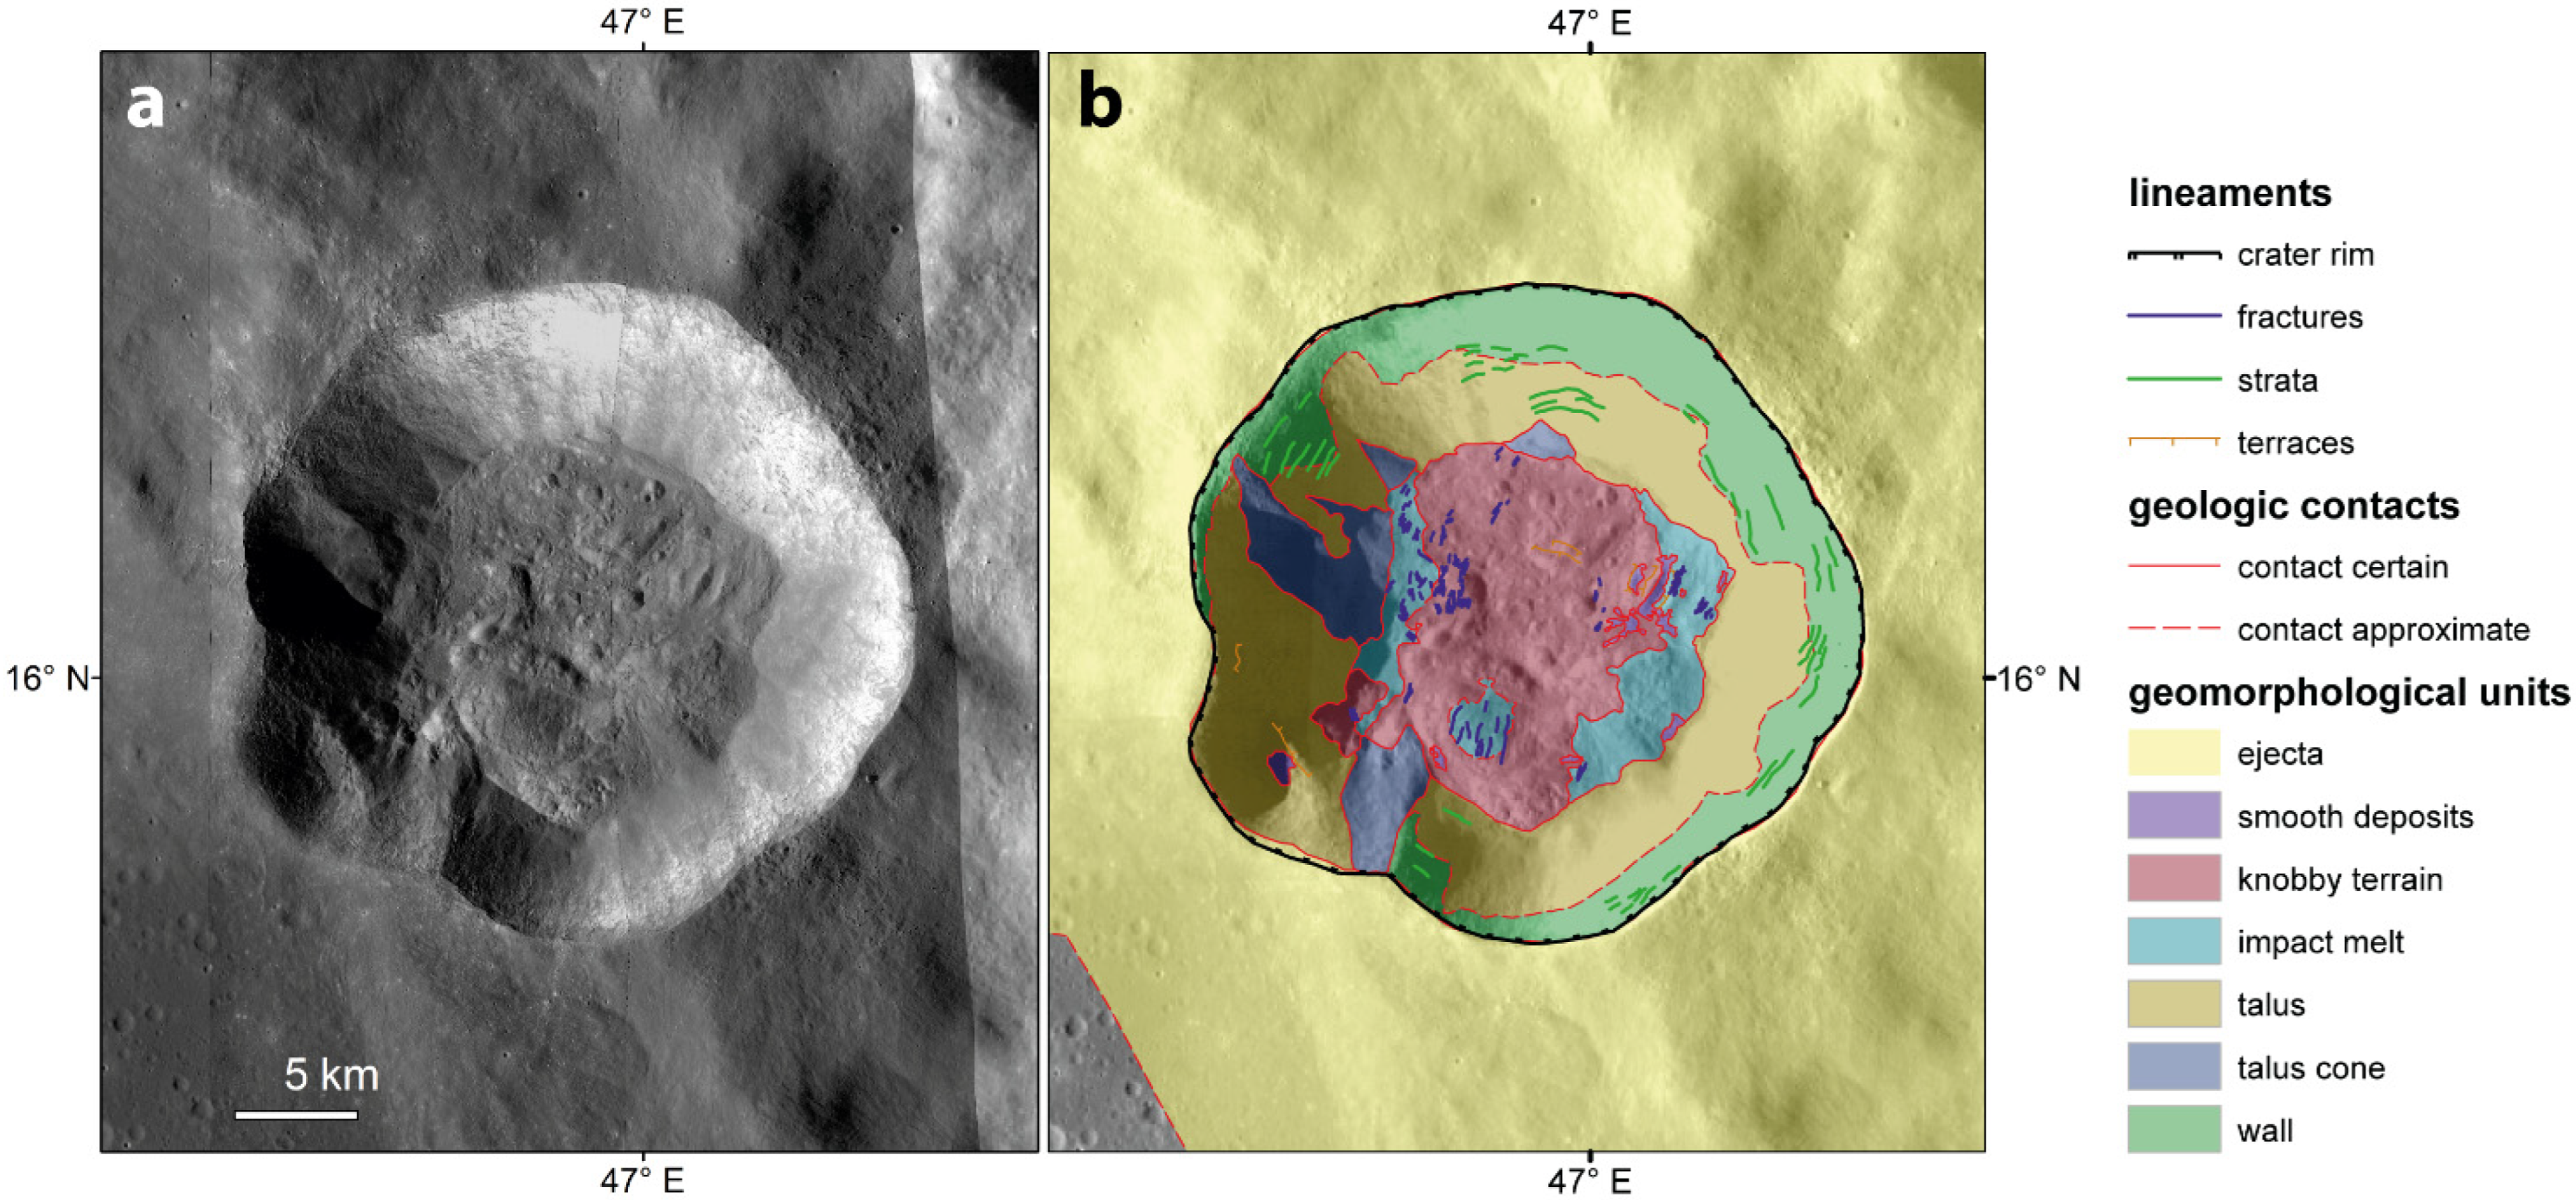
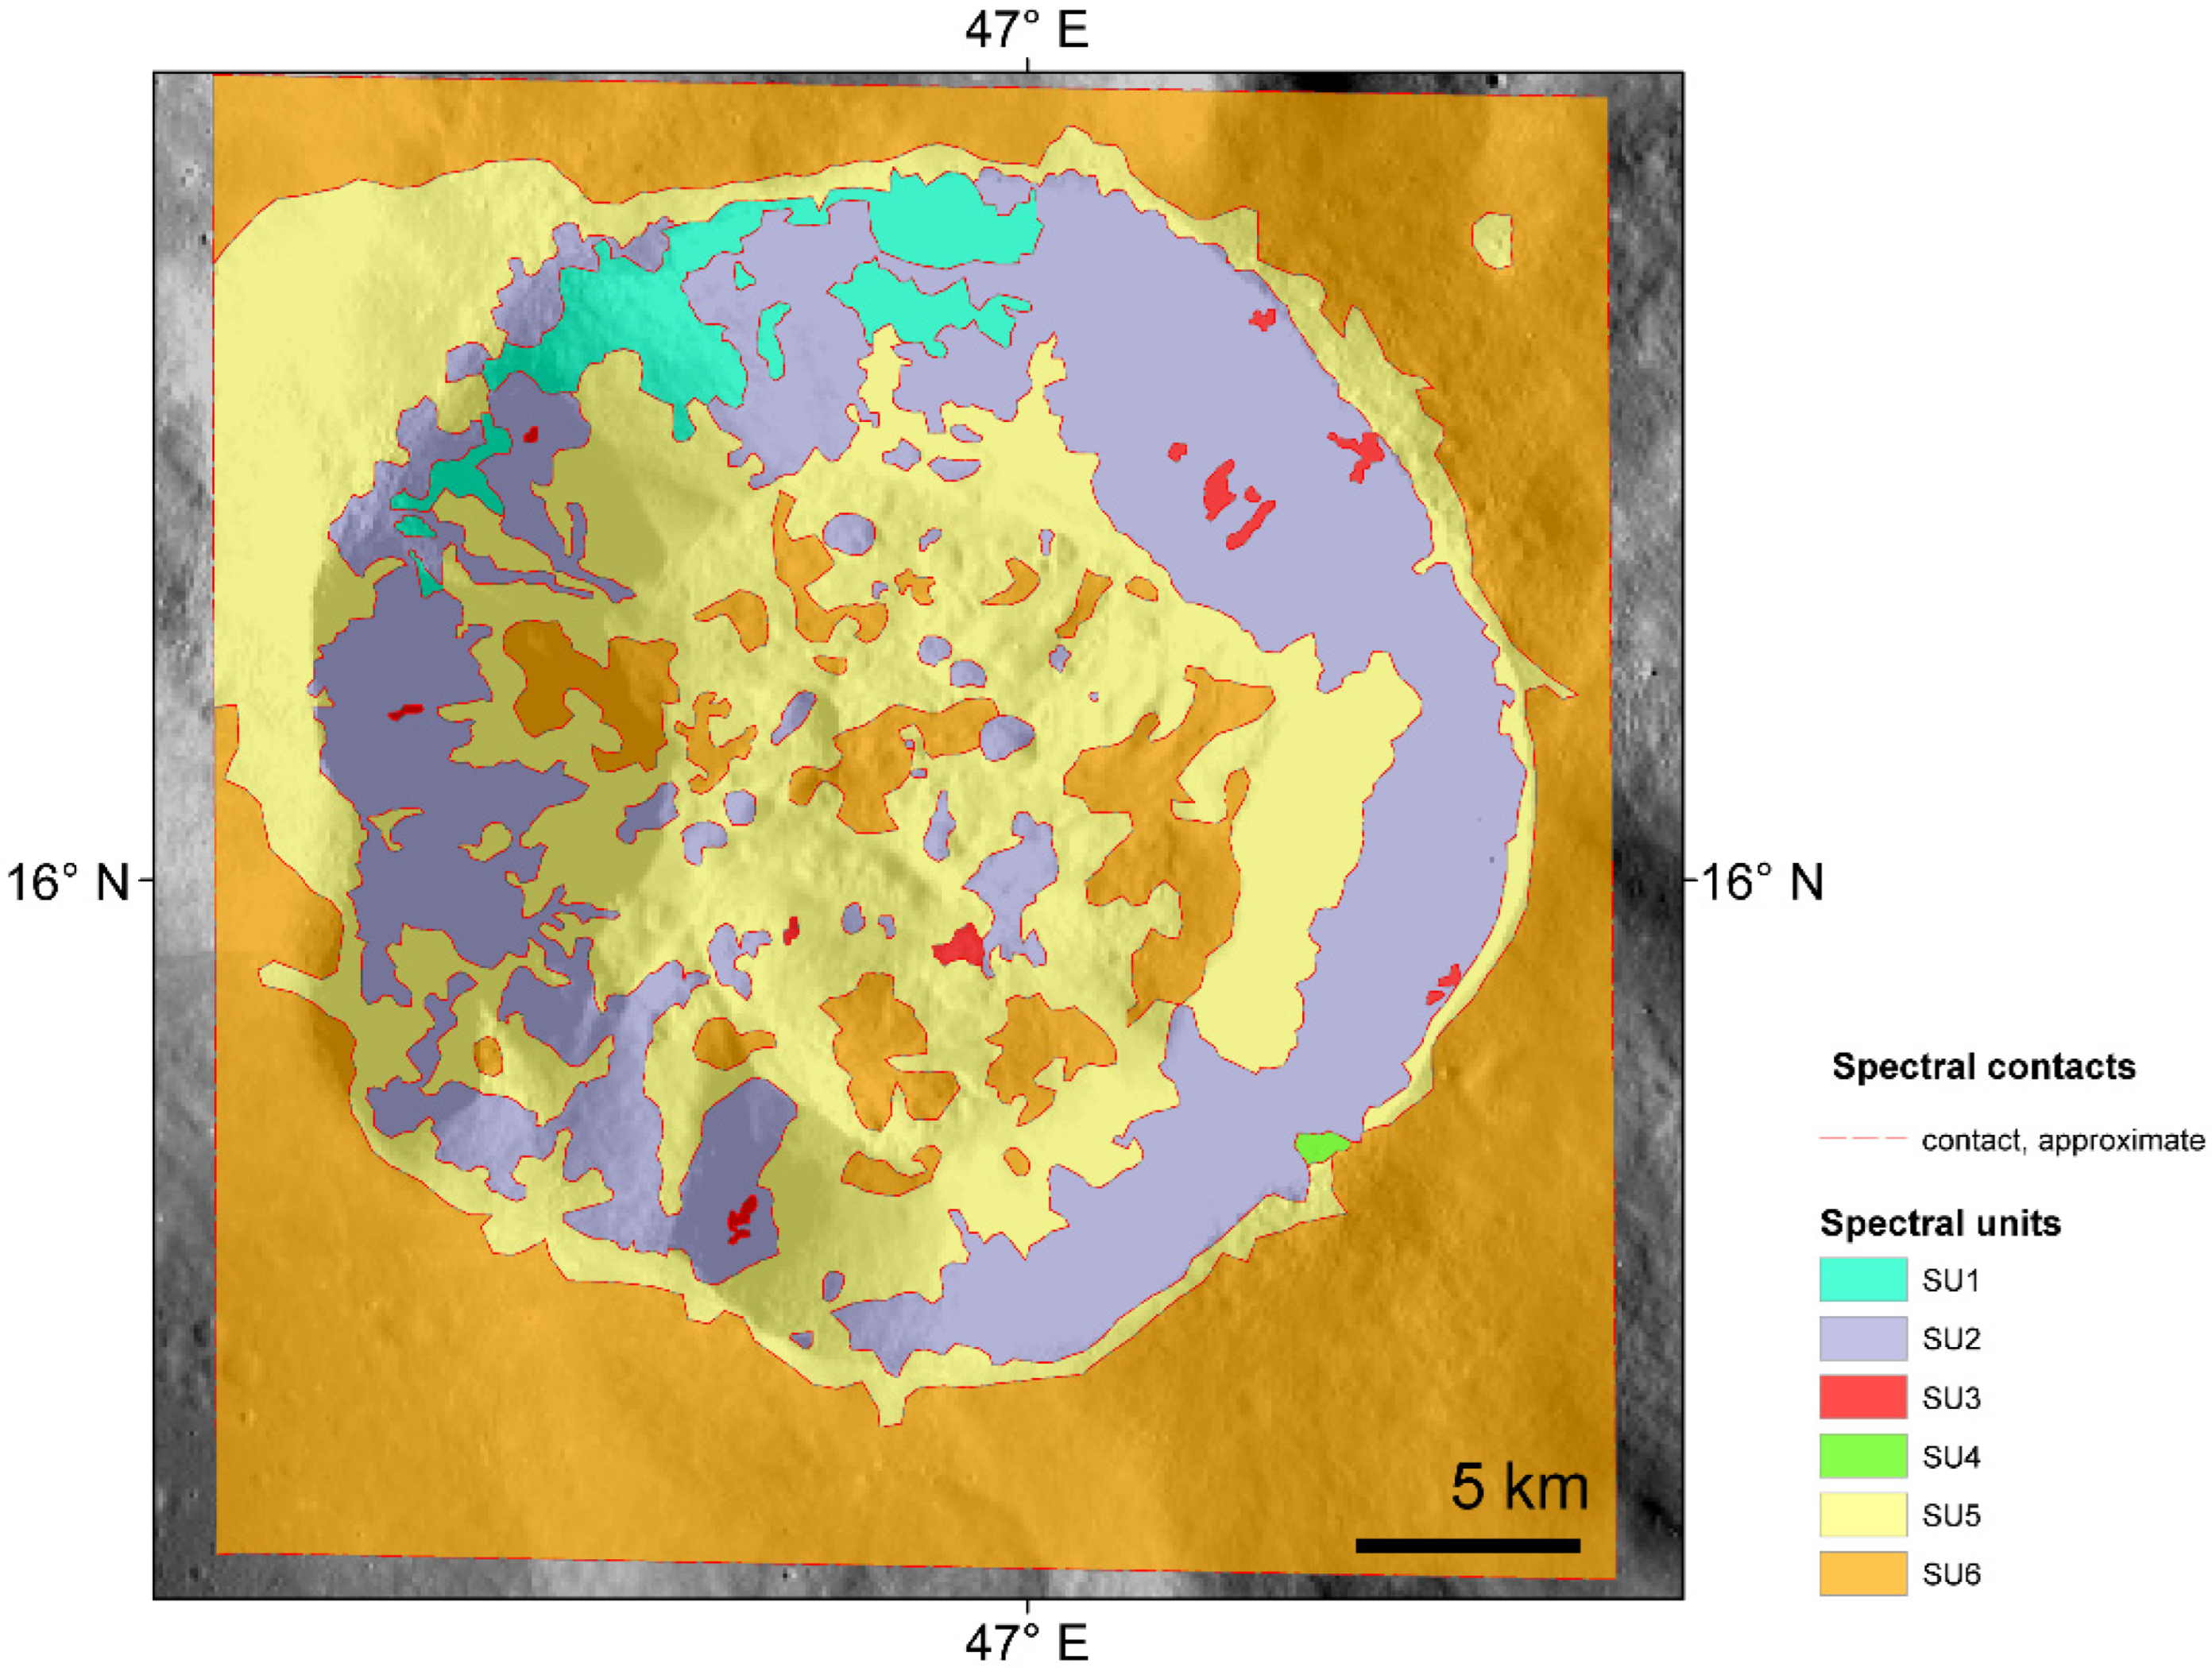
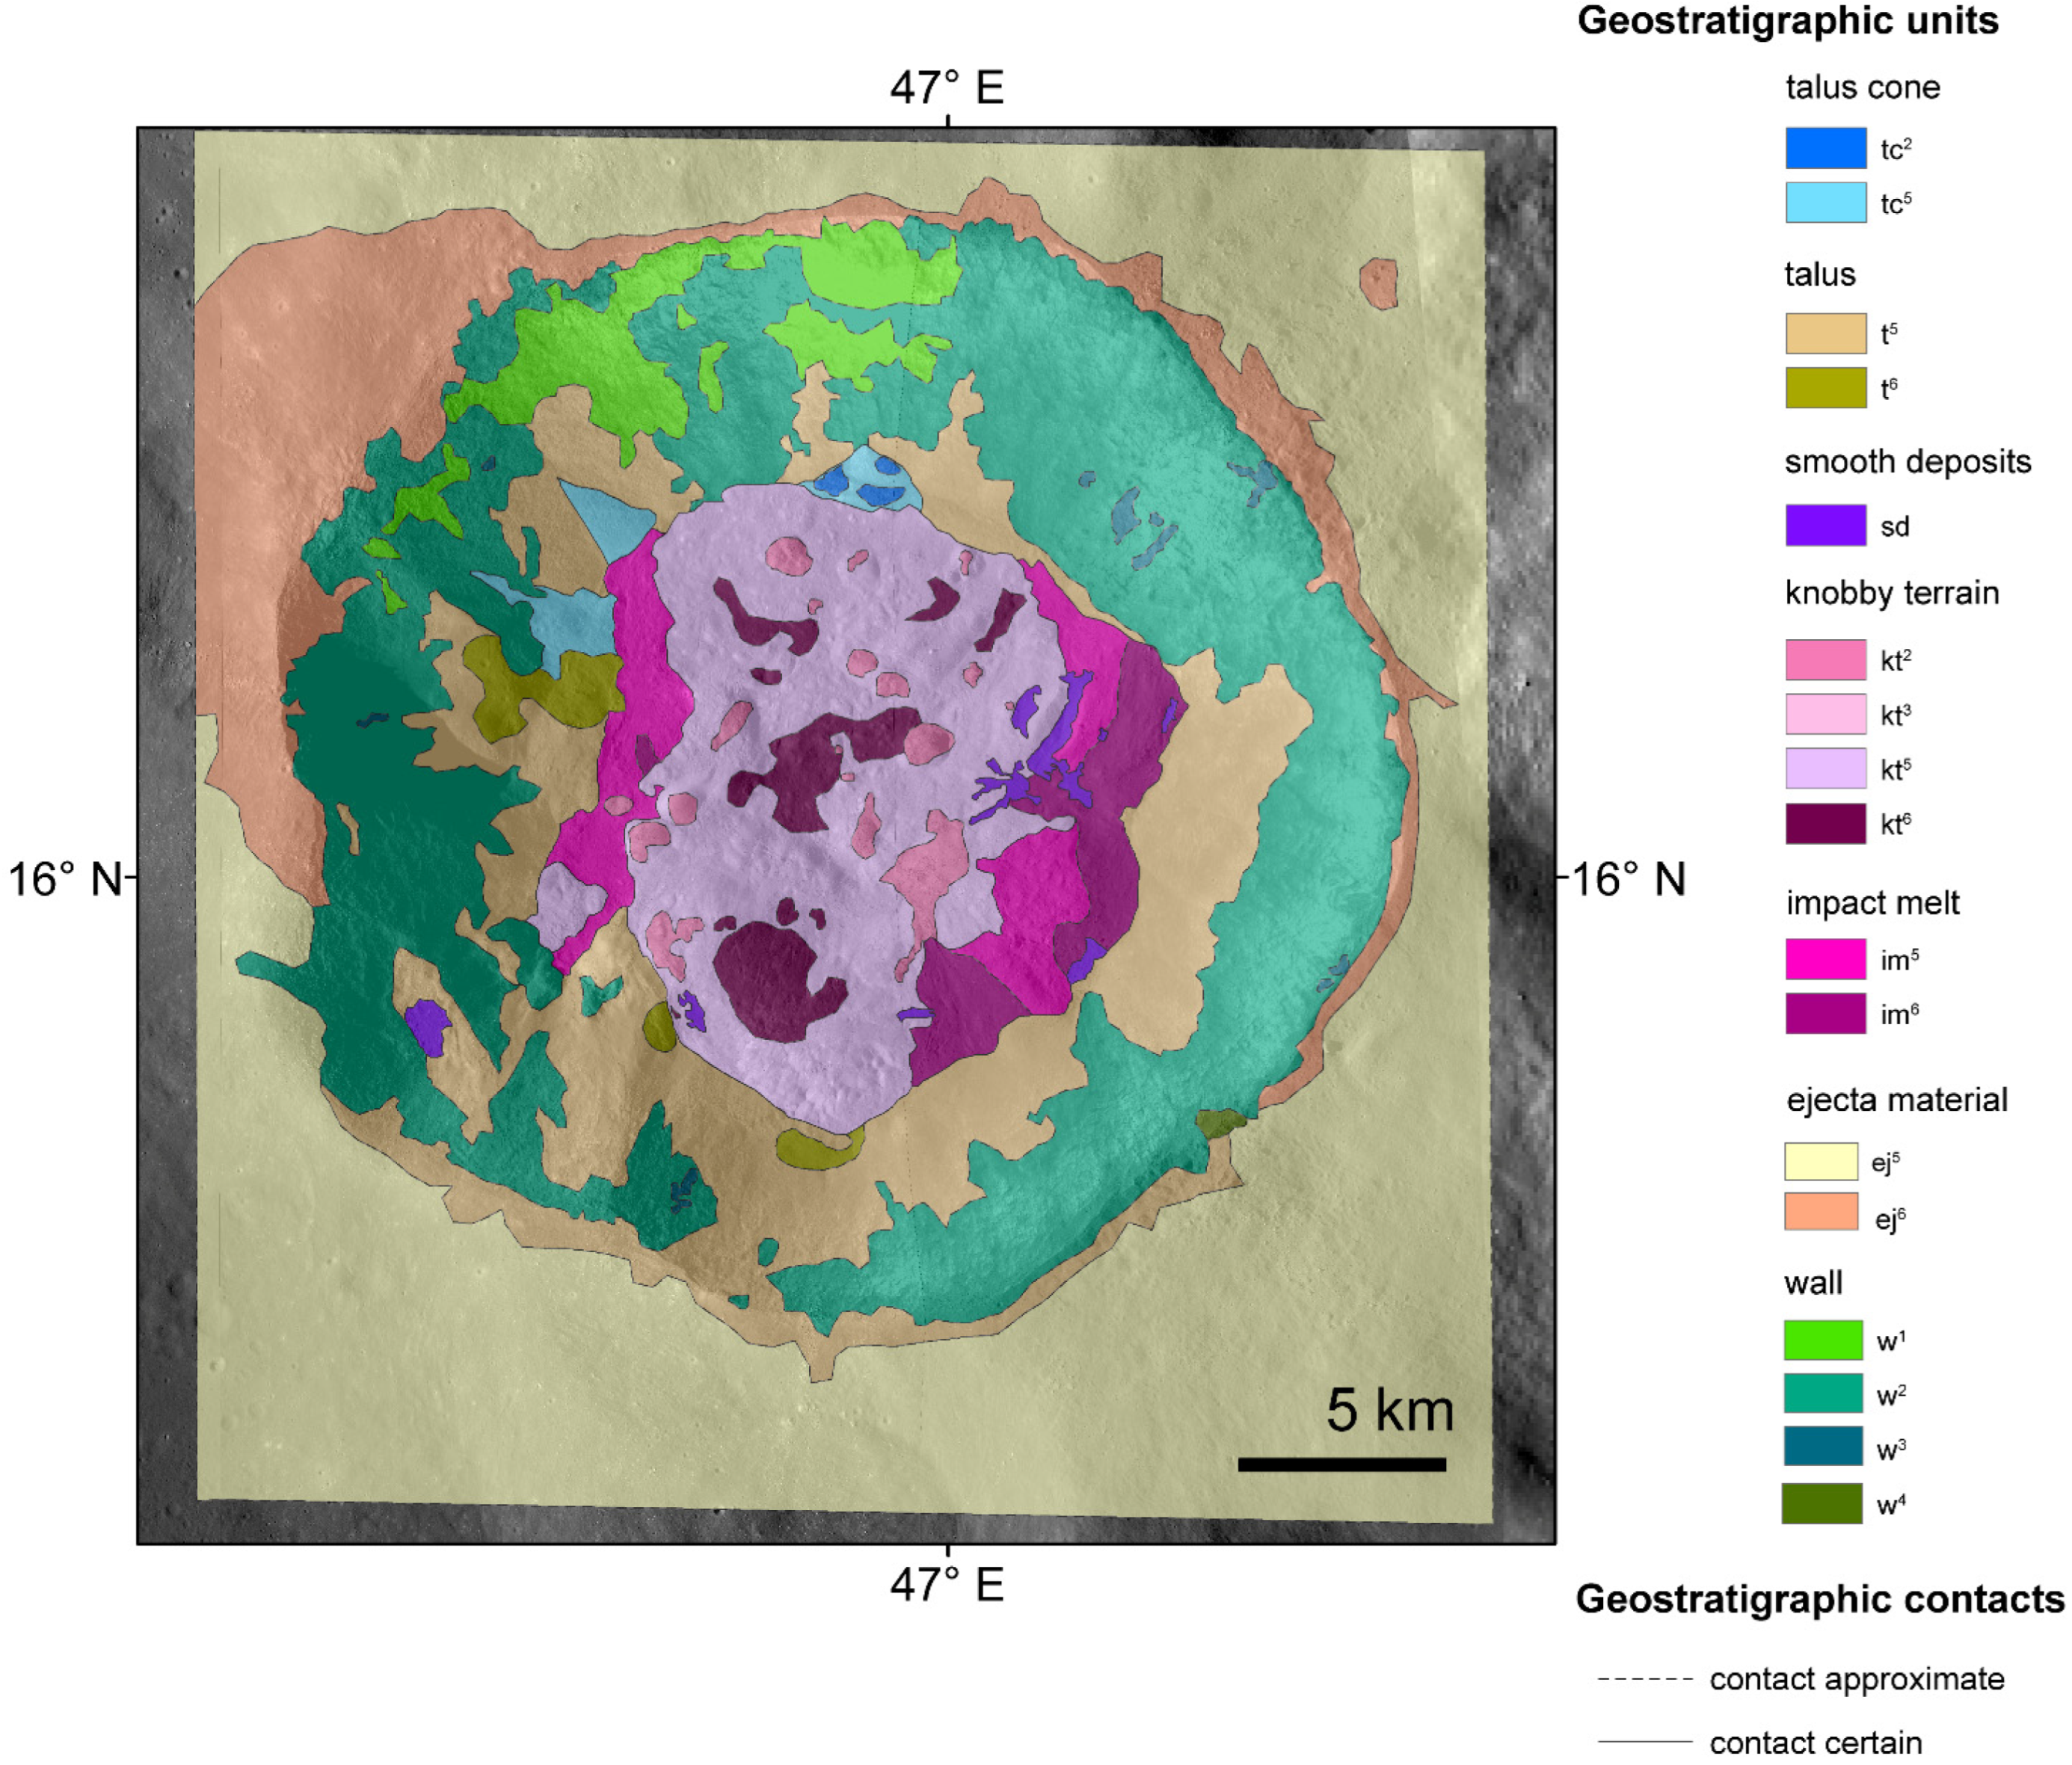
In order to compare the morpho-stratigraphic map (Figure 2b) with the spectral one (Figure 3) and produce the final geostratigraphic map, we digitalized the boundaries of the different spectral units using a linear feature that we called “spectral contact”. We decided to draw the contact as “approximate” since most of the spectral units did not exhibit a neat boundary. The different spectral units were named with SU followed by a different number, according to the work of [32]. Such digitalization (Figure 4) allowed us to obtain a clearer map that can be easily compared with the morphological one. For mapping purposes, we reduced the spectral units to the main 6 SU, taking into account the retrieved mineralogical information and affinity.
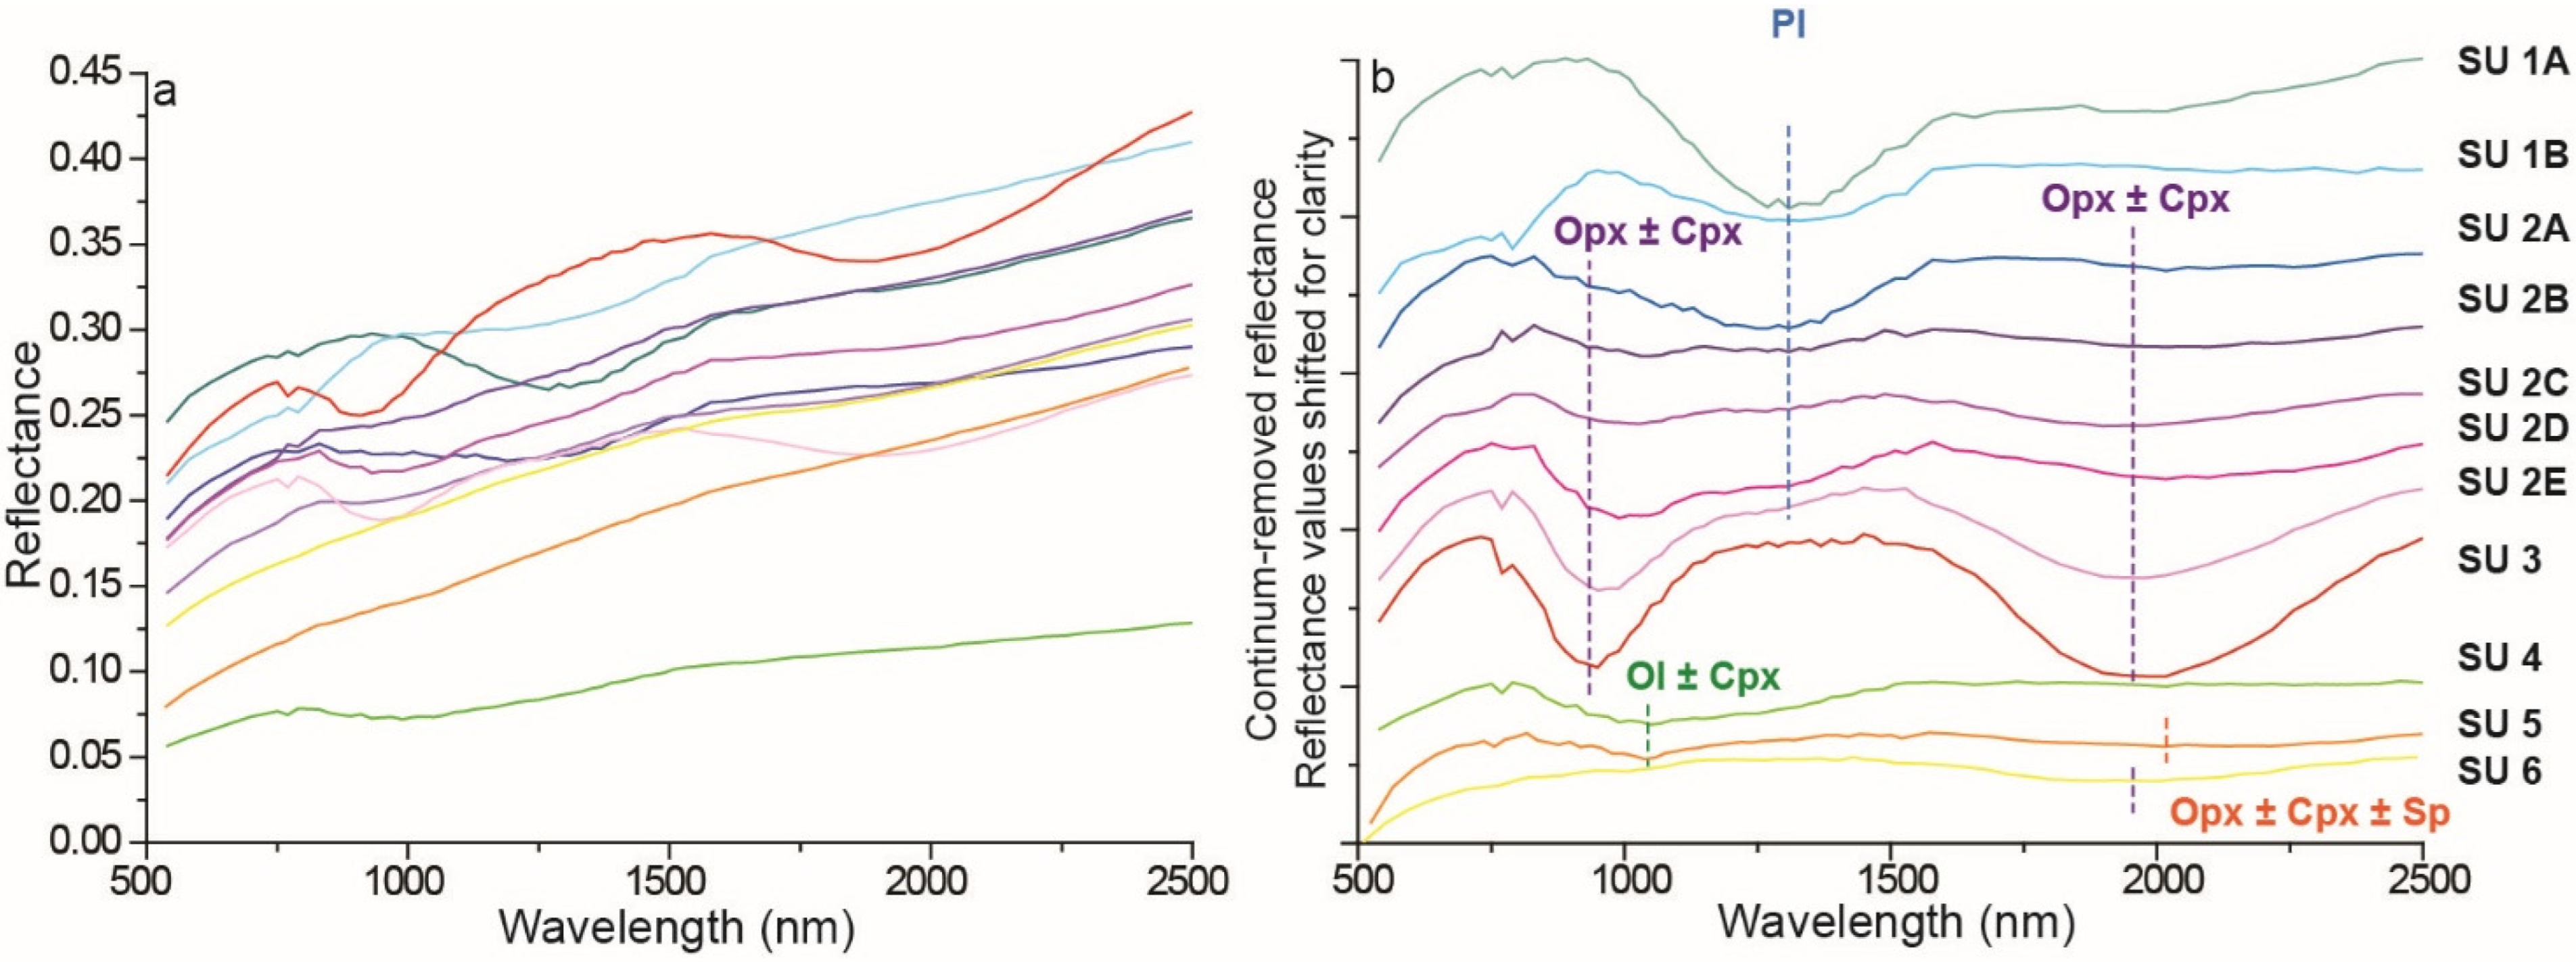
Figure 5. Reflectance (a) and continuum-removed (b) end-member spectra. Subunits 1A and 1B are characterized by an absorption band at ca. 1250–1300 nm; 2A–E show three absorption bands, around 1000, 1250, and 1950 nm, with variable relative intensity; C displays two absorption bands at ca. 950 and 1950 nm; D is characterized by a broad absorption at ca. 1050 nm; E is characterized by two absorptions, around 1040 nm and 2000 nm; and F is almost featureless, with a potential absorption around 1950–2000 nm. Pl is plagioclase, opx is orthopyroxene, cpx is clinopyroxene, ol is olivine, and sp is spinel.
Remotesensing 17 03786 g005
Subsequently, we overlapped geologic and spectral contacts in order to compile the geostratigraphic map of Proclus crater. The main goal of compiling the geostratigraphic map is adding as much information as possible to the original geomorphological map. Due to the high spatial resolution of the basemap (1 m/pixel) used for the geomorphological map, we kept the geological contacts as the main reference to build the geostratigraphical map, making them more robust. However, there were some cases where the spectral map allowed the distinction of units not discernible solely based on morphology. Therefore, to perform the final geostratigraphical map of Proclus crater, we first copied and pasted the geomorphological contact in the new map, then we added the spectral contacts. New geostratigraphic units were named after the geomorphological units followed by the number of spectral units, according to [3].
On the comparison between geomorphological and spectral units, the following three different cases have been observed, as already described by [3]: (i) the spectral and geomorphological contacts coincide; (ii) the spectral units are nested in the geomorphological ones and usually correspond to a boundary of a surface feature. In this case we created a subunit within the geomorphological units; and (iii) spectral contacts cut the geomorphological ones. In this circumstance we evaluated case by case how to proceed. As already pointed out above, since the spectral map has a lower spatial resolution than the geomorphological one, we generally keep geological contacts as main reference. However, in some cases, the spectral map highlights areas with different spectral behavior that helped us to better place contacts that, on the contrary, are blurred on geomorphological map. This is particularly evident for the crater wall, where spectral contacts frequently cut the morphological ones of both crater wall and talus units. On geomorphological map, the contact between these two units is approximate since the transition is gradual. The spectral map, instead, helped us to better discern regions where rocks are outcropping from the region where talus deposits are predominant. Therefore, in these cases we kept spectral contacts as references for the geostratigraphic units. However, there were cases where spectral units typical of rock outcrops (i.e., crater wall units) crossed over the region, characterized clearly by taluses on the monochrome mosaic. In this case, we keep morphological evidence as main reference.

3. Results

3.1. Geomorphological Map

The geomorphological map (Figure 2) highlights how the Proclus crater’s floor is dominated by impact melt. Indeed, three different units related to it have been distinguished and have been classified as follows: (i) knobby terrain, (ii) impact melt, and (iii) smooth deposits. Knobby terrain—it is located mainly in the center of the floor, and it includes terrain with a very irregular, knobby, surface. This is likely formed by the interaction between slumped material from the wall and fluid melt, and some terraces have been locally detected as a consequence of this movement. Impact melt: it has a rough texture and appears heavily affected by fractures, probably formed during the melt cooling. Smooth deposits: pond of impact melt with a very plain surface. The wall of Proclus crater shows several terraces, likely due to local collapses. Such collapses confer on the crater rim a lobate appearance. Further, Proclus’ walls are affected by gravitational deposits, that have been classified as (i) talus and (ii) talus cone. Talus is generally constituted by fine materials that are uniformly located all along the foot of the walls. They are interpreted as rockfall material deposits resulting from the erosion of the adjacent cliffs. Talus cone: talus material that forms a conical pile at the base of the wall. Although taluses are predominant, some outcrops of rocks are still visible on the crater wall. Locally, these outcrops show stratification. The boundary between wall outcrops and talus is usually blurred.

3.2. Spectral Map

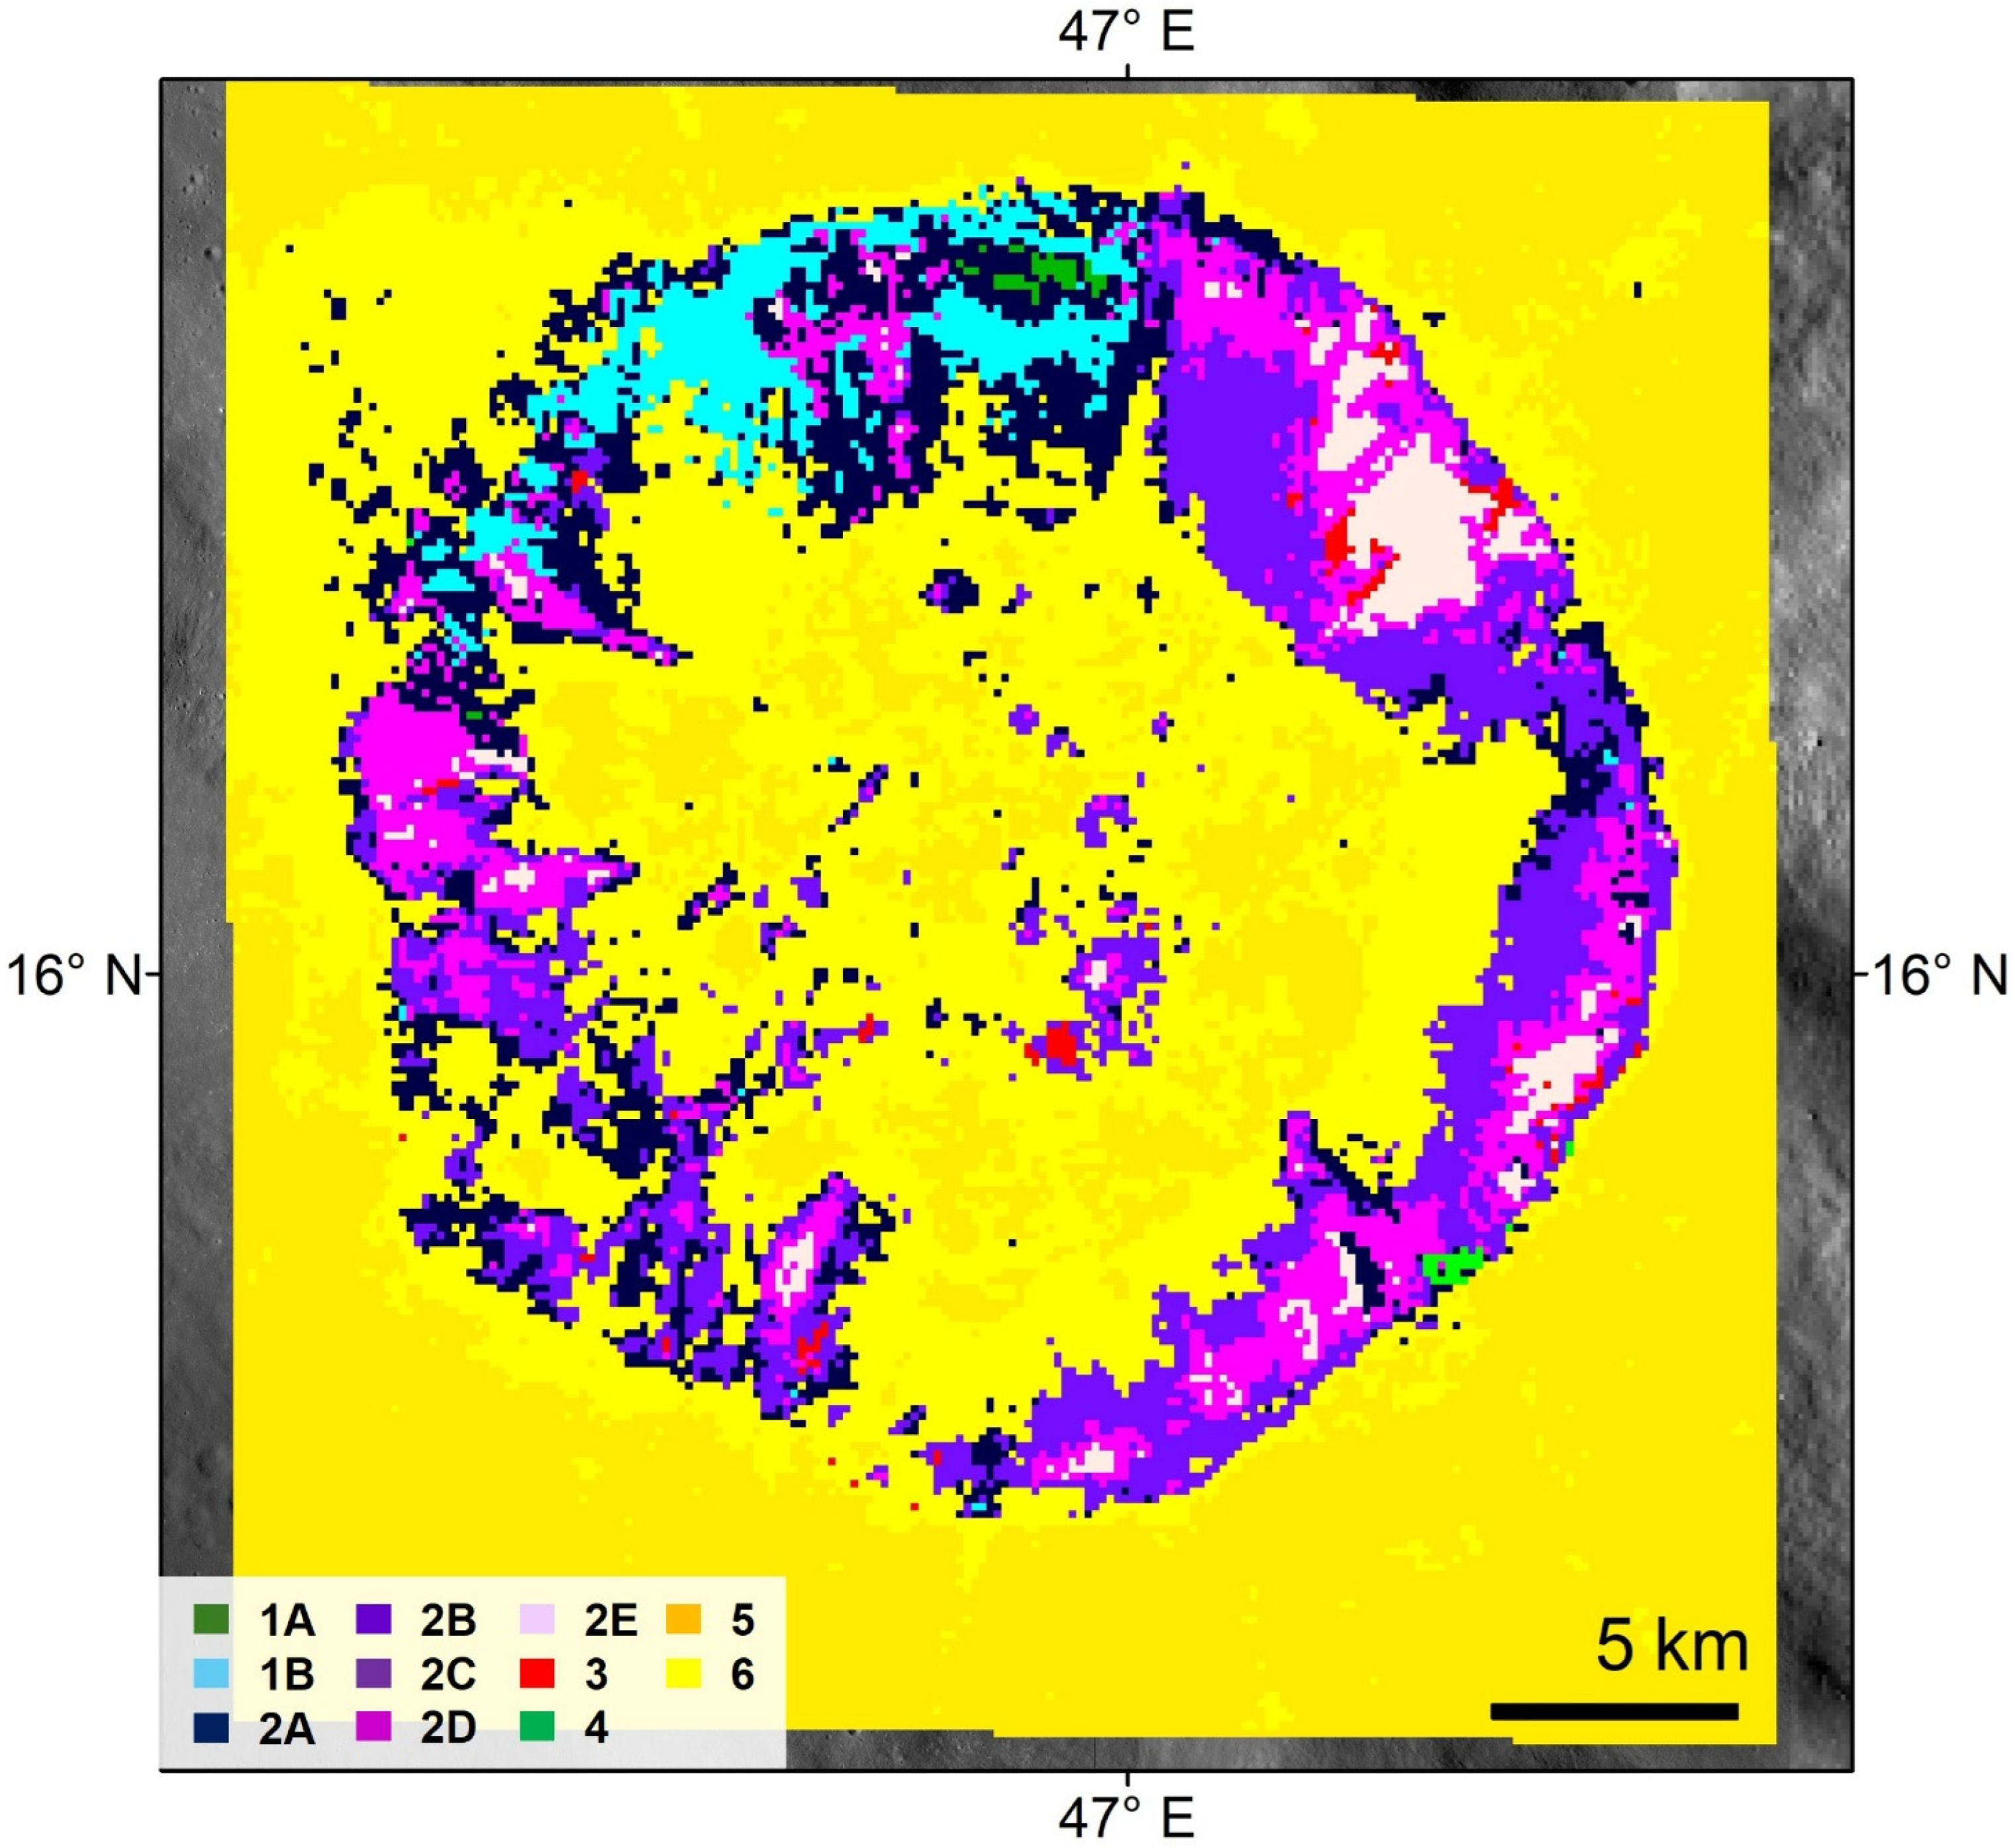
Figure 3 shows the SAM results highlighting the areal distributions of the different mineralogical associations present in Proclus. We retrieved six main spectral units, with two of them that could be divided into subunits. SU1 is located in the north wall (Figure 3), and it is characterized by 2 sub-SUs, 1A and 1B, associated with plagioclase dominated material, with variable composition (see Section 3.3). SU2 is widespread in the wall (Figure 3), and we divided it into 5 sub-SUs, which required variable amounts and compositions of pyroxenes (see Section 3.3). SU3 is limited to small areas in the wall, with main exposure on the northeast side, closer to SU2D and SU2E, and in the floor, mainly dominated by low-Ca pyroxene, and SU4 is in few defined and restricted regions with spectral signatures compatible with olivine (the biggest exposure is in the SW wall; smaller appearances are also in the W wall and in the floor). Unlike other units, SU5 dominates in the crater floor, around the rim, and on the NW proximity ejecta. This unit shows weak mafic absorption, dark spectra, and a red slope. SU6 characterized the ejecta and part of the floor, with red and almost featureless spectra.

3.3. Mineralogical Analysis

In general, the spectra are characterized by a similar red slope (i.e., the reflectance increases from the VIS to NIR spectral region, Figure 5a), which is often suggested to be due to space weathering and accumulation of metallic nanophase iron (e.g., see recent revision in [33]) over time. SU1 and SU4 are slightly bluer than the others.
Nevertheless, specific absorption features are clearly recognized for spectral units 1, 2, 3, 4, and are weaker on 5, whereas SU6 is almost featureless with a weak absorption at longer wavelengths (around 2000 nm) (Figure 5b). In detail, we saw that:
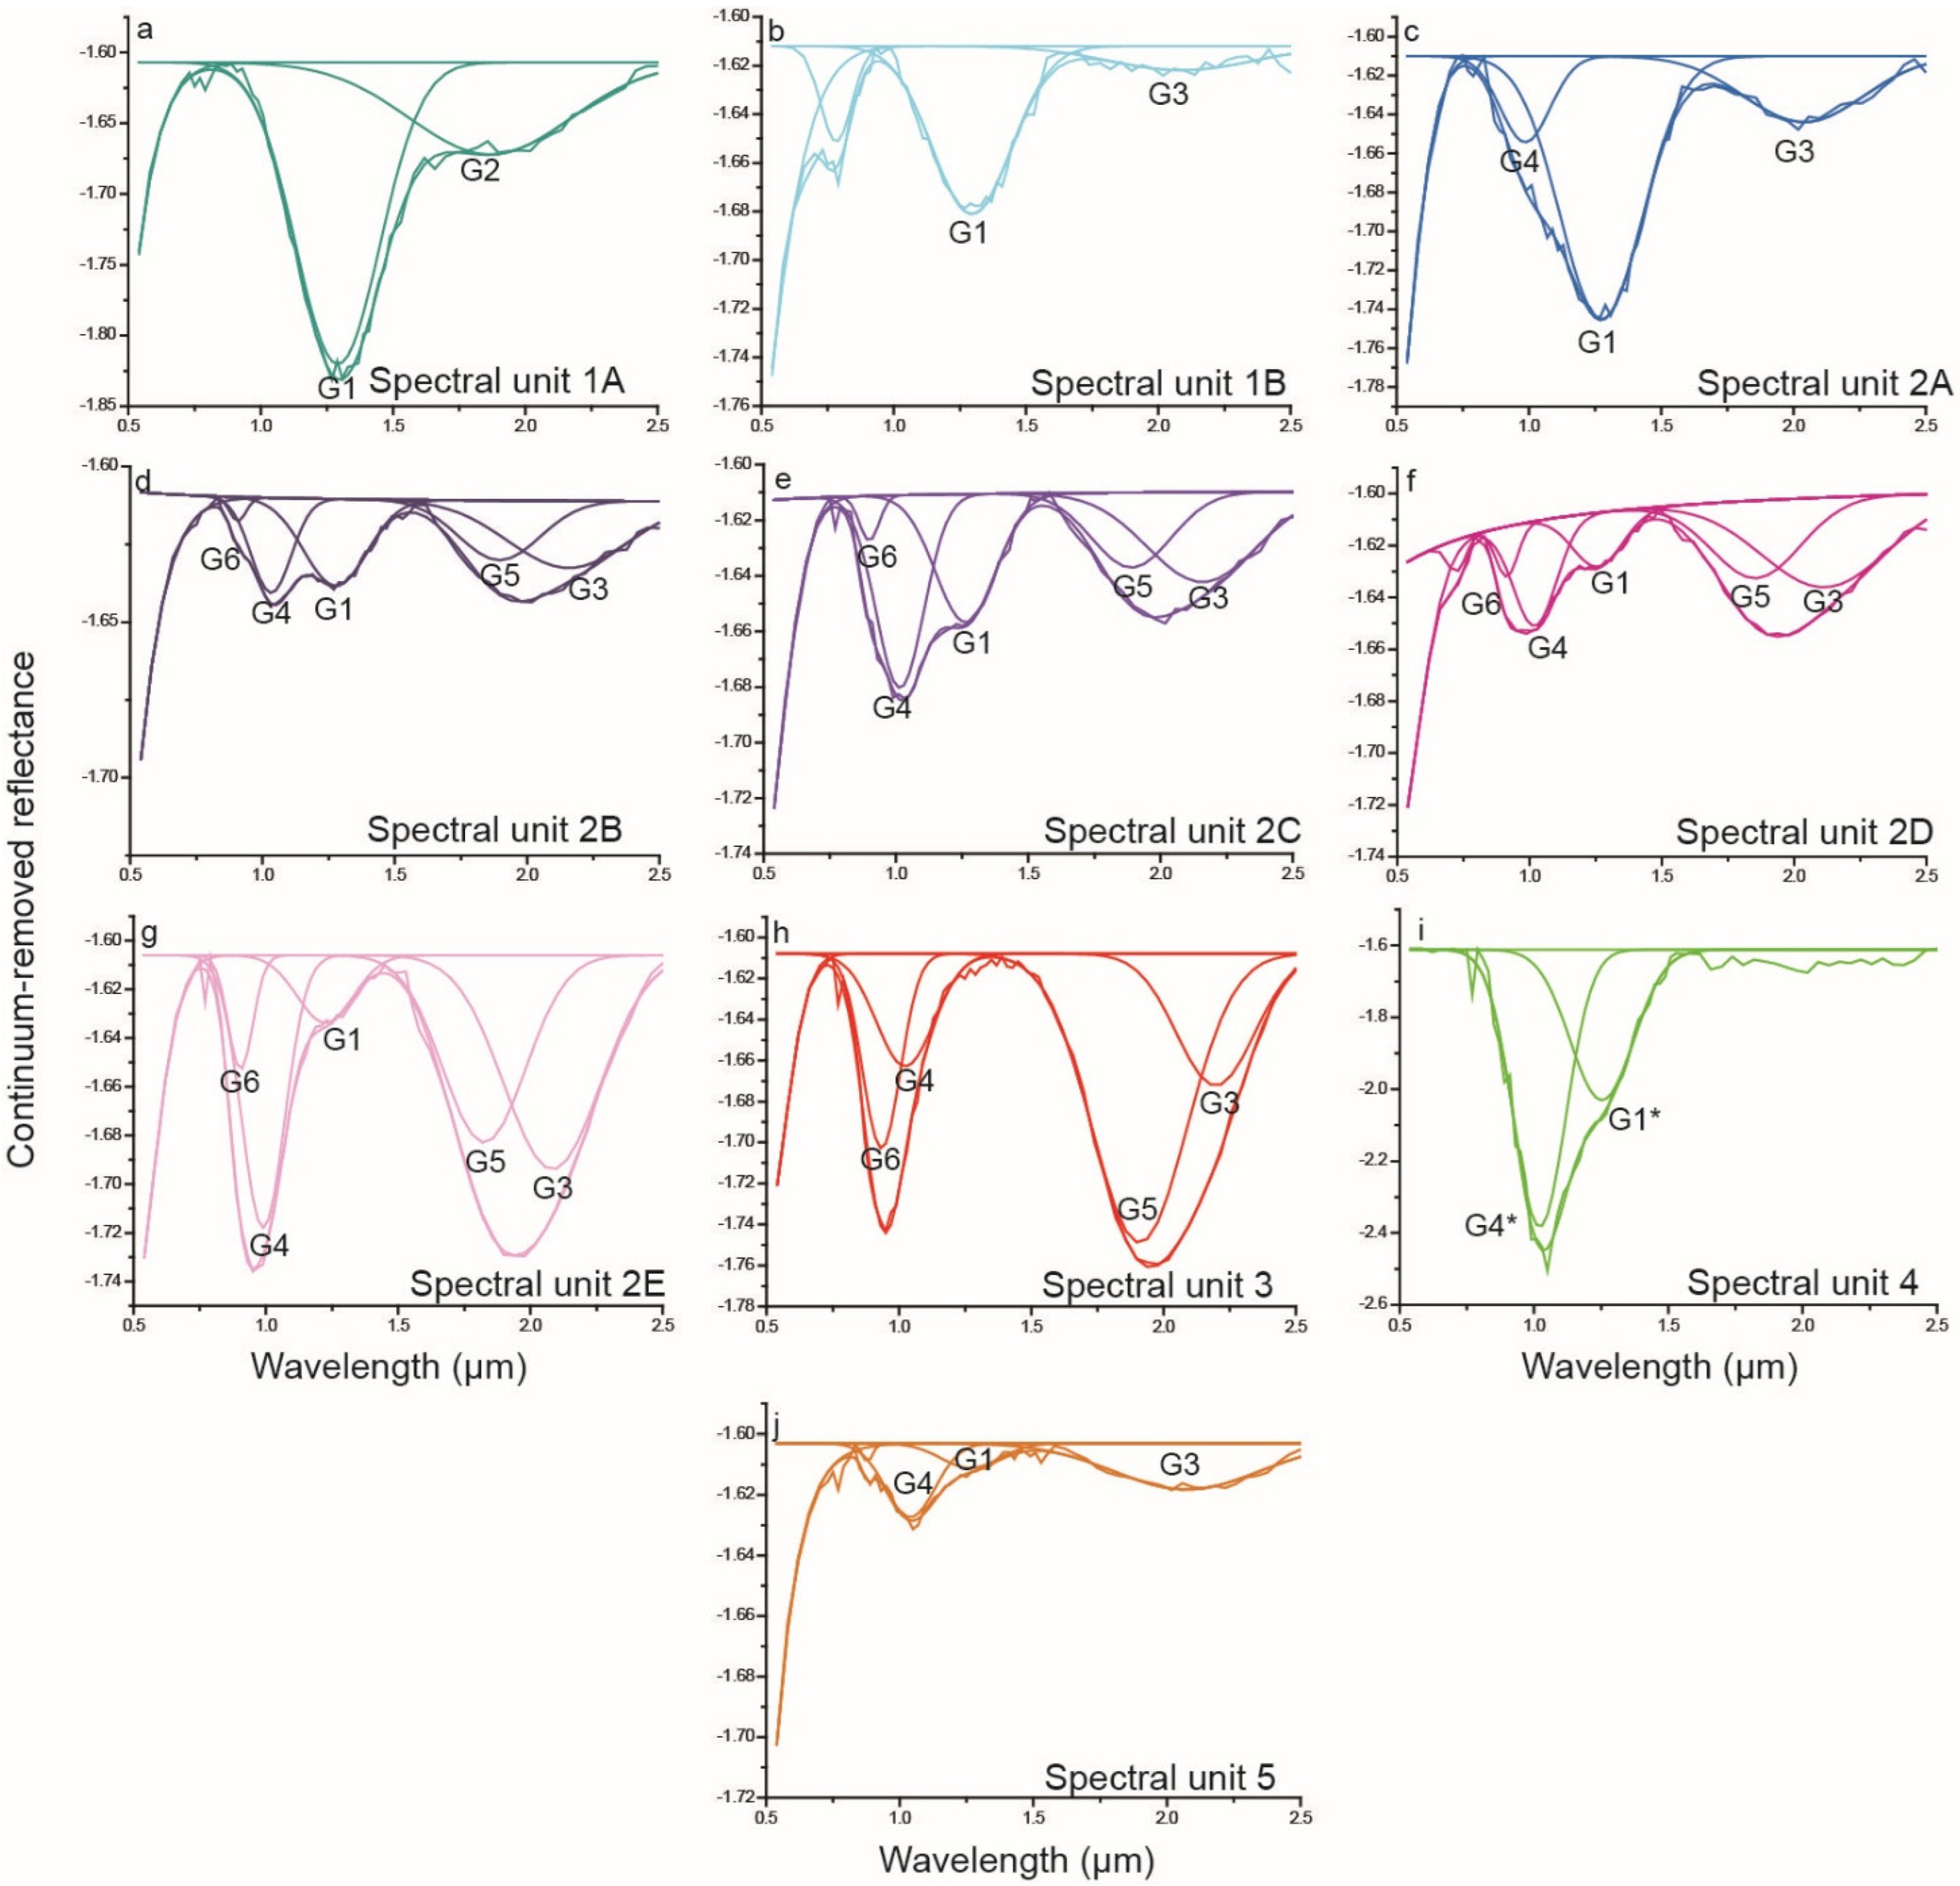
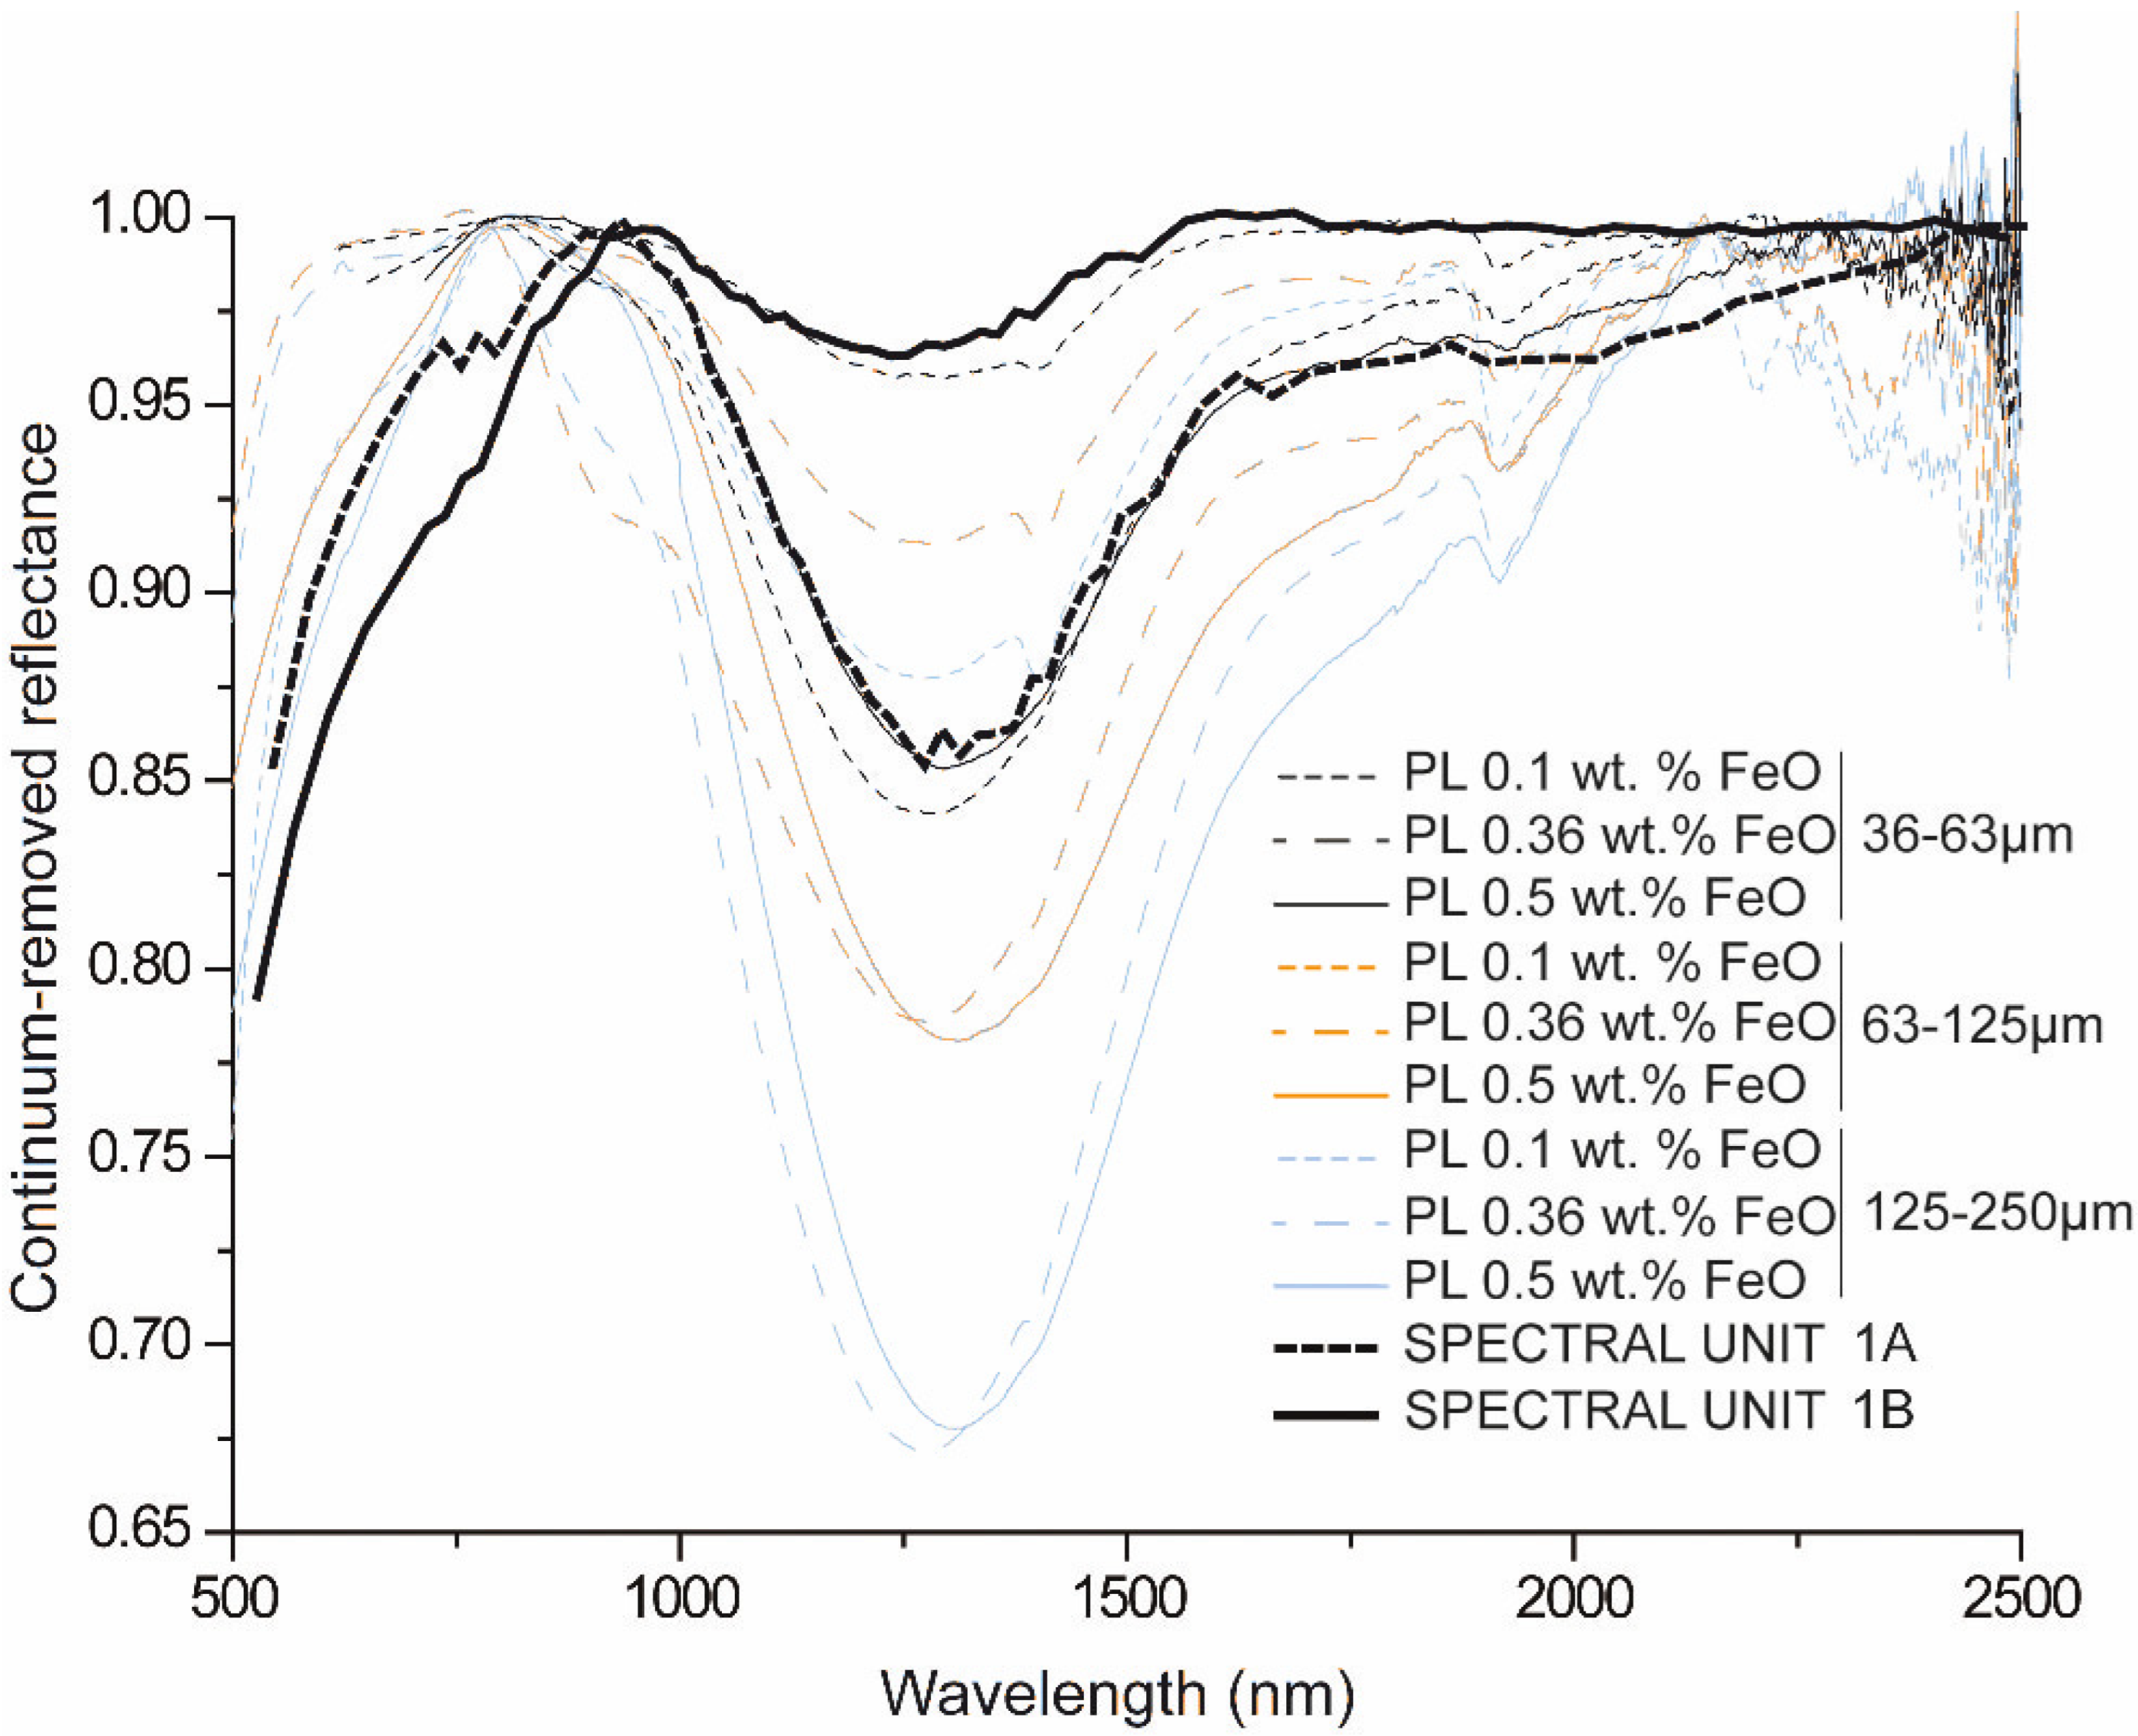
(1) Spectral unit 1 is characterized by a wide absorption with a band center around 1300 nm, more asymmetrical in unit 1A than 1B. The absorption is deconvolved by G1 at 1290 nm and G2 at 1860 nm in SU 1A, whereas in 1B the second absorption is shifted at a longer wavelength of 2090 nm (G3) (Figure 6a,b). G1 has been attributed to the Fe2+ transition in the plagioclase crystal structure; G2 in spectral unit A1 can be compared to the 1800 nm band described by [25,34,35], also suitable with iron in the plagioclase. G3 is shifted towards longer wavelengths with respect to G2 and can be attributed to low amount of pyroxene, probably augitic in composition [22,23]. The comparison with iron-bearing terrestrial plagioclase (Figure 7) shows a deep absorption comparable with a plagioclase characterized by 0.5 wt.% FeO for SU 1A, while spectral unit 1B is very similar to a plagioclase with 0.1 wt.% FeO.
(2) Spectral unit 2 is characterized by composite absorptions deconvolved with three Gaussians (SU 2A) or 5 (SU 2B–E). In Figure 6c–g we see how the absorptions are changing the intensity and partially shifting. These Gaussians allow the identification of pyroxenes and plagioclase, and their different combinations permit the recognition of five compositional subunits. All the subunits of SU2 are decomposed with G1, centered at 1250–1290 nm. Unit B1 also show the G4 and G3 centered at 986 nm and at 2039 nm, respectively, and attributable to pyroxene compositions. The presence of relatively abundant pyroxene suggested we separate this unit from SU1 and integrate it into SU2. All the other SU2s need four Gaussians to deconvolve pyroxene absorptions: G6 centered around 900 nm, G5 between 990 and 1033 nm, G3 centered around 1850 nm, and G4 around 2100 nm. These Gaussians have been attributed to the Fe2+ transition in the M2 site of orthopyroxene (G6 and G5 [36]) and clinopyroxene (G4 and G3, e.g., [22,23,36]).
To compare with terrestrial mineral mixtures, we investigated a parameter defined as band depth ratio as follows:
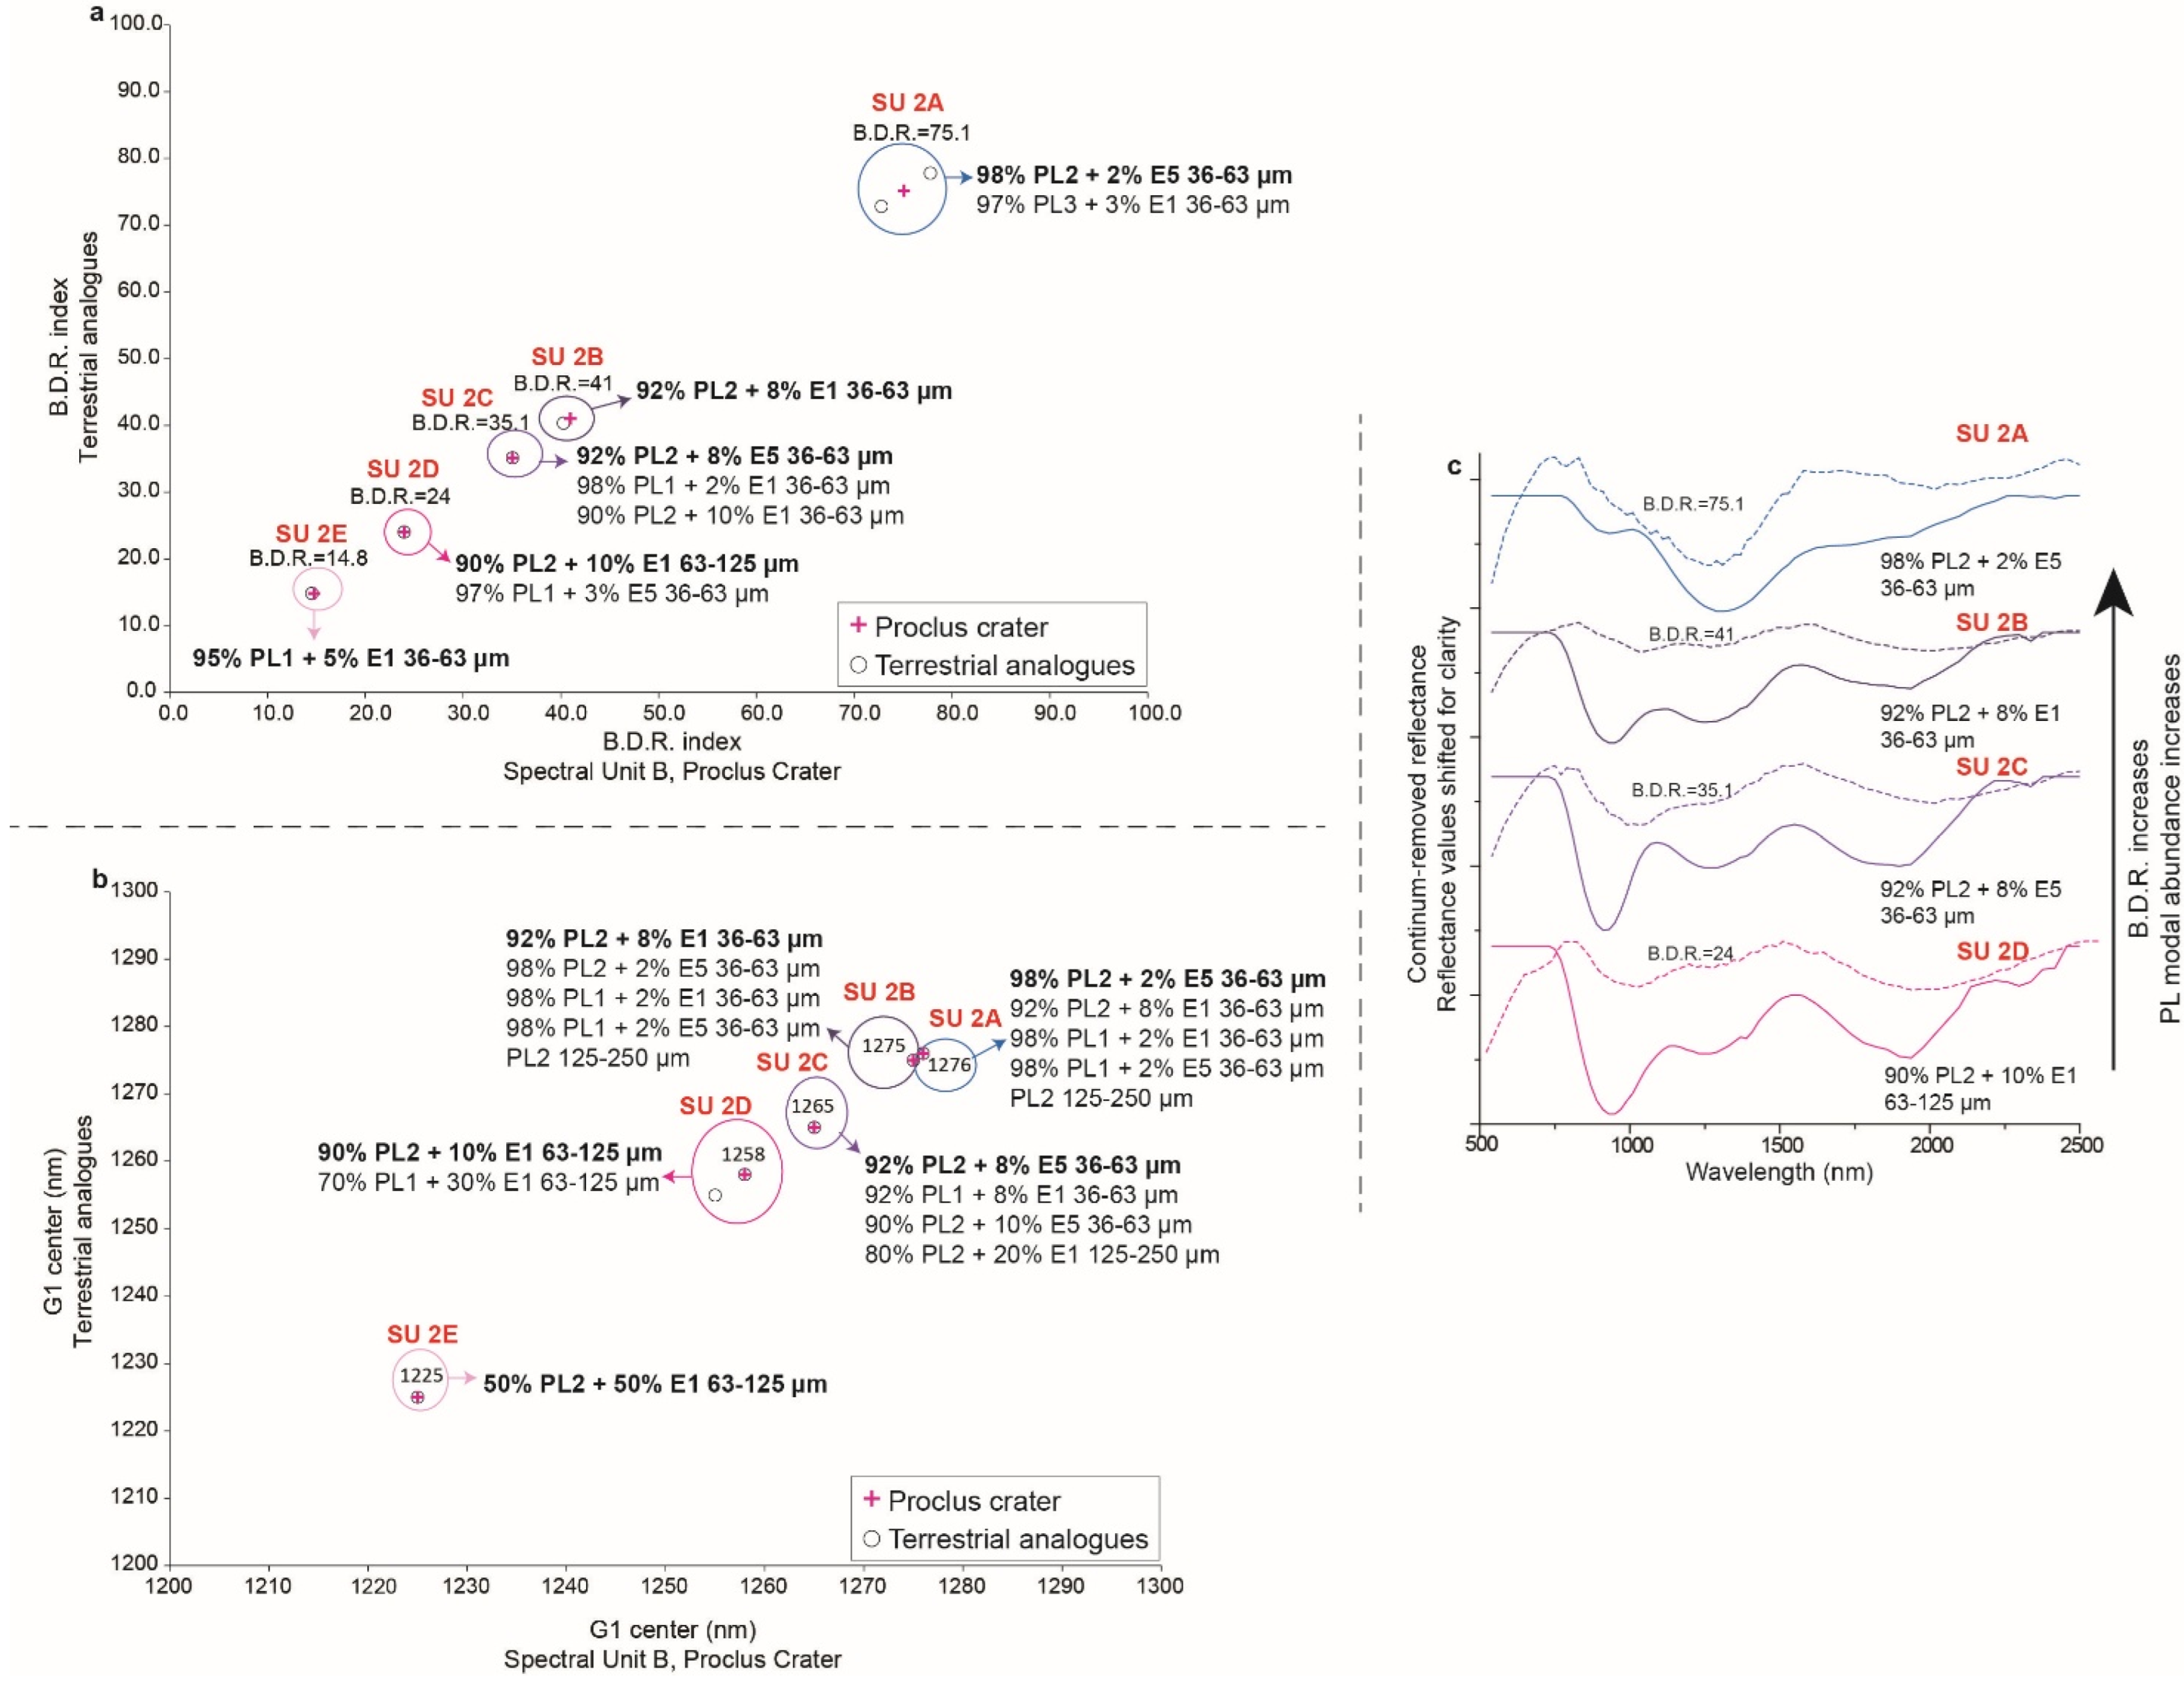
B.D.R. = 100 × (G1 B.D. × 1/(G1 B.D. + G6 B.D. + G4 B.D.))
This parameter avoids the influence of several factors that affect the absolute values of the intensity (e.g., presence of variable grain sizes or minor abundance of opaque phase), but compare SU, characterized by the presence of variable pyroxene composition and abundance, with respect to the plagioclase, using laboratory data from systematic mixtures [26,30,31,37]. Those mixtures are characterized by variation in relative abundance from three different plagioclases and five different mafic assemblages at variable grain sizes. The results indicate a best fit attributed to different plagioclases (even if the more frequent is a plagioclase intermediate in iron, PL2 FeO 0.36%; see [30]) and alternative E1 and E5 mafic endmembers. E1 is a pyroxene assemblage with 43.9% clinopyroxene (En45-Wo46) and 56.1% orthopyroxene (En77), whereas E5 is an orthopyroxene (En82) (see [26,30]).
B.D. is defined as the depth of each Gaussian after MGM deconvolution. B.D.R. increases progressively from spectral unit 2E to spectral unit 2A, thus revealing an increase in plagioclase abundance (Figure 8a).
In Figure 8c are reported the M3 spectra (dashed lines) and relative best analogs (solid lines, from, [26,31]) with closer B.D.R.
Band position is directly related to chemistry (i.e., Fe2+ in crystal lattice); however, considering composite bands, the variation in the mineral modal abundance can induce Gaussian shifts related to the neighbor, weaker absorptions. Therefore, the plagioclase G1 center can shift with the relative plagioclase abundance (see [26,30,31]). In SU2, G1 center shifts towards longer wavelengths from spectral unit 2A to spectral unit 2E, in accordance with the B.D.R index.
(3) Spectral unit 3 is decomposed with four Gaussians: G6 and G4 centered at 934 and 1024 nm to describe the 900 nm band and G5 and G3 centered in 1909 and 2197 nm fitting the 1900 nm band (Figure 6h). These Gaussians have been attributed to the Fe2+ transition in the M2 site of orthopyroxene (G6 and G5 [36]) and clinopyroxene (G4 and G3 [22,23,36]).
Comparing SU3 with pyroxene studied in the literature (e.g., [20,22,23,26,30]), we observed a good match for the band center in Figure 6a, although the spectral contrast (i.e., absorption band depth) is very different and reduced in lunar spectra. Conversely, in SU 2 the 1250 nm band due to plagioclase is missing (Figure 6h), but reflectance is comparable to SU1.
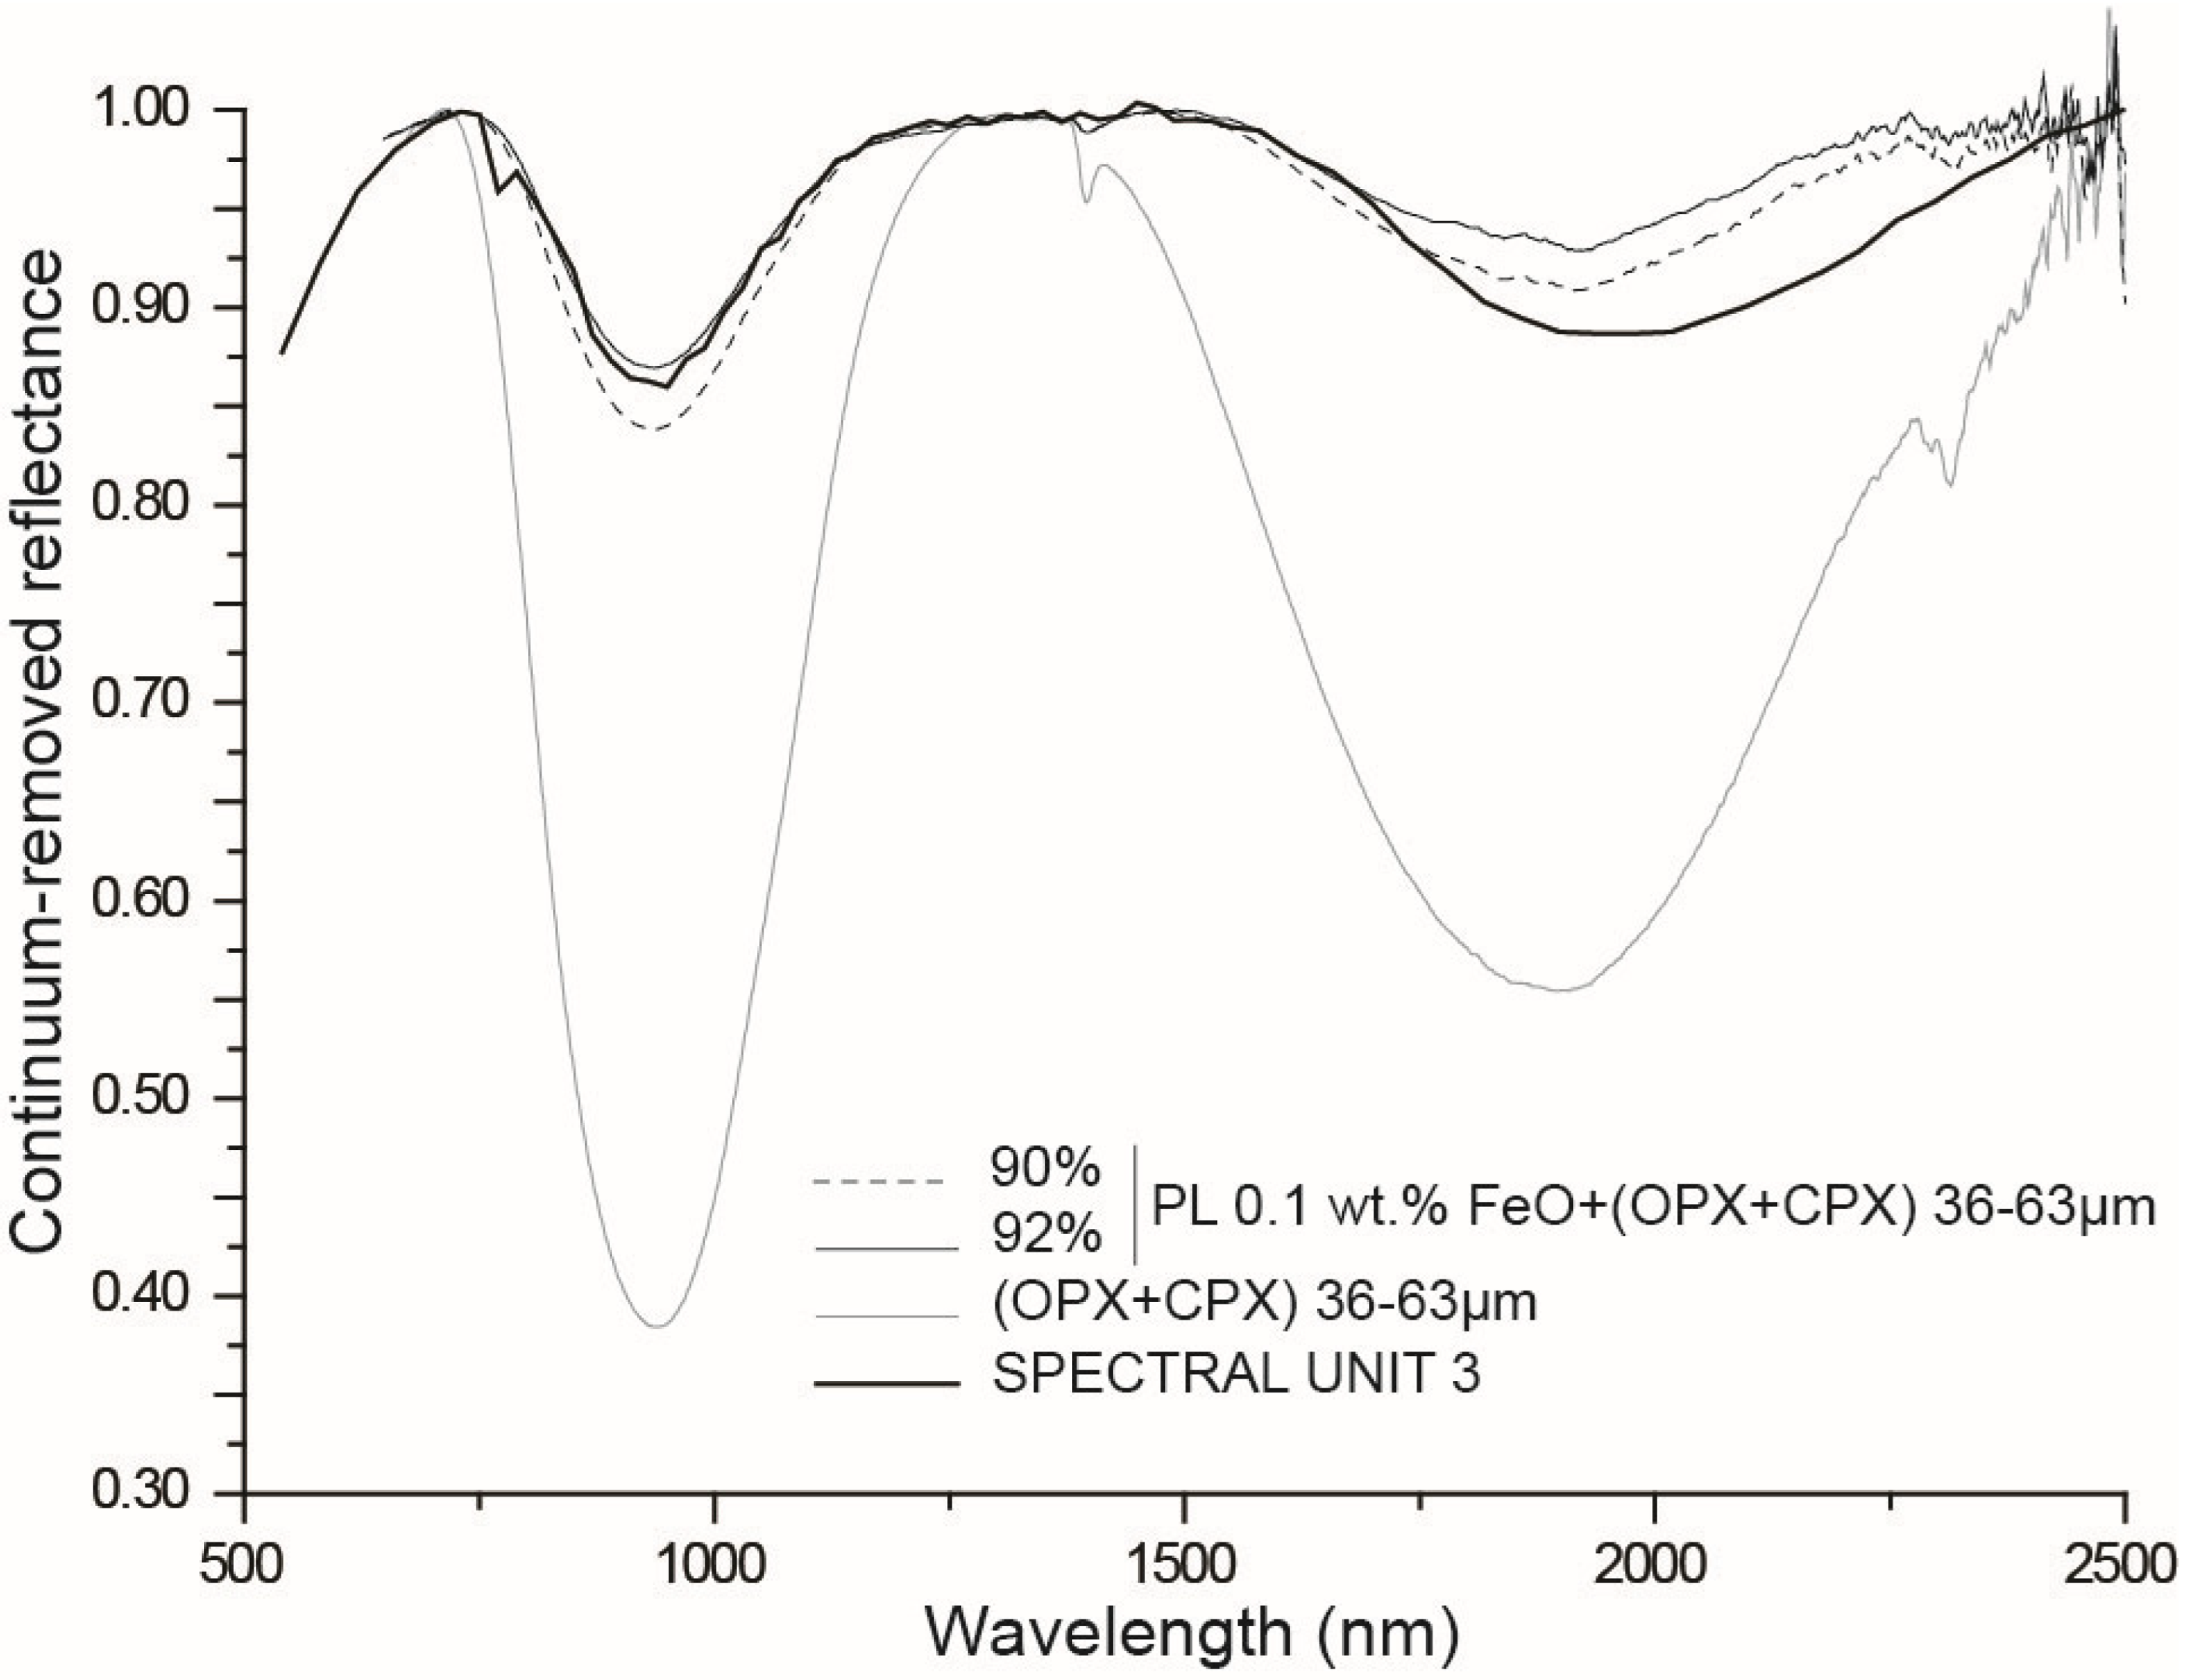
The pyroxene-like absorption bands of SU3 show a reduced depth compared with the pyroxene endmember and the absence of a Gaussian distribution to be associated with plagioclase (Figure 9), which could agree with [31]. In fact, Ref. [31] demonstrated how the spectrum acquired on a mixture composed of 90% iron-poor plagioclase and 10% orthopyroxene-clinopyroxene mixture does not show the retrieved plagioclase band at 1250 nm. Nevertheless, spectrum in Figure 9 shows a 2000 nm band deeper and shifted at a higher wavelength than expected: this may imply the presence of a relatively low abundance of minerals such as Mg-spinels [25]. Ref. [38] also showed how the presence of spinel (i.e., chromite) shifts the pyroxene 2000 nm band towards longer wavelengths. Thus, spectral unit 3 could be interpreted as a mixture of plagioclase, pyroxene (orthopyroxene and clinopyroxene), and probably a low abundance of spinel.
(4) Spectral unit 4 has been deconvolved with 2 Gaussians, G4* at 1021 nm and G1* at 1253 nm, whereas this unit does not show absorption at 2000 nm. This evidence associated with the 1000 nm absorption offset at longer wavelengths with respect to SU 2 and 3, G4* and G1* have been attributed to Fe2+ transition in M2 and M1 of olivine. However, here we need only two Gaussians to model the absorption. Conversely, in the literature (e.g., [21,27,28,39]), where olivine is MGM deconvolved with 3 Gaussians due to the Fe2+ transition in the olivine M1 and M2 site [36]. We suppose that G4* accounts for the olivine absorption band 1 (Fe2+ in M1 site) and band 2 (Fe2+ in M2 site), while G1* is the olivine band 3 (Fe2+ in M1). Conversely, continuum removed spectra of olivine-bearing mixtures can be compared with SU4 spectrum (Figure 7 (e.g., 92% plagioclase 0.1 wt.% FeO and 8% olivine, from [31]), in this case G1* can be considered the expression of a composite band of plagioclase and olivine (see [26,30,31]). Further, Ref. [31] demonstrated how the Gaussian fitting the olivine band 1 is not required increasing the content of a different phase than olivine in the mixture (plagioclase in their case). Furthermore, Ref. [28] highlighted as the MGM fitting of the 2 Gaussians at lower wavelengths could have unexpected behavior with respect to the case of single olivine fitting. In addition, the SU4 is the darker unit, suggesting the presence of an opaque mineral. Ref. [40] suggested as adding a dark phase, such as an iron-oxide, to a mafic mineral causes a reduced spectral contrast and a decreased reflectance. So, SU4 could be interpreted as a mixture of olivine and another rock forming phase, a darker material, such as an oxide.
(5) Spectral unit 5 is deconvolved with three Gaussians, G4 at 1040 nm, G1 at 1265 nm and G3 at 2064 nm. G4 and G1 can be attributed to the Fe2+ transition in clinopyroxene and plagioclase, respectively. However, if G4 is attributed to clinopyroxene, G3 should be shifted toward longer wavelengths [23]. G4 and G1 can also be attributed to olivine as in the previous endmember. Nevertheless, we should expect a band shoulder shifted towards longer wavelengths. We compared SU5 with the spectrum corresponding to a composition characterized by plagioclase, olivine, pyroxene and Mg-spinel from [41] (please refer to their Figure 7). A good match can be displayed for the 1000 nm absorption, while 2000 nm absorption is deeper in [41]. We considered this material as evidence of mafic mineralogy in association with plagioclase and/or spinels, possibly with a relative fine crystal size, which complicates a specific attribution of single Gaussians to a specific mineralogy, as, in general, happens for effusive or re-melted material.
(6) Spectral unit 6 is almost featureless with only a very shallow absorption at ca. 2000 nm. Due to the absence of 1000 nm absorption, we have not investigated this spectral signature via deconvolution. It is difficult to attribute the spectral properties to this material, which characterized a unit mainly attributable to the ejecta or some patches within the floor. The presence of only the 2000 nm absorption could be associated with the presence of spinel (iron-poor), as suggested by [42]. Nevertheless, the wide distribution of this unit makes this interpretation less favorable. Moreover, a possible effect on the 1000 nm absorption could be attributable to space weathering, since this material could be the less reworked after the impact, considering an initial composition closer to the spectra of SU5.

3.4. Geostratigraphic Map

The geostratigraphic map allowed a more complete analysis of the Proclus crater, revealing new information about the geology of the study area.
By comparing geomorphological and spectral maps, we observed that the spectral map clearly distinguishes the ejecta region, with a good correspondence with geomorphological contact. Moreover, spectral units allowed us to distinguish further geostratigraphic units for ejecta, named ej5, that are located near the rim and expanded on the northwest proximal ejecta area.
Within the crater’s floor, we divided the knobby terrain units into four geostratigraphic units, named kt2, kt3, kt5, and kt6. kt2 clearly corresponds to the summit of some of the knobs. By observing these areas at a higher scale, we saw that there are few boulders on top of the knobs that can likely explain the different spectral behavior of them. kt3 is very small, since the different resolutions from the camera and spectrometer make it difficult to highlight a direct correspondence with a specific portion of the knobs. The other knobby terrain’s geostratigraphic units, kt5 and kt6, do not show particular differences in the texture or albedo, which could be explained by a different granulometry or superficial roughness of the material.
We distinguished two geostratigraphic units, named im5 and im6, respectively, within the impact melt units. However, there is no evident morphological reason to explain the different spectral behavior among these two units. Considering the spatial distribution of the SU6, we can observe that these units are mainly located at the foot of the wall. This would suggest that the spectral behavior could be influenced by material that fell down from the crater wall. Smooth deposits detected on the geomorphological map do not exhibit peculiar spectral behavior. Indeed, they have been crossed in equal ways by SU5 and SU6. This leads us to think that these smooth patches are too small to be detected by the M3 data. For this reason, we decided to not assign any spectral units to such deposits.
The crater wall shows a more complex scenario, with spectral contacts that cut most of the geomorphological units. Therefore, in this case we used a different approach:
(1)
Taluses are outlined with an inferred contact in the geomorphological map; however, spectral map allowed us to identify the extent of the deposits, since there is a different spectral behavior between incoherent collapsed material and in situ rock. So, we considered as reference the spectral units to outline the boundary of the units.
(2)
Talus cones were drawn following geomorphological contacts, since they are clearly visible in the MDIS mosaic, although they do not have a proper spectral counterpart.
Taluses exhibit quite homogeneous spectral behavior, so most of these deposits were classified with the geostratigraphic unit t5. There is only a small unit, named t6, that exhibits the spectral behavior of SU6, the same as the adjacent impact melt unit im5. In addition, it was possible to detect a small patch of smooth melt deposit in correspondence with the terrace plane on the southwestern part of the wall (unit sd).
(3)
The crater wall outcrops are distinguished in four different geostratigraphic units: w1, w2, w3, w4. No morphological difference has been distinguished on these units. So, we argued that the main differences are related to the composition of in situ rocks present in this area before the crater formation, and excavated by this event, as well as the material of the following mass waste.

4. Discussion

Plagioclase dominated rocks build the lunar Highlands, formed by the floating of plagioclase during the first stages of the Magma Ocean (e.g., [43]). Early remotely sensed data highlighted the presence of spectrally featureless and red material (e.g., [7,44,45,46,47]) distributed around the Highlands. Indeed, Selene and Chandrayaan-1 missions show, thanks to SP and M3 spectrometers, data inferring the presence of mafic minerals, both on maria and locally on highlands, and plagioclase absorption on craters distributed on the Highlands (e.g., [25,37,42,48,49]).
Nevertheless, the future robotic or human in situ investigation of the Moon will benefit from highly detailed geostratigraphic maps to show the geological evolution of specific sites. In this work, following previous attempts on Mercury, Mars, and Moon, we investigate how to produce a comprehensive geological map incorporating together the morpho-stratigraphic information and the mineralogy of the different units.
This work was performed to investigate Proclus, which is a 28 km young crater, with a depth of 2.4 km, as retrieved from the GLD100 DTM (see [50]), situated in a relatively thin region of Highlands, next to Mare Crisium.
The morphology itself (Figure 2) permitted the following: (1) distinguish the ejecta; (2) highlight well exposed fresh material in the upper portion of the crater wall, where strata have also been observed; (3) identify talus material at the foot of the wall, fell down or was reworked later after the impact; and (4) define the presence of knobby material, sometimes exposing huge masses and smoother areas attributable to impact melts.
No evidence of other possible details can be retrieved. Conversely, considering the VNIR spectral properties, a different scenario is present. Indeed, in this crater, a large mineralogical variegation is present with units dominated by plagioclase, or by pyroxenes. The upper part of the wall shows the higher variability where bedrocks are clearly exposed (Figure 3). Instead, the floor shows principally the presence of two spectral units, with a reduced spectral contrast (SU5, SU6). Nevertheless, parts of the material dominated by pyroxene (e.g., SU3) are also present on the floor. SU5 and SU6 are also present on the talus and ejecta, where material is mixed and grain size can be more heterogeneous, reducing the spectral contrast.
It is worth noting that a strong variegation of spectral signatures in a relatively small crater and, in particular, on the fresh, in situ, wall material is clearly detectable. Peculiar patches (named SU3 and SU4) show spectral features dominated by pyroxene and olivine. SU1 and SU2 show variable amounts of plagioclase and pyroxene, permitting, from a mineralogical point of view, the definition of different subunits. Further, considering the different deconvolved Gaussians, pyroxenes and plagioclase compositions change in different parts of the wall. SU1 and SU2 subunits, in particular, show lateral and vertical alternation.
Once we describe the compositional information together with morphological evidence, as part of the same geological mapping process, we can infer the geological history of this area.
(1)
First, after the impact, we have the formation of the floor as well as of the ejecta characterized by materials with the predominance of two spectral units (SU5 and SU6). Those units show the lower reflectance (a part of small patches of SU4) and the most reduced spectral contrast (see Figure 5). SU5 shows a mineral assemblage of mafic phases (±plagioclase and spinels; see Section 3.3), and SU6 is almost featureless. The reduced and relatively low reflectance are compatible with the presence of material that could be characterized by different physical properties: (a) presence of crystals, small, embedded in amorphous matrix (e.g., here seen in smooth plains and ejecta [9,51]); (b) relative re-worked coarse mixing (e.g., here seen in portions of the talus and talus cones or in knobby terrains, e.g., [9,52]). Moreover, we cannot rule out that partially in this unit space, weathering could act longer in time than on the walls where mass wasting deposits allow the exposure of fresher material.
(2)
Few smooth deposits (sd) are identified by morphological point of view within talus and floor units, which, however, do not show specific association with SU among 5 and 6. Those small patches are likely mainly characterized by material that undergoes re-melting, and so they do not show well contrasted spectral signatures. Those patches are spectrally closer, or in between, to the SU5 and SU6. Moreover, the lower spatial resolution of the M3 image with respect to the LRO camera mosaics does not permit the assessment of enough pixels with spectra attributable only to the material characterizing the sd unit.
(3)
Large boulders fell down from the wall, are identified within the knobby terrains and on a talus, cone deposit on the northern side. They are dominated by mafic mineralogy (SU2 and SU3). In fact, they are spectrally recognizable from the surrounding since they result in less reworked material, permitting the detecting of the spectral signatures of the dominating pyroxene absorptions.
(4)
Later to the formation of the crater, wall underwent waste movement, which exposed fresher bedrocks. Thus, the most interesting evidence is on the upper portion of the walls, where four SUs are present, with the SU1 and SU2 covering almost completely this area (Figure 3 and Figure 4). Mainly SU1 is identified in the w1 unit on the northern part of the wall, whereas the SU2 covers the rest of the wall unit. A few small portions are interested by the exposure of assemblages with relevant clinopyroxene (by deconvolution, see Section 3.3) distributed on NE and locally on S and W sides (w3), and the appearance of an olivine spectrally dominated region (w4) on the SE. This unit (w4) shows a typical ultramafic mineral mixture, such as a mantle-like olivine and some opaque phases (possible oxides such as chromite or magnetite). MGM deconvolution (see in the result Section 3.3) identifies a strong correlation of the used Gaussian distributions to the olivine, with relatively high forsterite composition. Nevertheless, the missing third Gaussian as well as the evidence of a dark reflectance suggested that this unit is not monomineralic.
The geostratigraphic map permits, at such scale, the separation of the SU1 and SU2 (Figure 10) by the absence or the presence of pyroxenes, on w1 and w2, respectively. Nevertheless, the mineralogical analysis (Figure 6) showed a larger subdivision defining the presence of more sub-SUs (Figure 3) correlated with variation in both plagioclase and pyroxene mineral chemistry as well as relative abundance.
SU1 is spectrally dominated by plagioclase, relatively brighter with respect to other units, and, considering what is discussed in [31], they are indicating an exposure of almost pure plagioclase material. SU1A shows a deeper absorption and a higher asymmetry with respect to SU1B. Such asymmetry, as well as the retrieved band center shift, is attributed to a plagioclase with higher iron content, which is, in general, typical for anorthosites (see [30,36]). On SU1B, the plagioclase shows lower FeO, suggesting the presence of anorthosite with slightly higher mafic (i.e., augite) contribution, as indicated by the weak G3. The decrease in the absorption depth due to different particulate sizes seems to be unlikely since the units are on a closer portion of wall rock exposure. Moreover, this will not justify the shift in position of the Gaussian at longer wavelengths (G3 instead of G2). Moreover, considering that plagioclase VNIR evidence is relatively weak, since the brightness and low iron amount, few percentages of other phases will be effective on the spectral signature. Nevertheless, those regions could eventually show the presence of some percentage of amorphous, almost iron free, material mixed, and spectrally dominated, by the plagioclase.
SU2 is even more interesting, since a large variegation of mafic dominated band absorptions are present on fresh exposed rock all around the wall. Mineral assemblages vary from plagioclase-rich up to pyroxene enriched material, with the contribution of possible variable pyroxene chemistry (see Section 3.3). The comparison of the spectral properties of this area of Proclus with terrestrial analogs indicates that the SU2 subunits could be characterized by plagioclase with an intermediate FeO wt% content. Moreover, variable abundances of mafic minerals are present, with, in general, a maximum of 10% (B.D.R. indexes, Figure 8a). The direct comparison of the position of G1 (see Figure 8b) could allow comparisons even with smaller plagioclase abundances for SU2D and SU2E. Nevertheless, the shift in the plagioclase absorption is even related to the FeO wt% [30], which could impact more in the G1 position than relative mineral abundances. Moreover, once that plagioclase is mixed with different mafic phases, this has an unpredicted impact on the Gaussian distribution used to model the plagioclase absorption, in particular for the band position (see [26,30,31,37]). In addition, several works on spectral properties of lunar meteorites with relatively high abundance of plagioclase (in general >90%), attributable to highlands, show that small amounts of well dispersed mafic minerals always dominate the spectral signature (e.g., [53,54,55]). These lithologies can be compatible with those reported for Mg-suite rocks of the Highlands like ferroan anorthosites, norites, gabbronorites or troctolites (e.g., [56], and references therein) with relatively low abundance of mafic minerals.
The few appearances of SU3 and SU4 can be attributed to exposures of rocks with relatively high abundance of orthopyroxene and olivine, respectively. They are mainly present in small locations on the wall (w3 and w4) or on boulders on the knobby terrains (kt3). Unit SU3 has the strongest mafic absorption (see Figure 6), comparable with S2E, but without the presence of G1, and with G6,5 dominating the band I and II absorptions. Nevertheless, SU3 shows a relatively high reflectance, indicating the freshness of the exposure, but also that bright minerals, like plagioclase, should be present in the mineral assemblages. Instead, SU4 shows a less red reflectance compared to the other spectral units (Figure 5) and a low reflectance, suggesting that another spectral component could be present. As proposed by [57], olivine-bearing unit 4 could originate in the upper mantle and rise to the surface or be present as a residual of an olivine rich cumulate formed during the beginning of plagioclase floating (see, e.g., [42]). These hypotheses can also be supported by the fact that the Proclus crater area shows a relatively thin crust [11]. Conversely, Ref. [58] suggested that the low-reflectance olivine spectra from Copernicus crater could also derive from olivine-bearing clasts entrained into a mafic impact melt that cooled rapidly, whose final product is a mixture of olivine and opaque phases. The low dimensions of w4 do not permit us to support one of the other possibilities, even if the retrieved Gaussian position is compatible with forsterite composition.
The recognized mineralogy from Proclus crater shows similar characteristics to those proposed by [42] for the Moscoviense Basin, where the OOS (orthopyroxene, olivine, and spinel) exposures have been interpreted as differentiation products of plutonic events that intruded the magmatic material in the lower part of an anorthositic crust. Nevertheless, Proclus is ten times smaller than Moscoviense Basin. Therefore, the presence of possible autochthon material with variable compositions and at similar quotes, all around the crater unlikely indicates the excavation of a shallow chamber or the rise in material from different small magma chambers. Alternatively, Proclus mineralogy could suggest the formation of local magma traps during the plagioclase floatation that formed the primary crust during the Magma Ocean. Thus, suggesting the formation of pockets of rocks enriched in a few percentages of mafic minerals. This hypothesis can be in accordance with the suggestion that the Lunar Magma Ocean occurred early after the Moon’s formation. Ref. [59] suggested a range of time from 45 up to 250 MY after the solar system, but, in general, an indication of <150 MY [43,59,60,61]. This range of time could also depend on the presence of more mafic cumulates crystallizing during the formation of the plagioclase and their floatation [43,59,60,61]. Nevertheless, the presence of the nearby Mare Crisium could even suggest the possibility that the Highlands in that area could be affected by intrusion due to the secondary volcanism that filled the basin. Conversely, material associated with the lava infilling, should have a much more mafic composition with respect to the retrieved mineralogy of SU2, the more widespread, and SU3 (e.g., [4,62,63]). Higher mafic abundances should imply consequent lower albedo with respect to the, here, suggested mineral assemblages. In fact, if we consider spectral investigation of other basins, we can see how the reflectance of Maria material shows stronger absorption features but lower reflectance of other terrains (e.g., [4,62]). Further, the mare lithologies from Crisium show absorption almost twice in depth [63] with respect to the more intense mafic absorption seen in this work.

5. Conclusions

In this work, we integrate the geostratigraphic map of Proclus, a 28 km-diameter crater located on a portion of thin highland crust, showing morphological and linear features, with the spectral classification and retrieved mineralogical analysis of the area. This final product allows us to improve the geological interpretation of the crater and could support the comprehension of lunar highland regions with a relatively heterogeneous spectral signature dominated by mafic minerals.
In particular, we highlight the material formed by the impact, as the deposits characterizing the floor and the ejecta, most of the talus cone and knobby terrains, were emplaced subsequently to the crater formation, which is mainly dominated by similar material. This material shows relatively low reflectance and a reduced spectral contrast. Few patches on the talus cone and knobby terrains are attributable to other units, dominated by pyroxene, revealing late fall down masses.
Conversely, the freshly exposed wall shows a large variegation of mineralogy, from regions on the north dominated by plagioclase and the rest, with different mineral assemblages among low-Ca and high-Ca pyroxene, olivine, and plagioclase (±spinel). This heterogeneity permits the separation, from a mapping point of view, of four wall units (w1,2,3,4) and an even higher number of mineralogical subunits between w1 and w2.
In a few locations the spectral contact between different wall units (or subunits) coincides with the morphological evidence of different strata. All these units, excluding the small olivine-dominated w4 unit, are compatible with the presence of plagioclase ± a few % of mafic minerals, indicating that the rocks could have formed during the primary crust formation with a local segregation of more mafic magma. Whereas w4 shows a darker reflectance and absence of plagioclase, which could suggest ultramafic assemblages from deeper depth for this small outcrop.
In general, the investigation of small, fresh, highland craters could improve the knowledge of the evolution of the highland formation, once plagioclase started to float, and the production of geostratigraphic maps permits highlighting their evolution from the geological chart.

Author Contributions

Conceptualization, C.C. and L.G.; methodology, C.C., L.G. and G.S.; software, C.C., L.G. and G.S.; validation, C.C., L.G. and G.S.; formal analysis, C.C., L.G. and G.S.; investigation, C.C., L.G., G.S. and M.S.; resources, C.C. and M.S.; data curation, C.C. and L.G.; writing—original draft preparation, C.C., L.G. and G.S.; writing—review and editing, C.C., L.G., G.S. and M.S.; visualization, C.C. and L.G.; supervision, C.C. and L.G.; project administration, C.C.; funding acquisition, C.C. All authors have read and agreed to the published version of the manuscript.

Funding

This research was funded by Horizon 2020 program grant agreements 871149-GMAP and 776276-PLANMAP. And The APC was funded by [871149-GMAP].

Data Availability Statement

The authors are available to share data and processing upon request.

Acknowledgments

Authors thank the four different anonymous reviewers for their suggestions and comments that help to improve the scientific discussion and fluency of the text. We acknowledge support from the Horizon 2020 program grant agreements 871149-GMAP and 776276-PLANMAP.

Conflicts of Interest

The authors declare no conflict of interest.

References

  1. Massironi, M.; Rossi, A.P.; Wright, J.; Zambon, F.; Poehler, C.; Giacomini, L.; Carli, C.; Ferrari, S.; Semenzato, A.; Luzzi, E.; et al. From morpho-stratigraphic to geo-stratigraphic units: The PLANMAP contribution. In Proceedings of the EGU General Assembly 2021, Online, 19–30 April 2021. EGU21-15675. [Google Scholar] [CrossRef]
  2. Semenzato, A.; Massironi, M.; Ferrari, S.; Galluzzi, V.; Rothery, D.A.; Pegg, D.L.; Pozzobon, R.; Marchi, S. An integrated geologic map of the Rembrandt basin, on Mercury, as a starting point for stratigraphic analysis. Remote Sens. 2020, 12, 3213. [Google Scholar] [CrossRef]
  3. Wright, J.; Zambon, F.; Carli, C.; Altieri, F.; Pöhler, C.M.; Rothery, D.A.; Van der Bogert, C.; Rossi, A.P.; Massironi, M.; Balme, M.; et al. A geostratigraphic map of the Rachmaninoff basin area: Integrating morphostratigraphic and spectral units on Mercury. Earth Space Sci. 2024, 11, e2023EA003258. [Google Scholar] [CrossRef]
  4. Tognon, G.; Zambon, F.; Carli, C.; Massironi, M.; Giacomini, L.; Pozzobon, R.; Salari, G.; Tosi, F.; Combe, J.-P.; Fonte, S. Integrated spectral and compositional analysis for the lunar Tsiolkovskiy crater. J. Geophys. Res. Planets 2024, 129, e2023JE008272. [Google Scholar] [CrossRef]
  5. Giacomini, L.; Carli, C.; Sgavetti, M.; Massironi, M. Spectral analysis and geological mapping of Daedalia Planum lava field (Mars) using OMEGA data. Icarus 2012, 220, 679–693. [Google Scholar] [CrossRef]
  6. El-Baz, F.; Worden, A.M. Apollo 15 Preliminary Science Report 25-1–25-25; NASA SP-289; US Government Printing Office: Washington, DC, USA, 1972. Available online: https://www.nasa.gov/wp-content/uploads/static/history/alsj/a15/as15psr.pdf (accessed on 8 December 1971).
  7. Pieters, C.M. Composition of the lunar highland crust from near-infrared spectroscopy. Rev. Geophys. 1986, 24, 557–578. [Google Scholar] [CrossRef]
  8. Blewett, D.T.; Hawke, P.G.; Lucey, P.G.; Spudis, P.D. A spectral survey of the Crisium region of the Moon. Geophys. Res. Let. 1994, 22, 3059–3062. [Google Scholar] [CrossRef]
  9. Schonfeld, E. High spatial resolution Mg/Al maps of Wester Crisium and Sulpicius Gallus regions. Proc. Lunar Planet. Sci. Conf. 1981, 12, 809–816. [Google Scholar]
  10. Ohtake, M.; Matsunaga, T.; Haruyama, J.; Yokota, Y.; Morota, T.; Honda, C.; Ogawa, Y.; Torii, M.; Miyamoto, H.; Arai, T.; et al. The global distribution of pure anorthosite on the Moon. Nature 2009, 461, 236–240. [Google Scholar] [CrossRef]
  11. Donaldson Hanna, K.L.; Cheek, L.C.; Pieters, C.M.; Mustard, J.F.; Greenhagen, B.T.; Thomas, I.R.; Bowles, N.E. Global assessment of pure crystalline plagioclase across the Moon and implications for the evolution of the primary crust. J. Geophys. Res. Planets 2014, 119, 1516–1545. [Google Scholar] [CrossRef]
  12. Klem, S.M.; Henriksen, M.R.; Stopar, J.; Boyd, A.; Robinson, M.S. Controlled LROC Narrow Angle Camera High Resolution Mosaics. In Proceedings of the Lunar and Planetary Science Conference, The Woodlands, TX, USA, 17–21 March 2014; Volume 45. [Google Scholar]
  13. Pieters, C.M.; Boardman, J.; Buratti, B.; Chatterjee, A.; Clark, R.; Glavich, T.; Green, R.; Head, J., III; Isaacson, P.; Malaret, E.; et al. The Moon Mineralogy Mapper (M3) on Chandrayaan-1. Curr. Sci. 2009, 96, 500–505. [Google Scholar]
  14. Kruse, F.A.; Lefkoff, A.B.; Boardman, J.W.; Heidebrecht, K.B.; Shapiro, A.T.; Barloon, P.J.; Goetz, A.F.H. The Spectral Image Processing System (SIPS)—Interactive Visualization and Analysis of Imaging spectrometer Data. Remote Sens. Environ. 1993, 44, 145–163. [Google Scholar] [CrossRef]
  15. Kodikara, G.R.L.; Champati ray, P.K.; Chauhan, P.; Chatterjee, R.S. Spectral mapping of morphological features on the moon with MGM and SAM. Int. J. Appl. Earth Obs. Geoinf. 2016, 44, 31–41. [Google Scholar] [CrossRef]
  16. Serventi, G.; Carli, C.; Altieri, F.; Geminale, A.; Sgavetti, M. Spectral classification and MGM-based mineralogical characterization of hydrated phases: The Nili Fossae case, Mars. Planet. Space Sci. 2021, 209, 105361. [Google Scholar] [CrossRef]
  17. Boardman, J.W. Automating spectral unmixing of AVIRIS data using convex geometry concepts. In Summaries of the 4th Annual JPL Airborne Geoscience Workshop; NASA: Washington, DC, USA, 1993; pp. 11–14. [Google Scholar]
  18. Clark, R.N.; Roush, T.L. Reflectance Spectroscopy: Quantitative Analysis Techniques for Remote Sensing Applications. J. Geophys. Res. 1984, 89, 6329–6340. [Google Scholar] [CrossRef]
  19. Sunshine, J.M.; Pieters, C.M.; Pratt, F.P. Deconvolution of mineral absorption bands: An improved approach. J. Geophys. Res. 1990, 95, 6955–6966. [Google Scholar] [CrossRef]
  20. Sunshine, J.M.; Pieters, C.M. Estimating modal abundances from the spectra of natural and laboratory pyroxene mixtures using the Modified Gaussian Model. J. Geophys. Res. 1993, 98, 9075–9087. [Google Scholar] [CrossRef]
  21. Sunshine, J.M.; Pieters, C.M. Determining the composition of olivine from reflectance spectroscopy. J. Geophys. Res. 1998, 103, 13675–13688. [Google Scholar] [CrossRef]
  22. Klima, R.L.; Pieters, C.M.; Dyar, D.M. Spectroscopy of synthetic Mg-Fe pyroxenes I: Spin-allowed and spin-forbidden crystal field bands in the visible and near-infrared. Meteoritcs Planet. Sci. 2007, 42, 235–253. [Google Scholar] [CrossRef]
  23. Klima, R.L.; Dyar, D.M.; Pieters, C.M. Near-infrared spectra of clinoyroxenes: Effect of calcium content and crystal structure. Meteoritcs Planet. Sci. 2011, 46, 379–395. [Google Scholar] [CrossRef]
  24. Clenet, H.; Pinet, P.; Daydou, Y.; Heuripeau, F.; Rosemberg, C.; Baratoux, D.; Chevrel, S.D. A new systematic approach using the modified Gaussian model: Insight for the characterization of olivine-pyroxene mixtures and minerals chemicals compositions. Icarus 2011, 213, 404–422. [Google Scholar] [CrossRef]
  25. Cheek, L.C.; Pieters, C.M. Reflectance spectroscopy of plagioclase-dominated mineral mixtures: Implication for characterizing lunar anorthosites remotely. Am. Min. 2014, 99, 1871–1892. [Google Scholar] [CrossRef]
  26. Serventi, G.; Carli, C.; Sgavetti, M. Spectral variability of plagioclase-mafic mixtures (3): Quantitatively analysis appling the MGM algorithm. Icarus 2015, 254, 34–55. [Google Scholar] [CrossRef]
  27. Pinet, P.C.; Daydou, Y.; Chevrel, S.D. Olivine composition and reflectance spectroscopy relationship revisited from advanced MGM deconvolution based on synthetic and natural samples. Icarus 2022, 373, 114765. [Google Scholar] [CrossRef]
  28. Pinet, P.C.; Chevrel, S.D.; Daydou, Y.; Carli, C.; Bruschini, E.; Cuppone, T.; Pratesi, G. Advanced mgm deconvolution on powder versus slab of olivine natural samples: A test with nwa 5400. In Proceedings of the 10th European Lunar Symposium, Online, 24–26 May 2022; pp. 103–104. [Google Scholar]
  29. Clenet, H.; Pinet, P.C.; Ceuleneer, G.; Daydou, Y.; Heuripeau, F.; Rosemberg, C.; Bibring, J.-P.; Bellucci, G.; Altieri, F.; Gondet, B. A systematic mapping procedure based on the modified gaussian model to characterize magmatic units from olivine/pyroxenes mixtures: Application to the Syrtis major volcanic shield on mars. J. Geophys. Res. Planets 2013, 118, 1632–1655. [Google Scholar] [CrossRef]
  30. Serventi, G.; Carli, C.; Sgavetti, M.; Ciarniello, M.; Capaccioni, F.; Pedrazzi, G. Spectral variability of plagioclase-mafic mixtures (1): Effects of chemistry and modal abundance in reflectance spectra of rocks and mineral mixtures. Icarus 2013, 226, 282–298. [Google Scholar] [CrossRef]
  31. Serventi, G.; Carli, C.; Sgavetti, M. Deconvolution of mixtures with high plagioclase content for the remote interpretation of lunar plagioclase-rich regions. Icarus 2016, 272, 1–15. [Google Scholar] [CrossRef]
  32. Zambon, F.; Carli, C.; Wright, J.; Rothery, D.A.; Altieri, F.; Massironi, M.; Capaccioni, F.; Cremonese, G. Spectral units analysis of quadrangle H05-Hokusai on Mercury. J. Geophys. Res. Planets 2022, 127, e2021JE006918. [Google Scholar] [CrossRef]
  33. Denevi, B.W.; Noble, S.K.; Christoffersen, R.; Thompson, M.S.; Glotch, T.D.; Blewett, D.T.; Garrick-Bethell, I.; Gillis-Davis, J.J.; Greenhagen, B.T.; Hendrix, A.R.; et al. Space Weathering At The Moon. Rev. Miner. Geochem. 2023, 89, 611–650. [Google Scholar] [CrossRef]
  34. Pieters, C.M.; Fischer, E.M.; Rode, O.; Basu, A. Optical effects of space weathering: The role of the finest fraction. J. Geophys. Res. 1993, 98, 20817–20824. [Google Scholar] [CrossRef]
  35. Hiroi, T.; Kaiden, H.; Misawa, K.; Kojima, H.; Uemoto, K.; Ohtake, M.; Arai, T.; Sasaki, S.; Takeda, H.; Nyquist, L.E.; et al. Diversity in the visible-NIR absorption band characteristics of lunar and asteroidal plagioclase. Lunar. Planet. Sci. 2012, 43, 1168. [Google Scholar]
  36. Burns, R.G. Mineralogical Applications Of Crystal Field Theory; Cambridge University Press: Cambridge, UK, 1993; p. 551. [Google Scholar]
  37. Serventi, G.; Carli, C. The role of very fine particle sizes in the reflectance spectroscopy of plagioclase-bearing mixtures: New understanding for the interpretation of the finest sizes of the lunar regolith. Icarus 2017, 293, 157–171. [Google Scholar] [CrossRef]
  38. Carli, C.; Serventi, G.; Sgavetti, M. VNIR spectral variability of the igneous stratified Stillwater Complex: A tool to map lunar highlands. Am. Mineral. 2014, 99, 1834–1848. [Google Scholar] [CrossRef]
  39. Isaacson, P.J.; Pieters, C.M. Deconvolution of lunar olivine reflectance spectra: Implication for remote compositional assessment. Icarus 2010, 21, 8–13. [Google Scholar] [CrossRef]
  40. Pompilio, L.; Sgavetti, M.; Pedrazzi, G. Visible and near-infrared reflectance spectroscopy of pyroxene-bearing rocks: New constraints for understanding planetary surface compositions. J. Geophys. Res. Planets 2007, 112, E01004. [Google Scholar] [CrossRef]
  41. Gross, J.; Isaacson, P.J.; Treiman, A.H.; Le, L.; Gorman, J.K. Spinel-rich lithologies in the lunar highland crust: Linking lunar samples with crystallization experiments and remote sensing. Am. Mineral. 2014, 99, 1849–1859. [Google Scholar] [CrossRef]
  42. Pieters, C.M.; Besse, S.; Boardman, J.; Buratti, B.; Cheek, L.; Clark, R.N.; Combe, J.P.; Dhingra, D.; Goswami, J.N.; Green, R.O.; et al. Mg-spinel lithology: A new rock type on the lunar farside. JGR 2011, 116, E00G08. [Google Scholar] [CrossRef]
  43. Elkins-Tanton, L.T.; Burgess, S.; Yin, Q.Z. The lunar magma ocean: Reconciling the solidification process with lunar petrology and geochronology. Earth Planet. Sci. Lett. 2011, 304, 326–336. [Google Scholar] [CrossRef]
  44. Blewett, D.T.; Lucey, P.G.; Hawke, B.R. Clementine images of the lunar sample-return stations: Refinement of FeO and TiO2 mapping techniques. J. Geophys. Res. 1997, 102, 16319–16325. [Google Scholar] [CrossRef]
  45. Yan, B.; Wang, R.; Gan, F.; Wang, Z. Minerals mapping of the lunar surface with Clementine UVVIS/NIR data based on spectra unmixing method and Hapke model. Icarus 2010, 208, 11–19. [Google Scholar] [CrossRef]
  46. Lucey, P.G.; Blewett, D.T.; Hawke, B.R. Mapping the FeO and TiO2 content of the lunar surface with multispectral imagery. J. Geophys. Res. 1998, 103, 3679–3699. [Google Scholar] [CrossRef]
  47. Paul, G.; Lucey, P.G. Mineral maps of the Moon. Geophys. Res. Lett. 2004, 31, L08701. [Google Scholar] [CrossRef]
  48. Cheek, L.C.; Pieters, C.M. Variations in anorthosite purity at Tsiolkovsky crater on the Moon. Lunar. Planet. Sci. 2012, 43, 2624. [Google Scholar]
  49. Yamamoto, S. Massive layer of pure anorthosite on the Moon. Geophys. Res. Lett. 2012, 39, L13201. [Google Scholar] [CrossRef]
  50. Scholten, F.; Oberst, J.; Matz, K.-D.; Roatsch, T.; Wählisch, M.; Speyerer, E.J.; Robinson, M.S. GLD100:The near-global lunar 100 m raster DTM from LROC WAC stereo image data. J. Geophys. Res. 2012, 117, E00H17. [Google Scholar] [CrossRef]
  51. Scudder, N.A.; Horgan, B.H.N.; Rampe, E.B.; Smith, R.J.; Rutledge, A.M. The effects of magmatic evolution, crystallinity, and microtexture on the visible/near-infrared and thermal-infrared spectra of volcanic rocks. Icarus 2021, 359, 114344. [Google Scholar] [CrossRef]
  52. Carli, C.; Sgavetti, M. Spectral characteristics of rocks: Effects of composition and texture and implications for the interpretation of planet surface compositions. Icarus 2011, 211, 1034–1048. [Google Scholar] [CrossRef]
  53. Bruschini, E.; Carli, C.; Tosi, F. Mapping the Spectral and Mineralogical Variability of Lunar Breccia Meteorite NWA 13859 by VNIR Reflectance Spectroscopy. Minerals 2023, 13, 1000. [Google Scholar] [CrossRef]
  54. Carli, C.; Ferrari, S.; Cuppone, T.; Pratesi, G.; Bruschini, E.; Stephant, A.; Baschetti, B.; Zambon, F.; Massironi, M.; Tosi, F. Hyperspectral VNIR imaging of lunar meteorites. In Proceedings of the European Lunar Symposium 2023, Padua, Italy, 27–29 June 2023; pp. 52–53. [Google Scholar]
  55. Carli, C.; Tosi, F.; Jadid, F.-E.; Chennaoui, H. Reflectance properties of North West Africa 13951 and 16372. In Proceedings of the European Lunar Symposium 2025, Munster, Germany, 22–27 June 2025. [Google Scholar] [CrossRef]
  56. Lucey, P.; Korotev, R.L.; Gillis, J.J.; Taylor, L.A.; Lawrence, D.; Campbell, B.A.; Elphic, R.; Feldman, B.; Hood, L.L.; Hunten, D.; et al. Understanding the lunar surface and space–moon interactions. Rev. Mineral. Geochem. 2006, 60, 83–219. [Google Scholar] [CrossRef]
  57. Yamamoto, S.; Nakamura, R.; Matsunaga, T.; Ogawa, Y.; Ishihara, Y.; Morota, T.; Hirata, N.; Ohtake, M.; Hiroi, T.; Yokota, Y.; et al. Possible mantle origin of olivine around lunar impact basins detected by SELENE. Nat. Geosci. 2010, 3, 533–536. [Google Scholar] [CrossRef]
  58. Dhingra, D.; Pieters, C.M.; Head, J.H. Multiple origins for olivine at Copernicus crater. Earth and planet. Sci. Lett. 2015, 420, 95–101. [Google Scholar] [CrossRef]
  59. Collin, L.; Michaut, C.; Labrosse, S.; Bourdon, B. Thermal evolution of the lunar magma ocean. Earth Planet. Sci. Lett. 2024, 648, 119109. [Google Scholar] [CrossRef]
  60. Dauphas, N.; Zhang, Z.J.; Chen, X.; Barboni, M.; Szymanowski, D.; Schoene, B.; Leya, I.; McKeegan, K.D. Completion of lunar magma ocean solidification at 4.43 Ga. Proc. Natl. Acad. Sci. USA 2025, 122, e2413802121. [Google Scholar] [CrossRef]
  61. Zhang, Y.-W.; Sheng, S.-Z.; Wang, S.-J.; Li, Q.-L.; Hua, J.-X.; Li, S.; Li, X.-H. Lead isotopic evidence for an old and rapid lunar magma ocean. Sci. Adv. 2025, 11, eadu5111. [Google Scholar] [CrossRef]
  62. Neeraja, C.R.; Arivazhagan, S.; Abishek, P. Decoding the Apollo basin: Insights into volcanism, compositional diversity and crustal evolution. Planet. Space Sci. 2025, 268, 106204. [Google Scholar] [CrossRef]
  63. Arivazhagan, S.; Karthi, A. Compositional and chronological characterization of mare crisium using chandrayaan-1 and LROC-WAC data. Planet. Space Sci. 2018, 161, 41–56. [Google Scholar] [CrossRef]
Figure 1. (a) Projection from the global base map from LROC to highlight the region (white box) where the bright small crater Proclus is located between Mare Crisium and Mare Tranquillitatis; (b) Shaded Relief from LROC base map, resized around Proclus crater (red box) in the proximity of the Mare Crisium border. (c,d) Zoom into the Proclus crater on the global base map from LROC, with the extension of the ejecta drawn (d).
Remotesensing 17 03786 g001
Figure 2. (a) Proclus crater basemap “Proclus Crater low-Sun controlled NAC” (1 m/pixel). In the background is WAC LRO global mosaic (100 m/pixel), (b) geomorphological map on top to the basemap (see Section 2.3.1 and Section 3.1 for more details).
Remotesensing 17 03786 g002
Figure 3. Spectral units as defined by SAM classification using the endmembers from Figure 5.
Remotesensing 17 03786 g003
Figure 4. Spectral units polygon definition defined from Figure 3, merging the subunits (see Section 2.3.2 and Section 3.2 for more details).
Remotesensing 17 03786 g004
Figure 6. MGM deconvolution of the mean spectrum of each classified spectral unit. In Table 1 are listed the corresponding Gaussians (see the text for more details). (a,b) Unit 1; G1: 1290 nm; G2: 1868 nm; G3: 2090 nm. (c) Unit 2: G1: 1275 nm; G4: 986 nm; G3: 2039 nm; (dg) G1: 1225–1275 nm; G5: 899–915 nm; G4: 990–1033 nm; G2: ca. 1850 nm; G3: 2100 nm; (h) unit 3: G5: 934 nm; G4: 1024 nm; G2: 1909 nm; G3: 2197 nm; (i) unit 4: G4: 1021 nm; G1: 1253 nm; (j) unit 5: G4: 1040 nm; G1: 1265 nm; G3: 2074. Spectra colors are the same as in Figure 5.
Remotesensing 17 03786 g006
Figure 7. Spectral units 1A and 1B have been plotted together with spectra of three plagioclases with increasing iron content, at three different particle sizes, 36–63, 63–125 and 125–250 µm. Spectral signatures are closer to PL 0.5wt.% FeO, 36–63 µm (unit 1A), and PL 0.1wt.% FeO, 36–63 µm, (unit 1B).
Remotesensing 17 03786 g007
Figure 8. Shows the comparison between spectra endmembers of the subunits 2 from Proclus crater and spectra acquired on analogs (best match from [25,29,30,37]). (a) B.D.R index from Proclus crater vs. B.D.R index from analogs. B.D.R values from Proclus craters are labeled above the symbols. B.D.R increases from spectral subunit 2E to spectral subunit 2A; (b) G1 (1250 nm band) center from Proclus crater vs. G1 (1250 nm band) center from analogs. G1 moves toward longer wavelengths from spectral subunit 2E to spectral subunit 2A. G1 values from Proclus craters are labeled above the symbols. (a,b) Fuchsia crosses: Proclus crater; black, empty circles: analogs. Compositions of analogs with similar B.D.R values or G1 centers are written on the right of the symbols. The compositions reported in bold character indicate those compositions matching both B.D.R and G1 position, whose spectra are displayed in (c); (c) continuum-removed reflectance spectra from Proclus crater (dotted lines) compared with the spectra of analogs (solid lines) with composition in bold in Figure 8 (a,b). In particular, spectral unit 2D shows the 900 nm (described with G4 and G5) absorption deeper than the 1250 nm absorption (fitted with G1), while in spectral unit 2A the 1250 nm absorption is the deepest.
Remotesensing 17 03786 g008
Figure 9. Spectral unit 3 has been plotted with a mafic mixture (orthopyroxene-clinopyroxene, 36–63 µm), and with two mixtures, 90%/92% PL 0.1wt.% FeO + (orthopyroxene-clinopyroxene, 36–63 µm). Spectral unit 3 shows two absorption bands centered at the same wavelengths of the mafic mixture but with a reduced depth; on the other hand, it can be compared also with the 92% PL mixture (best match from [30]).
Remotesensing 17 03786 g009
Figure 10. Geostratigraphic map, integrating the information from the morpho-stratigraphic and spectral maps (Figure 2b, Figure 3 and Figure 4). Letters indicate the unit from the geomorphological map units, whereas the number indicates the mineralogical composition related to the different spectral units. For more details, see Section 3.4 and Section 4.
Remotesensing 17 03786 g010
Table 1. Ad hoc NAC images used to produce the two basemaps used for the morpho-stratigraphic map (see Section 2.1 for further details).
NAC_ROI_PROCLUS_LOA_E161N0468:Proclus Mosaic (Western Half):
M1249219437Rm104211600re
M1249219437Lm104211600le
M1249226474Rm104204440re
M1249226474Lm104204440le
M1249233510R
M1249233510L
M1249240546R
M1249240546L
Table 2. Correlation between Gaussians and attributed absorptions.
GaussianB.C. (nm)Band Attribution
G11200–1300Fe2+ in Plagioclase on substitution of Ca2+
G21800Fe2+ in Plagioclase on substitution of Ca2+
G6, G4900–1020Fe2+ in M2 and M1 site on pyroxene (ortho-, clino-)
G5, G31850–2300Fe2+ in M2 site on pyroxene (ortho-, clino-)
+ Spinel
G4*, G1*990–1250Fe2+ in M2 and M1 site on olivine
Disclaimer/Publisher’s Note: The statements, opinions and data contained in all publications are solely those of the individual author(s) and contributor(s) and not of MDPI and/or the editor(s). MDPI and/or the editor(s) disclaim responsibility for any injury to people or property resulting from any ideas, methods, instructions or products referred to in the content.