Highlights
What are the main findings?
- Multi-mission satellite altimetry revealed extreme water level rises up to 5.12 m (21.47 Gt) in Lake Zaysan during 2010, 2013, and 2024.
- Strong correlation (r = 0.95) between discharge anomalies and lake levels confirms intense snowmelt runoff as the primary driver of extreme events.
What are the implications of the main findings?
- Extreme events are driven by negative Arctic Oscillation phases (2010, 2013) and strong El Niño events (2016, 2024).
- The monitoring approach provides baseline data for transboundary water management in climate-sensitive Central Asian basins.
Abstract
Lake water level variation, reflecting the dynamic balance between water input and loss, is a crucial indicator of climate change and regional hydrological cycles. This is particularly significant in arid Central Asia, where lakes are vital surface water resources and key to ecosystem stability. This study systematically reconstructed water level changes of Lake Zaysan and Lake Ulungur from 2003 to 2024 using high-precision altimetry data from ICESat, CryoSat-2, and ICESat-2 satellites. Results indicate that Lake Zaysan experienced significant water level fluctuations of 5.01 m (21.01 Gt water mass change, where 1 Gt = 109 metric tons) in 2010, 5.12 m (21.47 Gt) in 2013, and 3.53 m (14.80 Gt) in 2024. Lake Ulungur also exhibited notable water level changes during the same period. Our study reveals that water level variations in both lakes are primarily controlled by runoff processes. A highly significant positive correlation exists between lake level anomalies and discharge anomalies. Conversely, the low correlation between water levels and precipitation indicates a pronounced lagged effect of snowfall, as lake water level fluctuations are driven by a combination of spring snowmelt runoff and summer precipitation. Furthermore, these findings highlight the sensitive response of these Central Asian lakes to environmental changes under climate warming. Our study enriches observational data on regional lake dynamics and provides a scientific basis for water resource management and future climate adaptation strategies in arid regions.
1. Introduction
Lakes, as critical components of the terrestrial hydrosphere and vital ecosystems, are highly sensitive to both climatic variations and anthropogenic activities, serving as key sentinels of environmental change []. They integrate and reflect fluctuations in regional hydrological processes, including precipitation, evaporation, and runoff [,]. Globally, numerous lakes, particularly those in inland and arid/semi-arid regions, have experienced significant changes in water storage and surface area in recent decades, largely attributed to climate warming and intensified human interventions [,]. Monitoring these dynamic changes is therefore crucial for understanding the global water cycle, assessing regional water security, and managing fragile aquatic ecosystems [,].
Lakes in arid and semi-arid Central Asia, a region characterized by limited water availability and fragile ecosystems, serve as invaluable surface water resources, vital for agriculture, industry, domestic supply, and regional biodiversity [,]. Typically situated in endorheic basins and predominantly recharged by remote glacial and snowmelt, these lakes exhibit heightened sensitivity to minor climatic fluctuations and upstream anthropogenic disturbances [,]. Over recent decades, a pervasive trend of lake shrinkage and water level decline has been observed across Central Asia, jeopardizing regional ecological integrity and socio-economic stability [,]. These dynamics underscore an urgent need for robust monitoring and a comprehension of hydrological dynamics in these sensitive environments.
Among these vulnerable Central Asian lakes, Lake Zaysan (in Kazakhstan) and Lake Ulungur (in China) in the Altai Mountain region represent particularly critical yet understudied snowmelt-dependent systems (Figure 1). As the largest lakes in their respective sub-basins, they are predominantly recharged by snowmelt from the Altai Mountains. Distributed energy balance modeling quantified that snowmelt contributes 29.3% of annual runoff, with up to 72% of runoff occurring during the April–June melt season [], underscoring snowmelt’s critical role in sustaining regional water resources. Their hydrological regimes directly influence downstream water security and ecosystem stability across international borders, yet dedicated high-resolution monitoring remains limited.
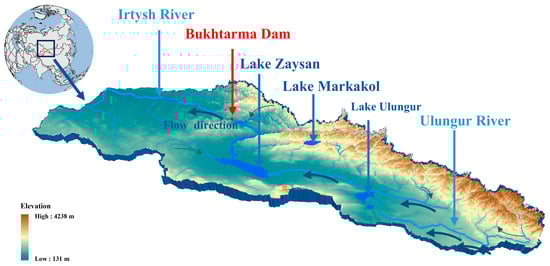
Figure 1.
Geographic location and major water bodies in the Zaysan Basin. Blue arrows indicate the main flow directions of the Irtysh and Ulungur Rivers, and the red arrow marks the location of the Bukhtarma Dam.
For the Irtysh River Basin specifically, significant alterations in hydrological regimes and water storage are evident under the pressures of climate warming and human activities []. Previous research has established foundational understanding from multiple perspectives. At the basin scale, long-term optical remote sensing documented surface water area increases of 2922 km2/year (1990–2019), with evapotranspiration identified as the dominant driver (average 63% contribution across the basin, reaching 72% in midstream regions), though total water storage paradoxically declined after 2007 []. Systematic reviews have emphasized snowmelt’s critical role in regional hydrology and identified governance gaps in transboundary water resource management []. At the process scale, distributed energy balance modeling in the Kayiertesi River Basin (an Irtysh headwater tributary) quantified snowmelt contributions of 29.3% to total annual runoff, with snowmelt accounting for up to 72% of discharge during the April–June melt season []. Isotopic hydrograph separation studies using stable water isotopes further confirmed these patterns, showing that snowmelt contributed 36.9% to annual runoff and up to 58.1% of discharge during the April–June period []. Meanwhile, multi-decadal observations documented advancing melt onset and increasing snowmelt variability under warming climate [,]. At the lake scale, GRACE-based studies and satellite observations detected significant water mass dynamics and regime shifts, with Lake Zaysan and Tianshan lakes exhibiting notable area fluctuations (up to 779 km2 for Zaysan) linked to ENSO-driven precipitation variability and climate oscillations [].
Despite these advances in understanding basin-scale processes, critical knowledge gaps remain regarding the hydrological behavior of individual lakes within the Irtysh system, particularly Lake Zaysan and Lake Ulungur. First, existing studies have primarily focused on long-term trends and basin-averaged dynamics [,], while the occurrence, magnitude, and drivers of extreme water level events, which pose the greatest risks to transboundary water management and downstream ecosystems, remain poorly characterized. Second, although the critical role of snowmelt in sustaining regional water resources is well established [,,], direct observational evidence linking intense snowmelt pulses to abrupt lake-level surges is still lacking. Moreover, previous lake monitoring efforts have relied predominantly on optical remote sensing of surface area [] or coarse-resolution gravimetric data that aggregate signals across multiple water bodies and cannot resolve individual lake dynamics at fine temporal scales []. Consequently, a detailed, multi-decadal reconstruction of water levels for these two critical lakes, coupled with explicit attribution of extreme events to upstream cryospheric drivers, has not yet been achieved. Addressing these gaps is essential for understanding how snowmelt-dependent lake systems respond to rapidly changing climatic conditions and for supporting adaptive water resource management in this vulnerable transboundary basin.
The development and continuous advancement of satellite altimetry, notably including laser altimetry from the Ice, Cloud, and Land Elevation Satellite (ICESat) and its successor ICESat-2, alongside radar altimetry from missions like CryoSat-2, have revolutionized capabilities for monitoring Earth’s surface dynamics with high precision. These missions provide invaluable surface elevation data, offering unprecedented opportunities for diverse geophysical applications. For instance, they play a crucial role in quantifying cryospheric changes: ICESat-2 has enabled the detection of seasonal cycles in glacier surface elevation in High Mountain Asia, while the combined use of ICESat and ICESat-2 data has facilitated continuous estimates of glacier mass balance [,]. Concurrently, these satellite systems (ICESat, ICESat-2, and CryoSat-2) have demonstrated exceptional capabilities in tracking inland water dynamics. They provide critical, high-accuracy measurements for constructing detailed lake water level time series, revealing seasonal to interannual variability across diverse lacustrine environments, and enhancing understanding of regional hydrological responses to climatic and anthropogenic drivers [,,,]. The advanced technology of these altimetry systems, especially the photon-counting Lidar of ICESat-2 which offers high spatial resolution and vertical accuracy [], is instrumental for understanding detailed hydrological and cryospheric processes.
Despite the recognized hydro-ecological importance of Lake Zaysan and Lake Ulungur, coupled with advancements in remote sensing technologies, a comprehensive, multi-decadal understanding of their water level dynamics and a precise quantification of the governing drivers, particularly the influence of episodic extreme snowmelt events, remain largely unaddressed. Therefore, this study is designed to address the following objectives: (1) to systematically reconstruct high-precision water level time series for Lake Zaysan and Lake Ulungur spanning the period from 2003 to 2024, through the integration of multi-source satellite altimetry data (ICESat, CryoSat-2, and ICESat-2); (2) to identify and characterize significant hydrological regime shifts and extreme water level fluctuation events within these lacustrine systems; (3) to quantitatively assess the relationships between observed lake level variations and potential hydro-climatic driving factors, with a primary focus on establishing direct linkages between intense snowmelt runoff pulses and downstream lake responses; and (4) to elucidate the interannual and seasonal characteristics of these lake level changes. By achieving these objectives, this study endeavors to provide, for the first time, a detailed and robust chronicle of the recent hydrological history of these two critical Central Asian lakes. The anticipated findings are expected to deepen the scientific understanding of how arid-region lakes respond to rapidly changing cryospheric and climatic conditions, especially in the context of extreme hydrological events. Furthermore, this research will furnish crucial data support and a scientific foundation for enhancing transboundary water resource management, informing ecological conservation strategies, and formulating effective climate adaptation measures within the vulnerable Irtysh River Basin.
2. Data and Methods
2.1. Study Area
The Irtysh River, the largest tributary of the Ob River, originates from the southern slopes of the Altai Mountains in Xinjiang, China. As the sole Chinese river discharging into the Arctic Ocean, it traverses China, Kazakhstan, and Russia, forming a transboundary hydrological lifeline. For this study, the Lake Zaysan basin was delineated by mosaicking Level 4 sub-basins from the HydroBASINS database [], covering approximately 280,000 km2. The basin encompasses three major water bodies: Lake Zaysan (~4200 km2), Lake Ulungur (connected with Jili Lake, ~1000 km2), and Lake Markakol (~450 km2). These lakes play pivotal roles in regional water regulation and ecosystem stability [,].
The basin exhibits an arid climate, with its hydrology critically dependent on alpine snowmelt and glacier melt from the Altai Mountains [,,]. Although snowmelt contributes 29.3% of total annual discharge, its seasonal impact is far more pronounced: the rapid release of winter snowpack generates powerful spring flood pulses that drive river and lake water levels, accounting for up to 72% of discharge during the April–June period []. Under a warming climate, earlier snowmelt onset and potentially increased meltwater have led to greater interannual variability in runoff and lake levels [,,]. Despite the recognized importance of snowmelt, the magnitude and frequency of extreme snowmelt events and their direct impacts on lake water storage remain poorly quantified. This knowledge gap limits effective water resource management and risk assessment in this sensitive basin.
2.2. Altimetry Data
2.2.1. ICESat
The Ice, Cloud, and Land Elevation Satellite (ICESat) carried the Geoscience Laser Altimeter System (GLAS), a spaceborne LiDAR operating at dual wavelengths of 1064 nm and 532 nm. Designed for centimeter-level vertical accuracy, GLAS collected elevation data over ice sheets, land surfaces, vegetation canopies, and the atmosphere [,]. It emitted 40 laser pulses per second, generating footprints approximately 70 m in diameter, spaced about 170 m apart along the ground track from its 600 km orbit. ICESat observations have been widely applied to detect water level variations in inland lakes and rivers, taking advantage of their high vertical precision at the centimeter scale [,,]. In this study, we employed the GLAH14 Release-34 dataset [], which spans the period from February 2003 to October 2009, and provides geolocated surface elevations referenced to the TOPEX/Poseidon ellipsoid and corrected using the EGM2008 geoid.
2.2.2. ICESat-2
The Ice, Cloud, and Land Elevation Satellite-2 (ICESat-2), launched by the National Aeronautics and Space Administration (NASA) in September 2018, is equipped with the Advanced Topographic Laser Altimeter System (ATLAS), a high-resolution, multi-beam photon-counting lidar instrument. Its primary scientific objectives include monitoring ice sheet mass balance, assessing inland water levels and water resources, and estimating vegetation canopy height. ATLAS operates at a pulse repetition frequency of 10 kHz, enabling an along-track sampling interval of approximately 0.7 m, Each laser footprint has a ground diameter of approximately 17 m []. The laser system emits six beams arranged in three pairs, each consisting of a strong and a weak beam separated by 90 m across-track, yielding a total swath width of approximately 3.3 km. ATL13 is derived from the geolocated photon data of ATL03 and is specifically designed for retrieving surface elevations over inland hydrologic features, including lakes, reservoirs, rivers, and estuaries. Compared to the earlier ICESat GLAH14 product, ATL13 contains only elevation data over water bodies, which significantly reduces land signal contamination and improves the accuracy of surface water elevation estimation. This product has been widely used in studies of inland water level monitoring [,,,]. Key parameters provided by ATL13 include geodetic coordinates, ellipsoidal height (WGS84), orthometric height (EGM2008), and other quality control indicators []. In this study, we used Version 6 of the ICESat-2 ATL13 Inland Water Surface Height product, covering the period from 2018 to 2024.
2.2.3. CryoSat-2
CryoSat-2 was successfully launched by the European Space Agency (ESA) in 2010. Its main mission is to monitor changes in the height of the Arctic ice cap due to climate change while also measuring changes in ocean and land water levels []. The satellite operates at an orbital altitude of 730 km, with an orbital inclination of 92°, a revisit period of 369 days and a subperiod of 30 days []. The spacing of neighboring trajectories on the equator is about 7 km, enhancing the satellite’s coverage of lakes. The Synthetic Aperture Interferometric Radar Altimeter (SIRAL) is the primary instrument onboard CryoSat-2, operating in the Ku-band, and it allows the satellite to function in three different modes: Low Resolution Mode (LRM), Synthetic Aperture Radar (SAR) mode, and Synthetic Aperture Radar Interferometric (SARIn) mode [,]. CryoSat-2/SIRAL data products include Level 0, Level 1b, Level 2, and advanced data products. this study uses CryoSat-2/SIRAL Level-2 GDR data in SARIn measurement mode.
2.3. Climate Datasets
ERA5 is the fifth-generation global atmospheric reanalysis dataset released by the European Centre for Medium-Range Weather Forecasts (ECMWF) through the Copernicus Climate Change Service (C3S), covering the period from January 1950 to the present [,]. ERA5-Land is a land-surface reanalysis dataset derived from ERA5, focusing on land-atmosphere interactions. It features enhanced spatial resolution and more refined representations of land surface processes. In this study, we utilize a post-processed product of the ERA5-Land dataset, namely the monthly mean fields. These data are derived by temporally averaging the original hourly outputs and have been resampled onto a regular 0.1° × 0.1° latitude–longitude grid. This format is well-suited for applications that do not require sub-monthly temporal resolution.
2.4. GloFAS
The river discharge dataset used in this study is obtained from the Global Flood Awareness System (GloFAS) v4.0 historical reanalysis, developed by the Copernicus Emergency Management Service (CEMS). GloFAS v4.0 is based on the LISFLOOD hydrological model, a spatially distributed, physically based model driven by ERA5 atmospheric reanalysis []. It provides daily river discharge estimates at 0.05° spatial resolution (~5 km) from 1979 to the present, covering all major global river basins except Antarctica []. The model uses high-resolution input layers integrating updated land use, topography, and hydrological characteristics from satellite observations and in situ data. Calibration was performed at 1995 gauging stations using observed discharge data, and a regionalization approach was applied for ungauged basins to ensure spatial consistency and reliability []. GloFAS v4.0 is widely applied in regional water resource assessments, flood forecasting, and hydrological extremes analysis.
2.5. Multi-Source Satellite Altimetry Data Processing
This study integrates ICESat (2003–2009), CryoSat-2 (2010–2024), and ICESat-2 (2018–2024) altimetry data to construct spatiotemporally consistent lake water level series. The detailed data processing workflow is illustrated in Figure 2 and comprises the following key steps [,,]:
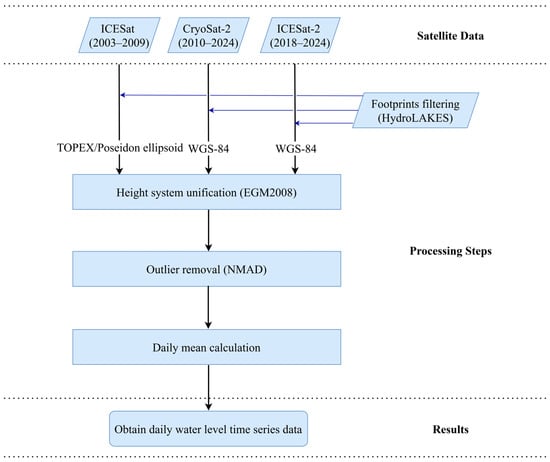
Figure 2.
Workflow for lake water level reconstruction using multi-mission altimetry data.
(1) Spatial Footprint Filtering: Lake boundaries from the HydroLAKES database [] were used to filter out altimetry footprints located over land or vegetation through spatial overlay analysis. For each satellite mission, footprints were retained only if their center coordinates fell within the lake polygon boundaries. Additionally, footprints within 500 m of the lake shoreline were excluded to avoid contamination from mixed land–water pixels and shoreline topography effects.
(2) Height System Unification: Ellipsoidal heights from different satellite missions were converted to a unified vertical reference system. ICESat GLAS data (GLAH14 Version 34) provides elevations referenced to the TOPEX/Poseidon ellipsoid, while CryoSat-2 and ICESat-2 data are referenced to the WGS-84 ellipsoid. All ellipsoidal heights were converted to EGM2008 orthometric heights by subtracting the EGM2008 geoid heights.
where is the orthometric height, is the ellipsoidal height, and is the geoid height from the EGM2008 model at the i-th footprint location.
(3) Detection and Removal: For each observation, the median elevation was calculated, and the Normalized Median Absolute Deviation (NMAD) method [] was applied to remove outliers caused by mixed pixels near shorelines and atmospheric interference.
where is the elevation of the i-th footprint and is the median elevation. Footprints exceeding the threshold were excluded.
(4) Water Level Calculation: After outlier removal, the arithmetic mean of the remaining valid footprint elevations was calculated to represent the lake water level:
where is the mean water level, is the number of valid footprints, and is the elevation of the i-th footprint.
To ensure water level consistency, a final data harmonization step was performed. A systematic bias of approximately 0.55 m was identified between the ICESat/ICESat-2 data and the DAHITI record for Lake Ulungur. This offset was derived by calculating the mean difference between ICESat-2 and DAHITI during their overlapping period (2018–2024). This bias was then corrected across the entire time series to ensure an internally consistent dataset.
3. Results
3.1. Reconstruction and Validation of Lake Water Levels Using Multi-Source Satellite Altimetry
We reconstructed continuous water level time series from 2003 to 2024 for Lake Zaysan, Lake Ulungur (treated as a single system with the connected Jili Lake), and Lake Markakol. This reconstruction integrates high-precision data from three satellite missions: ICESat, CryoSat-2, and ICESat-2 (Figure 3). The reliability of this integrated time series was rigorously evaluated through cross-validation with DAHITI dataset. Validation results for Lake Zaysan demonstrate the robustness of our methodology, with strong linear relationships with the DAHITI record (R2 values ranging from 0.89 to 0.96) and low root mean square errors (RMSEs of 0.30–0.42 m) across all three missions. The inclusion of CryoSat-2 data was particularly critical, as it successfully bridged key temporal gaps in the record, yielding a more complete dataset essential for accurately capturing the timing and magnitude of extreme hydrological events. The resulting multi-decadal time series immediately reveals the divergent hydrological behaviors of the studied lakes.
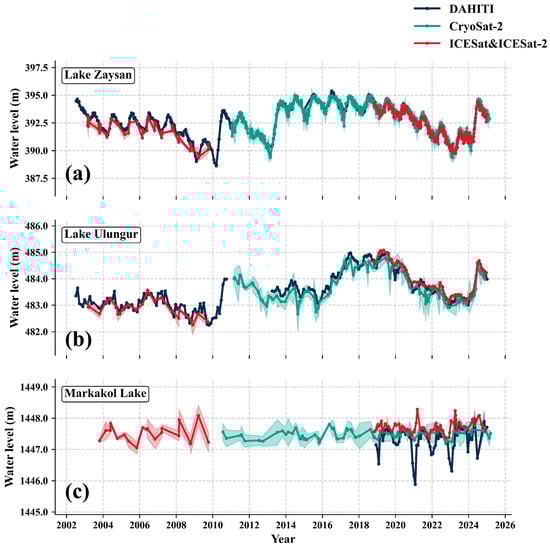
Figure 3.
Time series of water level changes in (a) Lake Zaysan, (b) Lake Ulungur, and (c) Lake Markakol (2003–2024) derived from multi-source satellite altimetry data (DAHITI, CryoSat-2, ICESat, and ICESat-2). The shaded areas around each time series represent the uncertainty range, calculated as ±2 times the standard error. Gray shaded areas indicate extreme climate years.
3.2. Abrupt Lake-Level Changes
While Lake Markakol exhibited only minor water level variations over the observation period, both Lake Zaysan and Lake Ulungur are characterized by episodic and dramatic water level fluctuations. As quantified in Table 1, Lake Zaysan experienced its most extraordinary events in 2010, 2013, and 2024, with maximum intra-annual water level rises of 5.01 m, 5.12 m, and 3.53 m, and corresponding water mass gains of 21.01 Gt, 21.47 Gt, and 14.80 Gt, respectively. The hydrologically connected Ulungur-Jili system displayed a similar pattern of abrupt change, albeit with lower amplitudes. Its most significant events occurred in 2010, 2016, and 2024, with maximum level changes of 1.46 m, 1.61 m, and 1.50 m, and corresponding mass gains of 1.46 Gt, 1.64 Gt, and 1.53 Gt, respectively. These hydrological extremes underscore the sensitivity of these lakes to climatic forcing.

Table 1.
Extreme water level and water mass changes in Lake Zaysan and Lake Ulungur.
3.3. Hydro-Climatic Drivers of Abrupt Lake-Level Changes
To understand the drivers of abrupt lake level changes, we analyzed the interplay between basin-averaged runoff, snowmelt, and total precipitation from 2002 to 2024 (Figure 4). All annual anomalies were calculated relative to the 1991–2020 climatological mean. Results clearly indicate that the basin runoff is primarily fed by snowmelt. The monthly time series of runoff and snowmelt are highly synchronized (Figure 4a), which is confirmed by a strong positive correlation (r = 0.80, p < 0.05). A cross-correlation analysis reveals a one-month lag, meaning runoff peaks approximately one month after snowmelt. This delay is physically meaningful, representing the time required for the meltwater to infiltrate, accumulate, and travel through the river network. At the annual scale, the correlation is even stronger (r = 0.81, p < 0.05) (Figure 4b), reinforcing the conclusion that years with high snowmelt consistently produce high runoff. The seasonal distribution further clarifies this mechanism (Figure 5): snowmelt is concentrated almost exclusively in spring (March–May, hereafter MAM) (Figure 5e), which in turn triggers the primary runoff period in spring and early summer (Figure 5a). While runoff is the result of the combined effect of snowmelt and precipitation, the role of precipitation is less direct. Precipitation does contribute to the total annual water budget, as evidenced by a moderate annual correlation with runoff (r = 0.66, p < 0.05) (Figure 4d). However, its seasonal timing is misaligned with the main runoff event. The primary precipitation season is summer (June–August, hereafter JJA) (Figure 5c), which occurs after the onset of the main runoff period. The negative one-month lag in the monthly correlation (Figure 4c) quantitatively confirms that the initial seasonal rise in runoff is not triggered by rainfall. The analysis of annual anomalies in extreme years solidifies this conclusion (Figure 5). The years with the largest positive runoff anomalies (2010, 2013, 2024) are a perfect match for the years with the largest positive snowmelt anomalies (Figure 5b,f). The contribution from precipitation, however, is inconsistent. While it showed a positive anomaly in 2010, thereby amplifying the runoff, it was significantly below average in the other extreme years of 2013 and 2024 (Figure 5d). These findings demonstrate that extreme runoff events can occur independently of precipitation anomalies and are primarily governed by exceptional snowmelt, even under relatively low precipitation.
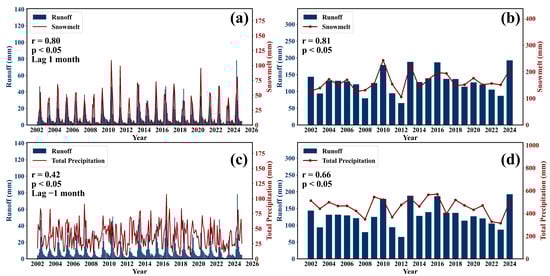
Figure 4.
Correlation between basin-averaged runoff and hydroclimatic variables from 2002 to 2024. (a) Monthly runoff and snowmelt time series. (b) Annual runoff versus annual snowmelt. (c) Monthly runoff and total precipitation time series. (d) Annual runoff versus annual total precipitation. Pearson correlation coefficients (r), p, and significant time lags are shown for each relationship.
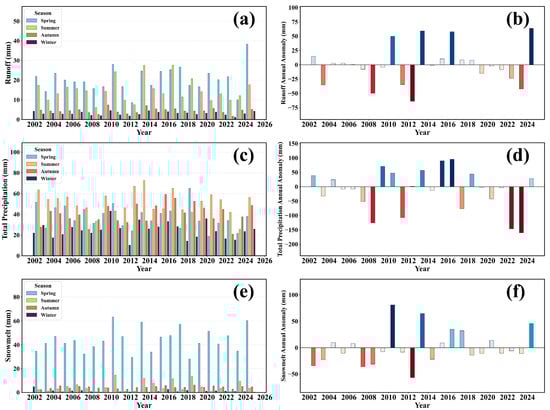
Figure 5.
Seasonal variations (a,c,e) and annual anomalies (b,d,f) of runoff, total precipitation, and snowmelt. In panels (b,d,f), blue bars indicate positive annual anomalies and red bars indicate negative annual anomalies relative to the 1991–2020 climatological mean.
3.4. River Discharge Dynamics and Spatial Patterns
This study employed the GloFAS v4.0 dataset to systematically analyze the river discharge dynamics in the Zaysan and Ulungur lake basins and their impact on lake water level variations. Major river channels with catchment areas greater than 5000 km2 were extracted using the auxiliary tools provided by GloFAS.
3.4.1. Seasonal Regimes and Annual Anomalies
The daily river discharge and its 30-day moving average reveal distinct and consistent seasonal patterns for both lake systems (Figure 6a,b). Lake Zaysan exhibits a pronounced bimodal (two-peak) discharge regime (Figure 6c). Lake Zaysan exhibits a sharp, high-magnitude primary peak in spring (April–May), followed by a second, broader, and more sustained peak through the summer (June–August). This bimodal pattern aligns closely with the regional climate cycle: the first peak aligns with the intense snowmelt season in the mid- to high-altitude mountains, while the second, longer-lasting peak aligns with the main summer precipitation season. In contrast, Lake Ulungur displays a more temporally compressed and less distinctly bimodal discharge pattern. It typically presents a minor, precursor peak in spring, which is quickly followed by a dominant, more sharply defined main peak in early summer (May–June) that constitutes its primary inflow period (Figure 6d). Annual discharge anomalies, calculated relative to the long-term climatological mean, show a strong interannual variability, characterized by a clear alternation between wet and dry periods (Figure 6e,f). The magnitude of these anomalies is substantial, often representing a significant fraction of the mean annual flow. Years with significant positive anomalies—such as 2010, 2013, 2016, and 2024—directly coincide with the years of rapid lake water level rise (Figure 7). The defining characteristic of these high-inflow years is the cumulative effect of enhanced discharge across the entire melt season. The seasonal hydrographs show that both the spring snowmelt-driven peak and the summer precipitation-driven peak are significantly amplified above their long-term averages.
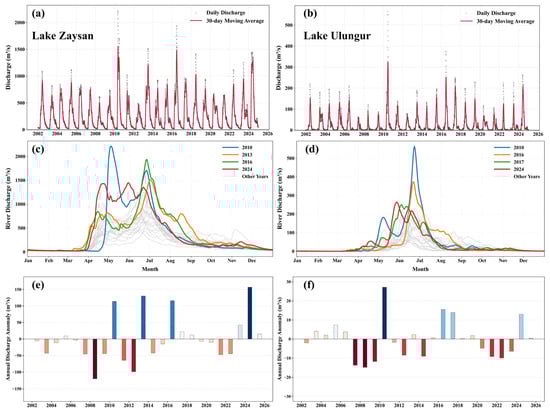
Figure 6.
Interannual and seasonal variations in river discharge for Lake Zaysan (a,c,e) and Lake Ulungur (b,d,f) from 2002 to 2024. The panels depict: (a,b) daily discharge and 30-day moving averages; (c,d) seasonal hydrographs with highlighted typical years; and (e,f) annual discharge anomalies. In panels (e,f), blue bars indicate positive annual discharge anomalies and red bars indicate negative annual discharge anomalies relative to the climatological mean.
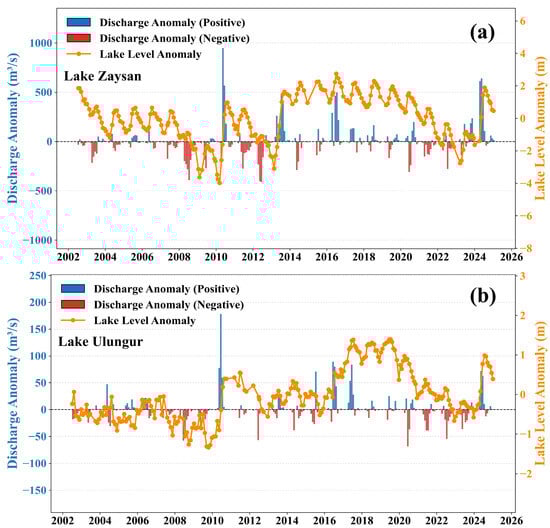
Figure 7.
Temporal correspondence between monthly river discharge anomalies (bars) and lake level anomalies (orange line) from 2003 to 2024:(a) Lake Zaysan; (b) Lake Ulungur.
3.4.2. Spatial Distribution of Discharge Anomalies
The spatial distribution of the sum of river discharge anomalies was mapped for the spring (April–May) and summer (June–August) seasons of extreme years 2010, 2013, 2016, and 2024 (Figure 8),with maps for all years provided in Appendix A Figure A1.
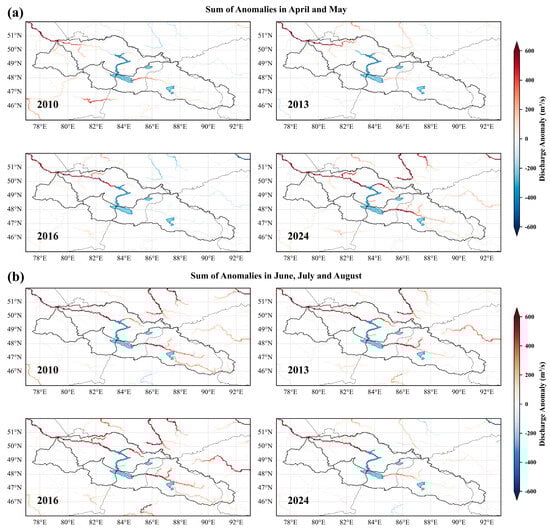
Figure 8.
Spatial distribution of river discharge anomalies in the Irtysh River Basin for typical years. (a) Sum of anomalies in April and May for 2010, 2013, 2016, and 2024. (b) Sum of anomalies in June, July, and August for the same years. Positive anomalies (red) indicate higher-than-average discharge, while negative anomalies (blue) indicate lower-than-average discharge.
In spring (Figure 8a), the maps reveal a consistent pattern where pronounced positive discharge anomalies (in red) originate and are intensely concentrated in the headwater catchments of the upper Irtysh River. These high anomalies are particularly prominent in the tributaries draining the high-altitude regions that constitute the primary inflows to both Lake Zaysan and Lake Ulungur, while the main river channel downstream remains near-neutral or shows slight negative anomalies. This spatial contrast clearly delineates the mountainous headwaters as the primary source of surplus runoff during the spring melt season, underscoring their critical role in driving early-season hydrological extremes.
By the summer season (Figure 8b), the spatial anomaly pattern undergoes a significant transformation, illustrating the downstream routing of the initial spring meltwater pulse. The dominant positive anomaly migrates from the headwater catchments into the main Irtysh River channel. Concurrently, a critical observation is the emergence of significant positive anomalies at the outlets of both lakes. This observation suggests that inflow volumes during these periods were not only sufficient to raise lake levels but also to exceed the lakes’ storage capacities, resulting in elevated outflows from the basin system.
4. Discussion
4.1. Hydrological Attribution and Climatic Teleconnections of Extreme Water Level Changes
The water level time series reconstructed in this study from multi-source remote sensing data reveals the sensitive response of the lake system within the study area to upstream hydrological processes. Our analysis demonstrates a strong linear relationship between the cumulative discharge anomaly and the lake level anomaly (Figure 9 with r up to 0.95), providing direct observational evidence that snowmelt runoff is the dominant driver of lake storage dynamics. This finding is consistent with the results of regional hydrological models [], collectively establishing the central role of the snowmelt process in the basin’s overall hydrological cycle.
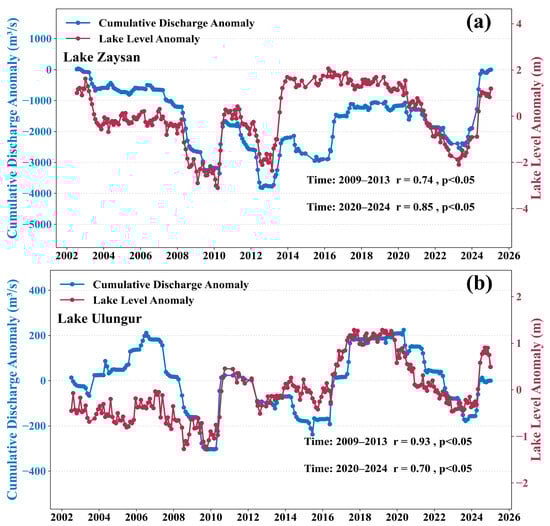
Figure 9.
Correlation between cumulative discharge anomaly and lake level anomaly. (a) Lake Zaysan and (b) Lake Ulungur, with correlation statistics for selected periods.
Notably, Lake Markakol, situated at a higher elevation within the same basin, exhibited significant stability during the same period and did not experience similar dramatic fluctuations. This spatial heterogeneity, in turn, underscores the unique vulnerability of the lower-elevation lakes, particularly Zaysan and Ulungur, to abrupt hydrological events driven by snowmelt dynamics. The intra-annual water level surges we documented in 2010, 2013, and 2024, which exceeded 5 m, serve as a direct manifestation of this vulnerability.
To investigate the reason of these extreme events, we further analyzed their underlying large-scale climatic drivers (Figure 10). We found that these events are not triggered by a single, repetitive climatic pattern but are linked to a complex synergy between the Arctic Oscillation (AO) and the El Niño-Southern Oscillation (ENSO), with evidence suggesting the existence of two distinct driver pathways. The first pathway is characterized by a strongly negative AO phase as the core dynamic condition, which was prominent in the 2010 and 2013 events. A strong negative AO is often associated with a prolonged cold season and a delayed spring warming in the mid-latitudes of Eurasia, creating the conditions for a “snowmelt pulse” where the entire winter’s snowpack ablates over a short duration []. The 2010 event was amplified by a concurrent strong El Niño, which provided abundant winter snowfall []. The case of 2013, however, reveals a more unique role for the AO: against a backdrop of a weak ENSO signal and non-anomalous regional snowpack, a strong negative AO anomaly was very likely the critical factor in initiating that year’s extreme melt process.
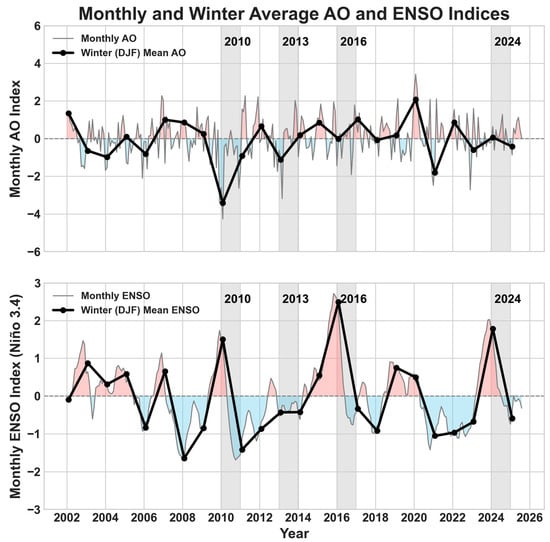
Figure 10.
Time series of the Arctic Oscillation (AO) index (top panel) and the ENSO Niño 3.4 index (bottom panel) from 2002 to 2024. The thin gray lines represent monthly values, while the bold black lines with markers show the winter (December–January–February, DJF) average. For both indices, positive phases are shaded in red and negative phases in blue. The gray vertical bars highlight the years of extreme snowmelt-driven lake level rise identified in this study (2010, 2013, 2016, and 2024).
In contrast, the events of 2016 and 2024 appear to be more strongly driven by ENSO. Both events were preceded by strong El Niño phases, most notably in 2015–2016. By modifying atmospheric circulation, a strong El Niño enhances moisture transport into the interior of Central Asia, contributing to the formation of an anomalously deep winter snowpack []. Under such conditions where the winter snowpack is substantially larger than average, normal seasonal warming may be sufficient to generate large-scale snowmelt runoff, even without a strong negative AO phase acting as an additional dynamic trigger.
4.2. Methodological Implications and Limitations of Multi-Source Data Fusion
Satellite altimetry data (ICESat, CryoSat-2, ICESat-2) provided a direct, high-frequency time series of lake water levels with centimeter-level precision. These time series provided critical evidence for detecting hydrological abrupt events and quantifying their magnitude and duration. To bridge the gap between observation and process attribution, hydro-climatic reanalysis datasets (GloFAS and ERA5) served as an essential tool. GloFAS provided a spatially continuous runoff field to enable the correlation analysis between upstream runoff generation and downstream lake response, while ERA5 offered the necessary meteorological background to understand the climatic factors driving these changes. Although direct validation against local ground measurements was not feasible due to data scarcity in this remote region, both ERA5 and GloFAS have been extensively validated in similar high-elevation mountain environments. ERA5 has demonstrated reliable performance in representing precipitation, temperature, and snowpack dynamics in semi-arid mountain regions and Arctic environments [,,], while GloFAS has shown skillful discharge simulation in 86% of global catchments and superior performance in high-altitude alpine regions similar to our study area [,]. This approach can be further enhanced by incorporating spatially explicit “area” information from optical remote sensing, which related studies use to monitor snow-covered area and lake surface extent, allowing for a more comprehensive characterization of the spatiotemporal features of hydrological events []. However, this framework also has its limitations. The main uncertainty stems from the accuracy of reanalysis data, as some studies suggest that ERA5 may overestimate snow water equivalent in certain mountainous regions. Therefore, a direction for future research is to focus on assimilating higher-resolution remote sensing products (e.g., the Sentinel series) into hydrological models. This strategy has been demonstrated to reduce model uncertainty and improve the accuracy of snowmelt runoff processes [].
4.3. Implications for Adaptive Management in a Transboundary Basin
The findings of this study have clear important scientific and practical implications for water resource management in the Irtysh River Basin. Existing reservoir operation and water allocation strategies largely rely on statistical patterns derived from historical observational data []. However, this study highlights extreme “snowmelt pulse” events—driven by climatic factors and characterized by low predictability—as a key variable affecting the basin’s water balance. This indicates that management models based on the traditional assumption of historical stationarity may be less effective in coping with the increasing hydrological uncertainty in the context of future climate change. Therefore, enhancing the adaptive management capacity of the basin is crucial. The lack of a joint monitoring mechanism in the basin has already been pointed out in previous reviews []. This study further identifies the specific variables that should be prioritized for monitoring and sharing: the dynamics of Snow Water Equivalent (SWE) in the upstream high-mountain areas and the timing and intensity of its seasonal melt. Integrating this near-real-time physical process information into basin-scale joint reservoir operation models will help in formulating proactive strategies for potential extreme snowmelt events, such as optimizing flood control storage or adjusting water use plan. Such measures would significantly enhance the basin’s resilience to hydrological extremes under future climate scenarios [].
5. Conclusions
Based on the integration of multi-source satellite altimetry data, this study systematically reconstructed the continuous water level history of key lakes (Lake Zaysan, Lake Ulungur) in the Irtysh River Basin from 2003 to 2024. By integrating ICESat, CryoSat-2, and ICESat-2 data, a 21-year high-precision time series of lake water levels was generated, capturing multiple dramatic water level fluctuations. Several extreme event years were identified, including 2010, 2013, and 2024, during which intra-annual water level changes in Lake Zaysan exceeded 5 m. A direct link between snowmelt runoff and lake levels was revealed, as comparative analysis not only shows that the reconstructed lake level changes are highly related with the basin’s snowmelt runoff simulated by GloFAS but also presents clear spatial patterns of runoff anomaly propagation along the river network. Together, these findings establish the direct connection between snowmelt runoff and lake levels. The sharp rise in lake levels, especially in extreme event years, is directly related to the large volume of snowmelt runoff in spring, providing direct observational evidence that high-mountain snowmelt is the dominant driver of hydrological variability in the basin. Additionally, a clear seasonal “bimodal” runoff regime was identified, characterized by two distinct inflow peaks: an early spring peak driven by snowmelt, which constitutes the primary recharge event, and a secondary summer peak associated with basin-wide precipitation. This finding provides a new perspective for understanding the intra-annual complexity of the basin’s hydrological cycle. Finally, this study highlights critical implications for water resource management. The occurrence of extreme water level surges driven by intense snowmelt events challenges the effectiveness of the traditional water resource management models, which are based on historical average data. Our study underscores the importance of enhancing future water resource management by prioritizing the monitoring and prediction of upstream snow dynamics, particularly in arid regions at high elevations and high latitudes, to strengthen adaptive capacity to extreme hydrological events.
Future improvements could be achieved through hybrid validation approaches combining satellite and in situ observations. Accessing restricted gauge data through institutional collaborations with regional hydrological agencies would provide critical ground-truth validation. Furthermore, integrating multi-source altimetry with water balance modeling and optical remote sensing (e.g., Landsat/Sentinel-2 lake area changes) would offer complementary constraints on volume dynamics and enhance uncertainty quantification.
Author Contributions
Conceptualization, Q.W.; methodology, Y.X.; software, H.Z.; validation, H.Z.; formal analysis, Y.X.; investigation, Y.X.; resources, Q.W.; data curation, H.Z.; writing—original draft preparation, Y.X.; writing—review and editing, H.Z., Q.W. and H.X.; visualization, Y.X.; supervision, Q.W. and W.S.; project administration, Q.W.; funding acquisition, Q.W. and W.S. All authors have read and agreed to the published version of the manuscript.
Funding
This work was supported by the National Natural Science Foundation of China (Grant Nos. 42474007, 42104010, 42174097, 41974093, and 41774088) and the Fundamental Research Funds for the Central Universities.
Data Availability Statement
The datasets generated and analyzed during the current study are available from the corresponding author on reasonable request. ICESat GLAS GLAH14 (Release 34) and ICESat-2 ATL13 (Version 6) data are available at https://nsidc.org/data/GLA14/versions/34 and https://nsidc.org/data/atl13/versions/6, (accessed on 15 January 2025). CryoSat-2 Level-2 GDR data can be accessed at ftp://science-pds.cryosat.esa.int (accessed on 10 April 2025). ERA5-Land monthly means are available at https://cds.climate.copernicus.eu/datasets/reanalysis-era5-land-monthly-means?tab=download (accessed on 12 April 2025). GloFAS v4.0 historical reanalysis data can be obtained at https://ewds.climate.copernicus.eu/datasets/cems-glofas-historical?tab=download (accessed on 20 March 2025). HydroLAKES and HydroBASINS databases are accessible at https://www.hydrosheds.org/products/hydrolakes and https://www.hydrosheds.org/products/hydrobasins, (accessed on 18 January 2025). DAHITI database is available at https://dahiti.dgfi.tum.de/ (accessed on 8 April 2025). Arctic Oscillation (AO) Index and ENSO Niño 3.4 Index can be accessed at https://www.cpc.ncep.noaa.gov/products/precip/CWlink/daily_ao_index/ao.shtml and https://psl.noaa.gov/gcos_wgsp/Timeseries/Nino34/, (accessed on 15 April 2025).
Acknowledgments
We thank the European Space Agency (ESA), the National Snow and Ice Data Center (NSIDC), and the Copernicus Climate Data Store (CDS) for providing open-access datasets, and we appreciate the editor and anonymous reviewers for their constructive comments.
Conflicts of Interest
The authors declare no conflicts of interest.
Appendix A

Figure A1.
Spatial distribution of the sum of river discharge anomalies for April–May across all studied years (2002–2024). Red indicates positive anomalies (wetter than average), while blue indicates negative anomalies.

Figure A2.
Spatial distribution of the sum of river discharge anomalies for June–August across all studied years (2002–2024). Red indicates positive anomalies (wetter than average), while blue indicates negative anomalies.
References
- Williamson, C.E.; Saros, J.E.; Vincent, W.F.; Smol, J.P. Lakes and Reservoirs as Sentinels, Integrators, and Regulators of Climate Change. Limnol. Oceanogr. 2009, 54, 2273–2282. [Google Scholar] [CrossRef]
- Woolway, R.I.; Kraemer, B.M.; Lenters, J.D.; Merchant, C.J.; O’Reilly, C.M.; Sharma, S. Global Lake Responses to Climate Change. Nat. Rev. Earth Env. 2020, 1, 388–403. [Google Scholar] [CrossRef]
- Cooley, S.W.; Ryan, J.C.; Smith, L.C. Human Alteration of Global Surface Water Storage Variability. Nature 2021, 591, 78–81. [Google Scholar] [CrossRef]
- Bai, J.; Chen, X.; Li, J.; Yang, L.; Fang, H. Changes in the Area of Inland Lakes in Arid Regions of Central Asia during the Past 30 Years. Env. Monit. Assess. 2011, 178, 247–256. [Google Scholar] [CrossRef]
- Yao, F.; Livneh, B.; Rajagopalan, B.; Wang, J.; Crétaux, J.-F.; Wada, Y.; Berge-Nguyen, M. Satellites Reveal Widespread Decline in Global Lake Water Storage. Science 2023, 380, 743–749. [Google Scholar] [CrossRef]
- Xu, F.; Zhang, G.; Yi, S.; Chen, W. Seasonal Trends and Cycles of Lake-Level Variations over the Tibetan Plateau Using Multi-Sensor Altimetry Data. J. Hydrol. 2022, 604, 127251. [Google Scholar] [CrossRef]
- Song, L.; Song, C.; Luo, S.; Chen, T.; Liu, K.; Zhang, Y.; Ke, L. Integrating ICESat-2 Altimetry and Machine Learning to Estimate the Seasonal Water Level and Storage Variations of National-Scale Lakes in China. Remote Sens. Environ. 2023, 294, 113657. [Google Scholar] [CrossRef]
- Wang, Q.; Yi, S.; Sun, W. The Changing Pattern of Lake and Its Contribution to Increased Mass in the Tibetan Plateau Derived from GRACE and ICESat Data. Geophys. J. Int. 2016, 207, 528–541. [Google Scholar] [CrossRef]
- Karatayev, M.; Rivotti, P.; Sobral Mourão, Z.; Konadu, D.D.; Shah, N.; Clarke, M. The Water-Energy-Food Nexus in Kazakhstan: Challenges and Opportunities. Energy Procedia 2017, 125, 63–70. [Google Scholar] [CrossRef]
- Wen, Z.; Yi, S.; Sun, W. Significant Contribution of the Tianshan Lakes to Their Water Storage and Water Resources. J. Hydrol. Reg. Stud. 2024, 53, 101813. [Google Scholar] [CrossRef]
- Zhu, E.; Samat, A.; Li, W.; Xu, R.; Xia, J.; Qiu, Y.; Abuduwaili, J. Intra- and Inter-Annual Spatiotemporal Variations and Climatic Driving Factors of Surface Water Area in the Irtysh River Basin during 1985–2022. Remote Sens. Appl. Soc. Environ. 2025, 37, 101455. [Google Scholar] [CrossRef]
- Li, J.; Xia, Z.; Yin, W.; Jia, H. Instream Ecological Flow and Reservoir Ecological Operation in the Upper Reaches of Irtysh River. MATEC Web Conf. 2018, 246, 01103. [Google Scholar] [CrossRef]
- Wu, X.; Zhang, W.; Li, H.; Long, Y.; Pan, X.; Shen, Y. Analysis of Seasonal Snowmelt Contribution Using a Distributed Energy Balance Model for a River Basin in the Altai Mountains of Northwestern China. Hydrol. Process. 2021, 35, e14046. [Google Scholar] [CrossRef]
- Huang, W.; Duan, W.; Nover, D.; Sahu, N.; Chen, Y. An Integrated Assessment of Surface Water Dynamics in the Irtysh River Basin during 1990–2019 and Exploratory Factor Analyses. J. Hydrol. 2021, 593, 125905. [Google Scholar] [CrossRef]
- Radelyuk, I.; Zhang, L.; Assanov, D.; Maratova, G.; Tussupova, K. A State-of-the-Art and Future Perspectives of Transboundary Rivers in the Cold Climate—A Systematic Review of Irtysh River. J. Hydrol. Reg. Stud. 2022, 42, 101173. [Google Scholar] [CrossRef]
- Zhang, W.; Kang, S.; Shen, Y.; He, J.; Chen, A. Response of Snow Hydrological Processes to a Changing Climate during 1961 to 2016 in the Headwater of Irtysh River Basin, Chinese Altai Mountains. J. Mt. Sci. 2017, 14, 2295–2310. [Google Scholar] [CrossRef]
- Yang, Y.; Wu, X.-J.; Liu, S.-W.; Xiao, C.-D.; Wang, X. Valuating Service Loss of Snow Cover in Irtysh River Basin. Adv. Clim. Change Res. 2019, 10, 109–114. [Google Scholar] [CrossRef]
- Fugazza, D.; Shaw, T.E.; Mashtayeva, S.; Brock, B. Inter-annual Variability in Snow Cover Depletion Patterns and Atmospheric Circulation Indices in the Upper Irtysh Basin, Central Asia. Hydrol. Process. 2020, 34, 3738–3757. [Google Scholar] [CrossRef]
- Messager, M.L.; Lehner, B.; Grill, G.; Nedeva, I.; Schmitt, O. Estimating the Volume and Age of Water Stored in Global Lakes Using a Geo-Statistical Approach. Nat. Commun. 2016, 7, 13603. [Google Scholar] [CrossRef]
- Wang, Q.; Yi, S.; Sun, W. Continuous Estimates of Glacier Mass Balance in High Mountain Asia Based on ICESat-1,2 and GRACE/GRACE Follow-On Data. Geophys. Res. Lett. 2021, 48, e2020GL090954. [Google Scholar] [CrossRef]
- Wang, Q.; Sun, W. Seasonal Cycles of High Mountain Asia Glacier Surface Elevation Detected by ICESat-2. JGR Atmospheres 2022, 127, e2022JD037501. [Google Scholar] [CrossRef]
- Markus, T.; Neumann, T.; Martino, A.; Abdalati, W.; Brunt, K.; Csatho, B.; Farrell, S.; Fricker, H.; Gardner, A.; Harding, D.; et al. The Ice, Cloud, and Land Elevation Satellite-2 (ICESat-2): Science Requirements, Concept, and Implementation. Remote Sens. Environ. 2017, 190, 260–273. [Google Scholar] [CrossRef]
- Lehner, B.; Grill, G. Global River Hydrography and Network Routing: Baseline Data and New Approaches to Study the World’s Large River Systems. Hydrol. Process. 2013, 27, 2171–2186. [Google Scholar] [CrossRef]
- Zwally, H.J.; Schutz, B.; Abdalati, W.; Abshire, J.; Bentley, C.; Brenner, A.; Bufton, J.; Dezio, J.; Hancock, D.; Harding, D.; et al. ICESat’s Laser Measurements of Polar Ice, Atmosphere, Ocean, and Land. J. Geodyn. 2002, 34, 405–445. [Google Scholar] [CrossRef]
- Schutz, B.E.; Zwally, H.J.; Shuman, C.A.; Hancock, D.; DiMarzio, J.P. Overview of the ICESat Mission. Geophys. Res. Lett. 2005, 32, 2005GL024009. [Google Scholar] [CrossRef]
- Zhang, G.; Chen, W.; Xie, H. Tibetan Plateau’s Lake Level and Volume Changes from NASA’s ICESat/ICESat-2 and Landsat Missions. Geophys. Res. Lett. 2019, 46, 13107–13118. [Google Scholar] [CrossRef]
- Bhang, K.J.; Schwartz, F.W.; Braun, A. Verification of the Vertical Error in C-Band SRTM DEM Using ICESat and Landsat-7, Otter Tail County, MN. IEEE Trans. Geosci. Remote Sens. 2007, 45, 36–44. [Google Scholar] [CrossRef]
- Song, C.; Ye, Q.; Sheng, Y.; Gong, T. Combined ICESat and CryoSat-2 Altimetry for Accessing Water Level Dynamics of Tibetan Lakes over 2003–2014. Water 2015, 7, 4685–4700. [Google Scholar] [CrossRef]
- Zwally, H.J.; Schutz, R.; Hancock, D.; DiMarzio, J. GLAS/ICESat L2 Global Land Surface Altimetry Data (HDF5); Version 34; NASA National Snow and Ice Data Center Distributed Active Archive Center: Boulder, CO, USA, 2014; Available online: https://doi.org/10.5067/ICESAT/GLAS/DATA211 (accessed on 15 April 2025).
- Neumann, T.A.; Martino, A.J.; Markus, T.; Bae, S.; Bock, M.R.; Brenner, A.C.; Brunt, K.M.; Cavanaugh, J.; Fernandes, S.T.; Hancock, D.W.; et al. The Ice, Cloud, and Land Elevation Satellite—2 Mission: A Global Geolocated Photon Product Derived from the Advanced Topographic Laser Altimeter System. Remote Sens. Environ. 2019, 233, 111325. [Google Scholar] [CrossRef]
- Jasinski, M.; Stoll, J.; Hancock, D.; Robbins, J.; Nattala, J.; Pavelsky, T.; Morrison, J.; Jones, B.; Ondrusek, M.; Parrish, C.; et al. ICESat-2 Science Team. ATLAS/ICESat-2 L3A ICESat-2 Along Track Inland Surface Water Data, Release 6; NASA National Snow and Ice Data Center Distributed Active Archive Center: Boulder, CO, USA, 2023; Available online: https://nsidc.org/data/atl13/versions/6 (accessed on 15 April 2025).
- Wingham, D.J.; Francis, C.R.; Baker, S.; Bouzinac, C.; Brockley, D.; Cullen, R.; De Chateau-Thierry, P.; Laxon, S.W.; Mallow, U.; Mavrocordatos, C.; et al. CryoSat: A Mission to Determine the Fluctuations in Earth’s Land and Marine Ice Fields. Adv. Space Res. 2006, 37, 841–871. [Google Scholar] [CrossRef]
- Labroue, S.; Boy, F.; Picot, N.; Urvoy, M.; Ablain, M. First Quality Assessment of the Cryosat-2 Altimetric System over Ocean. Adv. Space Res. 2012, 50, 1030–1045. [Google Scholar] [CrossRef]
- Jiang, L.; Nielsen, K.; Andersen, O.B.; Bauer-Gottwein, P. Monitoring Recent Lake Level Variations on the Tibetan Plateau Using CryoSat-2 SARIn Mode Data. J. Hydrol. 2017, 544, 109–124. [Google Scholar] [CrossRef]
- Zhang, H.; Kou, X.; Xu, H.; Yi, S.; Sun, W.; Wang, Q. Assessing CryoSat-2 Satellite’s Seasonal Accuracy in Lake Water Level Monitoring. Geod. Geodyn. 2025, 16, 172–182. [Google Scholar] [CrossRef]
- Baba, M.W.; Boudhar, A.; Gascoin, S.; Hanich, L.; Marchane, A.; Chehbouni, A. Assessment of MERRA-2 and ERA5 to Model the Snow Water Equivalent in the High Atlas (1981–2019). Water 2021, 13, 890. [Google Scholar] [CrossRef]
- Hersbach, H.; Bell, B.; Berrisford, P.; Hirahara, S.; Horányi, A.; Muñoz-Sabater, J.; Nicolas, J.; Peubey, C.; Radu, R.; Schepers, D.; et al. The ERA5 Global Reanalysis. Quart. J. R. Meteoro. Soc. 2020, 146, 1999–2049. [Google Scholar] [CrossRef]
- Harrigan, S.; Zsoter, E.; Alfieri, L.; Prudhomme, C.; Salamon, P.; Wetterhall, F.; Barnard, C.; Cloke, H.; Pappenberger, F. GloFAS-ERA5 Operational Global River Discharge Reanalysis 1979–Present. Earth Syst. Sci. Data 2020, 12, 2043–2060. [Google Scholar] [CrossRef]
- Prudhomme, C.; Zsótér, E.; Matthews, G.; Melet, A.; Grimaldi, S.; Zuo, H.; Hansford, E.; Harrigan, S.; Mazzetti, C.; De Boisseson, E.; et al. Global Hydrological Reanalyses: The Value of River Discharge Information for World-wide Downstream Applications—The Example of the Global Flood Awareness System GloFAS. Meteorol. Appl. 2024, 31, e2192. [Google Scholar] [CrossRef]
- Alfieri, L.; Lorini, V.; Hirpa, F.A.; Harrigan, S.; Zsoter, E.; Prudhomme, C.; Salamon, P. A Global Streamflow Reanalysis for 1980–2018. J. Hydrol. X 2020, 6, 100049. [Google Scholar] [CrossRef]
- Luo, S.; Song, C.; Ke, L.; Zhan, P.; Fan, C.; Liu, K.; Chen, T.; Wang, J.; Zhu, J. Satellite Laser Altimetry Reveals a Net Water Mass Gain in Global Lakes with Spatial Heterogeneity in the Early 21st Century. Geophys. Res. Lett. 2022, 49, e2021GL096676. [Google Scholar] [CrossRef]
- Höhle, J.; Höhle, M. Accuracy Assessment of Digital Elevation Models by Means of Robust Statistical Methods. ISPRS J. Photogramm. Remote Sens. 2009, 64, 398–406. [Google Scholar] [CrossRef]
- Graham, R.M.; Hudson, S.R.; Maturilli, M. Improved Performance of ERA5 in Arctic Gateway Relative to Four Global Atmospheric Reanalyses. Geophys. Res. Lett. 2019, 46, 6138–6147. [Google Scholar] [CrossRef]
- Chen, S.; Yang, H.; Zheng, H. Intercomparison of Runoff and River Discharge Reanalysis Datasets at the Upper Jinsha River, an Alpine River on the Eastern Edge of the Tibetan Plateau. Water 2025, 17, 871. [Google Scholar] [CrossRef]
Disclaimer/Publisher’s Note: The statements, opinions and data contained in all publications are solely those of the individual author(s) and contributor(s) and not of MDPI and/or the editor(s). MDPI and/or the editor(s) disclaim responsibility for any injury to people or property resulting from any ideas, methods, instructions or products referred to in the content. |
© 2025 by the authors. Licensee MDPI, Basel, Switzerland. This article is an open access article distributed under the terms and conditions of the Creative Commons Attribution (CC BY) license (https://creativecommons.org/licenses/by/4.0/).