Highlights
What are the main findings?
- For the first time on a global scale, we systematically reveal that the Sentinel-5P (S5P, O2 A-band) and Suomi-NPP (NPP, Thermal Infrared) Cloud Top Height (CTH) products exhibit significant and complementary error characteristics.
- For single-layer liquid clouds over land, the products show opposing systematic biases (S5P underestimates, NPP overestimates), while for ice and multi-layer clouds, they demonstrate distinct advantages in retrieval accuracy and physical sensitivity.
What is the implication of the main finding?
- These complementary error patterns reveal the fundamental limitations of sin-gle-sensor CTH retrievals and highlight the synergistic potential of combining different remote sensing techniques.
- Our study provides the key quantitative foundation for developing next-generation fusion algorithms that can reduce systematic biases by leveraging the strengths of each product, leading to more accurate, all-sky CTH data for weather and climate models.
Abstract
Cloud Top Height (CTH) is a fundamental parameter in atmospheric science, critically influencing Earth’s radiation budget and hydrological cycle. Satellite-based passive remote sensing provides the primary means of monitoring CTH on a global scale due to its extensive spatial coverage. However, these passive retrieval techniques often rely on idealized physical assumptions, leading to significant systematic biases. To quantify these biases, this study provides an evaluation of two prominent passive CTH products, i.e., Sentinel-5P (S5P, O2 A-band) and Suomi-NPP (NPP, thermal infrared), by comparing their global data from July 2018 to June 2019 against the active CloudSat/CALIPSO (CC) reference. The results reveal stark and complementary error patterns. For single-layer liquid clouds over land, the products exhibit opposing biases, with S5P underestimating CTH while NPP overestimates it. For ice clouds, both products show a general underestimation, but NPP is more accurate. In challenging two-layer scenes, both retrieval methods show large systematic biases, with S5P often erroneously detecting the lower cloud layer. These distinct error characteristics highlight the fundamental limitations of single-sensor retrievals and reveal the potential to organically combine the advantages of different products to improve CTH accuracy.
1. Introduction
Clouds, suspended in the atmosphere, play a pivotal role in the Earth’s energy and water cycles. Cloud Top Height (CTH), measured as the vertical distance from the cloud top to the Earth’s surface, is crucial for understanding atmospheric processes and climate dynamics. In convective systems, a higher CTH is often associated with stronger updrafts and a greater likelihood of heavy precipitation [1]. Moreover, a cloud’s CTH is a key factor in governing its interaction with both solar and terrestrial radiation, thereby determining its overall warming or cooling effect on the climate system [2]. Consequently, the accurate retrieval of CTH is essential for understanding the Earth’s precipitation and radiative effect.
Spaceborne CTH retrieval techniques can be categorized into active and passive remote sensing based on their operational principles. Active remote sensing is generally characterized by high accuracy. Its representative instruments, the Cloud Profiling Radar (CPR) on CloudSat and the Cloud-Aerosol Lidar with Orthogonal Polarization (CALIOP) on CALIPSO, provide reliable CTH data and have become the standard reference for evaluating the accuracy of various passive retrieval products [3,4]. In contrast, passive remote sensing offers the advantage of broad spatial coverage. Currently, the primary passive CTH retrieval techniques include those based on the O2 A-band and the Thermal Infrared (TIR). Nevertheless, due to idealized assumptions in retrieval algorithms and complex cloud scenes, these methods often exhibit their own respective systematic biases [5,6].
To improve the accuracy of passive CTH retrievals, it is essential to first understand the inherent limitations of each technique. Retrievals based on the O2 A-band, for instance, rely on significant physical simplifications. Some algorithms (e.g., OCRA/ROCINN_CAL) assume all clouds are composed of liquid water, which introduces systematic biases for ice clouds, while others (e.g., FRESCO and OCRA/ROCINN_CRB) model the cloud as a simplified Lambertian reflector [5]. Similarly, the TIR method’s single-layer assumption is a known weakness, often failing in multi-layer systems by not accounting for inter-layer radiative transfer [7]. These well-documented limitations demonstrate that single-sensor retrievals are often insufficient for providing robust CTH data across the full diversity of complex cloud scenarios. Consequently, multi-sensor synergy, which aims to fuse or combine different datasets, is now considered a key direction for overcoming these individual constraints [8,9].
However, a prerequisite for developing effective fusion methodologies is a foundational, quantitative understanding of how the error patterns of different sensors relate to one another. While the scientific community has extensively validated the performance of individual CTH products, these studies are often “single-sensor validations”. Many rely on disparate ground-truth sources, such as the European Cloudnet network for TROPOMI validation [5] versus the U.S. ARM sites for VIIRS validation [10], making a direct and fair inter-comparison of the their global performance difficult. Even when a unified global benchmark like CloudSat/CALIPSO is used, the research focus has remained on characterizing individual sensor performance [6]. While valuable, this approach typically overlooks a systematic analysis of errors across specific cloud scenes (e.g., mixed-phase or multi-layer systems) and the underlying relationships with physical factors like cloud geometrical thickness. A critical research gap therefore remains: there has been no systematic, global-scale inter-comparison of the operational S5P/TROPOMI and Suomi-NPP/VIIRS CTH products with the explicit goal of identifying and quantifying their complementary error characteristics across a wide range of cloud scenes. This study aims to fill this gap.
Our novelty lies not in simply confirming known retrieval weaknesses, but in providing the first direct characterization of the multi-faceted and complementary nature of the systematic biases between these two key datasets under a unified framework. We reveal a range of synergistic opportunities by quantifying scenarios where the products’ errors are systematically opposing (e.g., single-layer liquid clouds over land), where their performance levels consistently diverge (e.g., for single-layer ice clouds), and where their physical sensitivities to cloud vertical structure are fundamentally different (e.g., in multi-layer systems). This foundational analysis is essential for the development of future data fusion algorithms.
This paper is structured as follows. Section 2 describes the satellite datasets used in this study and their inherent systematic biases. Section 3 introduces the methodology for spatiotemporal data collocation and the evaluation framework. In Section 4, we present and discuss the results, including the detailed error characteristics under various cloud scenarios. Section 5 provides a summary of our findings.
2. Data
This study analyzes systematic biases in the Sentinel-5P and Suomi-NPP cloud products by comparing them against the CloudSat/CALIPSO cloud product for the period of July 2018 to June 2019.
2.1. Sentinel-5P Cloud Products
The Sentinel-5P (S5P) satellite operates in a near-polar, sun-synchronous orbit at an approximate altitude of 824 km [11], with a local equator crossing time of 13:00 [12]. Its core instrument, the Tropospheric Monitoring Instrument (TROPOMI), is a passive push-broom imaging spectrometer that covers several spectral bands, including the O2 A-band centered around 760 nm. The CTH retrievals used in this study are derived from these O2 A-band measurements and are provided in the official L2_CLOUD_product. This product features daily global coverage with a 2600 km swath width and a spatial resolution of 7 km × 3.5 km [11,12].
The TROPOMI CTH retrieval employs the Optical Cloud Recognition Algorithm (OCRA) and Retrieval of Cloud Information using Neural Networks (ROCINN) algorithm suite [5,12]. OCRA determines the cloud fraction by comparing measured reflectance against cloud-free background values [5]. ROCINN then inputs the cloud fraction into a radiative transfer model, retrieving the CTH by fitting modeled radiances to the measured radiances within the O2 A-band [12]. Since the atmospheric oxygen concentration profile is well-known, the measured intensity of solar radiation absorbed within the O2 A-band directly corresponds to the path length of light above the cloud, allowing for the retrieval of the cloud top height [13].
2.2. Suomi-NPP Cloud Products
The Suomi National Polar-orbiting Partnership (NPP) satellite, a joint Earth observation mission of NASA and NOAA [14], operates in a near-polar, sun-synchronous orbit at an approximate altitude of 829 km [15]. Its core instrument, the Visible Infrared Imaging Radiometer Suite (VIIRS), features 22 spectral channels covering the 0.41–12.5 μm wavelength range [15]. It has two different spatial resolutions: 375 m for five high-resolution image bands and 750 m for 16 moderate-resolution bands [5]. This study utilizes the VIIRS Environmental Data Record (EDR) product suite. The VIIRS EDR provides a range of cloud properties, including Cloud Optical Thickness, Cloud Effective Particle Size, Cloud Top Pressure, and Cloud Top Height. From this suite, our analysis exclusively uses the Cloud Top Height (CTH) product, which is derived from thermal infrared (TIR) measurements at a 750 m resolution and features daily global coverage with a 3000 km swath width [10,15].
The algorithm used for VIIRS CTH retrieval is the CO2/Split-Window method [6,14]. This algorithm combines the Split-Window algorithm, which is based on dual infrared window bands (centered at 10.8 μm and 12.0 μm), with the CO2-slicing method, which is based on a CO2 absorption band (centered at 13.5 μm). This combination synergizes the sensitivity to cloud height provided by the CO2 channel and the sensitivity to cloud microphysics offered by the window channels, enabling a more robust CTH retrieval [6].
2.3. CloudSat/CALIPSO Cloud Products
For most of their mission, CloudSat and CALIPSO flew in the A-Train satellite constellation, a sun-synchronous orbit at an altitude of 705 km with a nominal local equator crossing time of 13:30. However, following a spacecraft anomaly, CloudSat was moved to a lower orbit in February 2018. To maintain their synergistic observations, CALIPSO was also lowered to join CloudSat in September 2018, forming the new “C-Train” constellation. Therefore, for the entire duration of our study (July 2018 to June 2019), the data were collected from this new orbital configuration. CloudSat carries the 94 GHz Cloud Profiling Radar (CPR), an active sensor characterized by its high sensitivity to cloud water content and its strong capability to penetrate thick clouds [16]. CALIPSO is equipped with the Cloud–Aerosol Lidar with Orthogonal Polarization (CALIOP), which operates at wavelengths of 532 and 1064 nm. Together, this system utilizes radar reflectivity and lidar depolarization measurements to retrieve cloud phase and vertical distribution [17,18].
This study utilizes the joint CPR and CALIOP product, 2B-CLDCLASS-LIDAR, as the reference for validation. This product provides near-global coverage from 82°S to 82°N with an along-track spatial resolution of 1.4 km [19,20] and contains several key cloud variables, including cloud layer top and base heights, number of cloud layers, cloud phase, and quality flags.
Each sensor has its inherent limitations. The CALIOP lidar signal is quickly attenuated by optically thick clouds, preventing it from detecting the full vertical structure of dense cloud systems. Conversely, the CPR may fail to detect optically thin clouds (e.g., cirrus) due to its lower sensitivity, potentially misidentifying the top of a lower cloud layer as the true cloud top. Additionally, CPR provides a coarse vertical resolution of approximately 500 m [17]. Despite these individual limitations, the 2B-CLDCLASS-LIDAR product is the most suitable benchmark, as it uniquely provides relatively accurate cloud vertical structure data on a near-global scale.
2.4. Systematic Biases
Passive remote sensing algorithms exhibit inherent systematic biases when retrieving cloud parameters, primarily due to their reliance on oversimplified models and idealized assumptions.
The OCRA/ROCINN_CAL algorithm used for TROPOMI/Sentinel-5P (S5P) CTH retrieval assumes clouds consist of liquid water and bases its retrieval on Mie scattering theory. However, clouds in the real atmosphere can also contain ice, a phase for which the current algorithm lacks a specific parameterization [5]. This can lead to an underestimation or low bias in the retrieved S5P CTH for high clouds, which often contain ice crystals. Additionally, Compernolle et al. [5] noted that the S5P cloud retrieval algorithm faces challenges when dealing with low geometric cloud fractions and optically thin clouds.
The CO2/Split-Window algorithm used by VIIRS/Suomi-NPP is based on thermal infrared (TIR) radiative transfer theory. It retrieves Cloud Top Temperature (CTT) from the radiance difference between the 10.8 μm and 12.0 μm infrared window channels, subsequently deriving CTH by referencing atmospheric profile data [21]. A primary limitation of this method is its single-layer cloud assumption, which neglects multi-layer cloud scenarios. In single-layer scenes, where there is no interference from overlying layers, the CTH retrieval accuracy is relatively high. Conversely, in multi-layer systems, the complex interactions of absorption, scattering, and re-emission of infrared radiation by different cloud layers introduce non-linear effects into the radiative transfer equation [22], significantly increasing the CTH retrieval error. Furthermore, the physical properties of infrared radiation can introduce other systematic biases: for thin cirrus clouds, radiative contamination from the warm surface or lower cloud layers can lead to an overestimation of CTT and thus an underestimation of CTH [6]; for low clouds, a large optical thickness or the presence of a boundary layer temperature inversion can lead to an overestimation of CTH [23].
All data processing, including spatiotemporal collocation, statistical analysis, and figure generation, was performed using MATLAB (R2023a, The MathWorks Inc., Natick, MA, USA).
3. Methodology
3.1. Spatiotemporal Collocation
Accurate spatiotemporal collocation of data from Sentinel-5P (S5P) and Suomi-NPP (NPP) is critical for a joint evaluation of their CTH products. Due to their nearly identical orbital parameters, the difference in their equator crossing times is negligible (<1 min), meaning that temporal matching errors between their cloud products can be disregarded. In contrast, the wide swath of S5P (2600 km) can result in a single S5P image overlapping with multiple CloudSat/CALIPSO (CC) orbits. Therefore, we prioritize pairing S5P image with the temporally closest CC orbit.
After that, we perform a nearest-neighbor criterion to form a collocated set linking NPP and CC to S5P. This set is considered a valid match only if it meets strict spatiotemporal thresholds: the temporal difference must be less than 5 min between S5P and NPP and 20 min between S5P and CC, while the spatial separation for all pairs must be less than 5 km. A set of points satisfying these criteria is assumed to observe a cloud with homogeneous microphysical properties.
The 20 min collocation window is a deliberate trade-off between statistical robustness and physical validity. While a shorter window is physically ideal to minimize effects of cloud evolution, the data shown in Figure 1 indicates that a 15 min window would discard ~25% of matched pairs, and a 10 min window would discard ~50%. Such a significant data loss would compromise our subsequent stratified analysis. The 20 min window was therefore selected as a necessary compromise to retain a sufficient sample size.
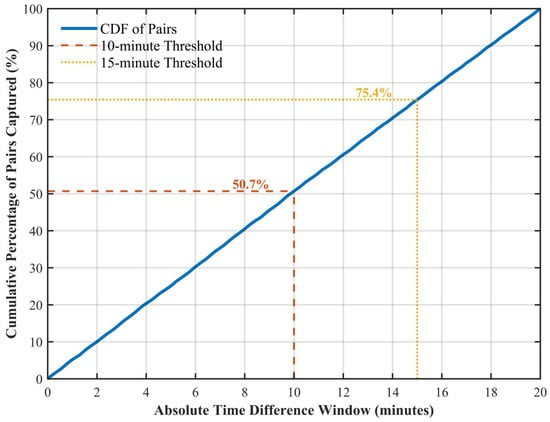
Figure 1.
Cumulative Distribution Function (CDF) of the absolute time difference for all collocated S5P and CloudSat/CALIPSO (CC) pairs. The plot shows the percentage of matched pairs captured as the temporal window increases. The red dashed and yellow dotted lines highlight the 10 min and 15 min thresholds, respectively, revealing that these windows capture 50.7% and 75.4% of the total pairs found within a 20 min maximum window.
Figure 2 shows the distribution of separation distances between the collocated pixel pairs. The distances for S5P-CC collocated pairs are concentrated below 2 km, with the number of pairs decreasing thereafter. For S5P-NPP collocated pairs, the distances peak near 3 km. For both datasets, collocated pairs with a separation distance greater than 4 km are sparse.
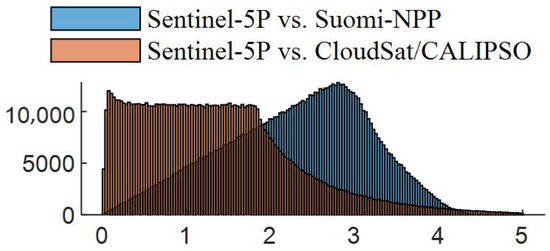
Figure 2.
Histogram of the separation distances for spatiotemporal match-ups between the passive sensor products (S5P, NPP) and the active reference (CC). The blue and orange bars correspond to the number of collocated pairs for S5P-CC and NPP-CC.
3.2. Evaluation Framework
Figure 3 presents a flowchart of the evaluation methodology, which is detailed in the following sub-sections.
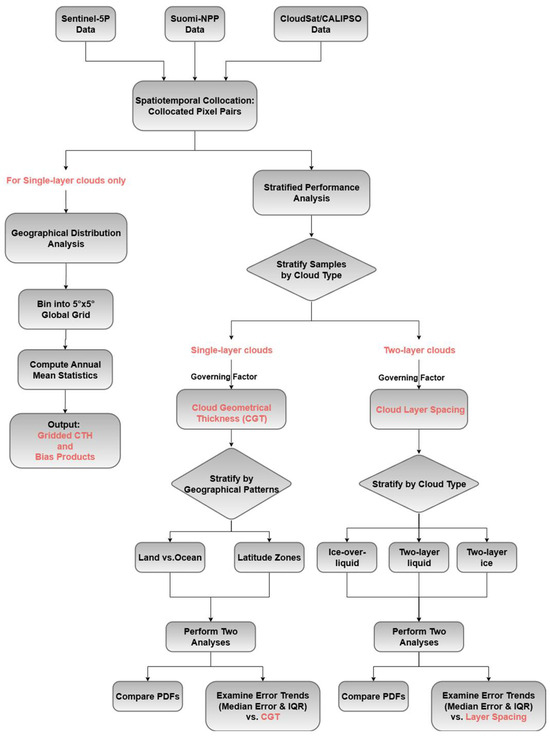
Figure 3.
Flowchart of the Evaluation Methodology. The flowchart illustrates the systematic steps taken to evaluate the Sentinel-5P (S5P) and Suomi-NPP (NPP) Cloud Top Height (CTH) products against the CloudSat/CALIPSO (CC) reference. The methodology is divided into two main parts: (1) Geographical Distribution Analysis and (2) Stratified Performance Analysis. For the stratified analysis, the process branches to address single-layer and two-layer clouds separately, using Cloud Geometrical Thickness (CGT) and cloud layer spacing as the respective governing factors. This analysis includes comparisons of Probability Density Functions (PDFs) and an examination of error trends as a function of the governing factors, with the interquartile range (IQR) used to represent error dispersion.
3.2.1. Geographical Distribution Analysis
To investigate the geographical CTH characteristics, the collocated pixel pairs described in Section 3.1 are first binned into a 5° × 5° global grid. Within each grid cell, we then compute several annual mean statistics: the mean CTH for S5P and NPP individually; their respective retrieval biases against the CC reference product; and the direct difference between the S5P and NPP retrievals. This process results in a suite of gridded data products representing these key CTH characteristics.
3.2.2. Stratified Performance Analysis
To analyze the retrieval errors of the S5P and NPP products in vertical dimension, we select two corresponding key governing factors, Cloud Geometrical Thickness (CGT) and cloud layer spacing, for a stratified analysis of single-layer and two-layer clouds, respectively.
For single-layer clouds, we use CGT as the key governing factor to analyze CTH performance, as its accuracy is strongly correlated with CTH retrievals. The relation CGT = CTH-CBH (Cloud Base Height) is commonly used in current research [24,25]. To account for distinct geographical patterns, samples are first stratified by surface type (ocean vs. land for liquid clouds) or by latitude zone (for ice and mixed-phase clouds). Within these strata, we conduct two types of analyses: a comparison of the Probability Density Functions (PDFs) of CTH from all three products, and an examination of error trends. For the latter, samples are sorted by CGT and binned into 20 quantiles to plot the median retrieval error and direct difference as a function of CGT, with the interquartile range (IQR) representing error dispersion.
For two-layer clouds, we use cloud layer spacing as the governing factor. Studies have indicated that variations in the inter-layer spacing modulate the vertical distribution of clouds, thereby directly influencing CTH measurements [26,27]. A stratified performance analysis, similar to that for single-layer clouds, is then performed for each two-layer cloud type (ice-over-liquid, two-layer liquid, and two-layer ice) without prior geographical stratification.
4. Results
This section presents a detailed analysis of the cloud top height (CTH) retrieval errors. We begin with a global-scale comparison of the Sentinel-5P (S5P) and Suomi-NPP (NPP) products against the CloudSat/CALIPSO (CC) reference for all cloud types combined. We then perform a stratified analysis focusing on single-layer clouds, separately examining scenes with liquid, ice, and mixed-phase clouds. Finally, we investigate the performance of the retrievals in more challenging two-layer cloud systems, including ice-over-liquid, two-layer liquid, and two-layer ice cloud scenarios.
4.1. Global-Scale Comparison
On the global scale, both S5P and NPP reproduce the large-scale CTH patterns, but their systematic errors differ: S5P shows a widespread negative bias, whereas NPP exhibits latitude-banded errors. These contrasts are most evident over land–ocean transitions and in eastern subtropical oceans. Evidence is summarized in Figure 4.
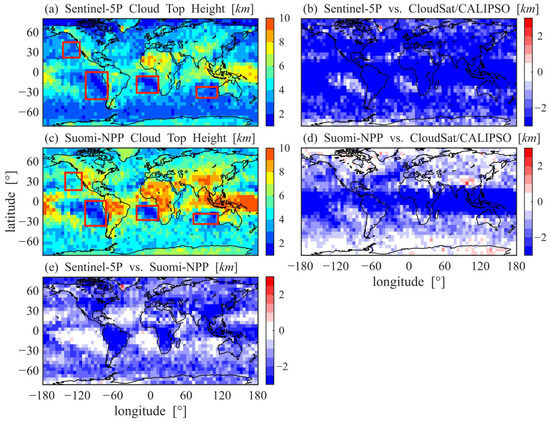
Figure 4.
Global spatial distributions of annual mean Cloud Top Height (CTH) and retrieval differences. (a) Annual mean CTH from S5P, (b) the CTH difference between S5P and the reference value (CC), (c) annual mean CTH from NPP, (d) the CTH difference between NPP and CC, and (e) the direct difference between S5P and NPP. The “difference from the reference value” is calculated within each 5° × 5° longitude-latitude grid cell. The red boxes shown in (a,c) are the regions called the eastern subtropical oceans.
Figure 4a,c display the annual mean spatial distributions of CTH from S5P and NPP, respectively. As shown, the CTH retrieved by S5P and NPP exhibits a similar overall geographical distribution. Both sensors reproduce key climatological features: high CTH over continental convection zones (northern Africa, Asian monsoon regions, tropical Pacific) and low-topped stratocumulus decks over eastern subtropical oceans (west of South America, southern Africa, and Australia). These low-cloud regions (as shown in the red boxes in Figure 4a,c), located over the eastern subtropical oceans [28,29]. The formation of these systems involves a coupled set of factors including large-scale circulation and sea-surface temperature, resulting in CTHs that are significantly lower than those in the Intertropical Convergence Zone or monsoon regions [28].
Figure 4b,d reveal that the CTH retrieval biases for S5P and NPP follow starkly different global patterns. The S5P product (Figure 4b) exhibits a systematical underestimation across most of the globe, with biases typically less than −2 km. Smaller biases, within ±0.5 km, are confined to the eastern subtropical oceans and parts of West Antarctica. In contrast, the NPP bias (Figure 4d) exhibits a distinct latitudinal pattern, with the negative bias generally decreasing from the equator towards the poles. This underestimation is most pronounced in a zonal band between the tropics (bias < −2 km) (The less-than sign here means that the negative absolute value is larger), lessens to approximately 1 km in the mid-latitudes, and becomes minimal in high-latitude regions, where retrievals are highly accurate with biases within ±0.5 km.
To provide a quantitative benchmark for such assessments, we refer to the official Joint Polar Satellite System (JPSS) Level 1 Requirements document, which defines the objective (desired) accuracy for VIIRS CTH as 0.3 km [30]. While formally for VIIRS, we adopt this as an authoritative benchmark for state-of-the-art passive imagers. Accordingly, given the 0.5 km resolution of our geographical analysis, we consider biases within the ±0.5 km range to represent a high level of accuracy.
A direct comparison between the two products (Figure 4e) reveals that S5P’s CTH is generally lower than NPP’s by more than 0.5 km across most of the globe. The primary exception occurs over the eastern subtropical oceans, where the two products show high consistency in these low-cloud zones.
The probability density functions (PDFs) in Figure 5a reveal that the global CTH distribution from NPP aligns more closely with the CloudSat/CALIPSO (CC) reference than S5P’s does. The CC reference data shows a bimodal distribution with a narrow primary peak at 1–2 km and a broader secondary peak at 10–12 km. The NPP product successfully replicates this bimodal structure, matching the primary peak’s location but with its secondary peak shifted approximately 2 km lower and a notable lack of samples above 14 km. In contrast, the S5P product displays a single, sharp peak concentrated at low altitudes (1–3 km), indicating a marked scarcity of high-cloud samples above 12 km. At the same time, an abnormal peak appeared at approximately 15 km in S5P product, which we speculate may be caused by truncation due to the maximum value set in the inversion algorithm. This same anomaly is consistently observed in S5P-derived CTH distributions presented throughout this study.
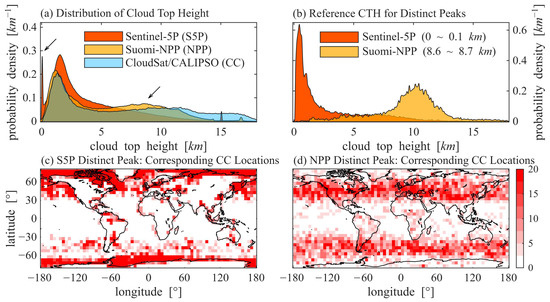
Figure 5.
Analysis of distinct peaks in the CTH distributions. (a) Probability Density Functions (PDFs) of Cloud Top Height (CTH) for Sentinel-5P (S5P), Suomi-NPP (NPP), and the CloudSat/CALIPSO (CC) reference. The distributions are represented by semi-transparent filled areas (orange for S5P, yellow for NPP, and blue for CC); overlapping regions appear as blended colors. (b) the CTH PDF from CC corresponding to the samples within the distinct peaks indicated by the arrow in (a). (c,d) the geographical distributions of samples within the distinct peaks from S5P and NPP, respectively. In (c,d), grid cells are color-coded by the number of samples they contain.
The arrow in Figure 5a highlights two distinct peaks in the S5P and NPP sample density distributions. S5P exhibits a sharp peak near the surface at 0–0.1 km, while NPP shows a secondary mode at 8.6–8.7 km, which is approximately 2 km lower than the secondary peak of the CC product. To investigate the causes of these features, Figure 5b displays the CTH PDFs of the corresponding CC reference samples for each peak. For the S5P distinct peak, the corresponding CC data (orange shaded area) forms a highly concentrated, narrow peak in the 0–2 km range, indicating the S5P retrieval was biased low by approximately 2 km. In the case of the NPP distinct peak, the reference data (yellow shaded area) shows a broad peak centered near 10 km, revealing an underestimation of 1–2 km. The high concentration in both reference distributions suggests that these distinct peaks stem from systematic effects rather than random error.
To investigate the causes of these distinct peaks, we analyzed the geographical distributions of the corresponding CC reference samples in Figure 5c,d. For S5P (Figure 5c), its distinct peak samples appear mainly over the ocean at mid-to-high latitudes (latitude < −30° or >30°) and are highly concentrated in the polar regions (latitude < −60° or >60°), showing distinct latitudinal and land–sea differentiation. This pattern corresponds to the prevalence of low-level stratiform clouds that form over polar oceans [31]. The underestimation is likely a retrieval artifact caused by bright sea ice. In these conditions, multiple scattering of light between the cloud base and the high-albedo surface can lengthen the photon path through the atmosphere [32]. The O2 A-band algorithm may misinterpret the resulting enhanced absorption signature as a signal from a lower altitude, leading to a systematic underestimation of CTH.
In contrast, the NPP peak samples are primarily located in the mid-latitude regions (−60° < latitude < −30° or 30° < latitude < 60°), where they are zonally distributed with a true CTH around 10 km. This distribution is characteristic of upper-tropospheric cloud bands transported along subtropical jet stream pathways [33]. The underestimation may associate with optically thin clouds near the tropopause, which typically resides at 10–13 km in these regions [34]. The first tropopause is defined as the lowest level at which the temperature lapse rate decreases to 2 °C/km or less [35], marking a persistent transition to the stable stratosphere. This inherently means that the tropopause is a layer where the vertical temperature profile changes very little. For clouds at these altitudes, radiative contamination from warmer layers below leads to an erroneously warm temperature measurement. This temperature error is then significantly amplified into a large height underestimation when mapped onto the flat temperature profile of the tropopause, explaining the observed low bias.
Therefore, these two distinct peaks in the passive sensor distributions highlight specific, large-scale cloud regimes where the retrieval performance is systematically challenged.
4.2. Single-Layer Liquid Clouds
Liquid clouds, composed of liquid water droplets in the lower atmosphere, are critical to Earth’s climate system, contributing significantly to the top-of-atmosphere radiation budget by reflecting 27–38% of solar radiation in some regions [36]. Accounting for 48.7% of all cloud samples in this study, single-layer liquid clouds are selected for analysis based on the CloudSat/CALIPSO (CC) cloud phase product. Figure 6 illustrates the geographical distributions of CTH Sentinel-5P (S5P), Suomi-NPP (NPP) and associated retrieval errors.
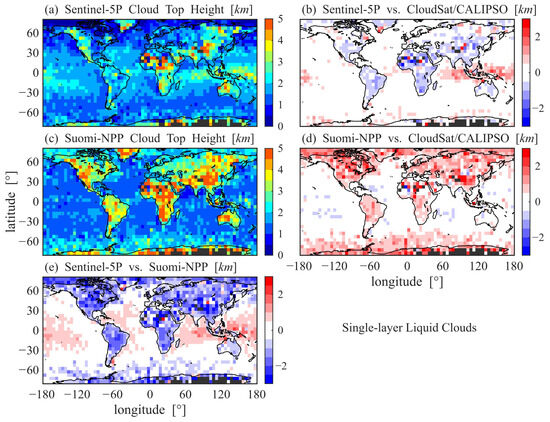
Figure 6.
Spatial distributions of Cloud Top Heigh (CTH) and retrieval differences for single-layer liquid clouds. (a) Annual mean CTH from S5P, (b) the CTH difference between S5P and the reference value (CC), (c) annual mean CTH from NPP, (d) the CTH difference between NPP and the reference value (CC), and (e) the direct difference between S5P and NPP. All data are annually averaged, and differences are calculated relative to the CC reference within each 5° × 5° longitude-latitude grid cell.
The annual mean CTH distributions (Figure 6a,c) show a clear land–sea contrast, with higher cloud tops over land. Compared with the CC reference, both S5P and NPP perform accurately over oceans but exhibit opposite biases over land-S5P underestimates and NPP overestimates CTH, reflecting distinct systematic error mechanisms linked to surface conditions.
The opposing biases over land are clearly detailed in Figure 6b,d. Overall, the accuracy of the S5P CTH retrieval shows a significant land–sea contrast. Over most land areas, S5P systematically underestimates CTH (bias < −0.5 km), particularly in high-cloud regions (Figure 6a). Conversely, NPP systematically overestimates CTH over most land areas (bias > 0.5 km), with higher accuracy observed almost exclusively over Australia. In contrast to their divergent performance over land, both products are highly accurate over most oceanic regions, with biases generally within ±0.5 km, a level that meets the high-accuracy benchmark established in Section 4.1. However, some regional systematic errors persist. As shown in Figure 6b, S5P shows a systematic overestimation (bias > 0.5 km) in the tropical Pacific region where cloud tops are higher. Meanwhile, NPP shows a predominantly positive bias (bias > 0.5 km) in high-latitude regions (Figure 6d).
A direct comparison of the two products (Figure 6e) further highlights these regional differences, revealing a distinct zonal pattern over the oceans. The two products show high consistency (−0.5 km < difference < 0.5 km) over mid-latitude oceans and the eastern subtropical oceans regions. However, S5P’s CTH is generally higher than NPP’s (difference > 0.5 km) in low-latitude oceanic regions, while it is lower than NPP’s (difference < −0.5 km) over land and the Arctic Ocean.
Figure 7a shows the CTH PDFs for single-layer liquid clouds from S5P, NPP, and CC. All three products show a similar unimodal distribution, with high overlap indicating good overall consistency. The primary CTH mode is 0.5–1.5 km for CC and NPP, and slightly higher at 1–2 km for S5P.
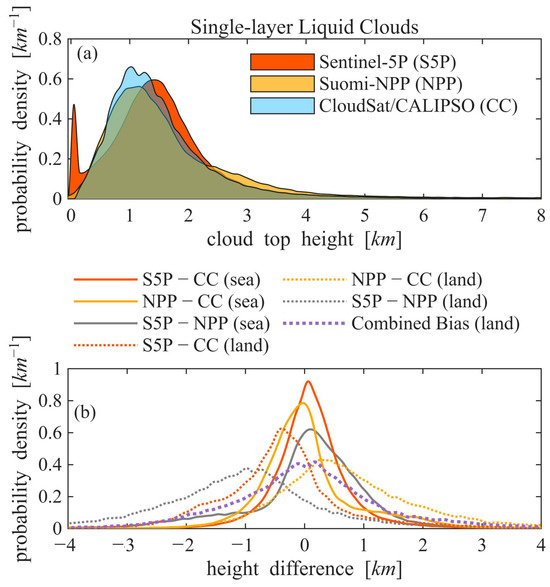
Figure 7.
Probability Density Functions (PDFs) of CTH and retrieval differences for single-layer liquid clouds. (a) Overall CTH PDFs for S5P (orange shaded area), NPP (yellow shaded area), and the CC reference (blue shaded area). (b) PDFs of CTH differences stratified by surface type (solid for ocean and dashed for land). The orange and yellow lines show the individual biases for S5P and NPP relative to the CC reference, respectively. The gray line shows the direct difference between the S5P and NPP products. The purple line represents the Combined Bias, calculated as (S5P Error + NPP Error)/2.
Figure 7b shows the CTH retrieval errors of S5P and NPP over ocean and land. Over oceanic regions, both products perform well, though the NPP error distribution shows a slightly larger dispersion of its underestimation errors compared to S5P’s sharp, symmetric distribution.
Over land, the products exhibit significant and opposing systematic biases. The S5P error distribution (orange dashed line) shows a general underestimation (median bias ≈ −0.4 km) with considerable dispersion. In contrast, the NPP distribution (yellow dashed line) displays a positive bias (median bias ≈ 0.6 km) with even greater error dispersion. This results in a broad difference distribution (gray dashed line) centered at approximately −0.8 km. To test the potential for error cancellation, we calculated the error of a simple combined (S5P + NPP)/2 product, shown by the purple dashed line. The resulting error distribution is remarkably symmetric and centered almost perfectly at zero, providing clear visual evidence that the opposing systematic biases of the two products effectively cancel each other out. Notably, both land distributions have more pronounced tails than their ocean counterparts, indicating a higher frequency of extreme errors.
In summary, for single-layer liquid clouds, both retrievals show low error dispersion over the homogeneous ocean surface, with S5P being slightly more accurate. Over complex land surfaces, however, they diverge, exhibiting opposing systematic biases, increased error dispersion, and more frequent extreme errors. This discovery of opposing biases over land is a prime example of the complementary nature of the two retrieval methods, offering a clear opportunity for error cancellation in future fusion algorithms.
4.3. Single-Layer Ice Clouds
Ice clouds, composed of ice crystals in the upper atmosphere, play a critical role in Earth’s climate system by regulating the radiation balance through the reflection of solar shortwave and trapping of terrestrial longwave radiation [37]. Accounting for 19.0% of all cloud samples in this study, single-layer ice clouds are selected for analysis based on the CloudSat/CALIPSO (CC) cloud phase product. Figure 8 illustrates the geographical distributions of CTH from Sentinel-5P (S5P), Suomi-NPP (NPP) and associated retrieval errors for single-layer ice clouds.
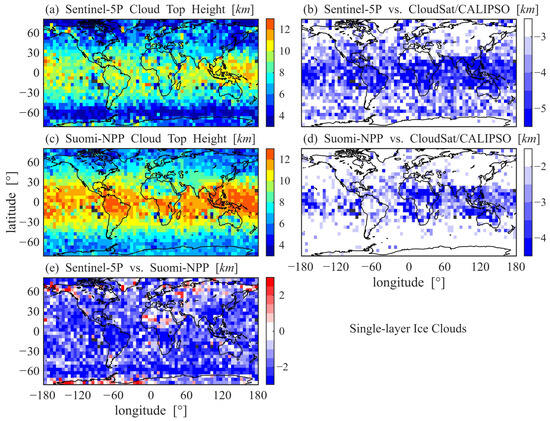
Figure 8.
Spatial distributions of Cloud Top Heigh (CTH) and retrieval differences for single-layer ice clouds. (a) Annual mean CTH from S5P, (b) the CTH difference between S5P and the reference value (CC), (c) annual mean CTH from NPP, (d) the CTH difference between NPP and the reference value (CC), and (e) the direct difference between S5P and NPP. All data are annually averaged, and differences are calculated relative to the CC reference within each 5° × 5° longitude-latitude grid cell.
The distributions of the annual mean CTH for single-layer ice clouds shown in Figure 8a,c exhibit a similar zonal distribution between S5P and NPP products, with high-topped clouds (CTH > 8 km) concentrated in the low-latitude regions (−30 ° < latitude < 30 °). The CTH progressively decreases from the equator towards the poles, with no distinct land–sea contrast.
For single-layer ice clouds, both S5P and NPP underestimate cloud top height compared with the CC reference, with NPP generally more accurate. S5P shows a strong zonal underestimation, largest near the equator (bias < −4 km) and decreasing toward the poles (bias > −3 km). NPP also shows latitudinal variation, with underestimation generally <2 km in mid-to-high latitudes and >2 km in low latitudes, though accuracy is higher over South America.
A direct comparison of the two products (Figure 8e) confirms NPP’s superior performance. S5P’s CTH is lower than NPP’s across most of the globe, with S5P being higher only in small areas over the poles and northern Africa. The difference between the two products shows no clear latitudinal or land–sea pattern.
To further analyze the influence of latitude on ice cloud top height retrieval, Figure 9 presents a stratified analysis using Cloud Geometrical Thickness (CGT) as a governing factor. For clouds in the mid-to-high latitudes (latitudes < −30° or >30°), both S5P and NPP systematically underestimate CTH, with NPP consistently performing better. The Probability Density Functions (PDFs) of CTH (Figure 9a) for CC exhibit a unimodal distribution, with cloud tops concentrated in the range of 8–12 km. In contrast, the cloud tops for S5P and NPP are concentrated at altitudes of 3–7 km and 6–10 km, respectively, indicating an average underestimation of approximately 5 km for S5P and 2 km for NPP. To further investigate this bias, we examine its relationship with cloud geometrical thickness in Figure 9b. For thick clouds (CGT > 3 km), the systematic underestimation in both S5P and NPP CTHs increases with CGT, and NPP’s performance advantage grows correspondingly. For thin clouds (CGT < 3 km), the error fluctuates, with S5P (orange line) showing a larger variation (negative bias ranges from 2 to 3 km) than NPP (yellow line). Consistently, the error dispersion (Interquartile Range, IQR) is large for thin clouds and narrows for thick clouds.
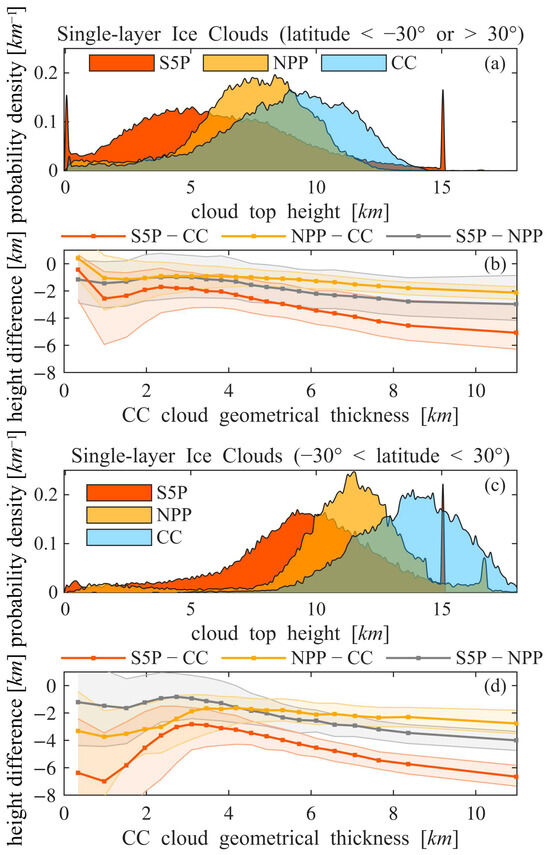
Figure 9.
Analysis of single-layer ice clouds stratified by latitude. (a,c) CTH Probability Density Functions (PDFs) for S5P (orange), NPP (yellow), and CC (blue) in the mid-to-high (latitude < −30° or >30°) and low (−30° < latitude < 30°) latitude zones, respectively. (b,d) Median CTH retrieval error (relative to CC) for S5P (orange line), NPP (yellow line), and their difference (gray line), plotted as a function of Cloud Geometrical Thickness (CGT) for each latitude zone. Samples were sorted by CGT and binned into 20 quantiles; the shaded areas represent the interquartile range (IQR).
For clouds in the low latitudes (−30° < latitudes < 30°), both S5P and NPP retrievals exhibit more severe biases than in the mid-to-high latitudes, though NPP maintains a significant performance advantage. The retrieval errors for both products are highly dependent on Cloud Geometrical Thickness (CGT), with underestimations worsening for thicker clouds and retrievals for thin clouds showing significant instability.
The PDFs for all three products are unimodal (Figure 9c). CC cloud tops are concentrated in the range of 12–16 km. The cloud tops for S5P and NPP are concentrated at altitudes of 8–12 km and 10–14 km, corresponding to the overall underestimation of approximately 4 km and 2 km, respectively. The error trends detailed in Figure 9d are similar to those in the mid-to-high latitudes but more pronounced. For thick clouds (CGT > 3 km), the negative bias for both products increases with CGT, and the widening difference between them confirms NPP’s growing performance advantage as thickness increases. For thin clouds (CGT < 3 km), the error fluctuations are pronounced, and the Interquartile Range (IQR) remains wide, indicating significant retrieval instability.
Throughout the analysis of single-layer ice clouds, NPP’s accuracy is consistently higher than S5P’s, and this superiority becomes more evident as CGT increases. This suggests that the O2 A-band method has greater limitations than the thermal infrared method when addressing the complex scattering properties of ice crystals. This consistent and significant accuracy advantage demonstrates a clear performance complementarity, offering a reliable basis for assigning higher confidence or weight to NPP’s retrieval in any future data fusion scheme for this specific cloud type.
A stratified analysis by latitude further reveals the nuances of each sensor’s performance. The CTH of single-layer ice clouds is significantly higher in low-latitude regions. Both S5P and NPP achieve better CTH retrieval accuracy in the mid-to-high latitudes where cloud tops are lower, and both suffer from severe underestimation and low retrieval stability when retrieving the CTH of geometrically thin ice clouds in the low latitudes.
4.4. Single-Layer Mixed-Phase Clouds
Mixed-phase clouds, systems where liquid water droplets and ice crystals coexist, play a critical role in Earth’s climate system due to their importance for precipitation formation and the radiation balance [38]. Accounting for 17.0% of all cloud samples in this study, single-layer mixed-phase clouds are selected for analysis based on the CloudSat/CALIPSO (CC) cloud phase product. Figure 10 illustrates the geographical distributions of CTH from Sentinel-5P (S5P), Suomi-NPP (NPP), and associated retrieval errors for single-layer mixed-phase clouds.
Figure 10.
Spatial distributions of Cloud Top Heigh (CTH) and retrieval differences for single-layer mixed-phase clouds. (a) Annual mean CTH from S5P, (b) the CTH difference between S5P and the reference value (CC), (c) annual mean CTH from NPP, (d) the CTH difference between NPP and the reference value (CC), and (e) the direct difference between S5P and NPP. All data are annually averaged, and differences are calculated relative to the CC reference within each 5° × 5° longitude-latitude grid cell.
The annual mean CTH for single-layer mixed-phase clouds in both S5P and NPP products shows a similar zonal distribution, with cloud top height progressively decreasing from the equator towards the poles and displaying no distinct land–sea contrast. NPP’ product shows higher cloud top around the equator.
For single-layer mixed-phase clouds, both S5P and NPP retrievals show significant, latitudinally dependent errors, but their patterns are distinctly different. S5P (Figure 10b) exhibits a clear, zonally banded underestimation across the mid-to-low latitudes (−60° < latitude < 60°), with a negative bias generally between 2 and 4 km. This bias improves in the polar regions. In contrast, NPP’s retrieval (Figure 10d) shows a more complex pattern, with mixed positive and negative biases in the mid-to-low latitudes and a systematic overestimation (0 to 2 km) in high-latitude regions.
As a result of these differing error patterns, a direct comparison reveals that S5P’s CTH is lower than NPP’s across nearly the entire globe (Figure 10e). S5P’s CTH is generally 2–4 km lower than NPP’s in the mid-to-low latitudes 0.6–2 km lower in the high latitudes, with high consistency observed only over West Antarctica.
To further analyze the influence of latitude on mixed-phase cloud top height retrieval, Figure 11 presents a stratified analysis using Cloud Geometrical Thickness (CGT) as a governing factor. For mid-to-high latitudes (latitudes < −30° or >30°) in Figure 11b, S5P (orange line) and NPP (yellow line) demonstrate opposing biases. The products diverge for geometrically thin clouds (CGT < 5 km), where S5P shows a consistent underestimation while NPP overestimates CTH by approximately 1 km. As clouds become thicker (CGT > 5 km), S5P’s negative bias increases linearly, whereas NPP’s error transitions from a positive to a negative bias. The difference between the two products (gray line) stabilizes at approximately −4 km, indicating the error patterns for two products become similar after the thickness exceeds 5 km.
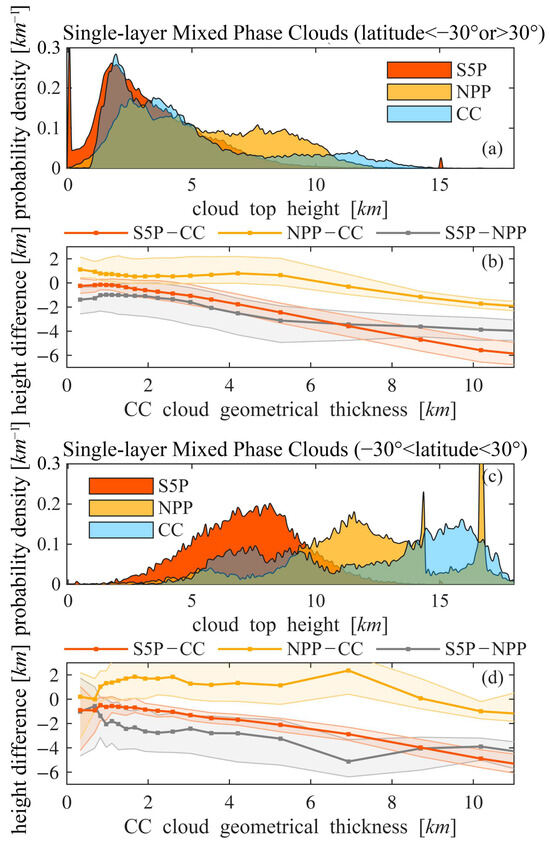
Figure 11.
Analysis of single-layer mixed-phase clouds stratified by latitude. (a,c) CTH Probability Density Functions (PDFs) for S5P (orange), NPP (yellow), and CC (blue) in the mid-to-high (latitude < −30° or >30°) and low (−30° < latitude < 30°) latitude zones, respectively. (b,d) Median CTH retrieval error (relative to CC) for S5P (orange line), NPP (yellow line), and their difference (gray line), plotted as a function of Cloud Geometrical Thickness (CGT) for each latitude zone. Samples were sorted by CGT and binned into 20 quantiles; the shaded areas represent the interquartile range (IQR).
The error dispersion (Interquartile Range, IQR) further differentiates the retrievals. S5P’s IQR remains stable at approximately 1 km regardless of thickness, indicating its errors are primarily systematic. In contrast, NPP’s IQR is broad for thin clouds and narrows for thicker ones, suggesting lower retrieval stability for thin mixed-phase clouds. The distinct shapes of the CTH distributions for each product in Figure 11a reflect these different error characteristics.
In the low latitudes (−30° < latitude < 30°) shown in Figure 11, the reference CTH from CC exhibits a bimodal distribution, with a primary peak at 14–17 km and a secondary peak at 6–10 km. The S5P product, in contrast, shows a unimodal distribution with cloud tops concentrated at 6–10 km, aligning with CC’s lower peak and indicating that it often fails to detect the higher cloud layer. The NPP product’s primary peak is higher, concentrated at 10–14 km, suggesting it detects higher altitudes than S5P but still underestimates the true cloud top relative to CC’s primary peak.
The error trend detailed in Figure 11d reveals the complexity of mixed-phase cloud retrieval. For thin clouds (CGT < 7 km), the two products show opposing biases: NPP overestimates CTH by 1–2 km, while S5P shows an underestimation. However, NPP’s retrieval in this regime is unstable, as indicated by its wide error dispersion (IQR). In contrast, S5P’s systematic underestimation continues to increase with CGT across all intervals, though its IQR remains stable at 1–2 km for most thicknesses, demonstrating consistent precision. As clouds thicken (CGT > 7 km), NPP’s error transitions to a negative bias.
In summary, these findings indicate that the accuracy and stability of the S5P retrieval algorithm for single-layer mixed-phase clouds are only weakly influenced by latitude. It consistently shows an underestimation pattern where the negative bias increases linearly with CGT, and its IQR remains stable at 1–2 km for most cloud thicknesses, demonstrating good algorithm stability. In contrast, NPP’s algorithm accuracy and stability are significantly influenced by latitude. In both latitude zones, its error transitions from a positive to a negative bias as CGT increases, but the CGT at which this transition occurs differs by approximately 2 km. Notably, a significant absence of single-layer mixed-phase cloud samples was observed in the eastern subtropical oceanic regions.
4.5. Two-Layer Clouds
Multi-layer clouds are systems that contain multiple, vertically separated cloud layers, each of which may possess different physical and radiative properties. These cloud systems are also an important component of the Earth’s climate system, playing a significant role in the global energy balance [39].
Two-layer clouds account for approximately 83% of all multi-layer cloud occurrences [40] and are therefore selected as a representative case for analysis in this study. For multi-layer systems, the spacing between cloud layers acts as a key governing factor by modulating the vertical distribution of the clouds, which is directly linked to the Cloud Top Height (CTH) [26,27]. Consequently, we use cloud layer spacing to structure our error analysis for two-layer CTH retrievals. The three main types of two-layer clouds are ice-over-liquid, two-layer liquid, and two-layer ice clouds.
The CTH of two-layer clouds shows no distinct large-scale spatial patterns in the Sentinel-5P (S5P), Suomi-NPP (NPP), or CloudSat/CALIPSO (CC) products.
4.5.1. Ice-over-Liquid Clouds
Figure 12a shows the Probability Density Functions (PDFs) of CTH for ice-over-liquid cloud scenes from the S5P, NPP, and CC products, with CC serving as the reference standard. The CC distribution is a broad, unimodal peak centered at 12 km, with cloud tops predominantly concentrated in the 9–13 km altitude range. In contrast, the S5P distribution is a narrow, tall, unimodal peak centered at 2 km, with cloud tops concentrated in the 1–3 km range and sparse samples above 12 km. NPP exhibits a bimodal structure: it has a primary peak in the 1–3 km range that is similar in shape to S5P’s but with a lower peak value, and a shorter, secondary peak in the 8–10 km range. For NPP, samples are also sparse above 14 km.
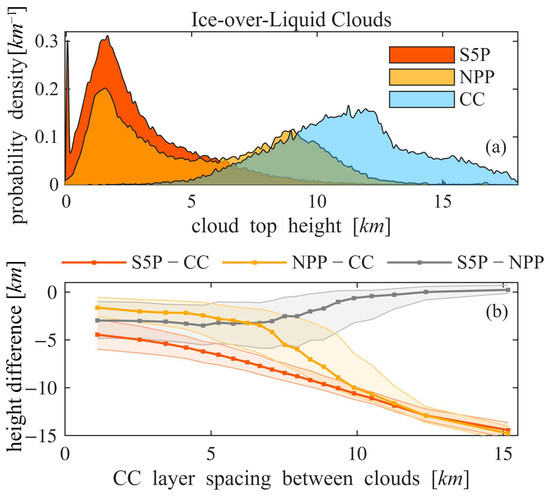
Figure 12.
Analysis of CTH retrievals for ice-over-liquid clouds. (a) Probability Density Functions (PDFs) of CTH for S5P (orange shaded area), NPP (yellow shaded area), and the CC reference (blue shaded area). (b) Median CTH retrieval error (relative to CC) as a function of cloud layer spacing. The lines correspond to the S5P error (orange), the NPP error (yellow), and the direct difference between S5P and NPP (gray). The transparent shaded areas represent the interquartile range (IQR).
These observations indicate that both S5P and NPP suffer from a large underestimation of CTH for this cloud type. Although NPP can partially detect the upper ice cloud layer, both products show a general inability to detect clouds with a CTH above 14 km.
Figure 12b shows the relationship between the CTH retrieval error and cloud layer spacing for ice-over-liquid clouds. For S5P (orange line), the negative bias increases nearly linearly with spacing across all intervals, with consistent narrow IQR. These suggests that S5P’s O2 A-band method primarily detects the lower liquid cloud. In contrast, the trend for NPP (yellow line) is more complex: its error degrades at a rate similar to S5P’s for spacing up to 7 km, but the degradation accelerates significantly between 7 and 10 km. The difference between the two (gray line) shows that NPP maintains an accuracy advantage of approximately 3 km for spacing less than 7 km, suggesting its thermal infrared method can partially sense the upper ice cloud. However, this sensitivity diminishes at larger separations. For spacing greater than 10 km, the errors of both methods converge to become identical. This indicates that at this point, the complexity of the cloud vertical structure has suppressed the influence of sensor differences, and both the O2 A-band and thermal infrared-based methods fail to detect the upper ice cloud.
This case reveals a fundamental physical sensitivity complementarity: S5P’s O2 A-band method, with its greater penetrative ability, preferentially detects the lower liquid cloud, while NPP’s TIR method retains partial sensitivity to the upper ice layer. These differing sensitivities provide distinct, though individually incomplete, pieces of information about the complex vertical structure that could be synergistically combined.
4.5.2. Two-Layer Liquid Clouds
Figure 13a shows the Probability Density Functions (PDFs) of CTH for two-layer liquid cloud scenes from the S5P, NPP, and CC products. All three distributions are unimodal. The reference CC distribution peaks in the 2–4 km altitude range, with sparse samples above 8 km. In comparison, both S5P and NPP distributions peak at a lower altitude range of 0–3 km, corresponding to a systematic underestimation of approximately 2 km. Within this shared peak range, NPP’s peak value is lower than S5P’s, but their overall consistency with the CC reference is similar.
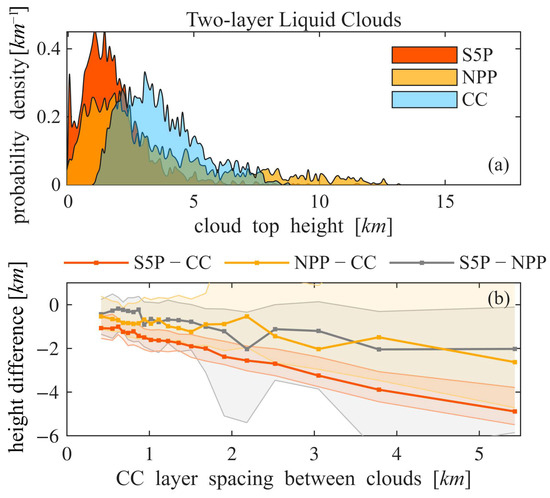
Figure 13.
Analysis of CTH retrievals for two-layer liquid clouds. (a) Probability Density Functions (PDFs) of CTH for S5P (orange shaded area), NPP (yellow shaded area), and the CC reference (blue shaded area). (b) Median CTH retrieval error (relative to CC) as a function of cloud layer spacing. The lines correspond to the S5P error (orange), the NPP error (yellow), and the direct difference between S5P and NPP (gray). The transparent shaded areas represent the interquartile range (IQR).
Figure 13b shows the relationship between the CTH retrieval error and cloud layer spacing for two-layer liquid clouds. Both products exhibit a systematic underestimation that worsens as spacing increases, but their error characteristics differ. S5P’s negative bias (orange line) increases linearly to a maximum of 5 km, while maintaining a consistently stable error dispersion (IQR), suggesting its retrieval algorithm consistently senses the lower cloud layer while the true top of the upper layer gets higher. In contrast, the trend for NPP (yellow line) is more complex; its bias is smaller overall (max ~2.5 km), but it increases in a fluctuating manner with a significantly broader IQR for spacing > 1.5 km. This suggests that while NPP is more sensitive to the upper cloud layer, its retrieval is less stable in these scenes.
The difference between the two products (gray line) is always negative, confirming that NPP is consistently more accurate. This difference fluctuates for small spacing (<4 km) before stabilizing, suggesting a shift from an algorithm-dominated error regime at small separations to one dominated by cloud structural complexity at larger separations.
4.5.3. Two-Layer Ice Clouds
Figure 14a shows the Probability Density Functions (PDFs) of CTH for two-layer ice cloud scenes from the S5P, NPP, and CC products. The reference CC distribution is bimodal, with a primary peak at 8–12 km and a secondary peak at 16–18 km. In comparison, the S5P retrieval results in a broad, unimodal distribution between 3 and 10 km, corresponding to a ~5 km underestimation, and includes an anomalous truncation peak at 15 km. The NPP retrieval is also unimodal but more closely resembles the primary CC peak; its distribution is concentrated at 6–10 km, thus showing a smaller underestimation of ~2 km and higher overall consistency with the reference data.
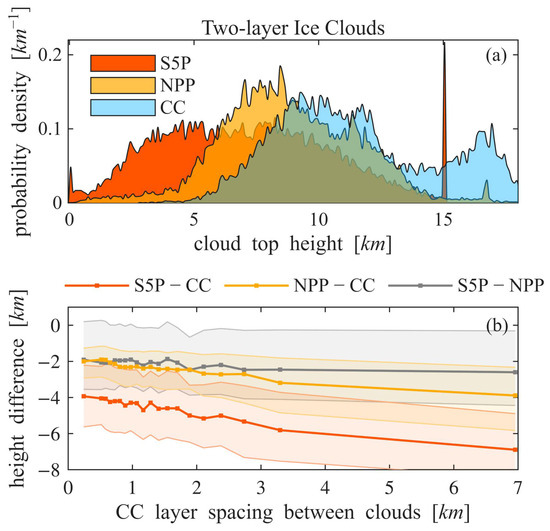
Figure 14.
Analysis of CTH retrievals for two-layer ice clouds. (a) Probability Density Functions (PDFs) of CTH for S5P (orange shaded area), NPP (yellow shaded area), and the CC reference (blue shaded area). (b) Median CTH retrieval error (relative to CC) as a function of cloud layer spacing. The lines correspond to the S5P error (orange), the NPP error (yellow), and the direct difference between S5P and NPP (gray). The transparent shaded areas represent the interquartile range (IQR).
Figure 14b shows the relationship between the CTH retrieval error and cloud layer spacing for two-layer ice clouds. Both products exhibit a systematic underestimation that increases approximately linearly as spacing increases, indicating that layer spacing is one of the key error sources. The negative bias for S5P (orange line) is larger, increasing from 4 km to 7 km with a stable 4 km IQR. In contrast, NPP’s bias (yellow line) is smaller, increasing from 2 km to 4 km while its IQR broadens from 2 km to 4 km.
The difference between them (gray line) remains stable between −2 km and −3 km, confirming that both products respond to the increasing cloud vertical structure with a highly consistent error pattern, where NPP is consistently more accurate. It should be noted, however, that samples with a layer spacing greater than 3 km are sparse, which limits a detailed analysis of the error evolution in that range.
5. Conclusions
This study performed a systematic, global-scale comparison of Cloud Top Height (CTH) products from Sentinel-5P (S5P, based on the O2 A-band) and Suomi-NPP (NPP, based on Thermal Infrared) against a unified CloudSat/CALIPSO benchmark. Our results successfully filled a research gap by revealing starkly different and complementary error patterns that underscore the fundamental limitations of single-sensor approaches. These findings, summarized in Table 1, provide the foundational, quantitative evidence for developing next-generation fused CTH products.

Table 1.
CTH error characteristics of S5P and NPP in various cloud scenarios.
On a global scale, both S5P and NPP successfully reproduce the large-scale geographical distribution of CTH, but they each exhibit distinct systematic biases. S5P shows a systematic underestimation across most of the globe, whereas the error in NPP’s product exhibits a zonally banded distribution. Tracing representative cases revealed that S5P’s pronounced negative bias (−1 to −2 km) occurs over polar oceans with bright sea ice, where multiple scattering between the cloud base and high-albedo surface likely induces retrieval artifacts. In contrast, NPP’s low-bias cases cluster in mid-latitude upper-tropospheric cloud bands along subtropical jet streams, where optically thin clouds near the tropopause lead to temperature–height conversion errors.
Our key finding is the identification of a multi-faceted complementarity between the S5P and NPP error patterns. This is most evident in the discovery of opposing systematic biases for single-layer liquid clouds. While both products demonstrate high accuracy over homogeneous ocean surfaces, they diverge significantly over land, where S5P exhibits a consistent underestimation (median bias ≈ −0.4 km) while NPP shows a systematic overestimation (median bias ≈ +0.6 km). This complementary error structure presents a clear and previously unquantified opportunity for direct error cancellation through data fusion.
Beyond this, we demonstrate a consistent performance complementarity, particularly for clouds containing ice. For both single-layer ice and mixed-phase clouds, NPP’s accuracy is significantly and reliably better than S5P’s (e.g., negative bias ~2 km vs. ~5 km for ice clouds), highlighting the inherent challenges of the O2 A-band retrievals when dealing with the complex scattering properties of ice crystals and providing a clear basis for assigning confidence in fusion schemes.
Furthermore, in challenging two-layer cloud scenes, we reveal a fundamental physical sensitivity complementarity. This is particularly evident in ice-over-liquid systems, where S5P’s O2 A-band method tends to penetrate the upper ice layer to detect the lower liquid cloud, while NPP’s TIR method retains partial sensitivity to the true cloud top. For other two-layer systems, both products show an underestimation that worsens with increasing layer spacing. Although NPP is often more accurate, its error patterns are more complex and unstable, whereas S5P, despite larger systematic biases, shows a more stable and predictable error pattern. These distinct observational characteristics are not merely errors, but rather contain valuable, differing information about the cloud vertical structure.
In conclusion, to overcome the current bottlenecks in passive remote sensing of CTH, it is essential to move beyond single-sensor algorithms. The distinct and often complementary error characteristics of S5P and NPP detailed in this work are not merely limitations, but rather opportunities for synergy. By strategically combining these strengths—for instance, using the O2 A-band’s stability to constrain the TIR method’s retrieval—it is possible to substantially reduce systematic errors. This study provides the foundational evidence needed to develop more physically constrained, all-sky CTH products that are essential for reducing uncertainties in weather forecasting and climate modeling.
Author Contributions
Conceptualization, Z.Z. and J.Y.; Data curation, Z.Z. and Q.W.; Formal analysis, Z.Z., J.Y., L.D. and S.L.; Investigation, Z.Z. and H.L.; Methodology, Z.Z., J.Y. and L.D.; Project administration, L.D.; Software, Z.Z.; Validation, Z.Z.; Visualization, Z.Z.; Writing—original draft, Z.Z. and J.Y.; Writing–review and editing, Z.Z. and J.Y. All authors have read and agreed to the published version of the manuscript.
Funding
This research was funded by the National Natural Science Foundation of China (Grant U2342213), and supported by the Open Fund of Hubei Luojia Laboratory (NO. 250100011 and NO. 250100008) and the Youth Project from the Hubei Research Center for Basic Disciplines of Earth Sciences (NO. HRCES-202408).
Data Availability Statement
The raw data supporting the conclusions of this article will be made available by the authors on request.
Conflicts of Interest
The authors declare no conflicts of interest.
References
- Zhang, A.; Chen, Y.; Pan, X.; Hu, Y.; Chen, S.; Li, W. Precipitation Microphysics of Tropical Cyclones over Northeast China in 2020. Remote Sens. 2022, 14, 2188. [Google Scholar] [CrossRef]
- L’Ecuyer, T.S.; Hang, Y.; Matus, A.V.; Wang, Z. Reassessing the Effect of Cloud Type on Earth’s Energy Balance in the Age of Active Spaceborne Observations. Part I: Top of Atmosphere and Surface. J. Clim. 2019, 32, 6197–6217. [Google Scholar] [CrossRef]
- Min, M.; Li, J.; Wang, F.; Liu, Z.; Menzel, W.P. Retrieval of Cloud Top Properties from Advanced Geostationary Satellite Imager Measurements Based on Machine Learning Algorithms. Remote Sens. Environ. 2020, 239, 111616. [Google Scholar] [CrossRef]
- Holz, R.E.; Ackerman, S.A.; Nagle, F.W.; Frey, R.; Dutcher, S.; Kuehn, R.E.; Vaughan, M.A.; Baum, B. Global Moderate Resolution Imaging Spectroradiometer (MODIS) Cloud Detection and Height Evaluation Using CALIOP. J. Geophys. Res. 2008, 113, 2008JD009837. [Google Scholar] [CrossRef]
- Compernolle, S.; Argyrouli, A.; Lutz, R.; Sneep, M.; Lambert, J.-C.; Fjæraa, A.M.; Hubert, D.; Keppens, A.; Loyola, D.; O’Connor, E.; et al. Validation of the Sentinel-5 Precursor TROPOMI Cloud Data with Cloudnet, Aura OMI O2–O2, MODIS, and Suomi-NPP VIIRS. Atmos. Meas. Tech. 2021, 14, 2451–2476. [Google Scholar] [CrossRef]
- Liu, Q.; Hao, X.; Zou, C.-Z.; Wang, L.; Qu, J.J.; Yan, B. A Preliminary Assessment of the VIIRS Cloud Top and Base Height Environmental Data Record Reprocessing. Remote Sens. 2025, 17, 1036. [Google Scholar] [CrossRef]
- Inoue, T. On the Temperature and Effective Emissivity Determination of Semi-Transparent Cirrus Clouds by Bi-Spectral Measurements in the 10μm Window Region. J. Meteorol. Soc. Jpn. 1985, 63, 88–99. [Google Scholar] [CrossRef]
- Viggiano, M.; Cimini, D.; De Natale, M.P.; Di Paola, F.; Gallucci, D.; Larosa, S.; Marro, D.; Nilo, S.T.; Romano, F. Combining Passive Infrared and Microwave Satellite Observations to Investigate Cloud Microphysical Properties: A Review. Remote Sens. 2025, 17, 337. [Google Scholar] [CrossRef]
- Holl, G.; Eliasson, S.; Mendrok, J.; Buehler, S.A. SPARE-ICE: Synergistic Ice Water Path from Passive Operational Sensors. J. Geophys. Res. Atmos. 2014, 119, 1504–1523. [Google Scholar] [CrossRef]
- Sporre, M.K.; O’Connor, E.J.; Håkansson, N.; Thoss, A.; Swietlicki, E.; Petäjä, T. Comparison of MODIS and VIIRS Cloud Properties with ARM Ground-Basedobservations over Finland. Atmos. Meas. Tech. 2016, 9, 3193–3203. [Google Scholar] [CrossRef]
- Veefkind, J.P.; Aben, I.; McMullan, K.; Förster, H.; De Vries, J.; Otter, G.; Claas, J.; Eskes, H.J.; De Haan, J.F.; Kleipool, Q.; et al. TROPOMI on the ESA Sentinel-5 Precursor: A GMES Mission for Global Observations of the Atmospheric Composition for Climate, Air Quality and Ozone Layer Applications. Remote Sens. Environ. 2012, 120, 70–83. [Google Scholar] [CrossRef]
- Loyola, D.G.; Gimeno García, S.; Lutz, R.; Argyrouli, A.; Romahn, F.; Spurr, R.J.D.; Pedergnana, M.; Doicu, A.; Molina García, V.; Schüssler, O. The Operational Cloud Retrieval Algorithms from TROPOMI on Board Sentinel-5 Precursor. Atmos. Meas. Tech. 2018, 11, 409–427. [Google Scholar] [CrossRef]
- Kuze, A.; Chance, K.V. Analysis of Cloud Top Height and Cloud Coverage from Satellites Using the O2 A and B Bands. J. Geophys. Res. 1994, 99, 14481–14491. [Google Scholar] [CrossRef]
- Noh, Y.-J.; Haynes, J.M.; Miller, S.D.; Seaman, C.J.; Heidinger, A.K.; Weinrich, J.; Kulie, M.S.; Niznik, M.; Daub, B.J. A Framework for Satellite-Based 3D Cloud Data: An Overview of the VIIRS Cloud Base Height Retrieval and User Engagement for Aviation Applications. Remote Sens. 2022, 14, 5524. [Google Scholar] [CrossRef]
- Cao, C.; De Luccia, F.J.; Xiong, X.; Wolfe, R.; Weng, F. Early On-Orbit Performance of the Visible Infrared Imaging Radiometer Suite Onboard the Suomi National Polar-Orbiting Partnership (S-NPP) Satellite. IEEE Trans. Geosci. Remote Sens. 2014, 52, 1142–1156. [Google Scholar] [CrossRef]
- Stephens, G.L.; Vane, D.G.; Boain, R.J.; Mace, G.G.; Sassen, K.; Wang, Z.; Illingworth, A.J.; O’connor, E.J.; Rossow, W.B.; Durden, S.L.; et al. THE CLOUDSAT MISSION AND THE A-TRAIN: A New Dimension of Space-Based Observations of Clouds and Precipitation. Bull. Am. Meteorol. Soc. 2002, 83, 1771–1790. [Google Scholar] [CrossRef]
- Weisz, E.; Li, J.; Menzel, W.P.; Heidinger, A.K.; Kahn, B.H.; Liu, C. Comparison of AIRS, MODIS, CloudSat and CALIPSO Cloud Top Height Retrievals. Geophys. Res. Lett. 2007, 34, 2007GL030676. [Google Scholar] [CrossRef]
- Wang, W.; Sheng, L.; Dong, X.; Qu, W.; Sun, J.; Jin, H.; Logan, T. Dust Aerosol Impact on the Retrieval of Cloud Top Height from Satellite Observations of CALIPSO, CloudSat and MODIS. J. Quant. Spectrosc. Radiat. Transf. 2017, 188, 132–141. [Google Scholar] [CrossRef]
- Sassen, K.; Wang, Z. Classifying Clouds around the Globe with the CloudSat Radar: 1-year of Results. Geophys. Res. Lett. 2008, 35, 2007GL032591. [Google Scholar] [CrossRef]
- Wang, M.; Min, M.; Li, J.; Lin, H.; Liang, Y.; Chen, B.; Yao, Z.; Xu, N.; Zhang, M. Technical Note: Applicability of Physics-Based and Machine-Learning-Based Algorithms of Geostationary Satellite in Retrieving the Diurnal Cycle of Cloud Base Height. Atmos. Meas. Tech. 2024, 24, 14239–14256. [Google Scholar] [CrossRef]
- Heidinger, A.K.; Pavolonis, M.J.; Holz, R.E.; Baum, B.A.; Berthier, S. Using CALIPSO to Explore the Sensitivity to Cirrus Height in the Infrared Observations from NPOESS/VIIRS and GOES-R/ABI. J. Geophys. Res. 2010, 115, 2009JD012152. [Google Scholar] [CrossRef]
- Watts, P.D.; Bennartz, R.; Fell, F. Retrieval of Two-Layer Cloud Properties from Multispectral Observations Using Optimal Estimation. J. Geophys. Res. 2011, 116, D16203. [Google Scholar] [CrossRef]
- Baum, B.A.; Menzel, W.P.; Frey, R.A.; Tobin, D.C.; Holz, R.E.; Ackerman, S.A.; Heidinger, A.K.; Yang, P. MODIS Cloud-Top Property Refinements for Collection 6. J. Appl. Meteorol. Climatol. 2012, 51, 1145–1163. [Google Scholar] [CrossRef]
- Yang, Y.; Marshak, A.; Mao, J.; Lyapustin, A.; Herman, J. A Method of Retrieving Cloud Top Height and Cloud Geometrical Thickness with Oxygen A and B Bands for the Deep Space Climate Observatory (DSCOVR) Mission: Radiative Transfer Simulations. J. Quant. Spectrosc. Radiat. Transf. 2013, 122, 141–149. [Google Scholar] [CrossRef]
- Richardson, M.; Leinonen, J.; Cronk, H.Q.; McDuffie, J.; Lebsock, M.D.; Stephens, G.L. Marine Liquid Cloud Geometric Thickness Retrieved from OCO-2’s Oxygen A-Band Spectrometer. Atmos. Meas. Tech. 2019, 12, 1717–1737. [Google Scholar] [CrossRef]
- Wang, J.; Rossow, W.B.; Zhang, Y. Cloud Vertical Structure and Its Variations from a 20-Yr Global Rawinsonde Dataset. J. Clim. 2000, 13, 3041–3056. [Google Scholar] [CrossRef]
- Liang, Y.; Sun, X.; Miller, S.D.; Li, H.; Zhou, Y.; Zhang, R.; Li, S. Cloud Base Height Estimation from ISCCP Cloud-Type Classification Applied to A-Train Data. Adv. Meteorol. 2017, 2017, 3231719. [Google Scholar] [CrossRef]
- Eastman, R.; Wood, R. Factors Controlling Low-Cloud Evolution over the Eastern Subtropical Oceans: A Lagrangian Perspective Using the A-Train Satellites. J. Atmos. Sci. 2016, 73, 331–351. [Google Scholar] [CrossRef]
- Klein, S.A.; Hall, A.; Norris, J.R.; Pincus, R. Low-Cloud Feedbacks from Cloud-Controlling Factors: A Review. Surv. Geophys. 2017, 38, 1307–1329. [Google Scholar] [CrossRef]
- Joint Polar Satellite System (JPSS) Level 1. Available online: https://www.nesdis.noaa.gov/s3/2022-03/L1RDS.pdf (accessed on 14 August 2025).
- Wood, R. Stratocumulus Clouds. Mon. Weather Rev. 2012, 140, 2373–2423. [Google Scholar] [CrossRef]
- Butz, A.; Hasekamp, O.P.; Frankenberg, C.; Vidot, J.; Aben, I. CH4 Retrievals from Space-based Solar Backscatter Measurements: Performance Evaluation against Simulated Aerosol and Cirrus Loaded Scenes. J. Geophys. Res. 2010, 115, 2010JD014514. [Google Scholar] [CrossRef]
- Mace, G.G.; Zhang, Q.; Vaughan, M.; Marchand, R.; Stephens, G.; Trepte, C.; Winker, D. A Description of Hydrometeor Layer Occurrence Statistics Derived from the First Year of Merged Cloudsat and CALIPSO Data. J. Geophys. Res. 2009, 114. [Google Scholar] [CrossRef]
- Seidel, D.J.; Randel, W.J. Variability and Trends in the Global Tropopause Estimated from Radiosonde Data. J. Geophys. Res. 2006, 111, D21101. [Google Scholar] [CrossRef]
- World Meteorological Organization. Meteorology—A Three-Dimensional Science: Second Session of the Commission for Aerology. WMO Bull. 1957, 4, 134–138. [Google Scholar]
- Bodas-Salcedo, A.; Hill, P.G.; Furtado, K.; Williams, K.D.; Field, P.R.; Manners, J.C.; Hyder, P.; Kato, S. Large Contribution of Supercooled Liquid Clouds to the Solar Radiation Budget of the Southern Ocean. J. Clim. 2016, 29, 4213–4228. [Google Scholar] [CrossRef]
- Hong, Y.; Liu, G.; Li, J.-L.F. Assessing the Radiative Effects of Global Ice Clouds Based on CloudSat and CALIPSO Measurements. J. Clim. 2016, 29, 7651–7674. [Google Scholar] [CrossRef]
- Shupe, M.D.; Daniel, J.S.; De Boer, G.; Eloranta, E.W.; Kollias, P.; Long, C.N.; Luke, E.P.; Turner, D.D.; Verlinde, J. A Focus On Mixed-Phase Clouds: The Status of Ground-Based Observational Methods. Bull. Am. Meteorol. Soc. 2008, 89, 1549–1562. [Google Scholar] [CrossRef]
- Yi, B.; Li, R.; Yang, Z. Global Distributions of Multi-Layer and Multi-Phase Clouds and Their Cloud Radiative Effects. J. Quant. Spectrosc. Radiat. Transf. 2025, 333, 109334. [Google Scholar] [CrossRef]
- Subrahmanyam, K.V.; Kumar, K.K. CloudSat Observations of Multi Layered Clouds across the Globe. Clim. Dyn. 2017, 49, 327–341. [Google Scholar] [CrossRef]


Disclaimer/Publisher’s Note: The statements, opinions and data contained in all publications are solely those of the individual author(s) and contributor(s) and not of MDPI and/or the editor(s). MDPI and/or the editor(s) disclaim responsibility for any injury to people or property resulting from any ideas, methods, instructions or products referred to in the content. |
© 2025 by the authors. Licensee MDPI, Basel, Switzerland. This article is an open access article distributed under the terms and conditions of the Creative Commons Attribution (CC BY) license (https://creativecommons.org/licenses/by/4.0/).