Highlights
What are the main findings?
- High-frequency ground-penetrating radar demonstrates higher efficiency and coverage than traditional exploration methods, and cross-validation with ground temperature data effectively enhances the reliability of active layer thickness detection.
- The envelope-analysis-based fusion method efficiently extracts active layer thickness with good accuracy.
What is the implication of the main finding?
- The use of high-frequency ground-penetrating radar for active layer thickness monitoring can extend the effective survey coverage of drilling and reduce survey costs.
- The automated and high-efficiency recognition capabilities of the envelope-analysis-based fusion method can significantly reduce manpower requirements and improve the efficiency of data inversion and interpretation.
Abstract
Ground-penetrating radar (GPR), due to its efficiency and non-invasive nature, has become an important tool for detecting the permafrost table, overcoming the limited spatial coverage and high costs associated with drilling and in situ temperature monitoring. Compared with the commonly used 50–100 MHz antennas, the potential of high-frequency antennas to improve detection accuracy and interface resolution has not been fully explored. To address this gap, this study introduces a multi-strategy interface identification method incorporating envelope analysis. Field experiments were conducted in the island-like permafrost zone of the Da Xing’anling Mountains, Heilongjiang Province, using shielded GPR systems operating at 250 MHz and 500 MHz to detect the permafrost table. Potential interfaces were extracted using centroid and edge-detection algorithms and validated against ground temperature observations. The results indicate that: (1) integrating GPR with multi-source data enables accurate estimation of active layer thickness, and the envelope-based multi-strategy approach is effective for interface identification; (2) the 250 MHz antenna is better suited for capturing broader subsurface structures, while the 500 MHz antenna provides higher resolution for shallow layers—combining the two enhances overall interpretive quality; and (3) snow cover significantly affects electromagnetic wave propagation, reducing the accuracy of radar detection. This study provides valuable guidance for engineering investigations, site selection, and foundation design in permafrost regions, contributing to improved precision and efficiency in GPR-based detection of the permafrost table.
1. Introduction
Remote sensing technologies have become indispensable tools for environmental and geotechnical investigations in cold regions, with GPR offering unique advantages for high-resolution detection of permafrost layers. Permafrost is a climate-sensitive environmental product, defined as ground—comprising soil or rock with varying amounts of ice—that remains at or below 0 °C for at least two consecutive years [1,2]. Based on geographical characteristics, permafrost can be classified into high-latitude and high-altitude types [3]. In China, permafrost covers approximately 22.3% of the national land area, with a distribution of about 5.137 × 10⁷ km2 [4]. The permafrost table, or the upper boundary of permafrost, marks the transition between perennially frozen ground and either seasonally frozen or unfrozen soil [5]. Its depth has a direct impact on the stability of foundations in cold regions, making accurate delineation essential for ensuring the long-term stability and operational safety of engineering structures [6,7,8]. Moreover, the thickness of the active layer—the seasonally thawed layer above permafrost—affects frost heave behavior and, consequently, the reliability of infrastructure performance during freeze–thaw cycles [9,10,11]. Therefore, precise investigation of permafrost conditions is a prerequisite for engineering safety and sustainability, influencing both design feasibility and long-term operational resilience. Currently, surveys of the permafrost table primarily rely on conventional techniques such as drilling and in situ monitoring, which provide soil samples and ground temperature profiles at discrete depths. However, these methods are constrained by financial cost, labor intensity, logistical challenges, complex terrain, and environmental sensitivity. As a result, their spatial coverage is often limited, making it difficult to capture the heterogeneous distribution of permafrost at regional scales. Given this context, there is an urgent need for portable, cost-effective, non-destructive, efficient, and intuitive techniques to enhance the coverage and resolution of permafrost investigations. In response, this study employs GPR to detect the depth of the permafrost table. As a well-established geophysical method, GPR can reveal subsurface structures without disturbing the ground surface. It offers high spatial resolution and the ability to distinguish between subsurface media. Additional advantages include rapid data acquisition, low operational cost, flexible deployment of survey lines, and strong data continuity [12].
In recent years, GPR has emerged as a vital geophysical exploration tool owing to its capability to image subsurface media using electromagnetic waves, and it has found widespread application across multiple fields [13]. With the continuous advancement of GPR technology, its capability for visualized subsurface imaging has significantly improved, facilitating its use in diverse domains such as tunnel inspection [14,15,16,17,18], environmental engineering investigations [19], road damage assessment [20,21], groundwater detection and soil moisture estimation [22,23], and subsurface utility mapping [24,25]. Due to its non-invasive nature and high efficiency, GPR has also been extensively applied in permafrost investigations. For example, Chen et al. used a 100 MHz GPR antenna in Mohe, Heilongjiang Province, to survey permafrost distribution and, in combination with borehole and ground temperature data, analyzed the effects of urban thermal disturbances on permafrost [26]. Kang et al. demonstrated the reliability of GPR for characterizing active layer features and assessing infrastructure risks in permafrost regions, utilizing GPR signal polarity and variations in relative permittivity to distinguish between soil layers such as low-density soils, groundwater-bearing zones, and permafrost [27]. Zhou and Zhang used 100 MHz antennas to precisely locate the permafrost table, confirming the feasibility of high-resolution GPR detection of glaciers and permafrost in the headwaters of the Yangtze River [28]. Du et al. applied 100 MHz antennas in the Qilian Mountains for permafrost mapping and introduced 50 MHz antennas in some areas for enhanced interface identification [29]. Yu et al. employed 50 MHz GPR along the northern section of the Heihe–Baicheng highway to detect island permafrost, revealing its concentration in river valleys, intermontane basins, and waterlogged wetlands. They further identified rich herbaceous vegetation, peat, and marshes as key surface indicators [30]. Qi et al. analyzed GPR profiles and ground temperature data to map permafrost beneath embankments and identify the depth of the permafrost table [31]. Most previous studies have employed either drilling or GPR independently. However, integrating the extensive spatial coverage of GPR with the high-accuracy data from boreholes enhances data reliability and improves the precision of permafrost depth estimation. Moreover, the portability and efficiency of GPR make it a promising tool for long-term monitoring of permafrost dynamics, further advancing the development of permafrost detection technologies. While numerous studies have confirmed the feasibility of GPR in permafrost surveys, most have utilized antennas operating in the 50–100 MHz frequency range. Research involving higher-frequency GPR antennas for permafrost detection remains limited, particularly regarding interface identification methods and quantitative evaluation of detection accuracy and performance.
This study focuses on the island permafrost region of the Da Xing’anling Mountains, where 250 MHz and 500 MHz high-frequency shielded GPR systems were employed to conduct high-resolution surveys of the permafrost table depth. To address the challenge of accurately identifying the upper boundary of permafrost, a “centroid–edge fusion method” was developed to extract more representative interface lines, significantly enhancing the precision of interface detection. By comparing GPR results with borehole data and ground temperature observations, the applicability, accuracy, and reliability of GPR for delineating the permafrost table were systematically evaluated. In addition, the performance differences between antennas of different frequencies under complex permafrost structures were analyzed. The results demonstrate that high-frequency GPR systems exhibit strong adaptability and application potential in permafrost investigations. The workflow for identifying active layer thickness using this approach is illustrated in Figure 1. The findings of this study offer valuable technical support and theoretical insight for geological surveys, site selection, and foundation design in cold-region permafrost areas.
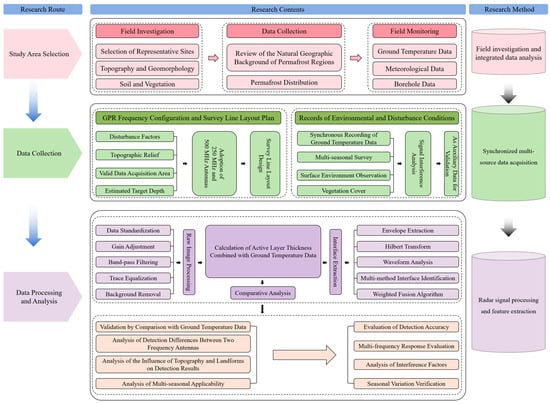
Figure 1.
Detection and Interpretation Workflow of the Active Layer Using Multi-Frequency GPR.
2. Materials and Methods
2.1. Study Area
The Da Xing’anling Mountains, located in northeastern China, serve as a key geographical and climatic boundary in the region. Situated in a transitional zone between temperate and frigid zones, this area represents a critical boundary between high-latitude permafrost and seasonally frozen ground [32]. The region holds significant importance in forestry and mineral resource development and plays a vital role in ecological conservation due to its extensive forest coverage and unique ecosystems [33]. Conducting permafrost table investigations in this area is crucial for delineating the distribution of high-latitude permafrost zones.
Permafrost in the Da Xing’anling Mountains is predominantly high-latitude and is widely distributed. Its characteristics are influenced by multiple factors, including climate, topography, soil type, and vegetation [34,35,36]. Due to pronounced seasonal variations, the region exhibits cyclical freeze–thaw processes that affect both the stability and thickness of the permafrost. Under the influence of global warming, the spatial distribution patterns of permafrost in this area have undergone notable and complex changes [37,38,39].
In early November 2024 and mid-March 2025, the research team conducted field surveys to investigate the permafrost table in the Da Xing’anling Mountains region. A high-frequency shielded GPR system—SPIDAR, manufactured by Sensors & Software Inc. (SSI), Canada (1040 Stacey Court, Mississauga, ON, L4W 2X8, Canada) —was employed for data acquisition. The study area is located along a roadside section in the mountainous terrain of the Da Xing’anling Mountains, spanning from 124°07′E to 124°11′E and from 50°24′N to 51°03′N, as shown in Figure 2. The terrain is characterized by low hills and gentle slopes, falling within the cold temperate coniferous forest zone. Peaty soils commonly develop in wetlands and marshes, with vegetation dominated by cold-temperate coniferous species. The region receives an annual precipitation of 400–600 mm, primarily during the summer. As the southern extension of the Siberian boreal forest, vegetation in this area tends to be relatively sparse due to climatic constraints. The permafrost here belongs to the high-latitude type, with a mean annual air temperature of −1.2 °C. The area experiences a cold temperate continental monsoon climate, featuring distinct seasons, long and severe winters, and short summers.
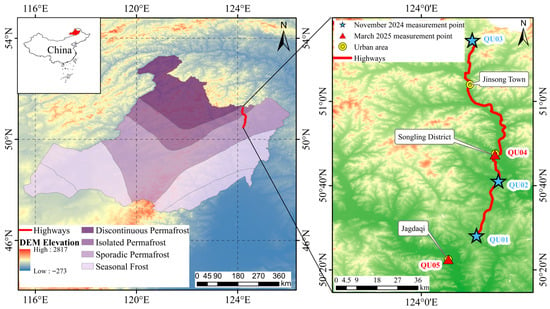
Figure 2.
Permafrost distribution map [40] and study area location map.
2.2. Description of Research Methods
2.2.1. Principles of Ground Penetrating Radar Application
GPR leverages the propagation characteristics of electromagnetic waves through media with varying dielectric constants, enabling the detection of both permafrost and ordinary soil layers. This capability stems from the distinctive interaction between electromagnetic waves and different subsurface layers, particularly in permafrost regions, where the presence of water in the frozen layer creates a marked dielectric contrast with the overlying active layer. This contrast leads to significant reflection of electromagnetic waves, making GPR an effective tool for delineating the permafrost table [41]. The radar data processing workflow is illustrated in Figure 3.
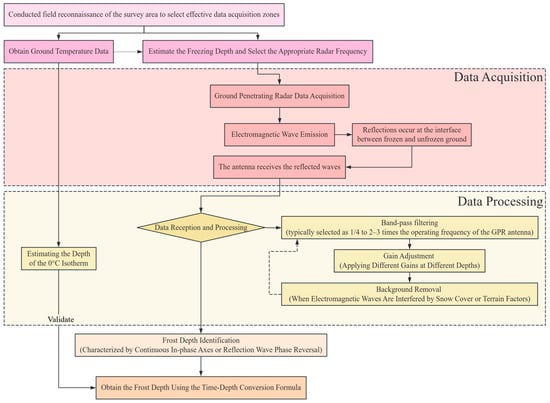
Figure 3.
The radar data processing workflow.
High-frequency and low-frequency antennas in GPR each offer distinct advantages and limitations. Figure 4 illustrates the GPR detection process. High-frequency electromagnetic waves, transmitted as wideband short pulses, are directed into the subsurface through the transmitting antenna. When these waves encounter subsurface layers or targets with electrical contrast, they are reflected and return to the surface, where they are received by the receiving antenna. Electromagnetic waves can be classified into three types: direct waves (often accompanied by surface reflections), reflected waves (which carry geological information), and transmitted waves. For readers interested in the fundamental principles of GPR, authoritative references such as Ground Penetrating Radar: Theory and Applications [42] and Ground Penetrating Radar [43] can be consulted; detailed formulas are not repeated here.
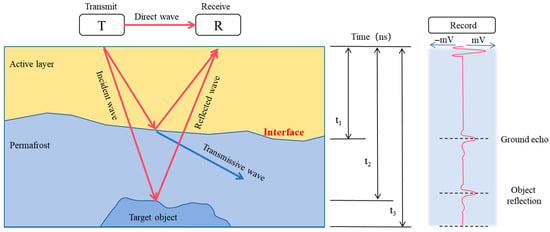
Figure 4.
Schematic diagram of GPR detection process.
In permafrost detection GPR, the propagation velocity of electromagnetic waves is a key parameter for calculating the depth of reflective interfaces. However, this velocity is often difficult to determine directly due to factors such as soil moisture content, freezing state, and medium heterogeneity. To overcome this limitation, the present study employs the Common Midpoint (CMP) method, which extracts velocity information from multi-offset measurements, thereby improving the accuracy of interface depth inversion. Figure 5 illustrates the principle of the CMP method, where T denotes the transmitter and R denotes the receiver.
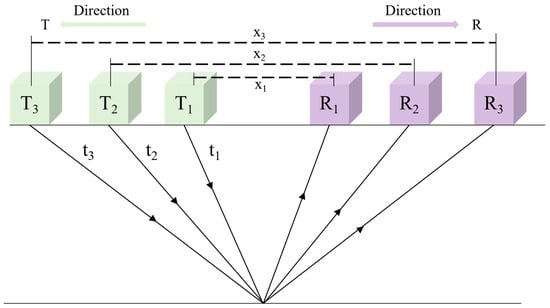
Figure 5.
Principle Diagram of the CMP Method.
The CMP method is a widely used velocity analysis technique in GPR surveys. Its basic principle is to maintain a fixed midpoint between the transmitting and receiving antennas while gradually increasing the antenna separation to acquire multi-offset radar records. As the offset increases, the two-way travel time of the same reflective interface exhibits a characteristic hyperbolic pattern. By fitting this hyperbola, the electromagnetic wave propagation velocity in the medium can be inverted, thereby improving the accuracy of interface depth calculations [44].
where the two-way travel time corresponding to an antenna separation of ; is the two-way travel time at zero offset and is the electromagnetic wave propagation velocity in the medium.
According to this formula, the CMP curve exhibits a hyperbolic shape. By fitting a hyperbola to the observed data, the values of and can be inverted, which can then be used to calculate the depth of the reflective interface:
Therefore, the CMP method provides reliable velocity information for the quantitative interpretation of ground-penetrating radar data and is particularly suitable for accurately estimating the active layer thickness and the upper boundary depth of permafrost.
2.2.2. Interface Identification Methods
Centroid Method
The centroid method is an interface identification approach based on the amplitude distribution of radar signals. Its core principle is to determine the position of the target interface by calculating the weighted average location of the waveform envelope amplitude along depth. This method assumes that reflection amplitudes are concentrated near the interface, so the centroid position can effectively represent the interface depth [45,46].
By performing envelope analysis on the preprocessed radar signal, the envelope amplitude is calculated to extract the reflection energy distribution of each A-scan in the vertical radar waveform. For each trace, a target reflection window is selected, and the weighted average depth of the energy within this window is computed as the interface position of that trace, expressed as:
where is the envelope amplitude at the i-th sample point; is the depth of the i-th sample point converted from sampling time using the wave velocity; are the start and end sample points of the target reflection window; and is the interface position extracted using the centroid method.
is typically obtained by applying the Hilbert transform to the raw radar waveform. For a radar profile signal , the analytic signal can be derived using the Hilbert transform as . The envelope amplitude is then calculated as , where denotes the Hilbert transform and represents the 90° phase-shifted version of the original signal.
To minimize the influence of background noise on centroid calculation, a minimum amplitude threshold can be set, and only sampling points that satisfy are included in the computation. This step enhances the stability of the centroid method under low signal-to-noise ratio (SNR) conditions. The centroid method is straightforward to implement and performs well for continuous reflection interfaces; however, in cases of low SNR or overlapping interfaces, positioning deviations may occur. Therefore, in practical applications, the centroid method is often combined with other techniques to improve the accuracy and reliability of interface identification.
Edge-Detection Method
The edge-detection method is an interface identification approach based on the gradient of the radar signal envelope amplitude. Its core idea is to analyze the rate of amplitude change with depth and identify locations of rapid variation as interfaces. This method assumes that signal amplitudes change significantly at interfaces, so gradient extrema can be associated with the positions of target interfaces [45,47,48].
By utilizing the characteristic of abrupt reflection intensity changes at interfaces in the preprocessed radar signal, the first-order difference or gradient of the A-scan envelope signal is computed, and the point of maximum gradient is extracted as the potential interface position. The edge-detection method is highly sensitive to sudden variations in reflection positions, enabling more precise interface delineation. Its mathematical expression is given as:
or, in its discrete form:
where is the envelope amplitude at the i-th sample point; represents the rate of change in envelope amplitude with depth; and denotes the interface position extracted using the edge-detection method.
Fusion Method
Individual methods often have certain limitations in interface identification. For example, the edge-detection method performs well at interfaces with pronounced reflection contrasts but is prone to misidentification under low signal-to-noise ratio (SNR) or weak reflection conditions. Conversely, the centroid method provides stable results in continuous reflection zones, but its positioning accuracy can be affected by signal broadening. Therefore, this study proposes a fusion approach that leverages the complementary strengths of both methods to enhance the accuracy and stability of interface detection.
In the fusion process, the interface positions are first determined separately using the edge-detection and centroid methods, yielding two candidate results, and . Then, based on data quality and reflection characteristics, the final interface position is determined through either weighted fusion or rule-based selection. Its basic form can be expressed as:
where are weighting coefficients. If the reflection signal is clear and the interface is continuous, is assigned; if the interface is ambiguous or heavily affected by noise, is used. represents the interface position after fusion.
3. Evaluation of Application Effectiveness
3.1. Evaluation of Testing Accuracy
In November 2024, a survey was conducted at site QU01 using a 250 MHz antenna. Envelope analysis was applied to the acquired radar data, and potential subsurface interfaces were identified using both the centroid and edge detection methods. The accuracy of the interpreted results was subsequently validated against ground temperature data. Borehole information for site QU01 is presented in Figure 6.
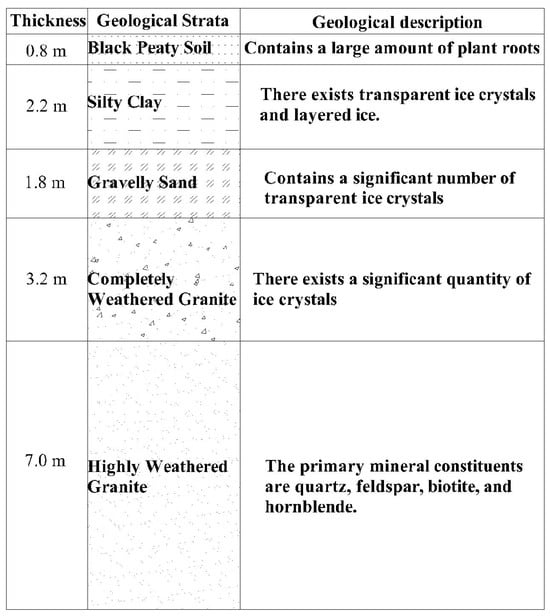
Figure 6.
Borehole Data at QU01.
Figure 7(a-1,a-2) shows the radar profile obtained at the QU01 location using a 250 MHz antenna, as well as the radar waveform envelope curve extracted through Hilbert transformation. In the envelope profile, the blue and pink lines indicate potential interface positions identified using the centroid and edge detection methods within the typical active layer depth range. A weighted fusion of these two methods was applied to derive a more representative permafrost table, shown as the red line. The slight undulation of the interface along the profile reflects spatial variability in soil properties. Figure 7(b-1,b-2) present a radar profile segment and its corresponding envelope, extracted from Figure 7(a-1). This profile intersects with the borehole location at a horizontal distance of 6.2 m. According to borehole sampling and ground temperature observations, the stratigraphy at this site consists of black peat soil from 0 to 0.8 m, underlain by silty clay containing ice crystals and layered ice from 0.8 to 3.0 m. In the radargram, a continuous, high-amplitude reflection band is observed within the top 0–0.5 m, typically corresponding to the air–ground interface and serving as a reference zero point for identifying deeper subsurface structures. Accurate estimation of electromagnetic wave velocity is essential for determining the active layer thickness. At this site, the wave velocity was measured using the CMP method, revealing an increase from 0.10 m/ns near the surface to 0.12 m/ns with depth. Hyperbolic fitting was subsequently performed within the high-reflection window (20–50 ns) to refine the velocity estimation. Therefore, a constant velocity of 0.11 m/ns was adopted to convert the time axis to depth.
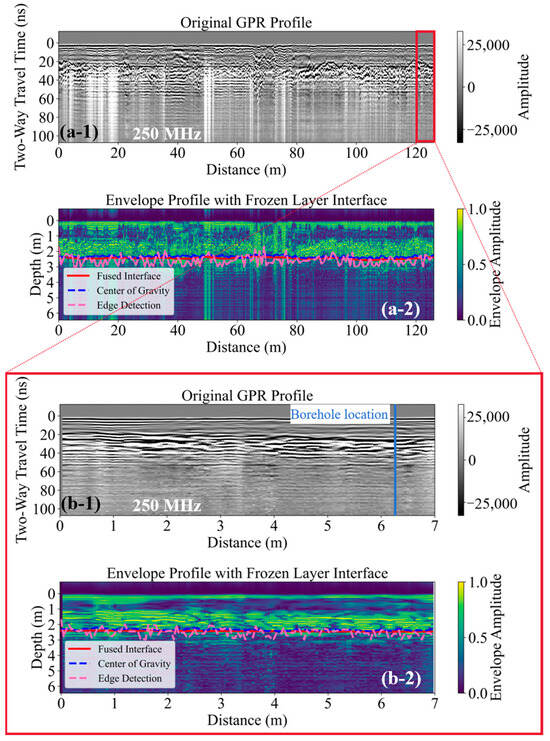
Figure 7.
(a-1,a-2) Original radar image at the QU01 location obtained using a 250 MHz antenna, along with the corresponding radar waveform envelope. (b-1,b-2) A segment of the original radar image from (a-1) and its corresponding envelope.
According to the Permafrost Ground Temperature Dataset Along the China-Russia Crude Oil Pipeline in Northeast China (2011–2021) [49], as shown in Figure 8, ground temperature observations in 2018, 2019, and 2023 indicated that the permafrost table was located at depths of 2.43 m, 1.6 m, and 1.72 m, respectively. However, the most recent observations in 2024 reveal that the permafrost table has deepened to 2.34 m. To visually illustrate the performance and differences in interface positioning among various methods, the interface lines extracted by three algorithms were superimposed on the radar envelope image. The interface identified by the centroid method exhibits a smooth overall trend, representing the central region of waveform energy concentration. This method is less affected by local amplitude fluctuations and offers high stability. In contrast, the edge detection method is more sensitive to abrupt changes at reflection boundaries, providing higher localization accuracy in areas with strong dielectric contrasts, but it tends to produce discontinuities in weak reflection or noisy regions. The fusion method integrates the strengths of both approaches, optimizing for both accuracy and continuity. This fused interface was ultimately used to calculate the active layer thickness. The positioning results indicate that the interface is located within a two-way travel time of approximately 37–42 ns.
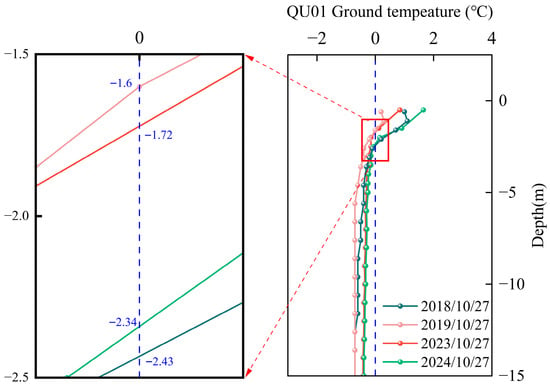
Figure 8.
Variation curve of ground temperature with depth at QU01.
The three extracted interface lines exhibit good overall consistency across most of the radar profile. However, noticeable discrepancies arise in areas with complex waveforms or anomalous reflections, which can provide valuable insights for subsequent multi-source data comparison and anomaly interpretation.
Figure 9(a-1) shows the original GPR image of the QU02 survey line, located on a roadside slope, acquired with a 250 MHz antenna, along with its corresponding envelope profile in Figure 9(a-2). Figure 9(b-1,b-2) present a locally enlarged section of the profile and its corresponding envelope profile, where distinct reflection bands can be observed at different depths. Two notable reflection zones appear within the two-way travel time windows of 24–35 ns and 43–57 ns. These zones exhibit continuous, high-amplitude reflections. The shallow reflection is characterized by smooth and laterally continuous waveforms, suggesting minimal dielectric contrast across the interface. Considering the survey location on a man-made slope, this reflection is interpreted as the base of the roadbed. In contrast, the deeper reflection shows irregular and undulating patterns with significant lateral variability, which is indicative of the permafrost table. The weak dielectric contrast at approximately 1.4 m depth results in a less pronounced reflection feature in the GPR image. To evaluate the overall reflection strength of this section, Figure 9c presents the average trace amplitude curve derived from the zoomed-in radar profile. This was calculated by averaging the amplitude along the time/depth axis for each trace and then aggregating the results across the profile. The resulting curve highlights variations in reflection strength, which is useful for identifying abrupt changes in reflectivity, estimating signal-to-noise ratio, and supporting interface interpretation. Two prominent amplitude peaks are observed at 28.84 ns and 46.57 ns, corresponding to the base of the roadbed and the permafrost table, respectively.
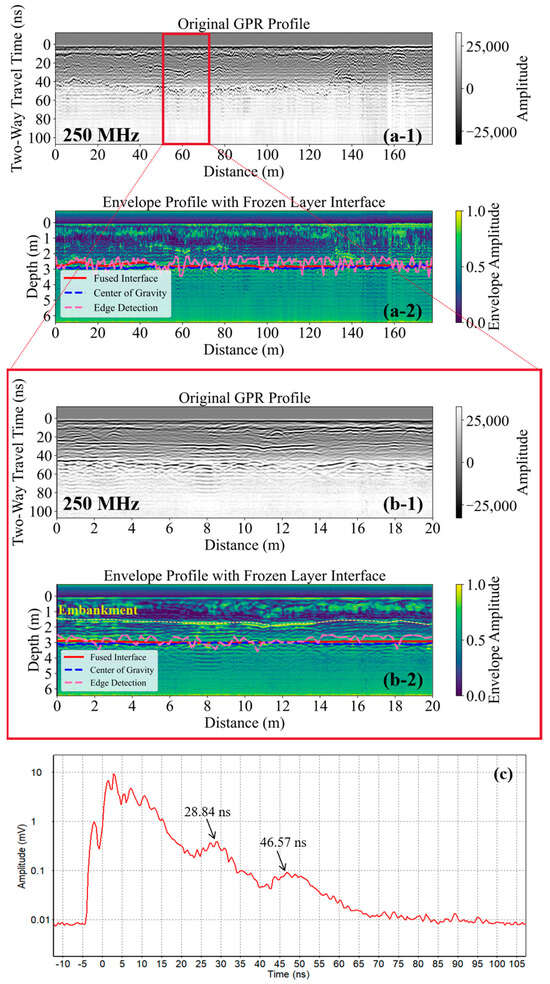
Figure 9.
(a-1,a-2) Original GPR image at the QU02 location acquired with a 250 MHz antenna and the corresponding envelope. (b-1,b-2) Locally enlarged section of the profile and its corresponding envelope. (c) Average trace amplitude curve of the zoomed-in profile.
3.2. Performance of the 250 MHz and 500 MHz Antennas in Detection
Figure 10(a-1,a-2) present the raw radar image and its corresponding envelope plot acquired with the 250 MHz antenna along transect QU03, while Figure 10(a-3,a-4) show the raw image and envelope plot obtained with the 500 MHz antenna along the same transect. Despite the notable differences in imaging bandwidth and signal structure between the two frequencies, the interfaces extracted using the multi-strategy identification approach exhibit a high degree of consistency, demonstrating the robustness of the method across different frequencies. From the envelope plots, the permafrost table in the 250 MHz image displays more pronounced lateral undulations, indicating greater sensitivity to weak reflective disturbances. In contrast, the 500 MHz image yields a smoother interface with significantly reduced local anomalies. This may be attributed to the higher-frequency antenna concentrating energy in the shallow subsurface—thus attenuating deeper signals—or its tendency to capture signal peaks rather than the full envelope energy distribution. Figure 10(b-1,b-2) show the average trace amplitude curves obtained with the 250 MHz and 500 MHz antennas, respectively. Both curves exhibit distinct peaks at approximately 38 ns, indicating strong energy concentration at the interface—most likely corresponding to the dielectric contrast between the active layer and the underlying permafrost. These results further validate the effectiveness of the multi-method extraction strategy in capturing key structural features and highlight its reliability for consistent interface identification across radar systems operating at different frequencies.
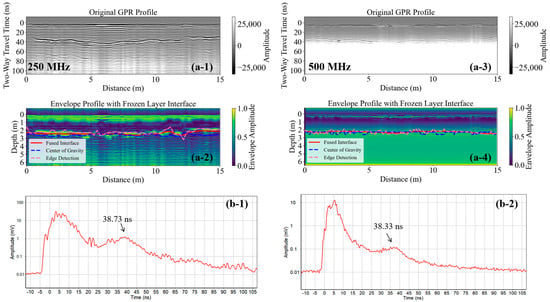
Figure 10.
(a-1,a-2) Original GPR images at the QU03 location acquired with a 250 MHz antenna and their corresponding envelope plots. (a-3,a-4) Raw images and envelope plots obtained along the same transect using a 500 MHz antenna. (b-1,b-2) Average trace amplitude curves derived from the 250 MHz and 500 MHz antennas, respectively.
3.3. Detection Response of Active Layer Thickness in Seasonal Permafrost Regions in March
In seasonally frozen ground regions, by November the ground surface is generally well-frozen and soil moisture content has significantly decreased, allowing GPR to achieve good coupling with the surface. This ensures efficient signal transmission and high detection accuracy, making this period particularly suitable for measuring the upper boundary of permafrost and obtaining a stable reference for the base of the active layer. In contrast, by March of the following year, although the surface remains frozen, shallow soil temperatures begin to rise, making this period more appropriate for measuring the seasonal frost depth. Conducting GPR surveys at these two key time points allows for the acquisition of both permafrost upper boundary and seasonal frost depth information, providing a reliable basis for analyzing the annual variations and spatial distribution of active layer thickness, and offering valuable insights into the seasonal dynamics of permafrost and its response to environmental changes.
To investigate the responses of GPR antennas with different frequencies to active layer structures during the early spring thaw, radar surveys were conducted in March at sites QU04 and QU05 within the seasonally frozen ground region. At site QU04, ground temperature observations from three temperature chains are shown in Figure 11(a-1). Figure 11(b-1,b-2) present the original radar profile and corresponding envelope obtained using a 250 MHz antenna along the first survey line, while Figure 11(b-3,b-4) show the results from the 500 MHz antenna along the same line. Figure 11(c-1,c-2), together with Figure 11(c-3,c-4), display the original radar profiles and corresponding envelope plots acquired using the 250 MHz and 500 MHz antennas along the second survey line at QU04. The data indicate that the 0 °C isotherm at this site occurs at a depth of 1.46 m. At site QU05, ground temperature observations are presented in Figure 12(a-1). Figure 12(b-1,b-2), along with Figure 12(b-3,b-4), show the original radar profiles and corresponding envelope plots acquired with the 250 MHz and 500 MHz antennas, respectively. The data indicate that the 0 °C isotherm at this site occurs within a depth range of 1.34–1.40 m. Notable differences were observed between the two antenna frequencies in terms of penetration capability, reflection characteristics, and the adaptability of interface identification algorithms, reflecting their varying sensitivity and resolution for different layers of the active layer. The 250 MHz antenna exhibits strong penetration capability, reaching the base of the active layer and slightly into the upper permafrost, making it particularly suitable for measuring the upper boundary of permafrost and providing a stable reference. In contrast, the 500 MHz antenna is better suited for capturing high-resolution shallow structures, effectively reflecting the characteristics of the frozen soil in the upper portion of the active layer, and is therefore more appropriate for measuring seasonal frost depth in seasonally frozen ground regions. Using the CMP method combined with hyperbolic fitting, radar wave velocities at both sites were analyzed, and a velocity of 0.08 m/ns was adopted to convert two-way travel time to depth.
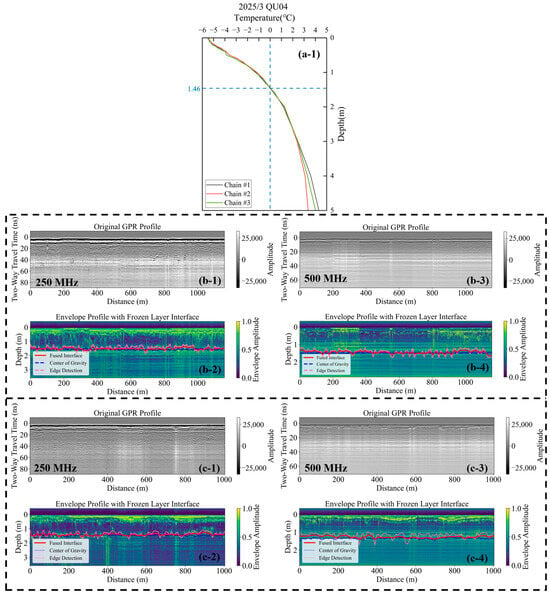
Figure 11.
(a-1) Ground temperature observations from three temperature chains at the QU04 site. (b-1,b-2) Original GPR profile and corresponding envelope obtained along the first survey line at QU04 using a 250 MHz antenna. (b-3,b-4) Original GPR profile and corresponding envelope along the same line acquired with a 500 MHz antenna. (c-1,c-2) and (c-3,c-4) Original GPR profiles and corresponding envelopes obtained along the second survey line at QU04 using 250 MHz and 500 MHz antennas, respectively.
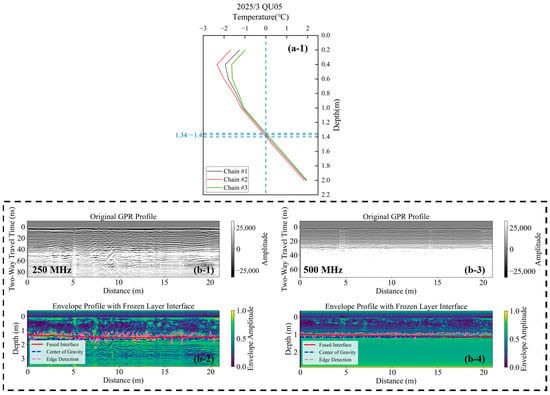
Figure 12.
(a-1) Ground temperature observations at the QU05 site. (b-1,b-2) Original GPR profiles and corresponding envelopes acquired along the survey line at QU05 using a 250 MHz antenna. (b-3,b-4) Original GPR profiles and corresponding envelopes along the same line acquired with a 500 MHz antenna.
Regarding interface extraction, the centroid method, edge detection method, and their fusion approach were all applicable to GPR images from both frequencies, though slight differences were observed in the results. For the 250 MHz images, the interfaces extracted by all three methods were closely aligned, demonstrating good stability in identification. In contrast, for the 500 MHz images, due to stronger high-frequency noise in the shallow subsurface, the centroid method produced a relatively smooth interface line, whereas the edge detection method showed greater fluctuations. Therefore, combining multiple algorithms through fusion was necessary to optimize the final interface extraction.
3.4. The Impact of Snow Cover
To investigate the impact of snow cover thickness on the survey results, two survey lines were established at the QU02 site. Both lines extended from a snow-free area into a snow-covered area, enabling the observation of any significant differences in the radar images. The field layout is shown in Figure 13.
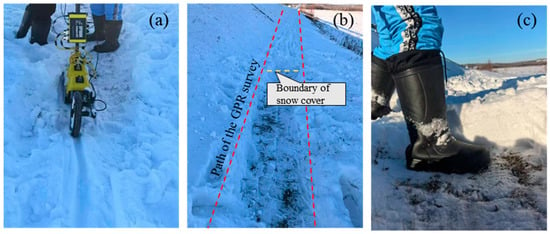
Figure 13.
Field study on the influence of snow on radar survey results. (a) Ground penetrating radar passes the snow boundary. (b) Comparison of Ground-Penetrating Radar Detection Path with and without Snow Accumulation. (c) Snow Accumulation Thickness at the Study Area.
Figure 14 clearly show that the thickness of the snow cover significantly affects the survey results, generating substantial radar clutter. This clutter interferes with the target echo signals, creating multiple similar waveforms that exhibit periodicity in the vertical direction. These multiple echoes are challenging to remove using background subtraction or other technical methods. In contrast, in snow-free areas, such echoes are less frequent, and their impact can be mitigated through technical techniques. Therefore, the snow cover thickness plays a crucial role in shaping the survey outcomes. For Line 1, the transition between snow-covered and snow-free sections occurs at a horizontal distance of approximately 24 m, while for Line 2, it is around 5.8 m. A comparison of single-path waveforms before and after the transition points on both lines revealed that, in snow-covered areas, the waveforms become narrower and shorter, whereas in snow-free sections, they are broader and longer. This phenomenon can be attributed to the propagation characteristics of electromagnetic waves, as the snow layer causes attenuation. The thicker the snow layer, the greater the attenuation, leading to narrower and more complex waveforms.
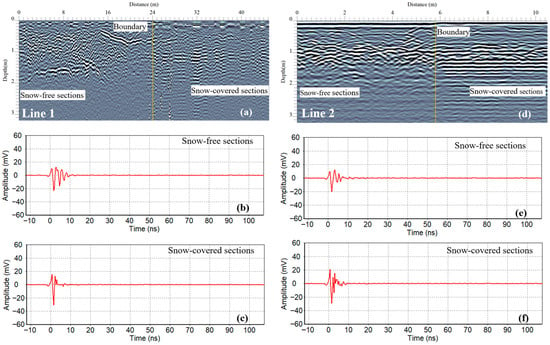
Figure 14.
Ground-penetrating radar original image and single-channel waveform diagram. (a,d) Original GPR image; (b,e) Single-channel waveforms of snow-free sections; (c,f) Single-channel waveforms of snow-covered sections.
Snow primarily affects radar detection depth and image quality. In terms of detection depth, radar signals undergo attenuation as they pass through the snow layer [50]. Additionally, the snow layer itself can act as a reflective surface, interfering with the identification of underground objects. The snow’s high porosity causes radar signals to interact with snow particles, resulting in scattering, which accelerates the attenuation of electromagnetic waves in snow-covered areas. Regarding image quality, the physical properties of snow, such as density and moisture content, differ from those of the underlying soil and rock. These differences cause the radar wave propagation speed through the snow to vary from that in the underground medium. This velocity disparity can distort the image of the subsurface structure. Due to the signal attenuation and interference caused by snow, the data processing and analysis of GPR become more complex. Specialized signal processing techniques may be required to isolate and identify genuine underground targets.
4. Discussion
4.1. Evaluation of Superiority
In recent years, monitoring of permafrost active layer thickness (ALT) has been shifting from traditional drilling and in situ observations toward approaches that integrate multiple methods and multi-source data. Geophysical techniques—particularly electrical resistivity tomography (ERT), remote sensing, and numerical modeling—have become important tools. At the regional scale, ERT can accurately characterize permafrost structures and subsurface moisture distribution, offering significant advantages for analyzing the spatial heterogeneity of deep permafrost and thermokarst terrain [51,52,53]. Long-term ground observation data, such as permafrost and active layer records from Samoylov Island between 2002 and 2017, provide a foundation for validating remote sensing data and surface–snow–permafrost models. They also reveal the influence of climatic factors on the interannual variability of active layer thickness [54]. At the regional scale, remote sensing technologies—particularly airborne SAR combined with multi-source observational data—can rapidly enable dynamic monitoring and capture the nonlinear relationship between seasonal ground deformation and active layer thickness [55,56]. Moreover, integrating ground observations, remote sensing data, and numerical modeling enables accurate estimation and prediction of ALT in both space and time, providing reliable support for regional permafrost environment analysis [57]. Overall, these studies indicate that current permafrost monitoring technologies are evolving into a multi-source collaborative framework: high-resolution ground-based measurements form the foundation, remote sensing expands spatial coverage, and numerical modeling provides comprehensive analysis. This integrated approach offers crucial technical support for permafrost engineering surveys, infrastructure design, and studies of permafrost environmental evolution.
Under the growing demand for high-resolution local monitoring and dynamic regional observation, the complementary use of different geophysical methods has become particularly important. In this context, high-frequency GPR offers new possibilities for the precise identification of ALT. Although existing ERT and remote sensing techniques play vital roles in analyzing deep structures and conducting regional monitoring, they still have limitations in shallow interface accuracy, rapid automated processing, and visualization of local structures. The application of high-frequency GPR effectively addresses these gaps. With the increasing need for refined monitoring of permafrost active layers, there is an urgent demand for a method that provides both high-resolution local information and fast, automated processing. High-frequency GPR demonstrates unique advantages in this regard, making it a focal tool of recent research.
In this study, high-frequency GPR systems operating at 250 MHz and 500 MHz were deployed in the island permafrost region of the Greater Khingan Mountains, combined with a multi-strategy interface identification algorithm to achieve automated, high-precision extraction of ALT. The results indicate that the 250 MHz antenna is particularly suitable for measuring the upper boundary of permafrost, effectively capturing deeper and thicker stratigraphic interfaces and providing a stable reference for long-term monitoring. In contrast, the 500 MHz antenna is better suited for measuring seasonal frost depth, clearly resolving detailed structures in the shallow frozen soil and aiding the analysis of seasonal variations in the active layer. Furthermore, the reliability of interface extraction was verified through comparison with ground temperature monitoring data, and the influence of snow cover on electromagnetic wave propagation was quantitatively assessed, providing a scientific basis for radar observations in complex permafrost environments.
Moreover, this study achieved efficient automated analysis in a complex island permafrost environment. Compared with studies conducted in Barrow [58], the Qinghai–Tibet Plateau [59], and the palsa regions of Lapland [60], the proposed method demonstrates significant advantages in handling highly heterogeneous local permafrost and rapidly extracting interfaces. These comparisons indicate that the high-frequency, multi-strategy GPR approach not only produces active layer thickness results comparable to those obtained in other regions but also offers improvements in accuracy, efficiency, and local applicability, providing a practical technical solution for monitoring active layers in complex terrain. In summary, the results of this study demonstrate that combining high-frequency GPR with an automated, multi-strategy interface identification method enables fast and reliable extraction of active layer thickness in complex permafrost environments, offering strong support for regional permafrost dynamics research and engineering applications.
4.2. Limitations
GPR offers clear advantages for detecting the active layer in permafrost regions, but its practical application is still constrained by several factors. GPR imaging relies on contrasts in the dielectric properties between different subsurface materials. When the active layer is only partially thawed or in a transitional freeze–thaw state, weak dielectric contrasts may result in unclear reflection signals, increasing the difficulty of interface identification [61,62]. High-frequency antennas are particularly prone to severe signal attenuation under wet or thawed conditions, which limits penetration depth and reduces detection accuracy near the base of the active layer [63,64]. A major limitation of this study lies in the influence of soil and snow moisture content on radar signal penetration. Because the dielectric properties of snow and subsurface layers are highly sensitive to water content, variations in moisture can affect the accuracy of radar wave propagation and reflection [65]. Although this study did not quantitatively correct for the effect of moisture, future work should focus on developing appropriate calibration models or integrating auxiliary observations, such as ground temperature and soil moisture sensors, to minimize the uncertainty introduced by this factor. Furthermore, GPR data interpretation heavily relies on the operator’s experience and expertise; without multi-source validation, its use alone may produce ambiguous or uncertain results. Therefore, in complex environmental conditions, it is recommended to combine GPR with drilling observations, ground temperature measurements, or other geophysical methods to enhance the reliability of interface extraction [55].
At the algorithmic level, automated interface identification methods—such as edge detection, the centroid method, and multi-strategy fusion of envelope analysis—can improve extraction efficiency and stability, but limitations remain [66]. Complex waveforms, overlapping reflections, or noisy environments may lead to localized misidentifications. We acknowledge that while envelope processing enhances interface continuity and reduces noise, it may also diminish features related to local thickness variations in the original profiles [67]. This suggests that envelope analysis is better suited as a complementary tool rather than a complete replacement for the original radar images. In future work, we plan to explore hybrid strategies that combine amplitude analysis with structural interpretation to maintain interface clarity while better preserving local variations. Multi-strategy methods still rely on experience for parameter settings—such as filter windows and threshold selection—which can affect the accuracy and stability of automated processing. Additionally, the current algorithms have limited applicability under extreme terrain conditions or in water-saturated layers and exposed bedrock areas, necessitating optimization and validation through increased profile density and integration with multi-source data. Future research could further enhance the method’s applicability and precision by optimizing algorithm parameters, introducing adaptive identification strategies, and integrating multi-source datasets.
4.3. Application and Significance in the Context of Climate Change
Under the context of climate change, ALT serves as a critical indicator for assessing the thermal response of permafrost and the surface–permafrost coupling processes. With rising temperatures and changing precipitation patterns, the active layer generally exhibits a thickening trend, which not only affects the thermodynamic stability of permafrost but also leads to surface subsidence, thaw-induced landslides, and infrastructure damage. High-precision, multi-strategy GPR methods can rapidly and automatically provide local ALT data, offering direct observational evidence for monitoring permafrost responses to climate change. Such data are essential for validating and calibrating regional and global permafrost dynamic models, helping scientists understand the spatial heterogeneity and temporal evolution of permafrost degradation, and providing fundamental information for predicting geomorphological changes, ecosystem responses, and carbon release risks under changing climate conditions.
Building on this, the present study not only achieves high-precision ALT extraction at the local scale but also provides reliable guidance for engineering planning and infrastructure siting. Furthermore, through multi-source data integration, it supports regional-scale permafrost monitoring and climate change impact assessments. The combination of multi-channel, high-resolution GPR with traditional geoelectrical surveys, drilling, and remote sensing observations can establish a more comprehensive monitoring framework, helping to reveal the dynamic evolution characteristics of active layers in complex island permafrost regions, continuous permafrost zones, and high-latitude engineering corridors.
5. Conclusions
This study focuses on the detection of the permafrost table in continuous permafrost regions. GPR surveys were conducted using both 250 MHz and 500 MHz shielded antennas. To address the challenges associated with accurately identifying the permafrost table, a multi-strategy identification approach incorporating envelope analysis was proposed. To assess the reliability of the GPR-based interpretations, the results were cross-validated with ground temperature monitoring data. The main findings of this study are as follows:
- The multi-strategy interface identification method based on envelope analysis demonstrates strong applicability for detecting active layer thickness. By integrating high-frequency GPR data with multiple auxiliary data sources, the spatial distribution of permafrost active layer thickness can be accurately delineated. The results indicate that the 250 MHz antenna is more suitable for measuring the depth of the permafrost table, effectively capturing thicker and deeper stratigraphic interfaces and providing a stable reference for long-term monitoring. In contrast, the 500 MHz antenna is better suited for measuring shallow seasonal frost depth, clearly resolving detailed scale structures in the upper frozen soil and facilitating the analysis of seasonal variations in the active layer.
- The 250 MHz antenna is more suitable for capturing the overall thickness of the active layer and is particularly effective for dynamic monitoring under frozen conditions. In contrast, the 500 MHz antenna is better suited for identifying shallow frost structures and potential localized anomalies. The combined use of both frequencies enables complementary detection of stratigraphic features at different depths, thereby enhancing the completeness and interpretability of the survey results.
- During field GPR surveys, to ensure optimal performance of high-frequency antennas in detecting the permafrost table, it is essential to maintain a smooth ground surface and remove snow cover as much as possible.
GPR can be used to detect the permafrost table; however, its standalone application still lacks sufficient validation. Therefore, GPR survey results should be integrated with borehole data to extend the spatial coverage of subsurface information and improve the overall accuracy of permafrost investigations.
Author Contributions
Conceptualization, L.Y., Y.S. and C.D.; methodology, L.Y., Y.S. and K.G.; software, L.Y. and K.G.; validation, L.Y., C.D. and Y.W. (Yiru Wei); formal analysis, L.Y., Y.L. and Y.W. (Yi Wu); investigation, L.Y., Y.S. and C.D.; resources, C.D. and G.L.; data curation, L.Y., Y.S., C.D. and G.L.; writing—original draft preparation, L.Y. and Y.S.; writing—review and editing, L.Y., Y.S., C.D., Y.L., G.L. and Y.W. (Yi Wu); visualization, Y.W. (Yi Wu) and Y.W. (Yiru Wei); supervision, Y.S., C.D. and G.L.; project administration, Y.S.; funding acquisition, C.D. All authors have read and agreed to the published version of the manuscript.
Funding
This research was funded by the Yunnan Key Laboratory of International Rivers and Transboundary Eco-Security (NO. 2022KF03), Instrumentation and Methodology Development Technology Innovation Program of Chinese Academy of Sciences (NO. SJ202502), the National Natural Science Foundation of China (NO. 42272339), the Natural Science Foundation of Gansu Province (NO. 23JRRA660).
Data Availability Statement
The original contributions presented in the study are included in the article; further inquiries can be directed to the corresponding author.
Conflicts of Interest
The authors declare no conflicts of interest.
References
- Subcommittee, P. Glossary of Permafrost and Related Ground-Ice Terms; Associate Committee on Geotechnical Research, National Research Council of Canada: Ottawa, ON, Canada, 1988; Volume 156, pp. 63–64. [Google Scholar]
- Gao, Z.; Zhang, C.; Liu, W.; Niu, F.; Wang, Y.; Lin, Z.; Yin, G.; Ding, Z.; Shang, Y.; Luo, J. Extreme degradation of alpine wet meadow decelerates soil heat transfer by preserving soil organic matter on the Qinghai–Tibet Plateau. J. Hydrol. 2025, 653, 132748. [Google Scholar] [CrossRef]
- Qin, D.; Yao, T.; Ding, Y.; Ren, J. Classification and geographical distribution of cryosphere. In Introduction to Cryospheric Science; Springer: Berlin/Heidelberg, Germany, 2021; pp. 33–79. [Google Scholar]
- Gao, X.; Lin, K.; Liu, M.; Dong, C.; Yao, Z.; Liu, Z.; Xiao, M.; Xie, X.; Huang, L. Dynamic changes in permafrost distribution over China and their potential influencing factors under climate warming. Sci. Total Environ. 2023, 874, 162624. [Google Scholar] [CrossRef]
- Gruber, S. Derivation and analysis of a high-resolution estimate of global permafrost zonation. Cryosphere 2012, 6, 221–233. [Google Scholar] [CrossRef]
- Shang, Y.-H.; Niu, F.-J.; Li, G.-Y.; Fang, J.-H.; Gao, Z.-Y. Application of a concrete thermal pile in cooling the warming permafrost under climate change. Adv. Clim. Change Res. 2024, 15, 170–183. [Google Scholar] [CrossRef]
- Qinghu, L. Analysis of Permafrost Table Variations along the Qinghai–Tibet Railway. China Railw. 2011, 5, 31–34. [Google Scholar]
- WangYinxue, Z. A study of factors which control variation of permafrost table. J. Glaciol. Geocryol. 2011, 33, 1064r1067. [Google Scholar]
- Liu, W.; Shang, Y.; Li, G.; Gao, K.; Zhang, H.; Sheng, J. Seasonal freeze-thaw behavior of ground in mid-latitude cold regions: A case study in Bei’an County, Heilongjiang Province. Front. Earth Sci. 2025, 13, 1566593. [Google Scholar] [CrossRef]
- Shang, Y.; Niu, F.; Fang, J.; Wu, L. Experimental study on thermal regime and frost jacking of pile foundation during operation period in permafrost regions. Front. Earth Sci. 2022, 10, 821305. [Google Scholar] [CrossRef]
- Shang, Y.; Cao, Y.; Li, G.; Gao, K.; Zhang, H.; Sheng, J.; Chen, D.; Lin, J. Characteristics of meteorology and freeze-thaw in high-latitude cold regions: A case study in Da Xing’anling, Northeast China (2022–2023). Front. Earth Sci. 2025, 12, 1476234. [Google Scholar] [CrossRef]
- Qi-hao, Y.; Guo-dong, C. Application of geophysical methods to permafrost in China. J. Glaciol. Geocryol. 2002, 24, 102–108. [Google Scholar]
- Chun, T.; Minghao, W.; Yonghui, Z.; Weifang, J. The Application of High-Frequency Ground-Penetrating Radar to Engineering Construction and Geoscience Exploration. Geophys. Geochem. Explor. 2000, 24, 455–458. [Google Scholar]
- Kravitz, B.; Mooney, M.; Karlovsek, J.; Danielson, I.; Hedayat, A. Void detection in two-component annulus grout behind a pre-cast segmental tunnel liner using Ground Penetrating Radar. Tunn. Undergr. Space Technol. 2019, 83, 381–392. [Google Scholar] [CrossRef]
- Yasuda, N.; Tsukada, K.; Asakura, T. Three-dimensional seismic response of a cylindrical tunnel with voids behind the lining. Tunn. Undergr. Space Technol. 2019, 84, 399–412. [Google Scholar] [CrossRef]
- Qin, H.; Xie, X.; Tang, Y.; Wang, Z. Experimental study on GPR detection of voids inside and behind tunnel linings. J. Environ. Eng. Geophys. 2020, 25, 65–74. [Google Scholar] [CrossRef]
- Cui, G.; Wang, Y.; Li, Y.; Hou, F.; Xu, J. Intelligent identification of defective regions of voids in tunnels based on GPR data. NDT E Int. 2025, 149, 103244. [Google Scholar] [CrossRef]
- Li, K.; Xie, X.; Zhai, J.; Zhou, B.; Huang, C.; Wang, C. Tunnel lining defects identification using TPE-CatBoost algorithm with GPR data: A model test study. Tunn. Undergr. Space Technol. 2025, 157, 106275. [Google Scholar] [CrossRef]
- Rasol, M.; Pérez-Gracia, V.; Assunção, S.S.; González-Drigo, R.; Clapes, J.; Sossa, V.A.; Schmidt, F. Background clutter amplitude and frequency of GPR signals to analyse water content in sedimentary deposits: Urban infrastructure environment. Environ. Res. 2022, 212, 113189. [Google Scholar] [CrossRef]
- Li, H.; Zhang, J.; Yang, X.; Ye, M.; Jiang, W.; Gong, J.; Tian, Y.; Zhao, L.; Wang, W.; Xu, Z. Bayesian optimization based extreme gradient boosting and GPR time-frequency features for the recognition of moisture damage in asphalt pavement. Constr. Build. Mater. 2024, 434, 136675. [Google Scholar] [CrossRef]
- Zhang, J.; Li, H.; Yang, X.; Cheng, Z.; Zou, P.X.; Gong, J.; Ye, M. A novel moisture damage detection method for asphalt pavement from GPR signal with CWT and CNN. NDT E Int. 2024, 145, 103116. [Google Scholar] [CrossRef]
- Li, K.; Liao, Z.; Ji, G.; Liu, T.; Yu, X.; Jiao, R. Estimation of the Soil Moisture Content in a Desert Steppe on the Mongolian Plateau Based on Ground-Penetrating Radar. Sustainability 2024, 16, 8558. [Google Scholar] [CrossRef]
- Wunderlich, T. MultichannelGPR: A MATLAB tool for Ground Penetrating Radar data processing. J. Open Source Softw. 2024, 9, 6767. [Google Scholar] [CrossRef]
- Santos, J.G.V.; Carneiro, A.F.T. Use of GPR-Ground Penetration Radar for detecting underground water distribution networks-case study: Technical cadastre of COMPESA-Companhia Pernambucana de Saneamento. Bol. De Ciências Geodésicas 2024, 30, e2024020. [Google Scholar] [CrossRef]
- Zhang, G.; Cui, F.; Zhang, X.; Cheng, Q.; Wang, R.; Zhang, M. Research on underground pipeline spatial positioning method based on multi-offset ground penetrating radar. Meas. Sci. Technol. 2024, 36, 015140. [Google Scholar] [CrossRef]
- Lin, C.; Wenbing, Y.; Xin, Y.; Ying, W.; Yue, M. Application of ground penetration radar to permafrost survey in Mohe County, Heilongjiang Province. J. Glaciol. Geocryol. 2015, 37, 723–730. [Google Scholar]
- Kang, S.; Park, G.; Kim, N.; Tutumluer, E.; Lee, J.-S. GPR-based depth estimation of ground interfaces in permafrost region: Electromagnetic method and cone penetration assessment. Measurement 2025, 242, 116158. [Google Scholar] [CrossRef]
- Li-ming, Z.; Yang, Z. Thickness of Glacier and Frozen Soil in the Source Region of Changjiang River Based on GPR Detection. J. Chang. River Sci. Res. Inst. 2024, 41, 1–8. [Google Scholar]
- Du, E.; Zhao, L.; Li, R. The application of ground penetrating radar to permafrost investigation in Qilian Mountains. J. Glaciol. Geocryol. 2009, 31, 364–371. [Google Scholar]
- Yu, Q.; Bai, Y.; Jin, H.; Qian, J.; Pan, X. The study of the patchy permafrost along the Heihe-Bei’an highway in Xiao Hinggan mountains with ground penetrating radar. J. Glaciol. Geocryol. 2008, 30, 461–468. [Google Scholar]
- Qi, S.; Li, G.; Chen, D.; Niu, F.; Sun, Z.; Wu, G.; Du, Q.; Chai, M.; Cao, Y.; Yue, J. Research on the characteristics of thermosyphon embankment damage and permafrost distribution based on ground-penetrating radar: A case study of the Qinghai–Tibet Highway. Remote Sens. 2023, 15, 2651. [Google Scholar] [CrossRef]
- Luo, D.; Jin, H.; Jin, R.; Yang, X.; Lü, L. Spatiotemporal variations of climate warming in northern Northeast China as indicated by freezing and thawing indices. Quat. Int. 2014, 349, 187–195. [Google Scholar] [CrossRef]
- Chen, X.; Zhou, Z. Deposit types, metallogenesis and resource prospect of Li-Be-Nb-Ta deposits in the Great Xing’an Range. Acta Petrol. Sin. 2023, 39, 1973–1991. [Google Scholar] [CrossRef]
- Zhongqiong, Z.; Qingbai, W.; Xueyi, X.; Yuncheng, L. Spatial distribution and changes of Xing’an permafrost in China over the past three decades. Quat. Int. 2019, 523, 16–24. [Google Scholar] [CrossRef]
- Zhang, Y.; Zang, S.; Li, M.; Shen, X.; Lin, Y. Spatial Distribution of Permafrost in the Xing’an Mountains of Northeast China from 2001 to 2018. Land 2021, 10, 1127. [Google Scholar] [CrossRef]
- Qiu, L.; Shan, W.; Guo, Y.; Zhang, C.; Liu, S.; Yan, A. Spatiotemporal dynamics of vegetation response to permafrost degradation in Northeast China. J. Arid. Land 2024, 16, 1562–1583. [Google Scholar] [CrossRef]
- Zhang, Y.; Chen, W.; Cihlar, J. A process-based model for quantifying the impact of climate change on permafrost thermal regimes. J. Geophys. Res. Atmos. 2003, 108, D22. [Google Scholar] [CrossRef]
- Wu, G.; Li, G.; Cao, Y.; Chen, D.; Qi, S.; Wang, F.; Gao, K.; Du, Q.; Wang, X.; Jing, H. Distribution and degradation processes of isolated permafrost near buried oil pipelines by means of electrical resistivity tomography and ground temperature monitoring: A case study of Da Xing’anling Mountains, Northeast China. Remote Sens. 2023, 15, 707. [Google Scholar] [CrossRef]
- Chang, X.; Jin, H.; Zhang, Y.; Li, X.; He, R.; Li, Y.; Lü, L.; Wang, H. Permafrost thermal dynamics at a local scale in northern Da Xing’anling Mountains. Environ. Res. Lett. 2024, 19, 064014. [Google Scholar] [CrossRef]
- Jin, H.; Hao, J.; Chang, X.; Zhang, J.; Yu, Q.h.; Qi, J.; Lü, L.; Wang, S. Zonation and assessment of frozen-ground conditions for engineering geology along the China–Russia crude oil pipeline route from Mo’he to Daqing, Northeastern China. Cold Reg. Sci. Technol. 2010, 64, 213–225. [Google Scholar] [CrossRef]
- Huang, Y.; Niu, F.; He, P.; Pan, W.; Yuan, K.; Su, W. Effectiveness evaluation of cooling measures for express highway construction in permafrost regions based on GPR and ERT. Cold Reg. Sci. Technol. 2024, 228, 104339. [Google Scholar] [CrossRef]
- Annan, A.P. Chapter 1—Electromagnetic Principles of Ground Penetrating Radar. In Ground Penetrating Radar Theory and Applications; Jol, H.M., Ed.; Elsevier: Amsterdam, The Netherlands, 2009; pp. 1–40. [Google Scholar]
- Daniels, D.J. Ground Penetrating Radar. In Encyclopedia of RF and Microwave Engineering; Institution of Engineering and Technology: London, UK, 2005. [Google Scholar]
- Greaves, R.J.; Lesmes, D.P.; Lee, J.M.; Toksöz, M.N. Velocity variations and water content estimated from multi-offset, ground-penetrating radar. Geophysics 1996, 61, 683–695. [Google Scholar] [CrossRef]
- Gonzalez, R.C. Digital Image Processing; Pearson Education: Noida, India, 2009. [Google Scholar]
- Ladaga, J.L.; Bonetto, R.D. Centroid, Centroid from Edge Vectors, and Shape Descriptor Using only Boundary Information. J. Comput.-Assist. Microsc. 1998, 10, 1–9. [Google Scholar] [CrossRef]
- Canny, J. A Computational Approach to Edge Detection. IEEE Trans. Pattern Anal. Mach. Intell. 1986, PAMI-8, 679–698. [Google Scholar] [CrossRef]
- Yilmaz, Ö. Seismic Data Analysis: Processing, Inversion, and Interpretation of Seismic Data; Society of Exploration Geophysicists: Houston, TX, USA, 2001. [Google Scholar]
- Guoyu, L.I. Ground temperature dataset of permafrost along the China-Russia crude oil pipeline route in Northeast China (2011–2021). Earth Syst. Sci. Data 2022, 14, 5093–5110. [Google Scholar] [CrossRef]
- Lundberg, A.; Richardson-Näslund, C.; Andersson, C. Snow density variations: Consequences for ground-penetrating radar. Hydrol. Process. 2006, 20, 1483–1495. [Google Scholar] [CrossRef]
- Farzamian, M.; Herring, T.; Vieira, G.; de Pablo, M.A.; Yaghoobi Tabar, B.; Hauck, C. Employing automated electrical resistivity tomography for detecting short- and long-term changes in permafrost and active-layer dynamics in the maritime Antarctic. Cryosphere 2024, 18, 4197–4213. [Google Scholar] [CrossRef]
- Basiru, A.; Kidanu, S.T.; Rybakov, S.; Hasson, N.; Kebe, M.; Acheampong, E.O. Electrical Resistivity Tomography Investigation of Permafrost Conditions in a Thermokarst Site in Fairbanks, Alaska. AIMS Geosci. 2024, 10, 1–27. [Google Scholar] [CrossRef]
- Minsley, B.J.; James, S.R.; Pastick, N.J. Alaska permafrost characterization: Electrical Resistivity Tomography (ERT) data collected in 2021. U.S. Geol. Surv. Data Release 2022. [Google Scholar] [CrossRef]
- Boike, J.; Nitzbon, J.; Anders, K.; Grigoriev, M.; Bolshiyanov, D.; Langer, M.; Lange, S.; Bornemann, N.; Morgenstern, A.; Schreiber, P.; et al. A 16-year record (2002–2017) of permafrost, active-layer, and meteorological conditions at the Samoylov Island Arctic permafrost research site, Lena River delta, northern Siberia: An opportunity to validate remote-sensing data and land surface, snow, and permafrost models. Earth Syst. Sci. Data 2019, 11, 261–299. [Google Scholar] [CrossRef]
- Parsekian, A.D.; Chen, R.H.; Michaelides, R.J.; Sullivan, T.D.; Clayton, L.K.; Huang, L.; Zhao, Y.; Wig, E.; Moghaddam, M.; Zebker, H.; et al. Validation of Permafrost Active Layer Estimates from Airborne SAR Observations. Remote Sens. 2021, 13, 2876. [Google Scholar] [CrossRef]
- Chang, T.; Yi, Y.; Jiang, H.; Li, R.; Lu, P.; Liu, L.; Wang, L.; Zhao, L.; Zwieback, S.; Zhao, J. Unraveling the non-linear relationship between seasonal deformation and permafrost active layer thickness. npj Clim. Atmos. Sci. 2024, 7, 308. [Google Scholar] [CrossRef]
- Wang, G.; Niu, S.; Yan, D.; Liang, S.; Su, Y.; Wang, W.; Yin, T.; Sun, X.; Wan, L. Simulation of Active Layer Thickness Based on Multi-Source Remote Sensing Data and Integrated Machine Learning Models: A Case Study of the Qinghai-Tibet Plateau. Remote Sens. 2025, 17, 2006. [Google Scholar] [CrossRef]
- Jafarov, E.E.; Parsekian, A.D.; Schaefer, K.; Liu, L.; Chen, A.C.; Panda, S.K.; Zhang, T. Estimating active layer thickness and volumetric water content from ground penetrating radar measurements in Barrow, Alaska. Geosci. Data J. 2017, 4, 72–79. [Google Scholar] [CrossRef]
- Wu, T.; Li, S.; Cheng, G.; Nan, Z. Using ground-penetrating radar to detect permafrost degradation in the northern limit of permafrost on the Tibetan Plateau. Cold Reg. Sci. Technol. 2005, 41, 211–219. [Google Scholar] [CrossRef]
- Kohout, T.; Bućko, M.S.; Rasmus, K.; Leppäranta, M.; Matero, I. Non-Invasive Geophysical Investigation and Thermodynamic Analysis of a Palsa in Lapland, Northwest Finland. Permafr. Periglac. Process. 2014, 25, 45–52. [Google Scholar] [CrossRef]
- Campbell, S.; Affleck, R.T.; Sinclair, S. Ground-penetrating radar studies of permafrost, periglacial, and near-surface geology at McMurdo Station, Antarctica. Cold Reg. Sci. Technol. 2018, 148, 38–49. [Google Scholar] [CrossRef]
- Du, E.; Zhao, L.; Zou, D.; Li, R.; Wang, Z.; Wu, X.; Hu, G.; Zhao, Y.; Liu, G.; Sun, Z. Soil Moisture Calibration Equations for Active Layer GPR Detection—A Case Study Specially for the Qinghai–Tibet Plateau Permafrost Regions. Remote Sens. 2020, 12, 605. [Google Scholar] [CrossRef]
- Sadurtdinov, M.R.; Sudakova, M.S.; Skvortcov, A.G.; Malkova, G.; Tsarev, A.M. Ground-Penetrating Radar for Studies of Peatlands in Permafrost. Russ. Geol. Geophys. 2019, 60, 793–800. [Google Scholar] [CrossRef]
- Bradford, J.H.; Harper, J.T.; Brown, J. Complex dielectric permittivity measurements from ground-penetrating radar data to estimate snow liquid water content in the pendular regime. Water Resour. Res. 2009, 45, W08403. [Google Scholar] [CrossRef]
- Galley, R.J.; Trachtenberg, M.; Langlois, A.; Barber, D.G.; Shafai, L. Observations of geophysical and dielectric properties and ground penetrating radar signatures for discrimination of snow, sea ice and freshwater ice thickness. Cold Reg. Sci. Technol. 2009, 57, 29–38. [Google Scholar] [CrossRef]
- Chen, C.-S.; Jeng, Y. Improving GPR Imaging of the Buried Water Utility Infrastructure by Integrating the Multidimensional Nonlinear Data Decomposition Technique into the Edge Detection. Water 2021, 13, 3148. [Google Scholar] [CrossRef]
- Wu, X.; Senalik, C.A.; Wacker, J.; Wang, X.; Li, G. Object Detection of Ground-Penetrating Radar Signals Using Empirical Mode Decomposition and Dynamic Time Warping. Forests 2020, 11, 230. [Google Scholar] [CrossRef]
Disclaimer/Publisher’s Note: The statements, opinions and data contained in all publications are solely those of the individual author(s) and contributor(s) and not of MDPI and/or the editor(s). MDPI and/or the editor(s) disclaim responsibility for any injury to people or property resulting from any ideas, methods, instructions or products referred to in the content. |
© 2025 by the authors. Licensee MDPI, Basel, Switzerland. This article is an open access article distributed under the terms and conditions of the Creative Commons Attribution (CC BY) license (https://creativecommons.org/licenses/by/4.0/).