Highlights
What are the main findings?
- Through multi-temporal compositing and cloud detection methods, high-quality cloud-free images are obtained while effectively reducing temporal uncertainty from seasonal harvesting.
- Through Spatial–frequency adaptive fusion design, deep fusion of MSI and SAR data is achieved with full utilization of multi-sensor complementary advantages.
What are the implications of the main findings?
- Provides temporal continuity guarantee for remote sensing monitoring in complex marine environments, overcoming single-temporal imagery limitations.
- Establishes a new multi-modal fusion framework for all-weather high-precision aquaculture area identification.
Abstract
Accurate mapping of marine aquaculture areas is critical for environmental management and sustainable development for marine ecosystem protection and sustainable resource utilization. However, remote sensing imagery based on single-sensor modalities has inherent limitations when extracting aquaculture zones in complex marine environments. To address this challenge, we constructed a multi-modal dataset from five Chinese coastal regions using cloud detection methods and developed Multi-modal Spatial–Frequency Adaptive Fusion Network (MSAFNet) for optical-radar data fusion. MSAFNet employs a dual-path architecture utilizing a Multi-scale Dual-path Feature Module (MDFM) that combines CNN and Transformer capabilities to extract multi-scale features. Additionally, it implements a Dynamic Frequency Domain Adaptive Fusion Module (DFAFM) to achieve deep integration of multi-modal features in both spatial and frequency domains, effectively leveraging the complementary advantages of different sensor data. Results demonstrate that MSAFNet achieves 76.93% mean intersection over union (mIoU), 86.96% mean F1 score (mF1), and 93.26% mean Kappa coefficient (mKappa) in extracting floating raft aquaculture (FRA) and cage aquaculture (CA), significantly outperforming existing methods. Applied to China’s coastal waters, the model generated 2020 nearshore aquaculture distribution maps, demonstrating its generalization capability and practical value in complex marine environments. This approach provides reliable technical support for marine resource management and ecological monitoring.
1. Introduction
China, as one of the world’s largest maritime nations, possesses an extensive coastline spanning diverse climate zones from tropical to temperate regions. With increasing demand for aquatic products, coastal aquaculture operations have continuously expanded, with cage aquaculture and raft aquaculture emerging as predominant marine farming modalities [1,2,3]. Offshore aquaculture is an activity that promotes the reproduction and growth of marine animals and plants through artificial measures. Its rapid development has strongly supported global food security and economic growth in coastal areas [4,5,6]. Expanding marine aquaculture zones may threaten ecosystems, biodiversity, and maritime transportation, making efficient monitoring critical for sustainable resource management. Traditional field surveys cannot meet large-scale, real-time monitoring requirements due to high resource consumption and operational limitations. With advancements in remote sensing technology, satellite-based monitoring approaches have become the primary methods for surveying marine aquaculture areas due to their broad coverage, strong real-time capabilities, and cost-effectiveness [7,8]. Remote sensing technology enables acquisition of multi-modal, multi-temporal, and multi-resolution images of the same region, not only improving monitoring efficiency and accuracy but also addressing challenges of extensive spatial coverage and high-frequency monitoring that traditional ground survey methods cannot achieve.
Furthermore, Deep learning has transformed remote sensing image processing. In contrast to conventional approaches, convolutional neural networks enable automated feature extraction from remote sensing imagery, thereby circumventing the limitations of manual surveys and delivering enhanced feature representation with superior generalization performance. Optical remote sensing images, with their rich spectral information and high spatial resolution, have become the primary data source for marine aquaculture area extraction tasks. Lu et al. [9] enhanced contextual information extraction by introducing an improved ASPP structure and attention mechanism. Cheng et al. [10] optimized the UNet architecture by incorporating hybrid dilated convolution modules, effectively mitigating the gridding effects of conventional dilated convolutions and achieving high accuracy in GF-2 imagery applications. The AF-UNet++ proposed by Xu et al. [11], which integrates CBAM attention modules into the UNet++ architecture, enhanced feature perception capabilities for aquaculture areas and demonstrated good performance in complex scenarios such as blurred boundaries and mixed aquaculture zones.
However, inherent limitations of optical remote sensing imagery, such as susceptibility to weather and illumination conditions, render it unsuitable for all-weather variable environmental conditions. Additionally, optical sensors cannot accurately detect aquaculture facilities positioned below the sea surface, limiting their effectiveness in practical applications. In contrast, Synthetic Aperture Radar (SAR) represents an active microwave remote sensing technology that functions by emitting microwave signals and receiving backscattered signals, offering all-weather and all-time operational capabilities, thereby providing an alternative technical approach for marine aquaculture area extraction. The MDOAU-net proposed by Wang et al. [12] employs a lightweight architecture specifically designed for SAR imagery characteristics, introducing multi-scale feature fusion modules and dilated convolution blocks, demonstrating superior performance in dense aquaculture area segmentation. Zhang et al. [13] proposed a method based on UNet and attention mechanisms to extract marine raft aquaculture areas from multi-temporal synthesized Sentinel-1 imagery. However, backscattered signals from marine aquaculture areas are affected by coherent speckle noise and sea conditions, resulting in complex features and blurred boundaries in SAR images, particularly at lower input resolutions, presenting critical challenges for obtaining accurate segmentation and classification results.
Despite improvements in extraction accuracy and generalization through deep learning methods, approaches limited to single-modal remote sensing imagery are constrained by inherent sensor limitations, hampering refined all-weather monitoring of marine aquaculture areas. With advancements in remote sensing satellites and observation technologies, the integrated utilization of multi-modal remote sensing data is emerging as an increasingly important strategy [14,15,16,17]. Compared to single-modal remote sensing imagery, multi-modal data provides complementary and synergistic information [18,19,20]. Wei et al. [21] designed MGFNet to fuse optical and SAR images for high-resolution semantic segmentation, achieving superior performance compared to single-modal approaches through an MLP-based gated fusion strategy. Zhang et al. [22] developed SDIF to enhance optical-SAR image fusion by incorporating semantic information guidance, achieving improved fusion quality compared to traditional pixel-level fusion methods. Bi et al. [23] developed RingMoE, a unified multi-modal remote sensing foundation model that integrates optical, SAR, and multi-spectral data through hierarchical Mixture-of-Experts architecture, achieving state-of-the-art performance across 23 benchmarks spanning six RS tasks. Liu et al. [24] proposed OSHFNet, a heterogeneous dual-branch network that employs CNNs for local feature extraction from optical images and VMamba for global structural feature extraction from SAR images, demonstrating improved land use classification through dynamic gated fusion mechanisms that adaptively integrate complementary multi-modal information. Wei et al. [25] proposed DDFNet-A for infrared and visible image fusion, decomposing images into low-frequency and high-frequency features to capture modality-commonality and modality-distinctiveness, then fusing them through hybrid attention mechanisms in both spatial and frequency domains.
The fusion of optical and SAR imagery provides substantial compensation for the inherent limitations of each modality, enabling more accurate extraction and refined delineation of marine aquaculture areas. Specifically, multispectral imagery excels in extracting spectral and geometric information that characterizes aquaculture facilities through reflectance properties, enabling discrimination between different materials and precise boundary delineation under clear atmospheric conditions. SAR data, conversely, captures structural and textural information through backscattering mechanisms, providing sensitivity to surface modifications and framework elements that are particularly valuable for detecting installations regardless of weather conditions or water clarity. For marine aquaculture monitoring, this complementary information extraction addresses the inherent variability in facility types and environmental conditions: while optical sensors provide superior spectral discrimination for surface-visible structures, radar sensors ensure detection continuity for partially submerged components and adverse weather scenarios, collectively enabling comprehensive aquaculture area mapping across diverse coastal environments.
Researchers have explored methods to enhance marine aquaculture extraction by combining optical and SAR data. Liu et al. [26] developed an object-oriented approach using Sentinel-2 optical data to generate edge probability feature maps with an improved watershed algorithm, while using Sentinel-1 SAR data primarily for verification and supplementation. Wang et al. [27] developed a random forest-based approach that fused Sentinel-1 and Sentinel-2 information at the feature level by calculating the Marine Aquaculture Index (MAI) and neighborhood difference features. The SRUNet designed by Liu et al. [28] combined Sentinel-2 RGB bands, calculated spectral indices, and Sentinel-1 VV polarization data into a seven-channel input for the model, achieving high-precision extraction of coastal raft aquaculture areas. However, these methods do not fully leverage multi-modal characteristics. While Liu et al. [26] combined Sentinel-1 and Sentinel-2 data, they used optical data for initial extraction and SAR data merely as an auxiliary verification tool, a sequential approach that fails to integrate the complementary advantages of both modalities. The feature engineering method based on traditional machine learning proposed by Wang et al. [27] relies excessively on manual design, limiting its ability to adaptively capture the unique properties of different modal data. Although the deep learning method proposed by Liu et al. [28] demonstrates stronger feature extraction capabilities, its model structure processes the feature extraction of both modalities uniformly, neglecting the fundamental imaging differences between optical and SAR sensors.
To overcome these limitations, Recent research focuses on deep learning-based multi-modal fusion. Yu et al. proposed MSARG-Net [29] and CMFPNet [30] for optical-SAR fusion, achieving collaborative modeling and improved boundary segmentation in dense aquaculture areas. However, the complex feature extraction and attention modules introduced by these methods often lead to substantial increases in model parameters and computational complexity, necessitating consideration of how to balance performance improvement with parameter efficiency and computational overhead.
Addressing these challenges, we constructed a multi-modal dataset based on Sentinel-1A (SAR) and Sentinel-2A (MSI) remote sensing imagery and designed a Multi-modal Spatial–Frequency Adaptive Fusion Network (MSAFNet) to achieve precise extraction of marine aquaculture areas. This model comprehensively considers the imaging mechanism differences between optical and SAR sensors, achieving deep fusion of multi-modal data through specially designed feature extraction and fusion modules, optimizing the trade-off between model expressiveness and computational complexity while balancing performance and efficiency. Experimental results demonstrate that, compared to existing marine aquaculture area extraction methods, MSAFNet enhances feature representation capabilities in complex marine environments by synergistically utilizing the complementary advantages of MSI and SAR imagery, achieving more accurate extraction of marine aquaculture areas. The primary contributions of this study are as follows:
- We developed a pixel-level multi-modal dataset integrating Sentinel-1 SAR and Sentinel-2 MSI data from five representative Chinese coastal regions, encompassing floating raft aquaculture (FRA) and cage aquaculture (CA) with detailed pixel-level annotations to establish a baseline for multi-modal marine aquaculture extraction.
- We proposed a multi-dimensional cloud detection methodology that integrates Sentinel-2 QA60 quality bands and Cloud Probability data with multi-temporal mean compositing techniques, effectively mitigating interference from varying harvest cycles on data consistency while addressing limitations of single-temporal imagery susceptible to cloud obstruction, thereby enhancing spatiotemporal continuity and data reliability for aquaculture monitoring.
- We designed the Multi-modal Spatial–Frequency Adaptive Fusion Network (MSAFNet), a computationally efficient multi-modal fusion architecture that enhances aquaculture extraction accuracy in complex marine environments through multi-scale feature extraction and frequency-domain adaptive fusion mechanisms, enabling precise all-weather aquaculture area identification while maintaining computational efficiency.
- We developed Multi-scale Dual-path Feature Module (MDFM) and Dynamic Frequency-domain Adaptive Fusion Module (DFAFM) architectures that integrate CNN and Transformer capabilities to enhance multi-modal feature representation, addressing limitations inherent in single-modal approaches within complex marine environments.
2. Materials and Methods
2.1. Study Area
To investigate the spatial distribution characteristics and extraction methods of raft and cage marine aquaculture areas in complex marine environments, this study selected five representative marine aquaculture areas along China’s eastern coast as research samples. These regions are distributed sequentially from north to south, encompassing diverse marine hydrological conditions and aquaculture models, exhibiting strong representativeness.
The waters of Changhai County in Liaoning Province are located in the southeastern part of the Liaodong Peninsula, with a longitude and latitude range of 122°13′–123°17′E, 38°55′–39°18′N. This region primarily develops kelp and scallop raft aquaculture as well as flatfish cage aquaculture. Rongcheng Bay waters in Shandong Province are located at the easternmost tip of the Shandong Peninsula, with a longitude and latitude range of 122°46′–122°71′E, 36°90′–37°40′N. This region primarily develops kelp and scallop raft aquaculture and large-scale deep-water cage aquaculture. Haizhou Bay waters in Jiangsu Province are located in the eastern part of Lianyungang City, with a longitude and latitude range of 119°22′–119°59′E, 34°75′–35°07′N. This region primarily develops shellfish and algae raft aquaculture as well as yellow croaker and sea bass cage aquaculture. Sansha Bay waters in Fujian Province are located in the eastern part of Ningde City, with a longitude and latitude range of 119°40′–119°55′E, 26°30′–26°45′N. This region primarily develops oyster and laver raft aquaculture as well as large yellow croaker and grouper cage aquaculture. Qinzhou Port waters in Guangxi are located in the southern part of Qinzhou City, Guangxi Zhuang Autonomous Region, with a longitude and latitude range of 108°30′–108°45′E, 21°25′–21°45′N. This region primarily develops pearl oyster and oyster raft aquaculture as well as grouper and golden pomfret cage aquaculture.
Both raft and cage aquaculture systems are deployed in seawater, with structures primarily floating on the water surface. In raft aquaculture, aquatic organisms grow on floating structures made of bamboo, wood, or plastic materials; while cage aquaculture suspends net cages on floating frames, suitable for various fish species cultivation. In multispectral images, aquaculture areas appear as regular dark blocks; in SAR images, they appear as regular grayscale structures. Marine aquaculture areas from various regions included in the dataset are shown in Figure 1, providing the foundation for aquaculture area monitoring based on remote sensing technology.
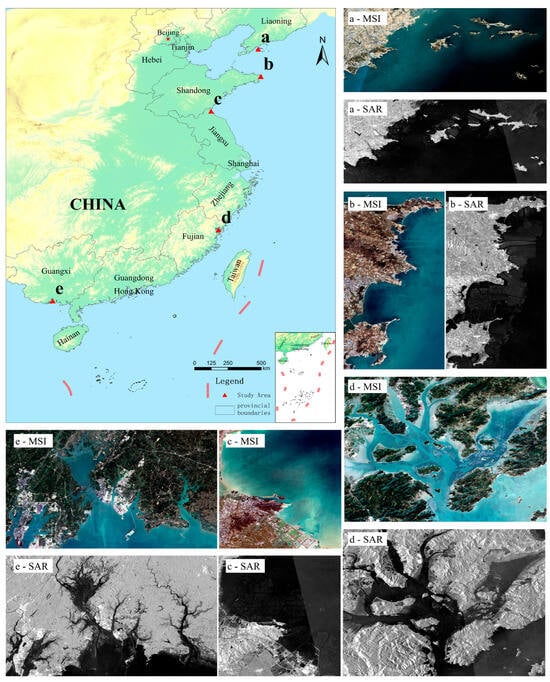
Figure 1.
Overview of the study areas. (a) Changhai County, Liaoning Province; (b) Rongcheng Bay, Shandong Province; (c) Haizhou Bay, Jiangsu Province; (d) Sansha Bay, Fujian Province; and (e) Qinzhou Port, Guangxi. For each region, representative Sentinel-2 MSI RGB composite images and Sentinel-1 SAR VV polarization images are displayed, illustrating the characteristic appearances of floating raft aquaculture (FRA) and cage aquaculture (CA) in both optical and radar imagery.
2.2. Multi-Modal Dataset and Data Processing Strategies
Google Earth Engine (GEE) is a geospatial processing platform that integrates multi-source remote sensing data with cloud computing capabilities. Its parallel computing architecture enables researchers to efficiently process and analyze large-scale Earth observation data, providing practical tools for surface monitoring research from regional to global scales. To fully consider the complementary characteristics of different sensors, we utilized Sentinel-1 and Sentinel-2 imagery from the GEE database as primary data sources, conducting data preprocessing and feature index calculations within the platform. The Sentinel-1 satellite carries a C-band Synthetic Aperture Radar (SAR), offering all-weather, all-time imaging capabilities with multiple polarization modes, including VV and VH. It can penetrate cloud layers to acquire surface information under complex meteorological conditions, with a revisit period of 6 days and a spatial resolution of 10 m. The Sentinel-2 satellite is equipped with a Multi-Spectral Instrument (MSI), providing optical imagery across 13 bands (wavelength range 440–2200 nm), with a revisit period of 5 days and spatial resolutions varying from 10, 20, to 60 m, capable of providing rich surface spectral and textural features [31].
We selected five representative marine aquaculture areas along China’s coast from the GEE platform (https://developers.google.com/earth-engine/, accessed from September 2020 to May 2021) as study regions. To ensure data quality and authentically reflect regional marine aquaculture conditions, we selected Sentinel-2 L2A level imagery with cloud coverage below 15% during the growing season from September 2020 to May 2021 to construct the dataset. These L2A-level images have undergone atmospheric correction processing, possessing relatively high data quality. To further enhance data quality, the study utilized multi-dimensional cloud detection by combining the QA60 quality band with Cloud Probability data from the Sentinel-2 MSI Level-2A data product. The QA60 quality band provides detailed cloud mask information, while the Cloud Probability band provides pixel cloud probability values from 0 to 100, with higher values indicating a greater likelihood of cloud coverage for that pixel [32]. This study set the Cloud Probability threshold at 30, meaning pixels with cloud probability exceeding 30% were classified as cloud pixels. As shown in Figure 2, utilizing this multi-dimensional cloud detection method enables more accurate identification and removal of cloud-covered regions, significantly improving the quality and reliability of surface observation data, acquiring large-scale cloud-free images, while simultaneously obtaining Sentinel-1 (SAR) GRD images of the same regions, serving as a multi-modal remote sensing image dataset for network training.
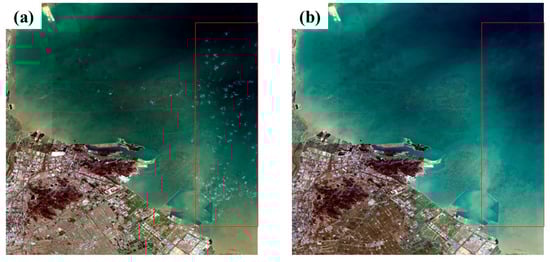
Figure 2.
Cloud detection using QA60 quality band alone (a) compared with combined QA60 quality band and Cloud Probability data (b).
Marine aquaculture shows seasonal patterns with varying harvest cycles. Single-temporal images may capture mixed operational and harvested areas, limiting accurate distribution assessment. Additionally, cloud coverage and atmospheric interference significantly affect the quality and availability of optical imagery. To mitigate these effects, we employed mean compositing of multi-temporal images from the growing season, with effectiveness demonstrated in the test area in Figure 3. The comparison results clearly indicate that single-temporal imagery may omit substantial numbers of still-operational aquaculture areas. Under the premise of relatively stable aquaculture area layouts, mean compositing not only reduces cloud effects but also integrates aquaculture information from different periods, reducing uncertainty caused by harvest timing differences, enhancing the reliability of observational data, and more accurately reflecting the actual state of aquaculture activities in the region.
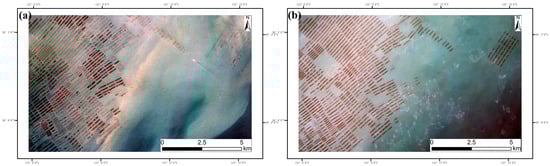
Figure 3.
Comparison between single-temporal image (a) and mean-composited image (b).
To fully utilize remote sensing image information while reducing spectral information redundancy, this study constructed a multi-modal dataset containing 7 bands. This dataset integrates optical and radar information, including visible light bands (R, G, B), which directly reflect surface information and are widely applied in feature identification. To enhance feature differences between various objects within the study area, we calculated and incorporated two commonly used normalized indices: Normalized Difference Water Index (NDWI) [33] and Normalized Difference Vegetation Index (NDVI) [34]. NDWI is a classic remote sensing water index, effectively extracting water body information from imagery, while NDVI highlights features of vegetation-covered areas. Additionally, we introduced a custom composite index (Index) [35] that further enhances spectral differences between target objects and backgrounds in the study area through specific band combinations. The formulas for calculating each feature index are presented in Equations (1)–(3). Finally, we integrated VV polarization data from SAR imagery, an active microwave remote sensing technology providing all-weather observation capabilities. For marine aquaculture areas, SAR primarily functions by capturing water surface roughness changes and wave interference patterns caused by aquaculture facilities. Raft aquaculture appears as regularly arranged high-scattering areas in SAR imagery, while the floating frame systems of cage aquaculture similarly form characteristic scattering patterns. Although SAR cannot directly observe deep underwater structures, surface feature changes caused by aquaculture activities provide effective identification information, especially under cloudy and rainy conditions where optical remote sensing is limited [13,36,37].
where R represents the red band in the Sentinel2 MSI image, G represents the green band in the image, and NIR represents the near-infrared band in the image. These spectral indices can be calculated directly in the GEE platform and can be added to the original image bands.
Ultimately, the constructed multi-modal remote sensing image dataset includes 7 bands of data: R, G, B, NDWI, NDVI, Index, and VV polarization, with data samples from typical regions shown in Figure 4. The original multi-modal image data underwent pixel-level annotation by experienced interpretation experts, categorizing annotations into FRA, CA, and background regions, generating corresponding original multi-modal images and annotation images. Subsequently, a sliding window cropping method was employed to crop samples and label images for each region (with a stride of 128 pixels and an overlap rate of 0.075), generating a total of 2342 pairs of 256 × 256 pixel images and label blocks. These were divided into training, validation, and testing sets in a 6:2:2 ratio. To prevent overfitting and other issues during training, data augmentation techniques such as horizontal flipping, vertical flipping, and diagonal mirroring were applied to the training set. This ultimately yielded 5624 image pairs for training, 468 image pairs for model validation, and 468 image pairs for model testing.
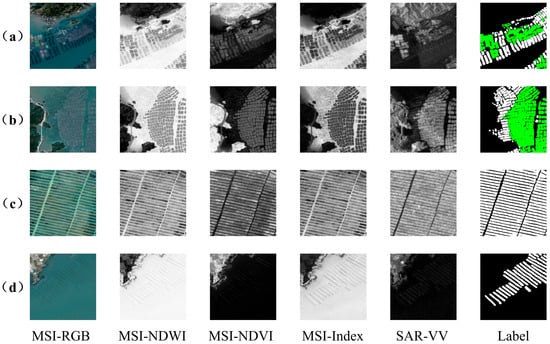
Figure 4.
Sample images from the constructed multi-modal remote sensing dataset, (a–d) represent samples from different regions.
This multi-modal configuration effectively addresses the distinct detection challenges of FRA and CA through complementary information extraction mechanisms. For FRA detection, MSI spectral and geometric characteristics facilitate material discrimination and precise boundary delineation of surface-visible raft structures, while derived spectral indices enhance feature differentiation between aquaculture facilities and surrounding water bodies. For CA identification, multi-modal data fusion proves particularly valuable as MSI provides visible framework geometry while SAR backscattering signatures enable detection of metallic cage structures and partially submerged installations that exhibit limited optical contrast, thereby ensuring robust detection performance across heterogeneous environmental conditions in coastal marine environments.
2.3. Method
2.3.1. Overall MSAFNet Architecture
The Multi-modal Spatial–Frequency Adaptive Fusion Network (MSAFNet) proposed in this study aims to integrate MSI and SAR multi-modal remote sensing data for marine aquaculture extraction, with the network structure shown in Figure 5. MSAFNet uses an encoder-decoder architecture with separate MSI and SAR processing branches. The shallow network employs a lightweight stacked Inverted Residual Block (IRB) [38] structure for feature extraction, effectively capturing local texture and edge information. In the deep feature extraction stage, to effectively process target features at different scales and morphologies in remote sensing images, the model introduces a Multi-scale Dual-path Feature Module (MDFM), which achieves collaborative modeling of local details and global context through parallel CNN and Transformer branches, effectively enhancing feature representation capabilities for aquaculture areas of different scales. In the feature fusion stage, we designed a Dynamic Frequency-domain Adaptive Fusion Module (DFAFM), which achieves deep integration of MSI and SAR data in both spatial and frequency domains through three stages: initial feature interaction, deep semantic fusion, and adaptive feature optimization. DFAFM not only achieves selective enhancement of features through spatial attention mechanisms but also enhances complementary feature expression between modalities through frequency domain processing and dynamic weight adjustment mechanisms, thereby achieving deep multi-modal information interaction while preserving significant features. The decoder integrates these multi-scale extracted and multi-modal fused features through gradual upsampling, ultimately achieving refined segmentation and localization of aquaculture areas.
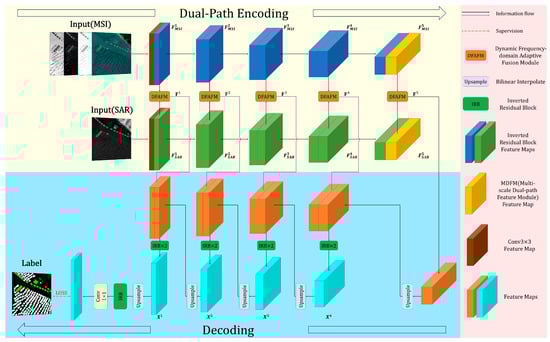
Figure 5.
Architecture of the MSAFNet model. The yellow sections represent the dual-path encoder for MSI and SAR feature extraction, the blue sections represent the decoder with progressive upsampling.
2.3.2. Multi-Scale Dual-Path Feature Module
Remote sensing images present multi-scale target features across different positions, with aquaculture facility arrangements exhibiting significant spatial correlation and semantic consistency [39,40,41], requiring models to capture both local details and global context. Traditional CNNs excel at local feature extraction but are limited by local receptive fields for modeling long-distance dependencies [42,43]. Transformers can establish associations between arbitrary positions through self-attention mechanisms to achieve global perception [44], but their computational complexity increases quadratically with sequence length and requires large-scale training data [43]. Recent research has proposed hybrid architectures combining CNNs and Transformers, aiming to merge CNN’s efficient local feature extraction with Transformer’s powerful global modeling capabilities [45,46,47]. These methods have made significant progress in remote sensing image analysis tasks, but still have room for improvement when processing targets like marine aquaculture areas with complex spatial distribution features and multi-scale variations.
To effectively address this challenge, we designed the Multi-scale Dual-path Feature Module (MDFM), combining CNN and Transformer advantages through parallel processing branches for efficient multi-scale feature extraction. The module structure is shown in Figure 6. The MDFM architecture contains three core components: a local feature extraction branch, a global feature processing branch, and a feature fusion mechanism. In the local feature extraction branch, multi-scale feature extraction is performed using depth-separable convolutions with different kernel sizes [48], and different scale features are dynamically weighted through an adaptive attention layer. In the global feature processing branch, multi-head attention mechanisms are employed to capture long-range dependencies, and learnable temperature scaling factors are introduced to modulate the distribution sensitivity of attention scores. Simultaneously, to better model spatial position relationships, the module introduces relative position encoding mechanisms [49], enhancing position awareness capabilities by establishing relative position bias tables for each spatial position pair. Finally, features from both branches are fused through convolutional layers, effectively combining local detail features and global contextual information. This enables the module to more accurately understand and identify aquaculture area features at different scales, enhancing feature expression capabilities in complex and variable marine aquaculture environments, improving identification accuracy and robustness, and demonstrating excellent adaptability, particularly when processing aquaculture areas of different scales and densities.
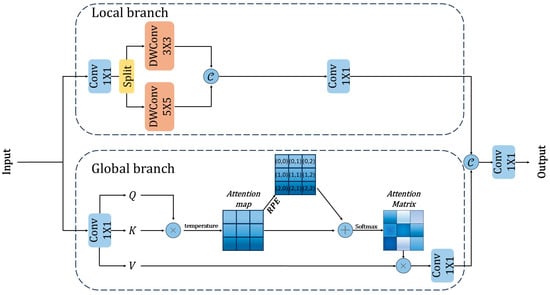
Figure 6.
Structural diagram of the MDFM. The upper dashed box indicates the local branch processing, the lower dashed box shows the global branch processing, circular nodes represent element-wise operations, and arrows indicate the direction of feature flow and concatenation operations.
The MDFM architecture processes input features , through dual branches for comprehensive feature enhancement. In the local branch, input features undergo channel expansion via a 1 × 1 convolution, then split into two equal parts that are processed by 3 × 3 and 5 × 5 depthwise separable convolutions to capture multi-scale local information. The channel expansion and separation workflow is shown in Equations (4)–(7):
where represents the input feature map, denotes channel-expanded features, represents a convolution operation with kernel size 1 × 1, denotes the feature separation operation, and represents a depthwise separable convolution operation with kernel size n × n.
Subsequently, an attention mechanism adaptively fuses multi-scale features through dynamic weighting. The weighted features are concatenated along the channel dimension and reduced through a 1 × 1 convolution to produce the final local feature output . This adaptive weighting and feature fusion mechanism effectively enhances local feature representation by leveraging the complementary nature of different receptive fields to capture richer local structural information. This local feature fusion process is represented by Equation (8):
where represents the attention weight vector, denotes element-wise multiplication, and indicates concatenation along the channel dimension.
Concurrently, in the global feature modeling branch, we designed a feature extraction scheme based on an improved self-attention mechanism. The input features are processed through 1 × 1 convolutions to generate query, key, and value representations, with a temperature parameter introduced as a learnable scaling factor to optimize attention weight distribution. A relative positional encoding mechanism then constructs learnable relative position encoding tables and position index matrices, integrating spatial position information with attention features. Multi-head attention-weighted features are aggregated and reorganized through tensor rearrangement into the structure required by the multi-head attention mechanism, ensuring each attention head can efficiently compute features independently. A 1 × 1 convolution further fuses and optimizes feature interactions between channels, producing output features with global receptive fields. The complete global feature extraction process is shown in Equations (9) and (10):
where represents the decomposition of the feature map into three parts through convolution operations, representing Query, Key, and Value, each with the same number of channels. denotes the learnable temperature parameter, and represents the relative position bias.
Finally, in the feature fusion optimization branch, captured local detail features and global semantic information are effectively integrated through feature concatenation and convolutional transformation, yielding a unified representation of complementary features . This fusion process is represented by Equation (11):
The MDFM module processes multi-level features, fully exploiting the complementarity between local details and global semantic information. By learning optimal relationships between features of different scales and levels, it enhances the expressive capability for various characteristics of marine aquaculture areas, thereby improving the model’s recognition accuracy for aquaculture regions of different scales and densities.
2.3.3. Dynamic Frequency-Domain Adaptive Fusion Module
In the field of remote sensing image analysis, MSI and SAR data provide complementary information: MSI offers spectral, color, and boundary details while SAR provides unique texture and structural features through all-weather imaging capabilities [50,51]. Existing methods are largely limited to simple feature concatenation or weighted fusion in the spatial domain, failing to fully utilize structured feature information embedded in the frequency domain. Although attention mechanisms provide new ideas for selective fusion of multi-modal features [52,53,54], traditional attention mechanisms employing global average pooling or global maximum pooling operations suppress feature diversity, while frequency domain feature extraction not only contains low-frequency information equivalent to GAP but also provides more comprehensive mid-frequency and high-frequency components [55,56,57], which is significant for maintaining feature integrity and enhancing model discriminative capability. Li et al. [58] further demonstrated that independently optimizing high-frequency and low-frequency components can significantly improve boundary delineation and contextual modeling in remote sensing image segmentation.
To more comprehensively and efficiently fuse multi-modal feature information, we propose the Dynamic Frequency-domain Adaptive Fusion Module (DFAFM). This module achieves deep integration of MSI and SAR data through three stages: initial feature interaction, deep semantic fusion, and adaptive feature optimization, with the module structure shown in Figure 7. First, preliminary integration of information from different modalities is achieved through feature transformation, ensuring that basic information is not lost while providing multi-level feature support for subsequent modules. Next, convolution operations are specifically designed for MSI and SAR data to enhance the detailed expression capabilities within modalities and exploit unique information from each modality, better capturing intra-modal texture and structural information. Then, enhanced feature maps from different modalities undergo preliminary integration, utilizing spatial attention mechanisms to adaptively adjust feature importance at different positions, enhancing feature alignment and fusion between modalities. In the multi-modal frequency domain modeling stage, features are mapped to the frequency domain through Fast Fourier Transform (FFT) [59,60], and different frequency components undergo adaptive filtering and enhancement using input-dependent learnable weight matrices that automatically adjust based on scene-specific characteristics. Combined with frequency domain position encoding, this achieves effective feature perception and transformation through adaptive weight adjustment mechanisms that respond to varying aquaculture configurations, achieving deep multi-modal information interaction while preserving significant features, providing richer feature expression for target area segmentation. Finally, frequency domain features are mapped back to the spatial domain through inverse transformation, recalibrated using channel attention mechanisms to highlight the semantic expression of key areas, and strengthen key feature expression capabilities through residual connections with initial features. This multi-level fusion strategy not only fully exploits the complementary advantages of both modality data but also adaptively enhances task-relevant significant features while suppressing interference from irrelevant information, thereby effectively improving the precision of aquaculture area segmentation and boundary localization capabilities.
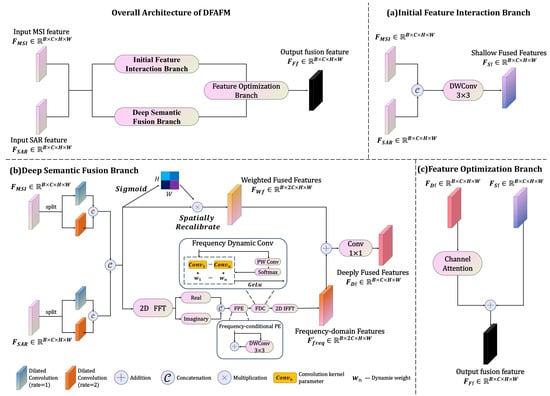
Figure 7.
Structural diagram of the DFAFM. The sections labeled (a–c) represent the three processing stages, rectangular blocks with different colors indicate various operations, and connecting lines show the feature flow between different processing components.
In the DFAFM module, input features and undergo shallow fusion through 3 × 3 depthwise separable convolutions, yielding shallow-fused features . This shallow fusion effectively preserves the original information of input features, providing multi-level feature support for subsequent modules. This fusion process is represented by Equation (12):
where represents depthwise separable convolution with a 3 × 3 kernel, and denotes feature concatenation along the channel dimension.
Additionally, for features from different modalities, input features and are each divided along the channel dimension into two branches. These are processed through convolution layers with dilation rates of 1 and 2 and kernel sizes of 3 × 3, extracting features under different receptive fields to generate enhanced features . The enhanced features are concatenated along the channel dimension to form preliminary fused features . To further optimize feature expression, a spatial attention mechanism generates a weight map , resulting in weighted fusion features after weighting. This multi-stage feature processing strategy effectively enhances the model’s ability to express intra-modal detail features and enables selective enhancement through adaptive weight adjustment. This process is represented by Equations (13)–(16):
where represents convolution with dilation rate i, represents the -th feature obtained by evenly dividing features along the channel dimension, indicates element-wise multiplication, and represents learnable spatial attention weights.
On the other hand, a frequency domain processing branch is introduced, mapping features from spatial to frequency domain through two-dimensional Fast Fourier Transform to obtain . For finer adjustment of frequency domain features, they are divided into real and imaginary parts and processed separately, enhancing amplitude information and spatial structure features. In frequency domain processing, we implement a positional encoding mechanism through 3 × 3 depthwise separable convolution layers, introducing explicit position information to enhance structural representation capability. This enables more precise capture of spatiotemporal-frequency associations between modalities. Through dynamically generated weight matrices, frequency domain features undergo adaptive adjustment, achieving selective optimization of different frequency components to highlight important frequency features while effectively suppressing redundant information. The optimized frequency domain features are remapped to the spatial domain through Inverse Fast Fourier Transform (IFFT), yielding enhanced feature representations . This frequency domain feature processing is represented by Equations (17) and (18):
where and represent two-dimensional Fourier transform and inverse transform operations, respectively. represents dynamically generated frequency domain feature enhancement weights. represents the grouped convolution operation for the i-th group, where superscript indicates the -th convolution branch and subscript indicates grouped convolution processing. denotes the summation from group 1 to group , where . represents frequency domain position encoding. represents batch normalization. and represent the real and imaginary parts of frequency domain features, respectively.
Finally, frequency domain features and spatial features are added together and linearly transformed through a 1 × 1 convolution layer, reconstructing the feature space and aggregating information to obtain deeply fused features . Subsequently, a channel attention mechanism dynamically adjusts weights of different channels, enabling the network to adaptively highlight discriminative features. The adjusted features undergo residual connection with shallow fusion features, a design that both alleviates the vanishing gradient problem in deep networks and preserves important low-level information from original features, enhancing multi-scale feature representation. This produces the final fused feature representation , which is fed into the network’s decoder. This process is represented by Equations (19) and (20):
where represents the channel attention mechanism.
Based on the above description, DFAFM effectively utilizes complementary features of MSI and SAR modal data by combining spatial and frequency domain feature processing with inter-modal dynamic weight adjustment mechanisms. This significantly improves boundary localization accuracy and detail preservation capability in aquaculture area segmentation.
3. Results
3.1. Experimental Setups
To validate the efficacy of the proposed multi-modal feature learning approach for coastal marine aquaculture extraction in China, all experiments were conducted under uniform software and hardware configurations to ensure equitable comparison. All experiments were performed on a server with NVIDIA GeForce RTX 2080Ti 11 GB GPU. All models were implemented using the PyTorch 1.10.2 framework, with SGD optimizer, batch size of 4, initial learning rate of 0.01, and 80 iterations. The experimental details are shown in Table 1. The loss function used for all models was a combination of equally weighted binary cross-entropy [61] and Dice coefficient loss [62], with SoftMax serving as the classifier. The specific expression of the loss function is presented in Equation (21):
where is the CrossEntropy Loss function, and is the Dice Loss function.

Table 1.
Experimental Details.
3.2. Evaluation Metrics
To quantitatively evaluate the performance of the proposed MSAFNet in multi-modal remote sensing data for aculture area extraction tasks and conduct fair comparisons with other methods, this study selected three commonly used comprehensive evaluation metrics: F1 score (F1), Intersection over Union (IoU), and Kappa coefficient (Kappa), to reasonably assess and analyze aquaculture area extraction results. These metrics are calculated as follows:
where , , , and denote the number of true positives, the number of false positives, the number of true negatives, and the number of false negatives, respectively, and n is the category index.
3.3. Comparative Experiments
For a comprehensive evaluation, this paper compares the experimental results of MSAFNet with several common methods. Among the comparison methods, we selected single-branch design networks, including ResNet [63], DeepLabV3+ (DLV3+) [64], SwinUnet [65], TransUnet [66], Swin Transformer (SwinT) [49], and SRUnet [28]. Since these methods were originally designed for single-modal semantic segmentation tasks, we modified the input section of each method to fuse multi-modal data and altered their first layers to enable the networks to receive multi-channel data, integrating information from different modalities. We also selected the recently developed multi-modal method CMFPNet [30], which has demonstrated excellent performance in marine aquaculture area extraction tasks, for comparison. The experimental comparison results of various methods on the multi-modal remote sensing image dataset are shown in Table 2.
Table 2.
Extraction results and computational complexity of different models.
As shown in Table 2, our proposed MSAFNet outperforms all comparison methods across all evaluation metrics. Specifically, for FRA, MSAFNet achieved 78.22% IoU, 87.78% F1 score, and 87.25% Kappa coefficient. In the more challenging CA extraction task, MSAFNet obtained 75.64% IoU, 86.13% F1 score, and 99.26% Kappa coefficient, significantly outperforming other methods. Furthermore, we observed that Transformer-based methods (such as TransUnet and SwinT) generally outperform purely CNN-based architectures (such as ResNet and DLV3+), confirming the effectiveness of self-attention mechanisms in capturing long-range dependencies, which is crucial for distinguishing aquaculture structures from surrounding environments. Our MSAFNet strategically integrates multi-modal features through multi-modal multi-scale frequency domain adaptive fusion modules, achieving an optimal balance between local detailed feature extraction and global context modeling. Statistical significance testing via McNemar’s test confirms that these performance improvements are significant (p < 0.001 for all comparisons, see Appendix A).
Further analysis of computational efficiency and performance trade-offs across models reveals that MSAFNet achieves efficient utilization of computational resources while maintaining high accuracy, demonstrating an excellent performance-efficiency balance. From a computational resource utilization perspective, single-branch networks such as DLV3+ and ResNet series, despite their relatively concise architectures, exhibit significantly lower performance-to-computational efficiency ratios compared to MSAFNet. Results indicate that DLV3+ (R101) achieves only 70.28% mIoU with 59.35 M parameters, while MSAFNet achieves 76.93% mIoU with just 24.10 M parameters, significantly improving performance while substantially reducing parameter count. Although models such as SwinUnet and SRUnet possess lower parameter counts and computational complexity, they demonstrate obvious performance limitations in marine aquaculture area extraction tasks, indicating that overly simplified model structures struggle to capture the rich feature information of complex marine aquaculture areas.
Compared to TransUnet, the closest performing model, MSAFNet reduces parameter count from 93.23 M to 24.10 M and FLOPs from 64.50 G to 20.70 G, demonstrating that our network structure achieves an excellent balance between parameter count and performance. Although CMFPNet has a slightly lower parameter count, MSAFNet improves average IoU by 3.67% while maintaining comparable computational overhead.
MSAFNet achieves efficient control of parameter count and computational complexity by employing a lightweight IRB module stacking structure combined with a multi-modal multi-scale design. In the multi-scale feature extraction and fusion stages, the model utilizes depth-separable convolutions to replace standard convolution operations, along with efficient feature fusion implemented through FFT in frequency domain processing, effectively avoiding redundant calculations. This enables MSAFNet to achieve excellent feature extraction and fusion capabilities while maintaining low computational overhead.
To provide more intuitive comparisons, Figure 8 visualizes extraction results from different methods in typical regions. In the visualization results, although most methods can roughly identify aquaculture area locations, significant differences exist in boundary accuracy and detail preservation. In dense aquaculture areas (such as scenes a, c, e, and g), existing methods frequently exhibit adhesion phenomena, incorrectly merging adjacent aquaculture facilities. In contrast, MSAFNet produces more accurate boundaries, clearly separating individual facilities, demonstrating its superior ability to capture fine structural details. In areas with mixed raft aquaculture and cage aquaculture (scenes b and f), several comparison methods display obvious misclassifications, with cage aquaculture areas frequently confused with raft aquaculture areas and vice versa. Our MSAFNet can accurately distinguish between these two types of aquaculture areas, benefiting from effective multi-modal feature fusion that fully utilizes the complementary information from MSI and SAR modalities. For small aquaculture facilities (scenes d and h), many baseline methods exhibit false negatives (omitting small areas) or false positives (misclassifying backgrounds as aquaculture). MSAFNet demonstrates significant robustness in detecting these challenging small targets, attributed to its multi-scale design that preserves information from different feature levels.
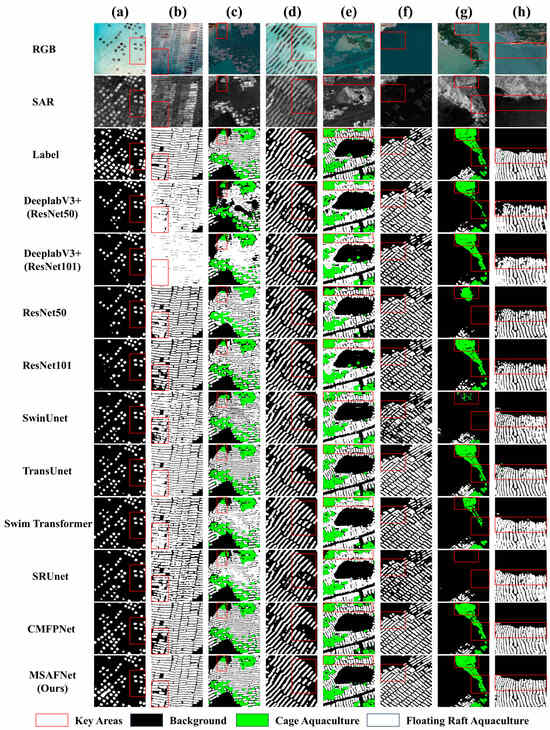
Figure 8.
Visual comparison of extraction results from different network models, (a–h) represent samples from different regions.
Overall, Quantitative and qualitative results show that MSAFNet outperforms existing methods by effectively fusing MSI and SAR complementary features. The proposed method shows improved segmentation in dense clusters, mixed facility zones, and small-scale targets.
3.4. Ablation Experiments
We designed comprehensive ablation experiments to systematically evaluate key components of our proposed model. Starting with a baseline network without MDFM and DFAFM, we progressively added these modules to quantify their contributions to overall performance. As shown in Table 3, experimental results indicate that each module’s introduction significantly enhances the network’s feature extraction and classification capabilities. Specifically, when the MDFM module was integrated into the baseline model, the network demonstrated clear advantages in capturing multi-scale features, substantially improving recognition accuracy for both FRA and CA. In quantitative metrics, for FRA regions, IoU increased from 76.94% to 78.12%, and F1 from 86.97% to 87.82%; for CA regions, IoU increased from 67.01% to 72.85%, and F1 from 80.25% to 84.29%. On average, IoU improved by 3.51%, F1 score by 2.40%, and Kappa coefficient by 0.46%. This improvement clearly demonstrates that MDFM effectively achieves collaborative modeling of local details and global semantics through parallel CNN and Transformer branches, enhancing the model’s understanding of aquaculture areas at different scales.
Table 3.
Results obtained in ablation experiments concerning the different blocks contained in MSAFNet.
Adding DFAFM to complete MSAFNet further improved performance, with CA regions showing 2.79% IoU and 1.84% F1 gains through spatial–frequency domain fusion and dynamic weight adjustment. Notably, although introducing these two modules increased model parameters from 13.824 M to 24.104 M, through carefully designed lightweight structures such as parallel feature extraction and dynamic frequency domain processing mechanisms, computational complexity growth was effectively controlled, with FLOPs slightly decreasing from 20.778 G to 20.695 G. This improvement in computational efficiency is mainly attributed to depth-separable convolutions replacing standard convolution operations in the modules, as well as efficient feature fusion implemented through FFT in frequency domain processing, effectively avoiding redundant calculations while maintaining model performance and optimizing computational resource utilization.
To more intuitively understand the functional mechanisms of each module, we employed GradCAM [67] to visually analyze the decision-making processes of models at different stages. As shown in Figure 9, visualization results indicate that while the baseline model possesses basic area recognition capabilities, it exhibits obvious deficiencies in refined feature expression. When MDFM was introduced, benefiting from its multi-scale feature modeling capabilities, the model demonstrated significant improvements in boundary delineation and structural feature extraction of aquaculture areas, particularly evident in densely distributed aquaculture areas. Especially when processing targets of different scales, attention maps clearly demonstrated the model’s ability to simultaneously focus on local details and global contextual information. Finally, in the complete MSAFNet, the introduction of DFAFM further enhanced the model’s discriminative capabilities. Through multi-modal feature deep fusion achieved via frequency domain attention mechanisms, the model could more accurately capture the essential features of aquaculture areas, reflected in more precise boundary localization and stronger intra-class consistency.
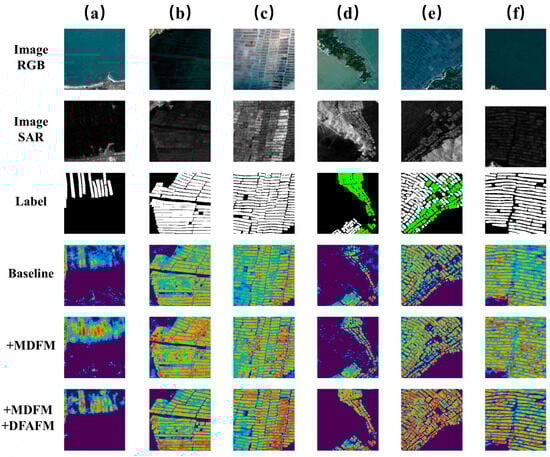
Figure 9.
Visual comparison of ablation experiment results. The color gradient from blue to red indicates increasing network attention to the region. In the heatmaps (bottom three rows), brighter areas represent regions with greater influence on the model’s decision-making process, (a–f) represent samples from different regions.
In summary, ablation experiments verified the effectiveness of each module and, more importantly, revealed their functional mechanisms in enhancing model performance. Experimental results demonstrate that design concepts based on multi-scale feature extraction and multi-modal deep fusion enable MSAFNet to achieve more precise and reliable aquaculture area recognition in complex marine environments, providing new detection solutions for remote sensing monitoring of marine aquaculture areas.
To validate the necessity of DFAFM’s multi-branch architecture, we conducted additional ablation experiments examining different branch combinations. As shown in Table 4, the experimental results demonstrate the effectiveness of the coordinated multi-branch design through systematic component analysis. When implementing only the initial feature interaction branch, the mean IoU reached 70.31%, while the deep semantic fusion branch alone achieved 75.11%. The complete tri-branch integration ultimately attained 76.93% mean IoU, revealing the complementary nature of each processing pathway. This architectural design addresses inherent challenges in heterogeneous multi-modal integration: the initial interaction branch establishes fundamental cross-modal correspondences to prevent information loss during early fusion stages, the deep semantic branch leverages frequency domain processing to capture spectral–structural complementarity that cannot be achieved through spatial operations alone, and the adaptive optimization branch employs dynamic weighting mechanisms to selectively enhance task-relevant features while suppressing interference. The progressive performance improvement across different branch combinations confirms that effective multi-modal fusion requires the coordinated operation of specialized processing mechanisms, each addressing distinct aspects of the complex feature integration challenge rather than relying on simplified single-pathway architectures.
Table 4.
Ablation study results for different DFAFM branch combinations.
4. Discussion
4.1. Impact of Combining Different Spectral Bands
When constructing the multi-modal remote sensing image dataset for MSAFNet training, we selected Sentinel-2’s visible light bands (R, G, B), water indices (NDWI, NDVI), a custom composite index (Index), and Sentinel-1’s VV polarization data as core input features. To verify the impact of band selection and combination strategies on model performance, this study designed four comparative experiments to systematically evaluate the effects of different band combinations on marine aquaculture area extraction accuracy. As shown in Table 5, Group 1 serves as the baseline combination, using only the three RGB bands and SAR-VV polarization data; Group 2 adds the NDWI water index based on Group 1; Group 3 further integrates the NDVI vegetation index; Group 4 adopts a comprehensive configuration of all bands and indices. Table 5 details the extraction accuracy in each experimental group, along with comprehensive evaluation metrics.
Table 5.
Results from combining different spectral band data.
Results show a clear performance improvement with the progressive addition of spectral information. The inclusion of the NDWI water index in Group 2 improved performance over the baseline, while adding the NDVI vegetation index in Group 3 further enhanced detection capabilities across both aquaculture types. The complete set of bands and indices in Group 4 achieved the highest performance with an average IoU of 76.93% and an F1 score of 86.96%. This performance improvement primarily stems from the differential enhancement effects of various spectral indices on different types of aquaculture areas: NDWI significantly improves cage aquaculture area recognition accuracy by highlighting spectral differences between water bodies and aquaculture facilities, while NDVI contributes substantially to raft aquaculture areas, possibly attributable to the typical presence of attached algae in raft aquaculture areas, which NDVI effectively captures. Experimental results confirm that the band selection and combination strategy proposed in this study effectively enhances feature expression capabilities while optimizing data dimensions, significantly improving discrimination capabilities and extraction accuracy for different types of marine aquaculture areas, providing important technical support for the application of multi-modal remote sensing data in marine aquaculture monitoring. In future research, we will further optimize band selection and combination strategies, exploring more combinations of spectral indices and SAR polarization methods to further enrich the feature expression of aquaculture areas and enhance model performance.
4.2. Application of the Model
To verify the reliability and generalization capability of the MSAFNet model in large-scale extraction of aquaculture areas in actual marine environments, we selected coastal waters within 50 km of China’s coastline (excluding Taiwan) as the study region and conducted extensive application research on coastal aquaculture area extraction using this model. We obtained mean-composited Sentinel-1 and Sentinel-2 multi-modal remote sensing image collections from September 2020 to May 2021 using the GEE platform, and preprocessed and standardized the data according to the previously described methods to ensure data quality and format consistency.
As shown in Figure 10, we performed large-scale aquaculture area extraction along China’s coastal waters, obtaining the overall spatial distribution pattern of China’s coastal aquaculture areas for the 2020 growing season. The MSAFNet model successfully identified various marine aquaculture areas distributed along China’s eastern coast, clearly delineating the spatial distribution characteristics and regional differences of aquaculture areas. From Figure 10, it can be observed that aquaculture areas exhibit obvious regional clustering characteristics, primarily distributed in China’s eastern coastal regions, forming concentrated, continuous aquaculture belts, particularly in the Liaodong Peninsula, Shandong Peninsula, and Jiangsu coastal areas. This distribution pattern is closely related to the suitable marine hydrological conditions and the developed aquaculture industry foundation in these regions.
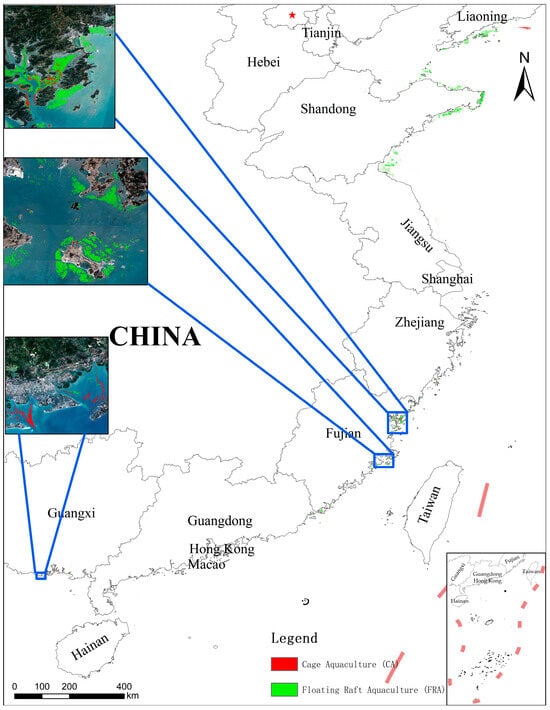
Figure 10.
Distribution map of coastal aquaculture areas in China during the 2020 cultivation season.
We selected extraction details from several representative regions for display, as shown in Figure 11, including distribution patterns, density characteristics, and boundary accuracy of aquaculture areas under different marine environments. From the extraction results, it is evident that MSAFNet can effectively distinguish between FRA and CA, and precisely delineate their boundary morphological characteristics. Particularly in areas with densely distributed aquaculture facilities, the model effectively suppressed the adhesion phenomena common in traditional methods, achieving refined separation of aquaculture units. Notably, MSAFNet demonstrated stable extraction performance in nearshore areas with high sediment concentration and island shadow interference zones, proving the model’s adaptability and robustness in complex marine environments. Different regions in Figure 11 showcase extraction effects under various environmental conditions, including aquaculture facilities in nearshore shallow waters, aquaculture area distributions around islands, and large-scale aquaculture area clusters in open waters, all achieving excellent extraction results.
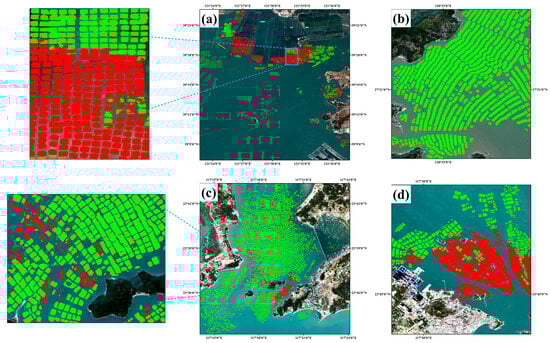
Figure 11.
Coastal aquaculture extraction results in selected Chinese regions in 2020. Green areas represent FRA, and red areas represent CA, (a–d) represents the extraction results of samples from different regions.
Figure 12 demonstrates MSAFNet’s unique advantages in detecting underwater or semi-submerged aquaculture facilities. It presents three typical study areas, each containing MSI imagery, SAR imagery, and final extraction results. Through comparison, it can be observed that certain aquaculture facilities are almost invisible in MSI imagery due to their underwater location or cloud coverage. For example, in the MSI imagery of Area a, portions of aquaculture areas are covered by clouds, preventing optical sensors from penetrating cloud layers to acquire effective information; while in the corresponding SAR imagery, due to synthetic aperture radar’s ability to penetrate cloud layers and capture minute changes in surface roughness, the scattering features formed by these obscured aquaculture facilities become discernible. Area b showcases a complex mixed environment containing both visible aquaculture facilities and semi-submerged structures, while Area c presents a typical case of underwater aquaculture areas, which are almost completely invisible in MSI imagery but exhibit obvious artificial structural features in SAR imagery. Through multi-modal fusion, MSAFNet successfully extracted the complete range of aquaculture areas. Therefore, through comprehensive assessment based on multi-modal remote sensing data, our method can detect marine aquaculture areas under various environmental conditions, including cloud-covered regions, underwater aquaculture structures, and aquaculture facilities difficult to identify using traditional single-modal data. By effectively fusing complementary information from both modalities, MSAFNet not only overcomes the limitations of optical imagery being susceptible to weather conditions but also compensates for SAR data’s deficiencies in fine delineation of aquaculture area boundaries, successfully achieving all-weather, high-precision aquaculture area extraction.
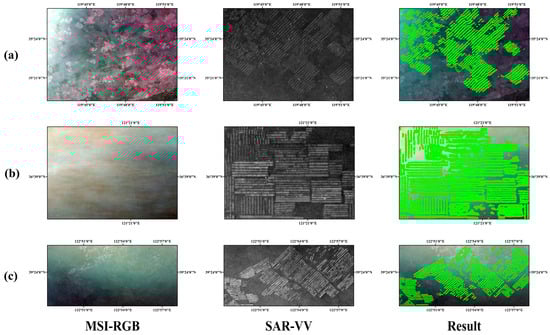
Figure 12.
Complementary characteristics of MSI and SAR multi-modal data in underwater aquaculture area extraction, (a–c) represent samples from different regions.
During model application, we also observed occasional misidentifications in some complex marine environments, such as at image edges and junctions of multiple image mosaics, indicating that model performance in these boundary regions still has room for improvement. Additionally, sporadic small-area noise points may appear in some open waters. These issues need to be further addressed in future research by incorporating more diverse samples, optimizing network structures, and introducing more refined post-processing strategies. In parallel, we plan to further expand the model’s application scope, exploring multi-scale, multi-temporal monitoring methods to provide more comprehensive data support for sustainable development of marine aquaculture.
Overall, MSAFNet demonstrates excellent generalization and adaptability across diverse marine conditions, providing innovative solutions for marine remote sensing monitoring.
5. Conclusions
This paper presents the Multi-modal Spatial–Frequency Adaptive Fusion Network (MSAFNet) for precise extraction of coastal aquaculture areas from multi-modal remote sensing images. To address the limitations of single-modal remote sensing data in extracting marine aquaculture areas, we constructed a multi-modal dataset based on Sentinel-1 (SAR) and Sentinel-2A (MSI) remote sensing imagery, encompassing five representative marine aquaculture areas in China’s coastal waters. This dataset comprehensively considers differences between various data modalities and labels, with pixel-level annotations under both modalities, providing a new data baseline for multi-modal marine aquaculture area extraction. The MSAFNet architecture designed in this paper fully leverages the complementary advantages of MSI and SAR images. The MDFM in the network integrates local detail information and global contextual features, enhancing perception capabilities for overall spatial distribution and detailed features of aquaculture areas. Meanwhile, the DFAFM achieves multi-dimensional feature integration between different modalities, dynamically enhancing feature information conducive to identifying aquaculture areas while suppressing redundant and interfering information.
MSAFNet significantly outperforms existing methods with 76.93% IoU, 86.96% F1, and 93.26% Kappa while maintaining computational efficiency. The method effectively reduces detection errors and adhesion phenomena in complex marine environments. Ablation studies confirm the effectiveness of MDFM and DFAFM modules. Through rational selection and combination of key bands (R, G, B) with spectral indices (NDWI, NDVI, and Index), combined with SAR’s VV polarization data, the constructed multi-modal data better reflects feature differences between various ground objects, improving model extraction accuracy while reducing data redundancy. Experiments confirm that this data combination strategy significantly enhances recognition capabilities for coastal aquaculture areas.
When applied to large-scale coastal aquaculture area monitoring tasks, MSAFNet demonstrated strong generalization capability and robustness in diverse marine environments. Visualization results confirm that this method can accurately identify and delineate aquaculture area boundaries under challenging conditions such as water color variations, suspended sediments, and partial cloud coverage. In future work, we plan to extend this method to multi-temporal sequence analysis to monitor seasonal changes in aquaculture areas, further optimize network architecture to reduce computational complexity, and explore the integration of additional data sources to enhance extraction performance. Experimental results demonstrate that MSAFNet has tremendous potential in practical applications, providing reliable technical support for the precise monitoring and mapping of coastal aquaculture areas, holding significant importance for marine resource management and sustainable development.
Author Contributions
Conceptualization, Y.L.; methodology, G.W.; software, G.W.; validation, G.W. and Y.L.; formal analysis, G.W.; investigation, G.W.; resources, Y.L.; data curation, G.W.; writing—original draft preparation, G.W.; writing—review and editing, G.W.; visualization, G.W.; supervision, Y.L.; project administration, Y.L.; funding acquisition, Y.L. All authors have read and agreed to the published version of the manuscript.
Funding
This research was funded by the National Key Research and Development Program of China, grant number 2017YFB0503500 and the Strategic Priority Research Program of Chinese Academy of Sciences, grant number XDA23100504.
Data Availability Statement
The datasets generated during the study are available from the corresponding author upon reasonable request.
Acknowledgments
The authors would like to thank the editors and reviewers for their detailed comments and efforts toward improving our study.
Conflicts of Interest
The authors declare no conflicts of interest.
Abbreviations
The following abbreviations are used in this manuscript:
| FRA | Floating raft aquaculture |
| CA | Cage aquaculture |
| MSAFNet | Multi-modal Spatial–Frequency Adaptive Fusion Network |
| MDFM | Multi-scale Dual-path Feature Module |
| DFAFM | Dynamic Frequency-domain Adaptive Fusion Module |
| MSI | Multispectral image |
| SAR | Synthetic aperture radar |
| GEE | Google Earth Engine |
| IRB | Inverted residual block |
Appendix A
To validate the statistical significance of MSAFNet’s performance improvements over baseline methods, we conducted McNemar’s test for paired nominal data on pixel-level classification results. McNemar’s test is particularly appropriate for comparing the performance of two classification methods on the same dataset, as it accounts for the paired nature of predictions and focuses on cases where the two methods disagree. The test statistic follows a chi-square distribution with one degree of freedom, where the null hypothesis assumes no significant difference between model performances (H0:b01 = b10), and the alternative hypothesis indicates a significant performance difference (H1:b01 ≠ b10). Here, b01 represents pixels where MSAFNet was incorrect while the comparison method was correct, and b10 represents pixels where MSAFNet was correct while the comparison method was incorrect.
As shown in Figure A1, the statistical analysis was performed on a comprehensive dataset of 2,809,250 valid pixels across all test samples, comparing MSAFNet against nine established baseline methods. The results demonstrate that MSAFNet achieved statistically significant superior performance in all comparisons, with all p-values < 0.001, well below the significance threshold of α = 0.05. The consistently large chi-square statistics and extremely low p-values provide strong statistical evidence that the observed performance improvements are not due to random variation, but represent genuine enhancements in classification accuracy for both floating raft aquaculture (FRA) and cage aquaculture (CA) semantic segmentation tasks. These results confirm that MSAFNet’s architectural innovations, particularly the MDFM and DFAFM modules, contribute meaningfully to improved marine aquaculture area extraction performance.

Figure A1.
Statistical significance analysis results: (Left) McNemar test p-value heatmap showing pairwise comparisons between MSAFNet and baseline methods; (Right) statistical significance matrix indicating statistically significant performance differences (MSAFNet-focused vs. others, with red indicating statistical significance).
References
- Belton, B.; Little, D.C.; Zhang, W.; Edwards, P.; Skladany, M.; Thilsted, S.H. Farming fish in the sea will not nourish the world. Nat. Commun. 2020, 11, 5804. [Google Scholar] [CrossRef]
- Cao, L.; Chen, Y.; Dong, S.; Hanson, A.; Huang, B.; Leadbitter, D.; Little, D.C.; Pikitch, E.K.; Qiu, Y.; Sadovy de Mitcheson, Y. Opportunity for marine fisheries reform in China. Proc. Natl. Acad. Sci. USA 2017, 114, 435–442. [Google Scholar] [CrossRef]
- Naylor, R.L.; Hardy, R.W.; Buschmann, A.H.; Bush, S.R.; Cao, L.; Klinger, D.H.; Little, D.C.; Lubchenco, J.; Shumway, S.E.; Troell, M. A 20-year retrospective review of global aquaculture. Nature 2021, 591, 551–563. [Google Scholar] [CrossRef]
- Costello, C.; Cao, L.; Gelcich, S.; Cisneros-Mata, M.Á.; Free, C.M.; Froehlich, H.E.; Golden, C.D.; Ishimura, G.; Maier, J.; Macadam-Somer, I. The future of food from the sea. Nature 2020, 588, 95–100. [Google Scholar] [CrossRef]
- Long, L.; Liu, H.; Cui, M.; Zhang, C.; Liu, C. Offshore aquaculture in China. Rev. Aquacult. 2024, 16, 254–270. [Google Scholar]
- Zhang, C.; Meng, Q.; Chu, J.; Liu, G.; Wang, C.; Zhao, Y.; Zhao, J. Analysis on the status of mariculture in China and the effectiveness of mariculture management in the Bohai Sea. Mar. Environ. Sci. 2021, 40, 887–894. [Google Scholar]
- Liu, Y.; Wang, Z.; Yang, X.; Wang, S.; Liu, X.; Liu, B.; Zhang, J.; Meng, D.; Ding, K.; Gao, K. Changes in the spatial distribution of mariculture in China over the past 20 years. J. Geogr. Sci. 2023, 33, 2377–2399. [Google Scholar] [CrossRef]
- Wang, Z.; Liu, K. Dynamic evolution of aquaculture along the Bohai sea coastline and implications for ECO-coastal vegetation restoration based on remote sensing. Plants 2024, 13, 160. [Google Scholar] [CrossRef]
- Lu, Y.; Shao, W.; Sun, J. Extraction of offshore aquaculture areas from medium-resolution remote sensing images based on deep learning. Remote Sens. 2021, 13, 3854. [Google Scholar]
- Cheng, B.; Liang, C.; Liu, X.; Liu, Y.; Ma, X.; Wang, G. Research on a novel extraction method using Deep Learning based on GF-2 images for aquaculture areas. Int. J. Remote Sens. 2020, 41, 3575–3591. [Google Scholar]
- Xu, Y.; Lu, L. An attention-fused deep learning model for accurately monitoring cage and raft aquaculture at large-scale using sentinel-2 data. IEEE J. Sel. Top. Appl. Earth Obs. Remote Sens. 2024, 17, 9099–9109. [Google Scholar] [CrossRef]
- Wang, J.; Fan, J.; Wang, J. MDOAU-Net: A lightweight and robust deep learning model for SAR image segmentation in aquaculture raft monitoring. IEEE Geosci. Remote Sens. Lett. 2022, 19, 4504505. [Google Scholar] [CrossRef]
- Zhang, Y.; Wang, C.; Chen, J.; Wang, F. Shape-constrained method of remote sensing monitoring of marine raft aquaculture areas on multitemporal synthetic sentinel-1 imagery. Remote Sens. 2022, 14, 1249. [Google Scholar] [CrossRef]
- Li, J.; Hong, D.; Gao, L.; Yao, J.; Zheng, K.; Zhang, B.; Chanussot, J. Deep learning in multimodal remote sensing data fusion: A comprehensive review. Int. J. Appl. Earth Obs. Geoinf. 2022, 112, 102926. [Google Scholar] [CrossRef]
- Mena, F.; Arenas, D.; Nuske, M.; Dengel, A. Common practices and taxonomy in deep multiview fusion for remote sensing applications. IEEE J. Sel. Top. Appl. Earth Obs. Remote Sens. 2024, 17, 4797–4818. [Google Scholar] [CrossRef]
- Samadzadegan, F.; Toosi, A.; Dadrass Javan, F. A critical review on multi-sensor and multi-platform remote sensing data fusion approaches: Current status and prospects. Int. J. Remote Sens. 2025, 46, 1327–1402. [Google Scholar] [CrossRef]
- Vivone, G.; Deng, L.-J.; Deng, S.; Hong, D.; Jiang, M.; Li, C.; Li, W.; Shen, H.; Wu, X.; Xiao, J.-L. Deep learning in remote sensing image fusion: Methods, protocols, data, and future perspectives. IEEE Geosci. Remote Sens. Mag. 2024, 13, 269–310. [Google Scholar] [CrossRef]
- Liu, Y.; Gao, K.; Wang, H.; Yang, Z.; Wang, P.; Ji, S.; Huang, Y.; Zhu, Z.; Zhao, X. A Transformer-based multi-modal fusion network for semantic segmentation of high-resolution remote sensing imagery. Int. J. Appl. Earth Obs. Geoinf. 2024, 133, 104083. [Google Scholar] [CrossRef]
- Wu, H.; Huang, P.; Zhang, M.; Tang, W.; Yu, X. CMTFNet: CNN and multiscale transformer fusion network for remote-sensing image semantic segmentation. IEEE Trans. Geosci. Remote Sens. 2023, 61, 2004612. [Google Scholar] [CrossRef]
- Zhou, W.; Jin, J.; Lei, J.; Yu, L. CIMFNet: Cross-layer interaction and multiscale fusion network for semantic segmentation of high-resolution remote sensing images. IEEE J. Sel. Top. Signal Process. 2022, 16, 666–676. [Google Scholar] [CrossRef]
- Wei, K.; Dai, J.; Hong, D.; Ye, Y. MGFNet: An MLP-dominated gated fusion network for semantic segmentation of high-resolution multi-modal remote sensing images. Int. J. Appl. Earth Obs. Geoinf. 2024, 135, 104241. [Google Scholar] [CrossRef]
- Zhang, C.; Chang, Y.; Wu, Y.; Shui, Y.; Wang, Z.; Zhu, J. Semantic information guided diffusion posterior sampling for remote sensing image fusion. Sci. Rep. 2024, 14, 27259. [Google Scholar] [CrossRef]
- Bi, H.; Feng, Y.; Tong, B.; Wang, M.; Yu, H.; Mao, Y.; Chang, H.; Diao, W.; Wang, P.; Yu, Y. RingMoE: Mixture-of-Modality-Experts Multi-Modal Foundation Models for Universal Remote Sensing Image Interpretation. arXiv 2025, arXiv:2504.03166. [Google Scholar]
- Liu, C.; Sun, Y.; Zhang, X.; Xu, Y.; Lei, L.; Kuang, G. OSHFNet: A heterogeneous dual-branch dynamic fusion network of optical and SAR images for land use classification. Int. J. Appl. Earth Obs. Geoinf. 2025, 141, 104609. [Google Scholar] [CrossRef]
- Wei, Q.; Liu, Y.; Jiang, X.; Zhang, B.; Su, Q.; Yu, M. DDFNet-A: Attention-Based Dual-Branch Feature Decomposition Fusion Network for Infrared and Visible Image Fusion. Remote Sens. 2024, 16, 1795. [Google Scholar] [CrossRef]
- Liu, X.; Wang, Z.; Yang, X.; Liu, Y.; Liu, B.; Zhang, J.; Gao, K.; Meng, D.; Ding, Y. Mapping China’s offshore mariculture based on dense time-series optical and radar data. Int. J. Digit. Earth 2022, 15, 1326–1349. [Google Scholar] [CrossRef]
- Wang, S.; Huang, C.; Li, H.; Liu, Q. Synergistic integration of time series optical and SAR satellite data for mariculture ex-traction. Remote Sens. 2023, 15, 2243. [Google Scholar] [CrossRef]
- Liu, J.; Lu, Y.; Guo, X.; Ke, W. A deep learning method for offshore raft aquaculture extraction based on medium-resolution remote sensing images. IEEE J. Sel. Top. Appl. Earth Obs. Remote Sens. 2023, 16, 6296–6309. [Google Scholar] [CrossRef]
- Yu, H.; Wang, F.; Hou, Y.; Wang, J.; Zhu, J.; Guo, J. MSARG-Net: A multimodal offshore floating raft aquaculture area extraction network for remote sensing images based on multiscale SAR guidance. IEEE J. Sel. Top. Appl. Earth Obs. Remote Sens. 2024, 17, 18319–18334. [Google Scholar] [CrossRef]
- Yu, H.; Wang, F.; Hou, Y.; Wang, J.; Zhu, J.; Cui, Z. CMFPNet: A cross-modal multidimensional frequency perception network for extracting offshore aquaculture areas from MSI and SAR images. Remote Sens. 2024, 16, 2825. [Google Scholar] [CrossRef]
- Sun, Z.; Xu, R.; Du, W.; Wang, L.; Lu, D. High-resolution urban land mapping in China from sentinel 1A/2 imagery based on Google Earth Engine. Remote Sens. 2019, 11, 752. [Google Scholar] [CrossRef]
- Wang, M.; Liu, Z.; Chen, Y. Comparsions of image cloud detection effect based on Sentinel-2 bands/products. Remote Sens. Technol. Appl. 2020, 35, 1167–1177. [Google Scholar]
- Gao, B.-C. NDWI—A normalized difference water index for remote sensing of vegetation liquid water from space. Remote Sens. Environ. 1996, 58, 257–266. [Google Scholar] [CrossRef]
- Pettorelli, N.; Vik, J.O.; Mysterud, A.; Gaillard, J.-M.; Tucker, C.J.; Stenseth, N.C. Using the satellite-derived NDVI to assess ecological responses to environmental change. Trends Ecol. Evol. 2005, 20, 503–510. [Google Scholar] [CrossRef] [PubMed]
- Lu, Y.; Li, Q.; Du, X.; Wang, H.; Liu, J. A method of coastal aquaculture area automatic extraction with high spatial resolution images. Remote Sens. Technol. Appl. 2015, 30, 486–494. [Google Scholar]
- Gao, L.; Wang, C.; Liu, K.; Chen, S.; Dong, G.; Su, H. Extraction of floating raft aquaculture areas from sentinel-1 SAR images by a dense residual U-Net model with pre-trained Resnet34 as the encoder. Remote Sens. 2022, 14, 3003. [Google Scholar] [CrossRef]
- Zhang, Y.; Wang, C.; Ji, Y.; Chen, J.; Deng, Y.; Chen, J.; Jie, Y. Combining segmentation network and nonsubsampled contourlet transform for automatic marine raft aquaculture area extraction from sentinel-1 images. Remote Sens. 2020, 12, 4182. [Google Scholar] [CrossRef]
- Sandler, M.; Howard, A.; Zhu, M.; Zhmoginov, A.; Chen, L.-C. Mobilenetv2: Inverted residuals and linear bottlenecks. In Proceedings of the IEEE Conference on Computer Vision and Pattern Recognition, Salt Lake City, UT, USA,, 18–23 June 2018; pp. 4510–4520. [Google Scholar]
- Hu, X.; Zhang, P.; Zhang, Q.; Yuan, F. GLSANet: Global-local self-attention network for remote sensing image semantic segmentation. IEEE Geosci. Remote Sens. Lett. 2023, 20, 6000105. [Google Scholar] [CrossRef]
- Ma, X.; Lian, R.; Wu, Z.; Guo, H.; Yang, F.; Ma, M.; Wu, S.; Du, Z.; Zhang, W.; Song, S. Logcan++: Adaptive local-global class-aware network for semantic segmentation of remote sensing images. IEEE Trans. Geosci. Remote Sens. 2025, 63, 4404216. [Google Scholar] [CrossRef]
- Zhu, S.; Zhao, L.; Xiao, Q.; Ding, J.; Li, X. Glffnet: Global–local feature fusion network for high-resolution remote sensing image semantic segmentation. Remote Sens. 2025, 17, 1019. [Google Scholar] [CrossRef]
- Bhatt, D.; Patel, C.; Talsania, H.; Patel, J.; Vaghela, R.; Pandya, S.; Modi, K.; Ghayvat, H. CNN variants for computer vision: History, architecture, application, challenges and future scope. Electronics 2021, 10, 2470. [Google Scholar] [CrossRef]
- Mehta, S.; Rastegari, M. Mobilevit: Light-weight, general-purpose, and mobile-friendly vision transformer. arXiv 2021, arXiv:2110.02178. [Google Scholar]
- Han, K.; Wang, Y.; Chen, H.; Chen, X.; Guo, J.; Liu, Z.; Tang, Y.; Xiao, A.; Xu, C.; Xu, Y. A survey on vision transformer. IEEE Trans. Pattern Anal. Mach. Intell. 2022, 45, 87–110. [Google Scholar] [CrossRef]
- Nie, J.; Sun, H.; Sun, X.; Ni, L.; Gao, L. Cross-modal feature fusion and interaction strategy for CNN-transformer-based object detection in visual and infrared remote sensing imagery. IEEE Geosci. Remote Sens. Lett. 2023, 21, 5000405. [Google Scholar] [CrossRef]
- Ren, K.; Chen, X.; Wang, Z.; Liang, X.; Chen, Z.; Miao, X. HAM-Transformer: A hybrid adaptive multi-scaled transformer net for remote sensing in complex scenes. Remote Sens. 2023, 15, 4817. [Google Scholar] [CrossRef]
- Xu, X.; Feng, Z.; Cao, C.; Li, M.; Wu, J.; Wu, Z.; Shang, Y.; Ye, S. An improved swin transformer-based model for remote sensing object detection and instance segmentation. Remote Sens. 2021, 13, 4779. [Google Scholar] [CrossRef]
- Howard, A.G.; Zhu, M.; Chen, B.; Kalenichenko, D.; Wang, W.; Weyand, T.; Andreetto, M.; Adam, H. Mobilenets: Efficient convolutional neural networks for mobile vision applications. arXiv 2017, arXiv:1704.04861. [Google Scholar] [CrossRef]
- Liu, Z.; Lin, Y.; Cao, Y.; Hu, H.; Wei, Y.; Zhang, Z.; Lin, S.; Guo, B. Swin transformer: Hierarchical vision transformer using shifted windows. In Proceedings of the IEEE/CVF International Conference on Computer Vision, Montreal, QC, Canada, 10–17 October 2021; pp. 10012–10022. [Google Scholar]
- Hafner, S. Multi-Modal Deep Learning with Sentinel-1 and Sentinel-2 Data for Urban Mapping and Change Detection. Licentiate Thesis, KTH Royal Institute of Technology, Stockholm, Sweden, 2022. [Google Scholar]
- Hafner, S.; Nascetti, A.; Azizpour, H.; Ban, Y. Sentinel-1 and sentinel-2 data fusion for urban change detection using a dual stream u-net. IEEE Geosci. Remote Sens. Lett. 2021, 19, 4019805. [Google Scholar] [CrossRef]
- Fan, X.; Zhou, W.; Qian, X.; Yan, W. Progressive adjacent-layer coordination symmetric cascade network for semantic segmentation of multimodal remote sensing images. Expert Syst. Appl. 2024, 238, 121999. [Google Scholar] [CrossRef]
- Xiao, T.; Liu, Y.; Huang, Y.; Li, M.; Yang, G. Enhancing multiscale representations with transformer for remote sensing image semantic segmentation. IEEE Trans. Geosci. Remote Sens. 2023, 61, 5605116. [Google Scholar] [CrossRef]
- Ye, Z.; Li, Y.; Li, Z.; Liu, H.; Zhang, Y.; Li, W. Attention-Multi-Scale Network for Semantic Segmentation of Multi-Modal Remote Sensing Images. IEEE Trans. Geosci. Remote Sens. 2025, 63, 5610315. [Google Scholar] [CrossRef]
- Guo, M.-H.; Lu, C.-Z.; Liu, Z.-N.; Cheng, M.-M.; Hu, S.-M. Visual attention network. Comput. Vis. Media 2023, 9, 733–752. [Google Scholar] [CrossRef]
- Guo, M.-H.; Xu, T.-X.; Liu, J.-J.; Liu, Z.-N.; Jiang, P.-T.; Mu, T.-J.; Zhang, S.-H.; Martin, R.R.; Cheng, M.-M.; Hu, S.-M. Attention mechanisms in computer vision: A survey. Comput. Vis. Media 2022, 8, 331–368. [Google Scholar] [CrossRef]
- Qin, Z.; Zhang, P.; Wu, F.; Li, X. Fcanet: Frequency channel attention networks. In Proceedings of the IEEE/CVF International Conference on Computer Vision, Montreal, QC, Canada, 10–17 October 2021; pp. 783–792. [Google Scholar]
- Li, X.; Xu, F.; Yu, A.; Lyu, X.; Gao, H.; Zhou, J. A frequency decoupling network for semantic segmentation of remote sensing images. IEEE Trans. Geosci. Remote Sens. 2025, 63, 5607921. [Google Scholar] [CrossRef]
- Duhamel, P.; Vetterli, M. Fast Fourier transforms: A tutorial review and a state of the art. Signal Process. 1990, 19, 259–299. [Google Scholar] [CrossRef]
- Jiang, X.; Zhang, X.; Gao, N.; Deng, Y. When fast fourier transform meets transformer for image restoration. In Proceedings of the European Conference on Computer Vision, Milan, Italy, 29 September–4 October 2024; pp. 381–402. [Google Scholar]
- Ho, Y.; Wookey, S. The real-world-weight cross-entropy loss function: Modeling the costs of mislabeling. IEEE Access 2019, 8, 4806–4813. [Google Scholar] [CrossRef]
- Jadon, S. A survey of loss functions for semantic segmentation. In Proceedings of the 2020 IEEE Conference on Computational Intelligence in Bioinformatics and Computational Biology (CIBCB), Via del Mar, Chile, 27–29 October 2020; pp. 1–7. [Google Scholar]
- He, K.; Zhang, X.; Ren, S.; Sun, J. Deep residual learning for image recognition. In Proceedings of the IEEE Conference on Computer Vision and Pattern Recognition, Las Vegas, NV, USA, 27–30 June 2016; pp. 770–778. [Google Scholar]
- Chen, L.-C.; Zhu, Y.; Papandreou, G.; Schroff, F.; Adam, H. Encoder-decoder with atrous separable convolution for semantic image segmentation. In Proceedings of the European Conference on Computer Vision (ECCV), Munich, Germany, 8–14 September 2018; pp. 801–818. [Google Scholar]
- Cao, H.; Wang, Y.; Chen, J.; Jiang, D.; Zhang, X.; Tian, Q.; Wang, M. Swin-unet: Unet-like pure transformer for medical image segmentation. In Proceedings of the European Conference on Computer Vision, Tel Aviv, Israel, 23–27 October 2022; pp. 205–218. [Google Scholar]
- Chen, J.; Lu, Y.; Yu, Q.; Luo, X.; Adeli, E.; Wang, Y.; Lu, L.; Yuille, A.L.; Zhou, Y. Transunet: Transformers make strong encoders for medical image segmentation. arXiv 2021, arXiv:2102.04306. [Google Scholar] [CrossRef]
- Selvaraju, R.R.; Cogswell, M.; Das, A.; Vedantam, R.; Parikh, D.; Batra, D. Grad-cam: Visual explanations from deep networks via gradient-based localization. In Proceedings of the IEEE International Conference on Computer Vision, Venice, Italy, 22–29 October 2017; pp. 618–626. [Google Scholar]
Disclaimer/Publisher’s Note: The statements, opinions and data contained in all publications are solely those of the individual author(s) and contributor(s) and not of MDPI and/or the editor(s). MDPI and/or the editor(s) disclaim responsibility for any injury to people or property resulting from any ideas, methods, instructions or products referred to in the content. |
© 2025 by the authors. Licensee MDPI, Basel, Switzerland. This article is an open access article distributed under the terms and conditions of the Creative Commons Attribution (CC BY) license (https://creativecommons.org/licenses/by/4.0/).