Highlights
What are the main findings?
- A novel wildfire dataset for Greece was created using open data sources, integrating satellite imagery (NDVI), meteorological data, and topographic features from 2017 to 2021.
- A multimodal deep learning wildfire classification approach combining CNNs and MLPs outperformed ensemble models constructed from LSTMs and CNNs, achieving 96.15% accuracy on the validation set.
What is the implication of the main finding?
- The Greek wildfire dataset enhances regional wildfire research and provides a foundational basis for future studies across Mediterranean ecosystems.
- The proposed multimodal approach establishes a new benchmark for satellite-based wildfire classification, demonstrating that integrating spatial vegetation context significantly enhances classification performance.
Abstract
Wildfire events pose significant threats to global ecosystems, with Greece experiencing substantial economic losses exceeding EUR 1.7 billion in 2023 alone, generating immediate financial burdens while contributing to atmospheric carbon dioxide emissions and accelerating climate change effects. This study presents a group of classification models for Greece wildfires utilizing historical datasets spanning 2017 to 2021, incorporating satellite-derived remote sensing data, topographical characteristics, and meteorological observations through a multimodal methodology that integrates satellite imagery processing with traditional numerical data analysis techniques. The framework encompasses multiple deep learning architectures, specifically implementing four standalone models comprising two convolutional neural networks optimized for spatial image processing and long short-term memory networks designed for temporal pattern recognition, extending classification approaches by incorporating visual satellite data alongside established numerical datasets to enable the system to leverage both spatial visual patterns and temporal numerical trends. The implementation employs an ensemble methodology that combines individual model classifications through systematic voting mechanisms, harnessing the complementary strengths of each architectural approach to deliver enhanced predictive capabilities and demonstrate the substantial benefits achieved through multimodal data integration for comprehensive wildfire risk assessment applications.
1. Introduction
Wildfires are natural hazards that may cause severe ecological, economic, and societal impacts. Between the months of January to September 2023, wildfires in the US amounted to USD 4 Billion [1] while in the same period, Greek wildfires resulted in approximately EUR 1.7 billion in damages. (0.8% of Greece’s 2022 GDP) [2]. Besides economic impacts, through the vast amount of forest and vegetation burned, significant volumes of carbon dioxide are released into Earth’s atmosphere, aggravating climate change [3]. Moreover, the largest number of internal displacements in 2023 due to wildfires, in the region of Europe and Central Asia, was recorded in Greece with a record high of 76,000 internal displacements [4]. Additionally, Greece suffered the largest number of combined storm, flood, and wildfire internal displacements in the region, namely, 91,000 displacements.
Recent advancements in machine learning (ML) and deep learning (DL) have facilitated the development of data-driven approaches for disaster management [5], including wildfire risk assessment, detection, and prediction [5,6,7,8,9,10,11,12,13,14,15,16,17,18,19,20,21,22].
These methods leverage large-scale remote sensing data, topographic features, and meteorological inputs to identify patterns associated with fire outbreaks.
While numerous studies have applied machine learning methods in wildfire disasters research globally, research specific to the Greek context remains limited. To the best of our knowledge, most existing works tend to emphasize susceptibility mapping or rely on traditional models, with fewer studies exploring DL approaches that integrate satellite imagery or temporally aware architectures. This study addresses this gap by evaluating a suite of DL models—including LSTMs and multimodal CNNs—on a newly assembled, region-specific dataset focusing on characteristics of wildfires in Greece.
Satellite data spanning from 2017 to 2021 were identified by the LANCE-FIRMS Visible Infrared Imaging Radiometer Suite (VIIRS)’s fire layer product using the Suomi-National Polar orbiting Partnership (S-NPP), NOAA-20 (JPSS-1), and NOAA-21 (JPSS-2) satellites [23] to construct the dataset. Additional vegetation, topographic, and meteorological data from open sources were integrated to enrich the dataset.
Two distinct methods were evaluated; the first involved training models primarily on numerical features, while the second—a multimodal approach—combined numerical features with satellite imagery of the Normalized Difference Vegetation Index (NDVI) for each wildfire event. In the former case, we trained a set of deep learning (DL) models for time series classification, namely long short-term memory (LSTM) neural networks and convolutional neural network (CNNs) on various topographic, meteorological, vegetation and satellite features of the Greek wildfire dataset. Each DL model type was trained both with and without the inclusion of the Daynight feature—a variable indicating whether a wildfire event occurred during the day or night—in order to assess its impact on classification performance. We employed averaging and majority voting ensemble techniques to combine individual models. Finally, the multimodal approach was implemented by training CNN models on both numerical features and satellite images. The aim of this study is to evaluate the performance of each model and method trained on different feature sets and determine which configuration yields the most accurate wildfire classifications.
2. Literature Review
The application of machine learning (ML) and deep learning (DL) to wildfire classification has been explored across various geographical contexts and datasets, reflecting a global effort to mitigate fire-related risks. A comprehensive analysis by Pelletier et al. [6] utilized a 28-year wildfire dataset from Canada’s National Fire Database, which included details on fire location, duration, area burned, and cause. After implementing and comparing three different neural network models, they concluded that a long short-term memory (LSTM) architecture demonstrated superior performance, achieving a notable precision of 95.9%.
Addressing the challenge of prediction in regions with extreme temperature fluctuations, a study by Janiec and Gadal [7] in Yakutia, Siberia, drew upon data from the Fire Information for Resource Management System (FIRMS) for the period between 2002 and 2018. This work specifically used the VIIRS 375m and MODIS Collection 6 Active Fire products. The authors incorporated static, fire-influencing factors such as slope, aspect, fuel type, and NDVI, employing both maximum entropy and random forest models for the classification task.
In a study focused on the Biobio and Nuble regions of Chile, Bjånes et al. [8] analyzed a dataset integrating meteorological, vegetation, and topographical variables with key anthropogenic factors, such as the proximity of fires to roads, farmlands, and urban areas. From a selection of models that included two distinct convolutional neural networks (CNNs) and a Siamese network, an ensemble approach combining the two CNNs proved to be the most effective. This ensemble yielded an Area Under the Curve (AUC) score of 0.953 and an F1-score of 88.77%, highlighting the power of model fusion.
In the area of integrated systems, Bhowmik et al. [9] presented a multimodal wildfire prediction and early prevention framework based on a U-LSTM model. This system extended the existing WildfireDB by incorporating meteorological, environmental, and geographic trailing indicators, which were then used to generate detailed risk maps. The resulting model outperformed benchmarks like Le-Net5, achieving an accuracy of 97.1%.
In the Kırklareli, Tekirdag, and Edirne provinces of Turkey, Kantarcioglu et al. [10] focused on creating forest fire susceptibility maps using an Artificial Neural Network (ANN). Their model, which consisted of two hidden layers with eight neurons each and a ReLU activation function, was trained on topographic, vegetation, hydrological, and anthropogenic data recorded between 2013 and 2021. The model achieved a robust AUC value of 0.94 and an F1-score of 0.80.
A study in California by Pham et al. [11] demonstrated the importance of geographical scale by creating two distinct datasets from remote sensing data for both statewide and county-level analysis. The data was derived from the VIIRS satellite, and the MODIS instrument was used for the normalized difference vegetation index (NDVI). The remote sensing data came from the VIIRS satellite, while the normalized difference vegetation index (NDVI) came from the MODIS instrument. The dataset features included NDVI, land surface temperature, thermal anomalies, and burned area. The models included an ANN, support vector machine (SVM), k-nearest neighbor (KNN), Logistic Regression (LR), and Gaussian naïve bayes (GNB). The ANN model achieved the best prediction accuracy of 89% for the dataset at the level of California state. The KNN model outperformed the other models at a county level, achieving a prediction accuracy of 97%.
Highlighting the significant gains from data fusion, research by Malik et al. [12] in the San Diego region leveraged a diverse set of sources, including the Landsat 8 satellite, the National Center for Environmental information, the Fire and Resource Assessment program, and the San Diego open GIS Data Portal. Data covered the time period between 2011 and 2020. An ensemble model was used with majority voting. The ML models in the ensemble included SVM, extreme gradient boosting (XGBoost), and random forest. DL models included CNN and LSTM models. A multilayer perceptron (MLP) model was also trained with the DL models. The DL models achieved higher accuracy compared to the ML models, with an F-1-score of 95%. The ensemble majority voting model achieved an F-1 score of 100%.
A study on Australian wildfires by Ding et al. [13] underscored the importance of high-temporal-resolution data, using imagery from the Himawari-8 satellite to overcome the limitations of platforms not in sun-synchronous orbits. The authors proposed a U-Net architecture named WLF-UNet, specifically designed to locate fires and assess their intensity, which surpassed various ML models like SVM and k-means clustering with an accuracy of over 80%.
In Victoria, another wildfire-prone area in Australia, a separate study by Bergado et al. [14] utilized a rich dataset featuring topographical, weather, anthropogenic, and fuel-type data from 2006 to 2017. The proposed DL CNN architecture demonstrated superior prediction accuracy when compared to other models, including SegNet, MLP, and linear regression.
More recent work has ventured into unconventional data sources, exploring the use of machine learning and Large Language Models (LLMs) for disaster management. A study by Linardos and Drakaki [16] focused on the 2021 wildfire disaster in Evia, Greece, using an LLM to process social media data and generate reports for situational awareness. Similarly, Christidou et al. [17] developed a machine learning-based method to automatically identify disaster-related information using Twitter data, aiming to improve information filtering during crisis events. In a similar vein, Linardos et al. [18] later leveraged LLMs to automate the structuring and labeling of disaster-related social media content from a large Twitter dataset, aiming to enhance the effectiveness of disaster response efforts.
In [20], Ali and Kurnaz (2025) proposed a deep learning framework for real-time wildfire risk prediction using a diverse global dataset derived from NASA’s Earth Observing System and Google Earth Engine. The dataset spanned from 2018 to 2020 and included 20 remote sensing and meteorological features such as vegetation indices (NDVI, FAPAR, LAI), topography, land surface temperature, soil moisture, precipitation, wind, and fire occurrences across six continents. Three deep learning architectures—Autoencoder, U-Net, and CNN—were evaluated for pixel-wise fire detection. The CNN outperformed the other models with a fire detection accuracy of 0.82 and a no-fire accuracy of 0.87.
In [21], Wen and Gu (2025) proposed a wildfire detection model based on a CNN trained on a large dataset of 42,850 satellite images, including various biomes such as mountain, urban, coastal, and forest regions. The images were preprocessed using normalization and data augmentation techniques to mitigate overfitting. The model was trained using four different optimization algorithms—Adam, SGD, AdaGrad, and RMSProp—with comparative evaluation over 15 epochs. The Adam optimizer achieved the highest validation accuracy (97.51%) with minimal overfitting, while RMSProp and SGD also showed stable and high performance.
Finally, significant progress and interest have been shown in image-based early detection systems. One approach, presented by Lee et al. [19], used a CNN model with aerial images from Unmanned Aerial Vehicles (UAVs), where the GoogLeNet architecture outperformed other models like AlexNet and VGG-13 by achieving an accuracy of 99%. Complementing this, an early fire detection method proposed by Muhammad et al. [22] utilized a fine-tuned CNN for fixed closed-circuit television (CCTV) surveillance cameras, achieving a detection accuracy of 94.39% and an F1-score of 0.89, demonstrating viability for infrastructure-based monitoring.
3. Materials and Methods
3.1. Region of Interest
This study focuses on Greece, a country characterized by a Mediterranean climate with hot, dry summers and mild, wet winters [24]. In recent years, Greece has experienced significant losses from wildfire outbreaks, including humanitarian, infrastructural, and environmental impacts. More specifically, in 2023, the Evros region witnessed the largest wildfire in recent European history, burning approximately 247,000 acres and severely affecting the Dadia Forest ecosystem. Besides other disaster impacts, this event contributed substantially to Greece’s 2023 wildfire-related economic losses, estimated at EUR 1.7 billion [25,26].
3.2. Factors Influencing Wildfire Outbreaks
Wildfire ignition and spread are governed by a combination of environmental, topographical, meteorological, and human-related factors [12,27]. In this study, we focus on the most influential geospatial and atmospheric variables, specifically topographic features, meteorological conditions, and remote sensing observations.
3.2.1. Topographic Factors
Topographic attributes such as aspect, slope, and elevation significantly affect fire behavior and propagation. Aspect refers to the compass direction that a slope faces, typically measured in degrees from the north [28]. It influences solar radiation exposure, which affects fuel moisture and ignition likelihood. Elevation is the vertical distance between the terrain and a fixed reference point, commonly sea level [29,30]. Higher elevations often correlate with lower temperatures and different vegetation types. Slope is the rate of elevation change between two points [31]. Steeper slopes facilitate faster upslope fire spread due to the preheating of fuels [32].
Understanding these variables is critical for predicting fire pathways and modeling fire dynamics.
3.2.2. Satellite Data
Satellite remote sensing plays a vital role in both active wildfire monitoring and fire risk prediction. During fire events, satellites detect emitted and reflected electromagnetic radiation, enabling near-real-time assessments of fire location, intensity, and progression. In pre-fire conditions, satellites help assess fuel availability, soil moisture, and vegetation health, supporting early-warning systems and predictive modeling [33].
Key wavelength ranges used in wildfire detection include the following:
Short-wave infrared (SWIR; 1.4–2.3 μm): Optimal for detecting fires during daylight by minimizing interference from reflected sunlight.
Mid-wave infrared (MWIR; 3–5 μm): Captures peak thermal radiation from vegetation fires, making it highly effective for active fire detection.
Long-wave infrared (LWIR; 8–14 μm): Complements MWIR for enhanced fire identification and scene contrast.
The integration of these spectral bands enhances the accuracy of fire detection and characterization [33].
3.2.3. Meteorological Variables
Weather conditions are among the most critical drivers of wildfire ignition and spread. High air temperatures and low precipitation reduce vegetation moisture content, increasing susceptibility to ignition [NPS]. Strong winds exacerbate fire spread by supplying oxygen, transporting embers, and shifting the fire’s direction, often making containment efforts more difficult [34].
3.2.4. Vegetation Variables
Vegetation data are vital for wildfire classification, as they account for fuel availability and vegetation health. Indices such as the Normalized Difference Vegetation Index (NDVI) offer insight into vegetation density and moisture, both of which influence fire risk [35]. NDVI’s spectral properties deem it highly effective for detecting vegetation changes resulting from wildfire activity [36].
3.3. Data Acquisition
All datasets utilized in this study were obtained from publicly accessible open data platforms and used strictly for non-commercial, academic research purposes [37]. Historical wildfire occurrences in Greece from 2017 to 2021 were acquired from the Fire Information for Resource Management System (LANCE-FIRMS) [38]. For each fire record, defined by its timestamp, longitude, and latitude, corresponding topographic and meteorological data were retrieved. The topographic variables included elevation, slope, and aspect, while the meteorological parameters consisted of the maximum, minimum, and average daily temperatures at 2 m above ground level, total daily precipitation, and maximum wind speed at 10 m above the surface. Finally, the dataset was enhanced by incorporating images depicting NDVI from the Copernicus sentinel missions [39].
3.3.1. Satellite Data
Satellite-based fire detections were obtained from the Visible Infrared Imaging Radiometer Suite (VIIRS) fire layer, accessed via LANCE-FIRMS. This fire product provides near-real-time data on thermal anomalies and active fire locations, enabling the spatial and temporal analysis of wildfire activity. The VIIRS fire layer integrates data from the NOAA-20 (JPSS-1) and NOAA-21 (JPSS-2) satellites, which together form the NASA/NOAA Suomi-National Polar-orbiting Partnership (S-NPP). Each sensor provides observations with a spatial resolution of 375 m and a temporal frequency of approximately one hour [38].
3.3.2. Topographic Data
Topographic variables were retrieved using the Google Earth Engine API [40]. The NASADEM Digital Elevation Model was employed to extract elevation, slope, and aspect values for the coordinates associated with each wildfire observation in the dataset [41].
3.3.3. Meteorological Data
Meteorological data were collected using the Open-Meteo API [42], which provides access to historical weather records generated from a combination of national weather stations, numerical weather prediction models, and reanalysis datasets. For each fire record, daily minimum, maximum, and average temperatures at 2 m, total daily precipitation, and maximum wind speeds at 10 m above the ground were included.
3.3.4. Vegetation Data
NDVI imagery was collected from Copernicus Sentinel satellite missions [39]. For each thermal ignition geopoint’s location and timestamp, a 2 × 2 km NDVI tile was extracted with a spatial resolution of 512 × 512 pixels.
3.4. Wildfire Dataset Description
The data acquisition process that was described in the previous section resulted in a dataset that contains 27,576 samples of data and 23 features. Table 1 contains metadata of the features of the Greek wildfire dataset.

Table 1.
Greek wildfire dataset feature description.
Figure 1 contains fire/non-fire events present in Greece spanning the years from 2017 to 2021. Figure 1e shows the severe wildfires in the north region of the island of Evia that occurred in 2021 [43].
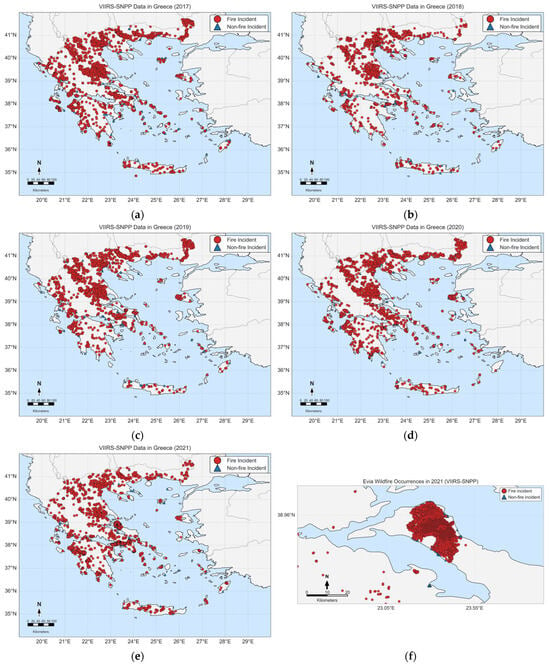
Figure 1.
(a–f) plot fire/non-fire occurrences in Greece during 2017–2021. They display the tragic fires that occurred in the island of Evia in 2021 [43].
From Figure 1a–e, which display wildfire occurrences in Greece, it can be observed that wildfires are distributed relatively evenly across the country each year, with the region of Thessaly experiencing multiple events annually.
The following plots contain time series data from various features of the wildfire dataset. In Figure 2a–c, we can observe the seasonal trends that are present in the temperature features, where there is a notable spike during each summer season and a notable drop in temperature during the winter months. In Figure 2d,e, which depict Fire Radiation Power (FRP) and the sum of precipitation, there is no clear trend; however, the presence of outliers can be observed. In Figure 2f, which shows the maximum wind speed at 10 m above ground, the values appear scattered without a consistent trend. Lastly, in Figure 2g,h, which present the brightness values from bands I-4 and I-5, a noticeable number of outliers can be observed—particularly in Figure 2h. Despite this, the underlying seasonal trend in the data is observed.
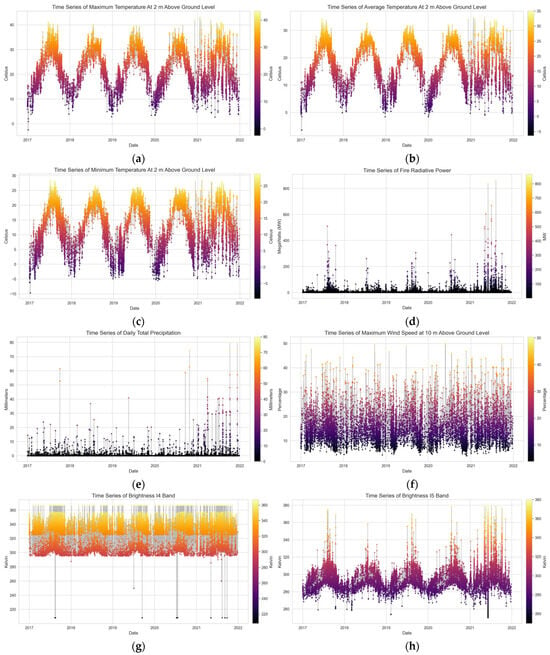
Figure 2.
(a–h) plot time series data for the following features: temperature 2m max, temperature 2m mean, temperature 2m min, FRP, precipitation sum, wind speed 10m max, bright ti4, and bright ti5, correspondingly.
In Figure 3, the distribution of the target variable is depicted. As mentioned in Section 2, class imbalance is a common issue found in wildfire data. This fact is also prominent in the wildfire dataset of Greece as well. The no-fire class depicted is an aggregation over the non-fire classes (i.e., Classes 1–3, see the type feature’s description in Table 1).
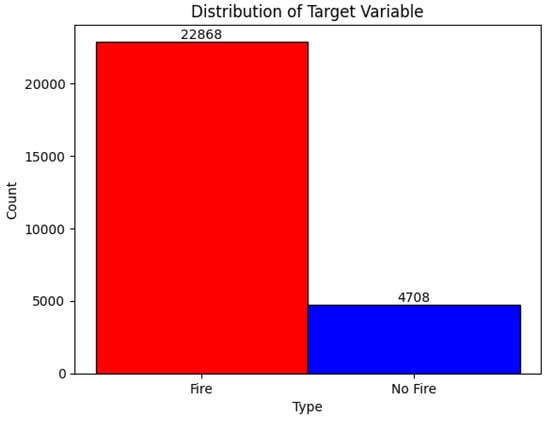
Figure 3.
Distribution of target variable of numerical features in the dataset (fire/no fire).
3.5. Enhanced Dataset Creation with NDVI Integration
NDVI Data Acquisition and Processing
For each thermal detection point defined by coordinates (longitude, latitude), corresponding 2 × 2 km NDVI tiles were retrieved with a spatial resolution of 224 × 224 pixels after preprocessing (512 × 512 original scale).
The integration process involved spatial matching, where each thermal detection was linked to its corresponding NDVI image through a systematic file naming convention using original dataset indices. Quality control procedures ensured file existence, proper format validation, and data integrity checks, resulting in 23,084 usable samples (89.4% retention rate). The remaining 10.6% of samples were cases where the satellite did not have any data on the specific location 14 days prior to the data point needed or there was at least 40% coverage from clouds in the image, therefore making it unsuitable for model training.
The “No Fire” samples were constructed to reflect potential false-positive detections by satellite sensors. These points represent thermal detections that do not correspond to vegetation fires, such as those caused by offshore phenomena or other static land sources. This approach was taken to train the model to distinguish between actual wildfires and other heat sources, a critical challenge in operational systems. While incorporating historical data from the same locations would provide a valuable temporal context, the current dataset’s samples were intentionally sourced from the exact periods of thermal ignition to capture the most relevant environmental conditions directly associated with fire events versus non-fire events. The seasonal variations in Greece’s vegetation, influenced by the Mediterranean climate, make this real-time, event-based sampling crucial for accurate classification rather than historical comparison. This method ensures the model learns the subtle distinctions between true fire ignition points and other thermal anomalies within the specific context. Our approach utilizes the NDVI data as features to enhance classification accuracy (Figure 4).
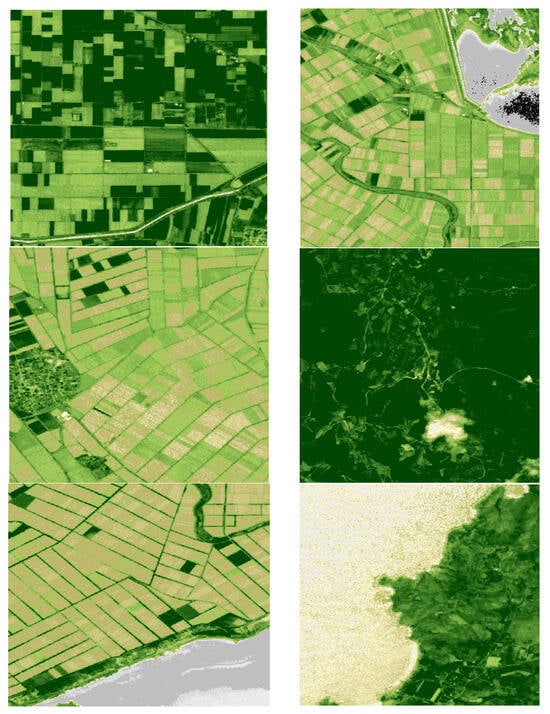
Figure 4.
Sample NDVI images from the dataset.
With the inclusion of available NDVI images, the enhanced wildfire dataset contained the following distribution per class:
- Vegetation Fire (Class 0): 13,362 samples (82.7%).
- Active Volcano (Class 1): 0 samples (0.0%) removed from training. Greece does not have any active volcanoes.
- Other Static Land (Class 2): 1373 samples (8.5%).
- Offshore (Class 3): 1423 samples (8.8%).
3.6. Non-NDVI Model Methodology
3.6.1. Data Preprocessing and Feature Engineering
The data preprocessing phase began with the removal of non-informative or irrelevant features (i.e., features that were deemed unhelpful during model training) from the initial wildfire dataset. The features retained for model training included bright_ti4, bright_ti5, scan, track, temperature_2m_max, temperature_2m_min, temperature_2m_mean, wind_speed_10m_max, elevation, aspect, slope, and daynight.
Features such as longitude, latitude, acq_date, acq_time, satellite, instrument, and confidence were excluded from model training as metadata (e.g., satellite specifications). And precipitation_sum was also removed following exploratory analysis. Frp retrievals are only viable for small and low-intensity fires due to frequent mid-infrared channel saturation [36]; thus, the inclusion of frp may introduce instability into trained models. In addition, frp exhibited a highly skewed distribution (skew = 9.041) and high correlation with bright_ti4 (Pearson ρ = 0.53), which captures the underlying information without redundancy. Precipitation_sum also showed extreme skewness (skew = 6.8), ~79% zero values, and no significant association with the target variable (Pearson ρ ≈ 0.04). Based on these considerations, both variables were discarded for model training.
Moreover, the target variable was constructed using the type feature. Data samples labeled with type = 0 were categorized as fire events, and samples with type ≠ 0 as non-fire events.
All numerical features were normalized using Min-Max scaling [44], transforming their values into the range [0, 1]. For the categorical daynight feature, one-hot encoding was applied, by denoting data samples that occurred during the day with a numerical value of 1, and the samples that occurred at night with 0.
Finally, the preprocessed dataset was divided into training, testing, validation, and sets using a stratified 60/24/16 split, ensuring that the class distribution remained consistent between the training, testing, and validation sets.
3.6.2. Model Selection and Training
For this method, three model types were selected: long short-term memory (LSTM) networks, 1D convolutional neural networks (CNNs), and ensemble models. These architectures are well-suited to time series classification tasks due to their capacity to model sequential dependencies, extract local temporal patterns, and reduce model variance through combined predictions.
Following the model training process, four primary models were selected: two long short-term memory (LSTM) models and two convolutional neural networks (CNNs). For each model type, one version included the Daynight feature, while the other excluded it.
The rationale behind this separation stems from the assumption that temporal context—specifically, whether the observation occurred during the day or night—may influence the model’s ability to accurately distinguish wildfire events. For example, high values of thermal bands such as Bright_ti4 and Bright_ti5 during daylight hours may be ambiguous, as they could be caused by sunlight, surface heat, or wildfire activity. In contrast, similar readings at night are more likely to be indicative of actual fire events, given the absence of solar heating.
By training and evaluating models both with and without the DayNight feature, this study aimed to empirically test whether incorporating such temporal metadata enhances classification performance.
Architecture optimization, in each individual model, was performed using the Keras Tuner framework [45]. Key hyperparameters—including the number of LSTM/CNN layers, units or filters per layer, L2 regularization, and dropout rate—were tuned within predefined ranges (see Table 2 and Table 3). A random search strategy was applied with four trials and two executions per trial. Model performance was evaluated with the loss on the validation set as the objective, and early stopping was employed to prevent overfitting. During all executions and trials, the architecture achieving the lowest validation loss was retained as the resulting model in each iteration of the Keras tuner.

Table 2.
LSTM model tuner hyperparameter search space.

Table 3.
CNN model tuner hyperparameter search space.
3.6.3. LSTM Model Architecture
The LSTM models were constructed using a modular architecture. The grid search explored configurations beginning with an input layer, followed by one to four stacked LSTM layers. A final LSTM layer preceded the output layer, which used sigmoid activation for binary classification. Each LSTM layer output was passed through a batch normalization layer to stabilize learning. The final LSTM layer also included dropout regularization, and all hidden layers were regularized using L2 penalties to mitigate overfitting.
Due to the absence of strong temporal trends in the wildfire dataset, the input sequence length was set to one, effectively capturing short-term dependencies rather than long-range ones.
The consistent improvements across precision, recall, and F1-score demonstrate that the LSTMs are more effective in handling the class imbalance and generalizing to unseen data in the specific dataset of the study. While the resulting LSTM models use a sequence length of one—thus not leveraging temporal dependencies—the architecture still demonstrates a performance advantage. This can be attributed to the LSTM’s gated structure, which enables the learning of complex, non-linear interactions among heterogeneous input variables, including meteorological, satellite, and topographical features.
3.6.4. CNN Model Architecture
A similar architecture search was applied to the 1D CNN models. Each model began with a 1D convolutional input layer followed by a batch normalization layer. One to four additional 1D convolutional layers formed the hidden layers, each followed by batch normalization. The final layers included another 1D convolutional layer, a dropout layer, a flattening layer, and a sigmoid-activated output layer.
3.6.5. Ensemble Models
Ensemble learning was also employed to improve generalization. The ensemble combined model outputs from independently trained LSTM and CNN models. Two voting strategies were applied: majority voting and average probability voting. These methods help mitigate individual model biases and reduce variance, thus improving classification robustness [46].
3.6.6. Training Procedure
All architectures derived from the Keras Tuner were trained under the following parameters:
- Learning Rate:
- Batch Size: 32;
- Epochs: 30;
- Optimizer: Adam;
- Loss Function: Binary Cross-Entropy;
- Training Evaluation Metric: accuracy.
Early stopping was applied with a patience of three epochs, monitoring validation loss to restore the best weights from training. Four maximum trials were executed with two runs per trial. Although recall was considered an alternative training evaluation metric due to the potential class imbalance, empirical results showed that accuracy-optimized models consistently outperformed those trained with recall as the primary evaluation metric.
3.7. NDVI Model Methodology (Multimodal Architecture Design)
In the case of the multimodal model method, the enhanced version of the wildfire dataset, containing NDVI images, was leveraged. More specifically, a CNN architecture was favored for processing NDVI image data, while a multilayer perceptron (MLP) architecture was used for the numerical features of the dataset. Finally, multimodal fusion combines both feature streams through concatenation and hierarchical encoding. The enhanced wildfire dataset was partitioned using stratified sampling, ensuring class balance between the following sets of data:
- Training set: 16,158 samples (70%);
- Validation set: 2309 samples (10%);
- Test set: 4617 samples (20%).
3.7.1. CNN Branch for NDVI Image Processing
The convolutional neural network branch processes inputs of RGB NDVI images (3 × 224 × 224) through a hierarchical feature extraction architecture. Table 4 provides details of each convolution layer. Every convolution layer is paired with a batch normalization layer. After the final convolution block, global average pooling is used to reduce feature map spatial dimensions. This is followed by two fully connected layers: the first receives a 256-dimensional input and outputs 128 units, with a dropout rate 0.5 for regularization; the second fully connected layer maintains the dimensionality at 128 units with a 0.3 dropout rate. The final output of the network is a 128-dimensional feature vector.

Table 4.
CNN architecture specifications.
3.7.2. MLP Branch for Numerical Feature Processing
The multilayer perceptron (MLP) branch processes 12 standardized numerical features of the wildfire dataset through dense layers. The input of the MLP is a 12-dimensional input layer that receives the numerical features that are standardized. Next, the detailed description of the fully connected layers is shown in Table 5. Lastly, the output layer is a 128-dimension feature vector.

Table 5.
MLP architecture specifications.
3.7.3. Feature Fusion and Classification
The multimodal fusion combines both feature streams, mentioned above, through concatenation and hierarchical encoding. More specifically, the outputs of the CNN and MLP branch are concatenated into a unified 256-dimensional feature vector. This combined feature vector is then passed through an encoder consisting of two fully connected layers that reduce the dimensionality from 256 to 128 and 128 to 64, respectively. Each layer in the encoder contains batch normalization accompanied by ReLU activation, and dropout. Finally, the classifier module maps the 64-dimensional encoded vector to a 32-unit dense layer, and subsequently to the output layer with 3 units corresponding to the classification classes. Finally, the softmax activation function is applied at the output layer to yield class probabilities.
3.8. Training Process and Optimization Strategies for the Multimodal Approach
3.8.1. Hyperparameter Optimization Framework
Four distinct training configurations were systematically evaluated to identify optimal hyperparameters:
- Configuration 1: Stochastic Gradient Descent with Step Decay
The model was trained using the Stochastic Gradient Descent (SGD) optimizer with a momentum of 0.9 for accelerated convergence. The initial learning rate was set to and decayed by a factor of γ = 0.3 every 25 epochs, resulting in a stepwise schedule of , , and . A batch size of 32 was used for training, and a weight decay of was applied. Early stopping was employed, and training concluded at epoch 71 based on validation loss, while the whole training procedure was scheduled for 100 epochs.
- Configuration 2: AdamW with Cosine Annealing
This configuration utilized the AdamW optimizer. The initial learning rate was set to and followed a cosine annealing schedule, gradually decreasing over the course of training to achieve convergence in later epochs. A batch size of 24 was used, along with a weight decay of . Although training was configured for a maximum of 100 epochs, early stopping was applied, and training concluded after 63 epochs based on validation loss.
- Configuration 3: Adam with Exponential Decay
In this setup, the Adam optimizer was employed with an initial learning rate of 0.003, which decayed exponentially with a γ decay factor of 0.95 per epoch, batch size of 16, and weight decay of . Due to early stopping, training halted at epoch 92 during 100-epoch training, while monitoring validation loss.
- Configuration 4: SGD with Aggressive Step Decay
The final configuration used SGD with momentum set to 0.9. The initial learning rate was set to , with an aggressive step decay applied every 15 epochs using a γ decay factor of 0.5. A batch size of 48 was selected, and a weight decay of was used to prevent overfitting. Training was configured for 100 epochs but concluded at 75 epochs due to early stopping based on validation loss.
3.8.2. Regularization and Training Infrastructure
To mitigate overfitting and enhance model generalization, a comprehensive regularization strategy was employed. In the CNN branch, progressive dropout was applied, decreasing from 0.5 to 0.3 in subsequent layers. The MLP branch maintained a consistent dropout rate of 0.3 across layers, with a reduced rate of 0.21 in the final layer. Batch normalization was systematically applied after each convolutional and fully connected layer. Additionally, variable weight decay values ranging from to were fine-tuned across different configurations.
Training was conducted using cross-entropy loss, suitable for the multi-class classification task. Early stopping with a patience of 10 epochs was implemented, monitoring validation loss to prevent potential overfitting. The data pipeline involved standardization of numerical inputs using StandardScaler, combined with zero-tensor substitution. Finally, model training was performed on CUDA-enabled hardware, with 16 parallel data loader workers.
4. Results and Discussion
4.1. Non-NDVI Models (Ensemble Method)
4.1.1. Model Architectures
The first CNN model’s architecture, in which Daynight is not included, is visualized in Figure 5a, while Figure 6a displays the model’s architecture in more detail. Next, details about the CNN with Daynight are observed in Figure 5b and Figure 6b. It can be observed that both models share a similar architecture with the CNN model with Daynight containing an extra block of Conv 1D and batch normalization layers as opposed to the CNN model without Daynight.

Figure 5.
Resulting CNN architectures. (a) contains Daynight, while (b) does not.
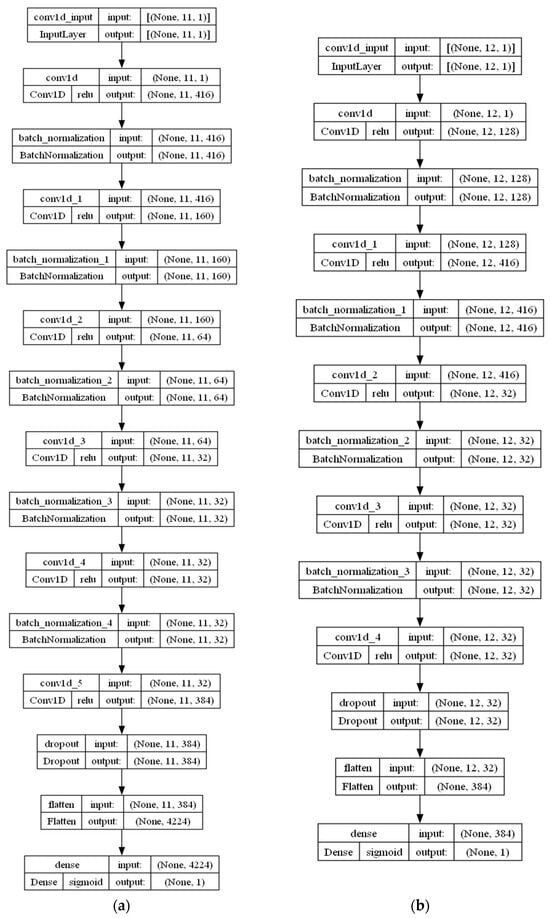
Figure 6.
Detailed model architecture of resulting CNNs. (a) depicts model without Daynight, while (b) depicts the model with Daynight.
Correspondingly, Figure 7 and Figure 8 contain information about the architectures of LSTM models. In particular, an additional block of LSTM and batch normalization layers is present in the model with the Daynight feature when compared to the same type of model without the Daynight feature, as is the case with the CNN models.

Figure 7.
Resulting LSTM architectures. (a) contains Daynight, while (b) does not.
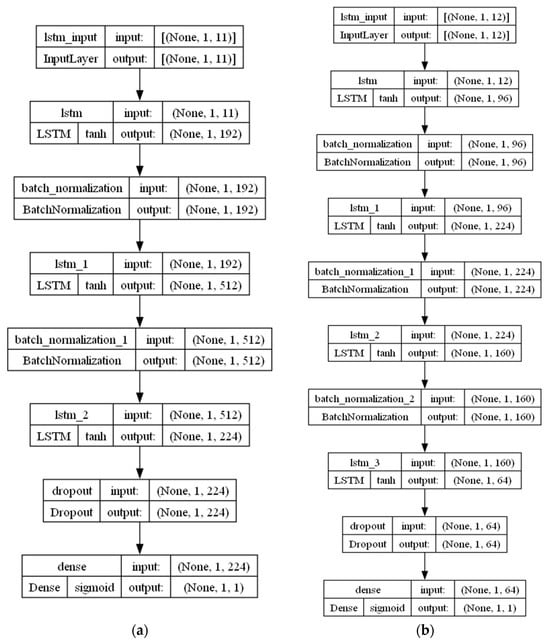
Figure 8.
Detailed model architecture of resulting LSTMs. (a) depicts model without Daynight, while (b) depicts the model with Daynight.
In Figure 8 and Table 6, we can observe how the models without Daynight are larger than models with the Daynight feature. Subsequently, the CNN models exhibit a simpler architecture compared to the LSTM models, with the LSTM without Daynight being the biggest model with approximately 2.2 million parameters.

Table 6.
Number of parameters of each model.
4.1.2. Model Training
In Figure 9 and Table 7, it is observed that the models display consistent behavior in both training and testing data, as well as with the absence of major model overfitting. In all cases, the model weights and biases were retrieved from the epoch during training that resulted in the minimum validation loss. For instance, in the training plot of LSTM with Daynight, it is evident that in the last epochs, the model begins to overfit; however, due to early stopping and in retrieving the weights described earlier, the weights of the model belong to the tenth epoch.
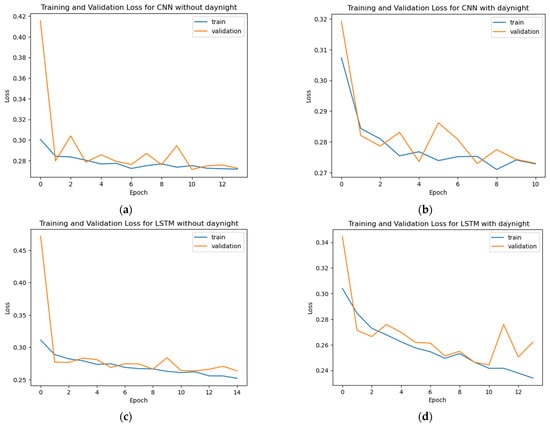
Figure 9.
Training and validation loss of each individual model.

Table 7.
Training metrics for each model (%).
4.1.3. Individual Model Evaluation
As displayed in Figure 10, all models demonstrated comparable performance in classifying the fire class but substantial differences emerged in their handling of the no-fire class. The CNN models consistently underperformed in this regard, with higher false positive rates and lower true negative counts. In contrast, the LSTM models yielded better performance in classifying no-fire instances. Among these, the LSTM model with the Daynight feature achieved the best results, outperforming all others in terms of both recall and precision for the minority class. Alternatively, the CNN model with Daynight produced the weakest results.
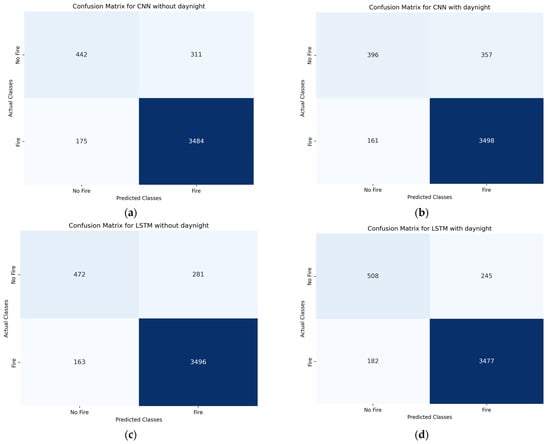
Figure 10.
Confusion matrices of individual models on validation data.
Finally, regarding the Area Under the ROC Curve (AUC), the LSTM with Daynight achieved the highest AUC score of 92. This was followed by the LSTM without Daynight at 91, while both CNN variants (with and without Daynight) yielded an AUC score of 89 (see Figure 11).
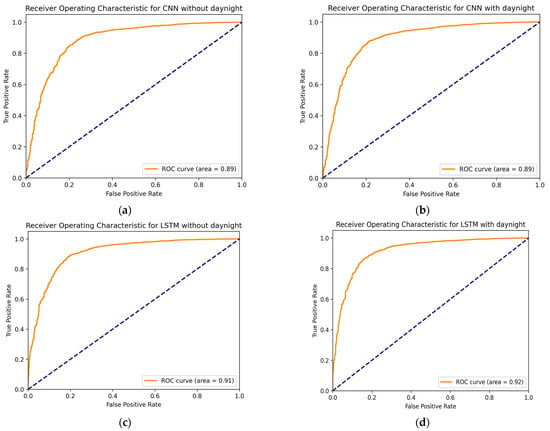
Figure 11.
ROC plot of each individual model.
Table 8, Table 9, Table 10 and Table 11 include the classification reports for each individual model, based on their performance on the validation dataset. As expected, due to class imbalance, all models demonstrated high precision, recall, and F1-scores in the fire class.

Table 8.
Classification report of CNN model without Daynight on validation data (%).

Table 9.
Classification report of CNN model with Daynight on validation data (%).

Table 10.
Classification report of LSTM model without Daynight on validation data (%).

Table 11.
Classification report of LSTM model with Daynight on validation data (%).
The CNN model without the Daynight feature achieved a recall of 59% for the no-fire class, while the CNN model with Daynight underperformed slightly at 53%. The LSTM models outperformed the CNNs in this regard, achieving 63% recall without Daynight and 67% recall with Daynight. Overall, classification reports indicate that the LSTM model incorporating the Daynight feature is identified as the best-performing individual model.
The LSTM models consistently outperformed the CNN models across all evaluation metrics, as evidenced by the classification reports in Table 8, Table 9, Table 10 and Table 11. These results highlight the LSTM models’ superior ability to correctly classify no-fire events, which are underrepresented in the dataset. The consistent improvements across precision, recall, and F1-score demonstrate that the LSTMs are more effective in handling the class imbalance and generalizing to unseen data in the specific dataset of the study.
While the resulting LSTM models use a sequence length of one—thus not leveraging temporal dependencies—the architecture still demonstrates a performance advantage. This can be attributed to the LSTM’s gated structure, which enables the learning of complex, non-linear interactions among heterogeneous input variables, including meteorological, satellite, and topographical features. In the context of wildfire events that are sparse, temporally irregular and geographically scattered, the CNN architecture, whose bias favors local spatial or temporal continuity, is less effective at capturing the relevant patterns necessary for accurate classification.
4.1.4. Ensemble Model Evaluation
Following the evaluation of individual models, ensemble modeling ensues. Through an extensive search, the models for each ensemble method are shown in Table 12. In particular, the average voting ensemble consisted of all the individual models, while the majority voting ensemble did not contain only a CNN with Daynight.

Table 12.
Models in each ensemble method.
The ensemble model with average vote yielded the best results compared to all the individual models and the ensemble model with majority vote. The ensemble method with average vote obtained a 73% recall and 90% overall accuracy (see Figure 12, Table 13, Table 14), 6% higher than the LSTM with Daynight (i.e., the best-performing individual model).
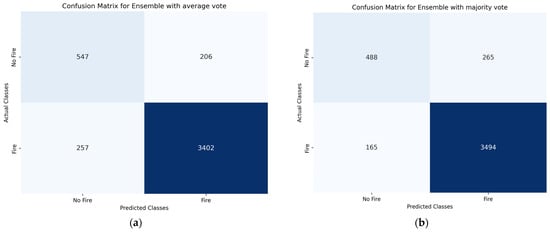
Figure 12.
Confusion matrices of ensemble method on validation data.

Table 13.
Classification report of ensemble with average vote on validation data (%).

Table 14.
Classification report of ensemble with majority vote on validation data (%).
4.2. NDVI Models (Multimodal Architecture)
4.2.1. Performance Comparison of Multimodal Architecture Configurations
Table 15 and Figure 13 show comparative results between the individual multimodal configurations. Out of the four approaches, the SGD step decay yielded the best results by achieving 96.15% accuracy on the validation set of the enhanced wildfire dataset.

Table 15.
Multimodal configuration comparison.
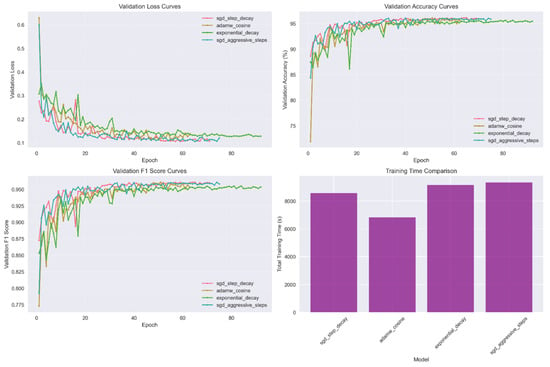
Figure 13.
Validation plots for multimodal model configurations.
4.2.2. Best Multimodal Model Performance Analysis
The SGD with step decay configuration demonstrated strong convergence and generalization capabilities. Over the course of model training, the training loss decreased significantly from 0.396 to 0.102, representing a 74% reduction. Similarly, the validation loss declined from 0.277 to 0.106, resulting in a 62% shift. The minimal generalization gap between training and validation losses (0.102 vs. 0.106) highlights the effectiveness of the regularization strategy and indicates that the model maintained a balanced fit without the presence of overfitting (see Figure 14 and Figure 15).
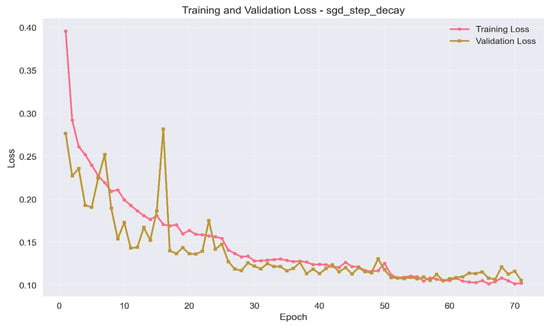
Figure 14.
Training and validation loss plot of SGD with step decay configuration.
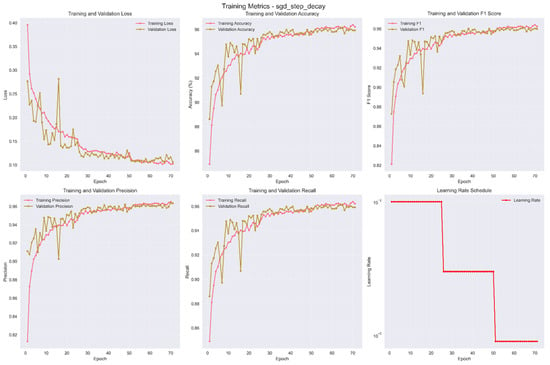
Figure 15.
Training metrics of SGD with step decay configuration.
The three-phase step decay learning rate (LR) schedule demonstrated superior convergence:
- Phase 1 (LR = , epochs 1–25): Rapid initial feature discovery.
- Phase 2 (LR = , epochs 26–50): Fine-tuning and stability improvement.
- Phase 3 (LR = , epochs 51–71): Final convergence optimization.
The results in Table 16 and the confusion matrix in Figure 16 highlight the effectiveness of the SGD with step decay configuration in handling class imbalance within the enhanced wildfire dataset. Notably, the model demonstrates strong generalization to the undersampled classes, particularly Other Static Land and Offshore, achieving F1-scores of 0.893 and 0.815, respectively.

Table 16.
Per-class performance on test set of enhanced wildfire dataset.
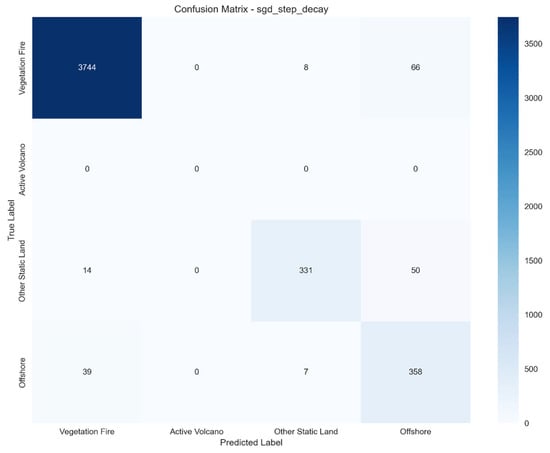
Figure 16.
Confusion matrix of SGD with step decay.
4.3. Comparative Analysis Between Non-NDVI Models (Ensemble Method) and NDVI Models (Multimodal Method)
Performance Comparison with Non-NDVI Models
To evaluate the effectiveness of NDVI integration, the multimodal approach was compared against the other models using only numerical features. Table 17 and Table 18 demonstrate that the multimodal approach yields significant results compared to the traditional approach where models were only trained on numerical features of the wildfire dataset. In particular, there is a performance gain of 6.15% accuracy compared to the ensemble average voting method.

Table 17.
Comparative results between non-NDVI models on the wildfire dataset.

Table 18.
NDVI-integrated multimodal performance on the wildfire dataset.
The non-NDVI approach requires training and storing four separate models (two CNNs and two LSTMs) with ensemble inference adding computational overhead and complexity. In contrast, the multimodal architecture combines image and numerical inputs into a single model, streamlining the inference pipeline, reducing memory while achieving better performance—highlighting its practicality for real-time wildfire classification.
The integration of NDVI imagery data yielded measurable improvements in model performance. NDVI provided enhanced spatial context by capturing vegetation health, which aided in the correct classification of the fire/no-fire classes. The multimodal CNN-MLP architecture facilitated robust feature representation by jointly learning spatial patterns from imagery and numerical relationships. This configuration resulted in improved generalization, achieving a validation accuracy of 96.15%, and demonstrated strong class discrimination—most notably, an F1-score of 98.3% for vegetation fire classification. Overall, the multimodal approach outperformed its single-modality counterparts, ensuring the additional complexity introduced by NDVI integration and establishing a promising architecture for operational wildfire monitoring systems.
4.4. Individual Model Interpretability
SHAP Value Analysis on Individual Models
To elaborate on model interpretability, SHapley Additive exPlanation (SHAP) summary plots were generated for all four individual models with a random sample of 100 validation data records in each case. It is important to note that SHAP values, while informative, do not provide a complete explanation of the models’ decision processes.
For the CNN models (Figure 17a,b), SHAP analysis indicated that bright_ti4, bright_ti5, and elevation were the dominant predictors of wildfire classification. When included, the Daynight feature ranked third in importance, with its two states exerting opposite effects on classification—one increasing the likelihood of fire and the other reducing it—allowing the model to adjust outputs according to day or night conditions.
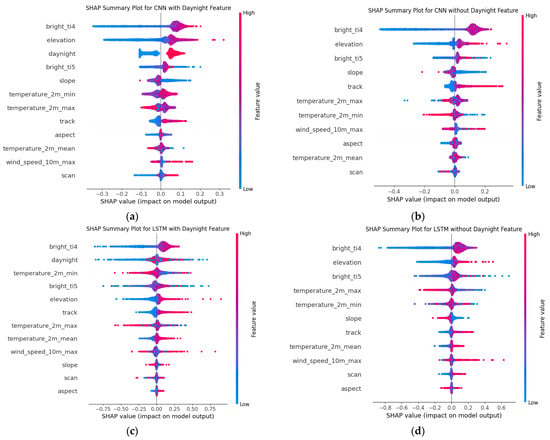
Figure 17.
SHAP summary plots for individual CNN and LSTM models. Features are ranked by the mean absolute SHAP value in descending order, with the most influential predictors shown at the top.
With the absence of the Daynight the feature, the CNN relied on bright_ti4, bright_ti5, and elevation as the dominant variables. The SHAP distributions show that while bright_ti4 maintained the widest influence across samples, many other features—including slope, aspect, and scan—remained zero-centered, indicating limited contribution to the model’s behavior.
For the LSTM models, bright_ti4, bright_ti5, and elevation were the most influential features, with Daynight also ranking high in feature importance when included, as in the CNN case. However, unlike in the CNN case, the SHAP values for Daynight were more centered around zero, indicating that its influence was weaker and more context-dependent. This suggests that the sequential architecture of the LSTM already captures part of the temporal signal, reducing reliance on the explicit Daynight input. Meteorological variables such as temperature (2m min, max, mean) and wind speed exhibited valuable influence, while topographic features such as slope and aspect had limited impact. The exclusion of the Daynight feature increased the LSTM models’ dependency on elevation and temperature-related variables.
5. Conclusions
5.1. Conclusions
In conclusion, through this study, a novel wildfire dataset for wildfires in Greece was created and analyzed, that included satellite data from LANCE FIRMS [38], meteorological data from Open Meteo Api [42], and topographic data from the Google Earth Engine API [38]. The dataset was enhanced with the addition of images from Copernicus [37], representing 2 × 2 km of NDVI tiles for each thermal detection point.
Two approaches for model training were carried out, one that included only numerical features of the wildfire dataset and a second multimodal approach that leveraged both numerical and satellite imagery data.
In the former case, two types of different neural networks were trained, an LSTM and a CNN-type neural network. The best individual model (LSTM with DayNight) achieved 67% recall on the undersampled class as well as 90% overall accuracy on the validation dataset. Furthermore, the inclusion of a feature that can describe whether a wildfire occurred during day or night (Daynight feature) proved to be a valuable asset for wildfire classification. Finally, the average voting combination of all the models yielded the best results in all the models tested for ensembling, scoring 73% recall on the undersampled class while attaining 90% overall accuracy on the validation set of wildfire data and outperforming every other individual model.
In the multimodal approach, a hybrid CNN-MLP architecture was developed to process both satellite imagery and numerical features. Amongst four training configurations, the SGD optimizer with step decay yielded the best results. This configuration outperformed the ensemble method approach with a performance gain of 6.15% validation accuracy.
Unlike prior studies that rely on risk mapping or conventional ML methods, this research provides a unified deep learning framework that adapts to the diverse and imbalanced characteristics of wildfire data in Greece. This improvement and the elimination of ensemble complexity demonstrates that spatial vegetation context through NDVI integration provides discriminative power for fire-type classification, establishing a new benchmark for satellite-based fire detection systems. Moreover, the proposed Greek wildfire dataset contributes to closing a regional gap in wildfire classification research, offering a foundation for future work in Mediterranean regions.
5.2. Limitations of the Study
This study focuses on wildfire data in Greece, which limits the ability of the models to be generalized to other regions due to differences in climate, vegetation, and different terrain types. Additionally, the wildfire dataset focuses only on Greek wildfires from 2017 to 2021. The inclusion of additional historical data allows for better comprehensive analysis.
While this study emphasizes recall for the minority (no-fire) class, standard metrics such as overall accuracy, though promising, may not fully capture the model’s practical performance in operational early-stage wildfire classification systems.
5.3. Future Work
A potential next step in enriching this study is the inclusion of more variables in the wildfire dataset, such as data from different satellites, meteorological data, and vegetation data. Furthermore, the addition of different countries in the wildfire dataset could produce more prominent results, as the data found in the study was exclusive to the region of Greece. Moreover, different neural network types and architectures could be viable and useful in wildfire classification. Lastly, a practical extension of this study that will leverage the models created is the development of a real-time wildfire dashboard. By gathering available data from the sources highlighted in this study, near real-time wildfire classification in monitoring dashboards could be a viable asset in operational wildfire monitoring systems.
Author Contributions
I.P.: conceptualization, data curation, formal analysis, investigation, methodology, resources, software, validation, visualization, and writing—original draft. V.L.: conceptualization, data curation, formal analysis, investigation, methodology, resources, software, validation, visualization, writing—original draft, and writing—review and editing. M.D.: conceptualization, investigation, methodology, project administration, resources, supervision, validation, writing—original draft, and writing—review and editing. All authors have read and agreed to the published version of the manuscript.
Funding
This research received no external funding.
Data Availability Statement
The datasets presented in this article are not readily available because the data are part of an ongoing study. Requests to access the datasets should be directed to vlinardos@ihu.edu.gr.
Conflicts of Interest
The authors declare no conflicts of interest.
References
- Statista. Economic Impacts Caused by Wildfires Worldwide 1991–2023. 16 November 2023. Available online: https://www.statista.com/statistics/1423714/economic-impact-due-to-wildfires-worldwide/ (accessed on 25 June 2024).
- Kourtali, E. Soaring Cost of Forest Fires. kathimerini.gr. 6 October 2023. Available online: https://www.ekathimerini.com/economy/1221759/soaring-cost-of-forest-fires/ (accessed on 25 June 2024).
- Climate Change Indicators: Wildfires|US EPA. US EPA. 23 July 2024. Available online: https://www.epa.gov/climate-indicators/climate-change-indicators-wildfires (accessed on 25 June 2024).
- GRID 2024. 2024 Global Report on Internal Displacemen. IDMC, NRC. 2024. Available online: https://www.internal-displacement.org/global-report/grid2024/ (accessed on 10 June 2025).
- Linardos, V.; Drakaki, M.; Tzionas, P.; Karnavas, Y. Machine Learning in Disaster Management: Recent Developments in Methods and Applications. Mach. Learn. Knowl. Extr. 2022, 4, 446–473. [Google Scholar] [CrossRef]
- Pelletier, N.; Millard, K.; Darling, S. Wildfire likelihood in Canadian treed peatlands based on remote-sensing time-series of surface conditions. Remote Sens. Environ. 2023, 296, 113747. [Google Scholar] [CrossRef]
- Janiec, P.; Gadal, S. A Comparison of Two Machine Learning Classification Methods for Remote Sensing Predictive Modeling of the Forest Fire in the North-Eastern Siberia. Remote Sens. 2020, 12, 4157. [Google Scholar] [CrossRef]
- Bjånes, A.; De La Fuente, R.; Mena, P. A deep learning ensemble model for wildfire susceptibility mapping. Ecol. Inform. 2021, 65, 101397. [Google Scholar] [CrossRef]
- Bhowmik, R.T.; Jung, Y.S.; Aguilera, J.A.; Prunicki, M.; Nadeau, K. A multi-modal wildfire prediction and early-warning system based on a novel machine learning framework. J. Environ. Manag. 2023, 341, 117908. [Google Scholar] [CrossRef] [PubMed]
- Kantarcioglu, O.; Kocaman, S.; Schindler, K. Artificial neural networks for assessing forest fire susceptibility in Türkiye. Ecol. Inform. 2023, 75, 102034. [Google Scholar] [CrossRef]
- Pham, K.; Ward, D.; Rubio, S.; Shin, D.; Zlotikman, L.; Ramirez, S.; Poplawski, T.; Jiang, X. California Wildfire Prediction using Machine Learning. In Proceedings of the 2022 21st IEEE International Conference on Machine Learning and Applications (ICMLA), Nassau, Bahamas, 12–14 December 2022; pp. 525–530. [Google Scholar] [CrossRef]
- Malik, A.; Jalin, N.; Rani, S.; Singhal, P.; Jain, S.; Gao, J. Wildfire Risk Prediction and Detection using Machine Learning in San Diego, California. In Proceedings of the 2021 IEEE SmartWorld, Ubiquitous Intelligence & Computing, Advanced & Trusted Computing, Scalable Computing & Communications, Internet of People and Smart City Innovation (SmartWorld/SCALCOM/UIC/ATC/IOP/SCI), Atlanta, GA, USA, 18–21 October 2021; pp. 622–629. [Google Scholar] [CrossRef]
- Ding, C.; Zhang, X.; Chen, J.; Ma, S.; Lu, Y.; Han, W. Wildfire detection through deep learning based on Himawari-8 satellites platform. Int. J. Remote Sens. 2022, 43, 5040–5058. [Google Scholar] [CrossRef]
- Bergado, J.R.; Persello, C.; Reinke, K.; Stein, A. Predicting wildfire burns from big geodata using deep learning. Saf. Sci. 2021, 140, 105276. [Google Scholar] [CrossRef]
- Zhang, H.; Zheng, Z.; Wen, G. Wildfire Monitoring Based on LSTM and Deep Learning. In Proceedings of the IGARSS 2022–2022 IEEE International Geoscience and Remote Sensing Symposium, Kuala Lumpur, Malaysia, 17–22 July 2022; pp. 2682–2685. [Google Scholar] [CrossRef]
- Linardos, V.; Drakaki, M. Assessing the Impact of the 2021 Evia Wildfires through Social Media Analysis. In Proceedings of the International Conference on Humanitarian Crisis Managment (KRISIS 2023), Thessaloniki, Greece, 14–15 October 2023. [Google Scholar]
- Christidou, A.N.; Drakaki, M.; Linardos, V. A Machine Learning Based Method for Automatic Identification of Disaster Related Information Using Twitter Data. In Intelligent and Fuzzy Systems; Kahraman, I.C., Tolga, A.C., Cevik Onar, S., Cebi, S., Oztaysi, B., Sari, I.U., Eds.; Springer International Publishing: Cham, Switzerland, 2022; Volume 505, pp. 70–76. [Google Scholar] [CrossRef]
- Linardos, V.; Drakaki, M.; Tzionas, P. Utilizing LLMs and ML Algorithms in Disaster-Related Social Media Content. GeoHazards 2025, 6, 33. [Google Scholar] [CrossRef]
- Lee, W.; Kim, S.; Lee, Y.-T.; Lee, H.-W.; Choi, M. Deep neural networks for wild fire detection with unmanned aerial vehicle. In Proceedings of the 2017 IEEE International Conference on Consumer Electronics (ICCE), Las Vegas, NV, USA, 8–10 January 2017. [Google Scholar]
- Ali, A.W.; Kurnaz, S. Optimizing Deep Learning Models for Fire Detection, Classification, and Segmentation Using Satellite Images. Fire 2025, 8, 36. [Google Scholar] [CrossRef]
- Wen, Z.; Gu, F. Wildfire Detection Based on Satellite Images Using Deep Learning. In Proceedings of the 2025 8th International Conference on Artificial Intelligence and Big Data (ICAIBD), Chengdu, China, 23–26 May 2025; pp. 689–694. [Google Scholar] [CrossRef]
- Muhammad, K.; Ahmad, J.; Baik, S.W. Early fire detection using convolutional neural networks during surveillance for effective disaster management. Neurocomputing 2018, 288, 30–42. [Google Scholar] [CrossRef]
- Schroeder, W.; Oliva, P.; Giglio, L.; Csiszar, I.A. The New VIIRS 375 m active fire detection data product: Algorithm description and initial assessment. Remote Sens. Environ. 2014, 143, 85–96. [Google Scholar] [CrossRef]
- World Bank Climate Change Knowledge Portal. Available online: https://climateknowledgeportal.worldbank.org/country/greece/climate-data-historical (accessed on 1 July 2024).
- Berkley, K. The Cost of European Wildfires 2023 Report. KnowHow. 4 January 2024. Available online: https://knowhow.distrelec.com/internet-of-things/the-cost-of-european-wildfires-2023-report/ (accessed on 25 June 2024).
- Koundouri, P. Urgent call for comprehensive governmental climate action against wildfires in Greece. npj Clim. Action 2023, 2, 42. [Google Scholar] [CrossRef]
- Kolanek, A.; Szymanowski, M.; Raczyk, A. Human Activity Affects Forest Fires: The Impact of Anthropogenic Factors on the Density of Forest Fires in Poland. Forests 2021, 12, 728. [Google Scholar] [CrossRef]
- Aspect Definition|GIS Dictionary. Available online: https://support.esri.com/en-us/gis-dictionary/aspect (accessed on 26 July 2025).
- Elevation. Available online: https://education.nationalgeographic.org/resource/elevation/ (accessed on 20 June 2024).
- Ropelato, J. Elevation Maps. WhiteClouds. 15 June 2023. Available online: https://www.whiteclouds.com/articles/elevation-maps/ (accessed on 20 June 2024).
- Slope and Landscape Features—AGSite. Available online: https://agsite.missouri.edu/slope-and-landscape-features/ (accessed on 20 June 2024).
- Makhaya, Z.; Odindi, J.; Mutanga, O. The influence of bioclimatic and topographic variables on grassland fire occurrence within an urbanized landscape. Sci. Afr. 2022, 15, e01127. [Google Scholar] [CrossRef]
- Chen, Y.; Morton, D.C.; Randerson, J.T. Remote sensing for wildfire monitoring: Insights into burned area, emissions, and fire dynamics. One Earth 2024, 7, 1022–1028. [Google Scholar] [CrossRef]
- Devlin, M. The Unpredictable Force: Exploring the Impact of Wind on Wildfire Spread. Kestrel. 30 July 2024. Available online: https://kestrelinstruments.com/blog/the-unpredictable-force-exploring-the-impact-of-wind-on-wildfire-spread (accessed on 10 July 2024).
- Chalepinis, K.; Walters, A.; Fang, B.; Lakshmi, V.; Gemitzi, A. A soil moisture and vegetation-based susceptibility mapping approach to wildfire events in Greece. Remote Sens. 2024, 16, 1816. [Google Scholar] [CrossRef]
- Ba, R.; Song, W.; Lovallo, M.; Zhang, H.; Telesca, L. Informational analysis of MODIS NDVI and EVI time series of sites affected and unaffected by wildfires. Phys. A Stat. Mech. Its Appl. 2022, 607, 127911. [Google Scholar] [CrossRef]
- Wikipedia Contributors. Open Data Portal. Wikipedia. 17 April 2024. Available online: https://en.wikipedia.org/wiki/Open_data_portal (accessed on 17 April 2024).
- NRT VIIRS 375 m Active Fire Product VNP14IMGT Distributed from NASA FIRMS. Available online: https://earthdata.nasa.gov/firms (accessed on 10 June 2025).
- European Space Agency. Sentinel-2 Level-1C Imagery. Copernicus Data Space Ecosystem. 2024. Available online: https://dataspace.copernicus.eu/browser/ (accessed on 16 July 2025).
- Gorelick, N.; Hancher, M.; Dixon, M.; Ilyushchenko, S.; Thau, D.; Moore, R. Google Earth Engine: Planetary-scale geospatial analysis for everyone. Remote Sens. Environ. 2017, 202, 18–27. [Google Scholar] [CrossRef]
- What Is a Digital Elevation Model (DEM)?|U.S. Geological Survey. 7 November 2018. Available online: https://www.usgs.gov/faqs/what-a-digital-elevation-model-dem (accessed on 10 July 2024).
- Zippenfenig, P. Weather API [Computer software]. Zenodo 2023. [Google Scholar] [CrossRef]
- Welle, D. Greece Battles New Wildfire on Evia Island. dw.com. 23 August 2021. Available online: https://www.dw.com/en/greece-wildfires-new-blaze-hits-evia-island/a-58954794 (accessed on 25 June 2024).
- de Amorim, L.B.V.; Cavalcanti, G.D.C.; Cruz, R.M.O. The choice of scaling technique matters for classification performance. Appl. Soft Comput. 2023, 133, 109924. [Google Scholar] [CrossRef]
- O’Malley, T.; Bursztein, E.; Long, J.; Chollet, F.; Jin, H.; Invernizzi, L. Other. KerasTuner. GitHub. 2019. Available online: https://github.com/keras-team/keras-tuner (accessed on 30 May 2025).
- Mohammed, A.; Kora, R. A comprehensive review on ensemble deep learning: Opportunities and challenges. J. King Saud Univ.—Comput. Inf. Sci. 2023, 35, 757–774. [Google Scholar] [CrossRef]
Disclaimer/Publisher’s Note: The statements, opinions and data contained in all publications are solely those of the individual author(s) and contributor(s) and not of MDPI and/or the editor(s). MDPI and/or the editor(s) disclaim responsibility for any injury to people or property resulting from any ideas, methods, instructions or products referred to in the content. |
© 2025 by the authors. Licensee MDPI, Basel, Switzerland. This article is an open access article distributed under the terms and conditions of the Creative Commons Attribution (CC BY) license (https://creativecommons.org/licenses/by/4.0/).