Abstract
In this paper, an innovative method consisting of the construction of an artificial dune reinforced with a composite made by combining sand and seagrass wrack is presented. The performance of this reinforced dune is compared with sand-only dunes, built at the same time, through data collected during 17 field campaigns (covering a period of one year) carried out with an unmanned aerial vehicle (UAV), whose images allow digital elevation models (DEMs) to be built. The results show that, in the medium term, while the sand-only dunes lose much of their volume (up to 25% of the refilled sediment), the reinforced dune only reduces its volume by around 1.4%. In addition, the cross-shore and longitudinal profiles extracted from the DEMs of the dunes indicate that sand-only dunes greatly reduce the elevation of their crests, while the profile of the reinforced dune remains almost unchanged. This suggests that the addition of seagrass wrack can greatly contribute to increasing the resilience of restored dunes and the time between re-fillings, therefore reducing beach protection costs. However, as the results are based on a single wrack–sand dune and have not been replicated, they should be treated with caution. At the same time, this work illustrates how UAVs can acquire the data needed to map coastal restoration works in a fast and economical way.
1. Introduction
In the context of climate change-induced sea level rise, there is a growing perception that the traditional engineering solutions for coastal protection (groins, seawalls, bulkheads, etc.) are unsustainable [1,2] because they may require a large amount of resources for construction and maintenance. Furthermore, traditional solutions can generate negative impacts, such as habitat degradation or even coastal erosion [3].
These growing concerns about traditional engineering solutions, coupled with the pursuit of more sustainable alternatives, have sparked significant interest in the adaptation of nature-based solutions (NBSs) to cope with coastal hazards [4,5]. NBSs, such as salt marshes, dunes, seagrass meadows, or biogenic reefs, have the natural ability to protect shorelines against erosion and flood risks [6]. These NBSs are more cost-effective to maintain in the long-term and more environmentally friendly [7,8] since they can respond better to sea level rise (SLR) and provide added benefits such as a wide variety of ecosystem services [9], although their implementation and development are still in the early stages [10].
Coastal dunes are common morphologies along coastlines [11,12]. They are increasingly recognized as feasible NBSs [13,14] and provide protection against waves and storm surges, preventing coastal flooding [15]. They serve as physical support for various species and offer additional ecosystem services such as tourism and recreation [16]. Nevertheless, they are highly dynamic and fragile systems [17], are very prone to degradation, and have been included in different directives and guidance manuals [18,19,20,21] for their protection because they are among the most threatened habitats [10,22].
Various methods have been used to stabilize coastal dunes, such as reprofiling [23], fencing [24,25], vegetation planting [26], and fencing with native species revegetation [27]. The aim of these methods was to construct stabilized dunes to provide greater protection to the beach from waves and storm surges.
In recent years, increased efforts have been made to build dunes on low-lying beaches to increase their resilience to erosion and flood risk, as well as sea level rise [2,28,29]. Numerous studies of dune restoration and regeneration can be found in the literature [30,31], some of them with different designs to enhance dune protection. Examples of these dune strengthening approaches include the application of geotextiles [32,33]; reinforcing with a rocky core [34,35]; building artificial dunes made with sand, coconut fibers, and wooden poles, combined with a seagrass meadow [10]; using seagrass remnants as berms or interference wind barriers [36]; or the placement of seagrass wrack at the toe of a dune [37].
The present study is aligned with the research of [36,37] and proposes an innovative method for constructing artificial dunes. The method consists of using a composite that combines layers of sand and seagrass wrack. Such wracks are common in coastal areas where seagrass meadows exist and are mostly composed of leaves, stems, and rhizomes [38]. In sandy beaches with gentle slopes, large deposits of seagrass debris can be found covering vast areas of the coast [39,40].
Some authors [41,42,43] pointed out that seagrass wrack plays a protective role on beaches against winter storms. In addition, wrack and seagrass debris stranded on beaches can influence foredune development, trapping sediment transported by wind and supporting the development of a new foredune [44,45]. Furthermore, seagrass beach debris can provide nutrients [46], positively affecting further colonization by plants and contributing to the growth of the incipient foredune [47,48].
Despite these benefits, the perception of these plant accumulations by different stakeholders (beach managers, local administrations, and tourists) is often negative; they consider these deposits removable waste, rather than a natural and valuable component of the coastline [42]. As a consequence, seagrass debris is harvested for biomass exploitation [39] or is removed to allow beach exploitation for tourist activities [49]. Removal of seagrass wrack from beaches in winter and spring could expose beaches to erosion due to storm events, having an impact on beach geomorphology. In addition, its withdrawal can generate the permanent loss of nutrients, affecting ecosystem functioning [41]. Moreover, the removal is usually carried out by mechanical means using heavy machines, which easily collect the sediment mixed with seagrass wrack and can substantially unbalance the sediment budget [39].
The aim of this study is to assess the potential of seagrass wrack in enhancing the stability of restored dunes. A total of 17 unmanned aerial vehicle (UAV) surveys were conducted over a restored dune field, with one section reinforced using the aforementioned composite of sand and seagrass wrack. This study examines the evolution of these dunes, comparing the performance of conventional sand dunes to those that are reinforced. The objective is to determine whether the incorporation of seagrass wrack increases dune resilience. For this reason, the analysis is limited to a single section of the restored area and the temporal evolution of the dune geometry within that section, without considering the interactions between dune morphodynamics and the driving factors (wind, waves, and storm surge).
2. Materials and Methods
2.1. Study Area
The study area is located in the Ebro delta, which is situated in the NW Mediterranean (Figure 1). It has a 50 km long sandy shoreline developed during the last five centuries by sediment transported by the Ebro river. Nevertheless, in recent decades, the dramatic reduction in sediment supply [50] caused by the construction of many dams along its course resulted in the redistribution of limited sediment reaching the sea. The redistribution of sediment has generated a net longshore sediment transport directed towards the south in the southern hemidelta and towards the north in the northern part of the delta [51]. This has led to the formation of two sand spits at the ends of the delta, with an accretionary behavior, whereas erosion of the shoreline prevails at other stretches. At present, it is estimated that almost 80% of the Ebro delta shoreline is subject to erosive processes [52].
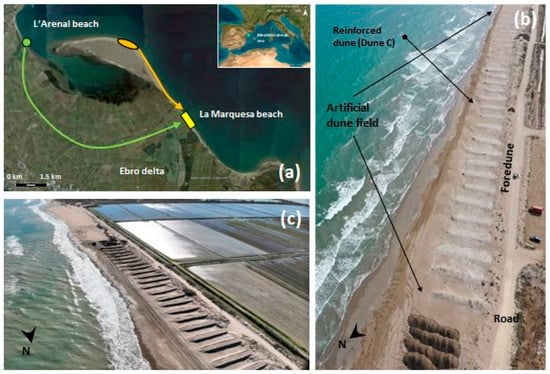
Figure 1.
(a) The location of the study area in yellow, the sand-borrowing area in the northern sand spit of the delta (in orange), and the seagrass wrack (in green) used for the reinforced dune. (b) An aerial view of the restored beach, highlighting the main features of the system: the road, the foredune, and the artificial dune field. (c) The final layout of the restored beach.
The Ebro Delta is a wave-dominated environment, with mixed tides that are predominantly semidiurnal and a tidal range of around 25 cm [52]. However, storm surges are an important dynamic agent in the area, having the same order of magnitude as the astronomical oscillations and, in extreme events, greatly exceeding them, causing total sea level rises (tide plus storm surge) of about 1 m [51].
In this region, the prevailing winds during the summer are S and SW, although the strongest come from the E. During winter, the most frequent winds blow from the NW. Considering the whole year, the prevailing and most intense winds come from the NW. The most frequent wind velocities are around 4 m/s, while annual maximum speeds exceed 20 m/s and reach up to 30 m/s.
Consequently, incident waves in the Ebro delta come mainly from three directions: ENE, S, and NW [53]. The mean wave height is 97 cm in winter and 63 cm in summer, but this value can be exceeded by up to 5 times under extreme regimes [54]. The mean storm duration in the Ebro Delta is 20 h [54]. The mean wave period is 3.9 s and the peak period is 5 s. Nearly all the mean wave periods have values between 2 and 8 s. The maximum peak period during storms is about 11 s [53].
The area covered by the field study is La Marquesa beach (Figure 1), which is a 1120 m long dissipative beach with a variable width between 38 m and 87 m. It is composed of well-sorted, fine sand of deltaic origin with a median diameter of 203 µm and a standard deviation of 38 µm [55], featuring a mild slope at the front part of the beach.
Historically, this beach featured dune systems with sinuous ridges that were aligned nearly perpendicular to the shoreline, as illustrated in Figure 2. This figure shows how, since the beginning of the last decade, the size of the dunes has decreased, until they practically disappeared last year. Prior to the restoration project, the only remaining dune was at the backshore, separating it from the road that runs parallel to the coastline. This dune was artificially constructed from remnants of the original dunes and positioned to form a sand cordon parallel to the beach, acting as a partially vegetated foredune to protect the road from flooding.
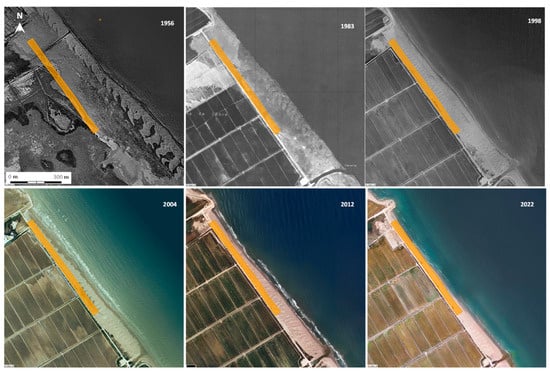
Figure 2.
Orthophotos of La Marquesa beach taken in different years, showing the existing dunes (years 1956 to 2012) that almost disappeared one year before the restoration works (2022). The orange polygon shows the location of the restored area. Note the significant shoreline retreat and the loss of emerged beach surface over the years.
In addition to the disappearance of the dunes, La Marquesa beach exhibits an erosive morphodynamic pattern, with an average annual shoreline retreat of 6.4 m [55].
2.2. Restoration Strategy
Given the erosive nature of La Marquesa beach, the Servicio Provincial de Costas de Tarragona from the Spanish Ministry of Ecological Transition, in collaboration with the Laboratori d’Enginyeria Marítima from the Universitat Politècnica de Catalunya, designed an intervention to slow down the ongoing narrowing of the beach. The goal was to protect the backshore rice fields from flooding during major storms, while preserving the area’s high ecological value.
The intervention consisted of the relocation of sand in the Ebro delta, moving sediment from areas where it accumulates to sediment-deficient sectors, such as La Marquesa beach, in an attempt to make these sensitive areas more resilient to moderate storms. The sand-borrowing areas are shown in Figure 1.
With the idea of promoting nature-based solutions, the works on the Marquesa beach attempted to imitate the historical reference area, constructing dune systems similar to those previously observed there (see Figure 2). The formation of these dune systems is clearly linked to the prevailing winds in the area, which are NW (as indicated above), and their purpose is to allow the prevailing winds to distribute the deposited sand in order to raise the beach level and, as a consequence, its resilience to storms.
Therefore, 62 dunes of about 25 m long, 5 m wide, and 2.6 m high were constructed. The distance between dunes was 10.7 m on average and the total length of the dune system was 689 m. All but one of the dunes were constructed using sand from the borrowing areas (see Figure 1). The other dune (named Dune C) was formed by placing alternating layers of 15 cm of sand and seagrass wrack of Posidonia oceanica (Figure 3), collected from L’Arenal beach (see Figure 1). Its construction procedure was identical to that used for the sand-only dunes. The seagrass wrack was collected in situ (Figure 3, left) using a bulldozer, which loaded the material onto a truck for delivery to the designated restoration area (Figure 3, right). Upon deposition, the bulldozer executed two leveling passes to ensure an even distribution of the wrack–sand mixture. The objective of this dune, once it was formed, was to evaluate its response, with emphasis on their behavior in relation to sand-only dunes.

Figure 3.
(Left): A picture of the seagrass wrack collected in L’Arenal beach. (Right): The dumping of seagrass wrack to start construction of Dune C. Note the relative homogeneity of the seagrass wrack.
2.3. Data Acquisition and Analysis
In recent years, UAVs have proven to be a very useful tool for environmental monitoring, as they allow the collection of high-resolution images at a relatively low cost [56]. As a consequence, their use has increased for both coastal morphology [57,58,59,60,61,62,63] and coastal dune evolution studies [64,65,66,67].
Leveraging the advantages of this technology and its relatively low cost, drone images of La Marquesa beach were captured from November 2023 to November 2024 (Figure 4a). A total of 17 flights were conducted, in which high-resolution elevations across the entire beach were acquired: In 2023, the dates were 9, 22, and 29 November and 18 December. In 2024, the dates were 16 and 26 January; 8, 12, and 22 February; 15 and 22 March; 3, 12, and 25 April; 4 July; 17 September; and 5 November. The first flight was made before the dune restoration, the second during the works (when the sand-only dunes had been built but not Dune C), and the third once the works were completed. Hereafter, flights are referred to as campaigns.
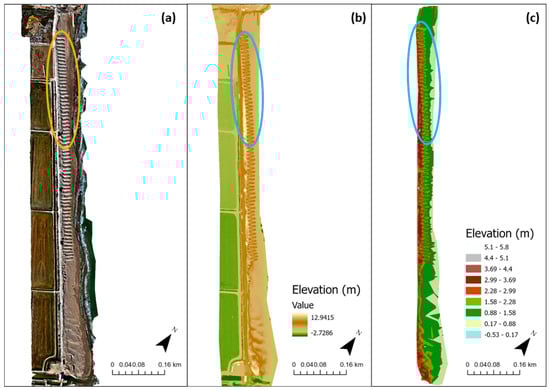
Figure 4.
(a) An aerial view of the intervention; (b) a DEM raster generated in the third campaign; (c) a DEM TIN generated in the third campaign. The marked zone (orange and blue ovals) corresponds to the area where this study is focused.
The UAV used in this study was the DJI Mavic 3E (DJI, Shenzhen, China), equipped with a camera with a lens of 0.2 mm f2.8, a resolution of 72 pixels per inch, and an image size of 5280 × 3956. The flight altitude above the ground was 55 m and 3 ground control points (GCPs) were marked in the area, allowing for the correction of errors. Although it is widely recognized that the more GCPs that are used, the better the resulting accuracy is, some authors point out that the number of GCPs used could be further decreased without significant loss of accuracy [57]. Ref. [68] analyzed results using between 3 and 22 GCPs and stated that with a minimum number of GCPs which are well distributed, similar results can be obtained. Therefore, 3 GCPs can be set as the minimum number of GCPs required for sufficient accuracy.
The integration of the DJI Mavic 3E drone with its dedicated RTK module enables the acquisition of centimeter-level positional accuracy. To achieve this level of precision, the drone must be connected to a CASTER, which supplies real-time correction data. For the monitoring activities conducted at La Marquesa beach, the SMARTNET service provided by Leica Geosystems was utilized. This system is characterized by a high density and quality of reference stations, which are essential for reliable Real-Time Kinematic (RTK) positioning. Following the aerial survey and the acquisition of georeferenced imagery with centimeter-level accuracy at the photogrammetric centers, three GCPs were established to enhance the robustness and accuracy of the resulting model, being strategically positioned at the beginning, middle, and end of the study area. Upon completion of data processing, the following accuracy was obtained in Z coordinate: between −3.7 mm and 9.8 mm (average 6.6 mm).
The UAV images were processed using Agisoft Metashape Professional (Agisoft LLC, St. Petersburg, Russia) to create a 3D point cloud, which was used to generate a DEM. The processed DEM (.asc) files were uploaded into ArcGIS Pro 2.7.0 as raster files (Figure 4b). The resolution of the raster files (rasters) was maintained from the original (.asc) files, so that the cell sizes were around 0.06 m × 0.06 m. The rasters were projected with the ETRS 1989 UTM Zone 31N datum, using a spatial reference local to the coast of the Ebro Delta. Two methodologies were used to interpret the spatial information contained by the rasters. First, transects were placed on alternating sets of the restored dunes to assess their profiles. The average distance between the cross-shore transects was 10.7 m, whereas for the alongshore transects, it was 8 m, except for transect LD, which was positioned 20 m from transect LC. Secondly, a beach analysis was carried out, examining the changes in sand volume.
The behavior of the restored dunes was analyzed through cross-shore transects placed at the dune crests. Transects were defined by establishing a baseline along the road and a shoreline reference line beyond the full raster limits, in the water. These transects extended from the baseline to the shoreline, intersecting the center of the dunes, as seen in the orthographic images from the second and third campaigns. The central, reinforced dune is labeled Dune C. North of Dune C are Dunes CN, numbered 01 to 15 (e.g., Dune CN03, with 01 being the closest to Dune C). South of Dune C are Dunes CS, also numbered 01 to 15 (e.g., Dune CS11). Figure 5 illustrates this arrangement. Data were collected from dunes numbered 01–05 and 11–15, corresponding to the marked zone in Figure 3. Elevation profiles were plotted against distance from the baseline, and the dune volume per unit width was calculated as the area under each profile. Changes in dune volume over time were also plotted.
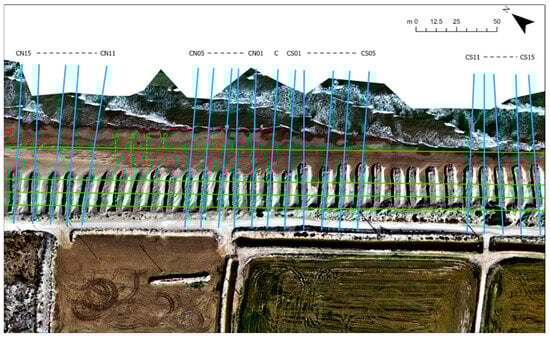
Figure 5.
Cross-shore (blue lines) and longitudinal (green lines) transects in the study area. Cross-shore transects are named with a C (reinforced dune), those located to the north of it are named with a CN##, and those located to the south are named with a CS##, where ## is a number that indicates its relative position with respect to Dune C. The longitudinal transects are named LA (the closest to the baseline) and LB, LC, and LD (the closest to the shoreline).
In addition, four longshore transects were delineated and named LA (the closest to the baseline) and LB, LC, and LD (the closest to the shoreline). These longitudinal transects begin at 44 m from the north-end of the beach and end 395 m south, and their location is also displayed in Figure 5.
The area covered by the UAV in each survey was slightly different due to the hydrodynamic conditions and, consequently, the derived DEMs and raster images. Therefore, to calculate the sand volumes, a mask of each campaign had to be made. To create the mask, boundary polygons were constructed for each campaign. The boundary polygons all begin at the southern end of the beach, follow the edge of the barrier dune, and finally vary at the northern end of the beach and along the shoreline. The boundary along the shoreline was drawn along the line where the elevation reached roughly zero meters. With the masked rasters, triangular irregular network (TIN) files were built (Figure 4c), which allowed beach volumes to be calculated. In Figure 6, a flow chart of the followed methodology is presented.
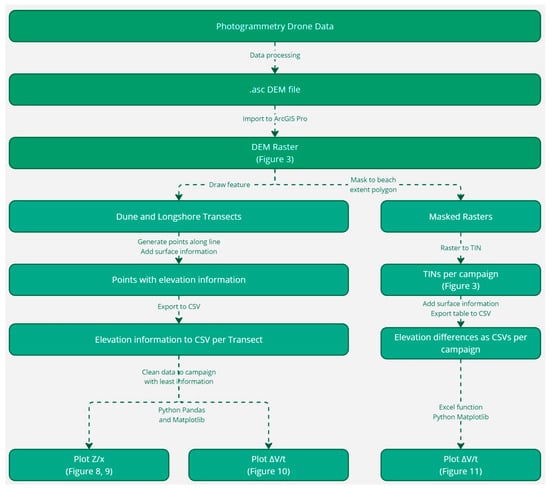
Figure 6.
Flow chart of the followed methodology.
On the other hand, four samples were collected from Dune C. Each sample was stored in a plastic container with a total volume of 2.1 L and subsequently transported to the laboratory for granulometric and organic matter (OM) analysis. Organic matter was removed via thermal oxidation using a series of sieves with mesh sizes ranging from 1.000 mm to 0.063 mm. The combined sediment and organic matter retained on each sieve (Wsd) were subjected to calcination at 500 °C for 30 min. The post-calcination weight of each sieve (Wm), representing only the inorganic sediment fraction (i.e., sand), was then used to calculate the percentage of organic matter in each sample.
Finally, wind data corresponding to the studied period were retrieved from the Puertos del Estado buoy (https://www.puertos.es/es-es/oceanografia/Paginas/portus.aspx, accessed on 20 August 2024) located some 40 km off the Ebro Delta. These data are displayed in Figure 7 showing wind speed and direction vs. time. In addition, hindcasting wind data (also provided by Puertos del Estado) obtained off La Marquesa beach covering a long period (1958–2024) were considered to characterize the long-term wind climate and are also plotted in Figure 7.
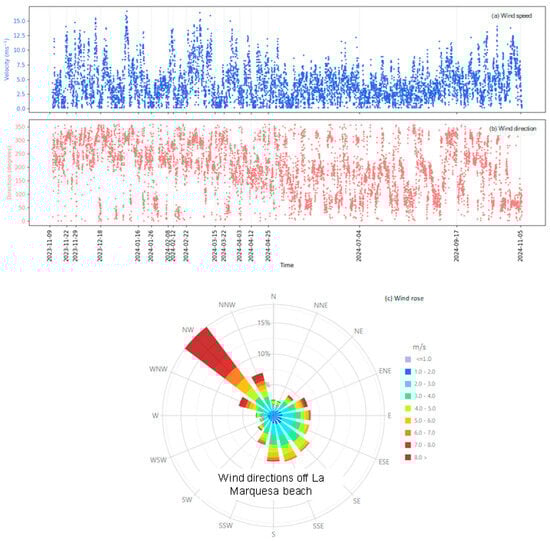
Figure 7.
(a) Wind speed versus time and (b) wind direction versus time, where the values on the horizontal axis indicate the dates of the campaigns; (c) a wind rose including the distribution of velocities and directions for the period 1958–2024. Data are provided by Puertos del Estado.
3. Results
To assess the restoration’s effectiveness, cross-shore profiles of Dunes C, CN01 to CN05, CN11 to CN15, CS01 to CS05, and CS11 to CS15 were plotted for each campaign. Graphs for all these profiles are provided in the Supplementary Material (Figure S1). However, due to the large volume of data, the similarity in behavior of nearby dunes, and the minimal differences between some campaigns, we have presented only 9 dunes (Figure 8) out of the 21 studied. These nine dunes are shown for six selected campaigns—namely the first, third, seventh, tenth, fourteenth, and seventeenth (the final one)—chosen for their significant profile evolution.
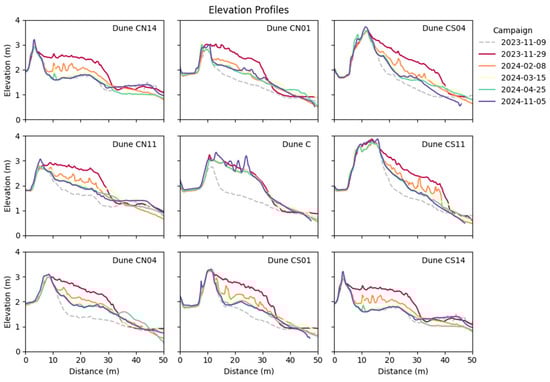
Figure 8.
Evolutions of cross-shore profiles over time, for different campaigns. Dune C is the reinforced dune, Dunes CN## are those located to the north of it, and Dunes CS## are those located to the south, where ## is a number that indicates its relative position with respect to Dune C.
The results show an increase in dune elevations between the first and the third campaign as a consequence of the intervention. Subsequently, there is a significant reduction in the elevations of all dunes except for Dune C, where the variations are very small. The rate of reduction in dune elevations is very fast initially and then slows down over time, so that one year after the restoration, most of the dunes retain part of the sand. Again, the different behavior of Dune C should be noted, as variations in the transverse profile are very limited. In this dune, the differences in elevation between the last campaign and the third one involve reductions varying between 5 and 12 cm, although in some points, they reach 25 cm. Nevertheless, the profile of this dune also shows several bulges in the last campaign which, as seen later, are due to the appearance of vegetation. On the other hand, at the toe of Dune C, the differences in elevations between campaigns 17th and 3rd are positive, reaching up to 25 cm, indicating that the sand lost at the top of the dune is mostly deposited at the toe. Finally, in the area closest to the shoreline, the elevations in the last campaign are again lower than in the third, with values of up to 22 cm. This is because this part of the profile is exposed to wave action and storm surge, which tend to erode the beach.
In contrast, the other dunes experienced a relatively rapid loss of sand from the 3rd to the 7th campaign (a little more than two months after the intervention). Thereafter, the rate of dune erosion slowed down and the differences in elevation between the 7th and 17th campaigns were much smaller. These dunes showed total reductions (between 3rd and 17th campaigns) in profile elevation between 40 cm and 1 m.
Further interesting information can be extracted by analyzing the evolution of the longitudinal transects. This evolution is presented in Figure S2 for the 17 campaigns and in Figure 9 for the same 6 campaigns selected in Figure 8, in order to reduce the number of lines and to better observe the changes.
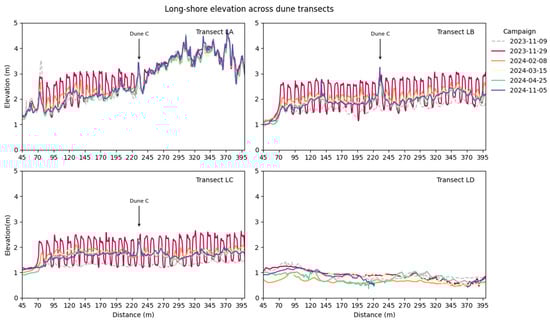
Figure 9.
Evolutions of longitudinal elevation profiles (transect location is shown in Figure 5) over time, for different campaigns. The arrow indicates the location of the reinforced dune (Dune C). Notice that LD corresponds to a transect near the shoreline that does not intersect the dunes.
In the LA transect, the one farthest from the shoreline, there are significant differences between the northern part of the surveyed area (left side of the figure) and the southern part (right side). This is because the transect, in the southern part, intersects the existing dune, as shown in Figure 5. For this reason, this part of the transect hardly registers any changes, as it is an artificially stabilized area. In contrast, the dunes located north of Dune C follow a similar pattern to the transverse profiles, with rapid and large changes between the 3rd and 7th campaigns, with reductions in the dune crest elevation varying between 50 and 80 cm. After this campaign, the reduction in dune crest elevation is slower but progressive, of the order of 20 to 25 cm more until the 14th campaign. After this, there is a slight increase in the elevation of the dunes (a few centimeters) until the last campaign. On the contrary, the level of Dune C remained practically unchanged since the 3rd campaign.
In transect LB, which is located near the center of the artificial dunes, the evolution of all the dunes is very similar, following the above-mentioned pattern of a large reduction in dune crest levels between the 3rd and 7th campaigns (varying between 42 and 83 cm), followed by a slower decrease, varying between 20 and 40 cm between the 7th and 14th campaigns. From this point onwards, the elevation of the dunes varies very little, with very similar values or even slight elevations in magnitude, especially towards the south of Dune C. It should be noted that some of the sediments that eroded from the dune crests end up in the areas between the dunes, filling them, and, consequently, increasing the beach level in these areas between 20 and 50 cm. Again, Dune C behaves differently from the rest of the dunes, with much smaller changes and a reduction in elevation between the 3rd and 14th campaigns of only a few cm, followed by an increase, above the level of regeneration, in the last campaign.
In the LC transect, located (in the offshore direction) at a similar distance from LB to that between LB and LA, and close to the end of the dune, the evolution over time is similar to that described for LB, with decreases ranging between 60 and 100 cm (from the 3rd to 17th campaign). The elevation of the interdune zone from the 3rd to the 17th campaign varies between 22 and 45 cm. In this case, the level reduction between the 3rd and 17th campaigns in Dune C is 13 cm.
Finally, in the LD transect, the one closest to the shoreline, the changes are smaller because this transect does not intercept any dune. It can be observed that between the 3rd and 7th campaigns, the beach levels decrease, particularly in the northernmost part (values between 25 and 56 cm), while in Dune C and the southern half, the level reduction ranges between 5 and 30 cm. However, subsequently, sand from the dunes begins to accumulate and the level increases. Nevertheless, the elevations along this transect do not follow a clear pattern, since there are areas, particularly at both ends of the stretch analyzed, where slight erosion was detected after the last campaign. In contrast, in the center of the transect, there is small accretion.
The volume variation of the different dunes over time has been used to study the spatial response of the dune field. This value is calculated as the area under the cross-shore profile obtained in each transect for each campaign with respect to the baseline, corresponding to the volume per unit width. In Figure 10, the changes in total volume per unit width of each dune compared to the first campaign are shown. In all dunes, an increase in volume can be observed between the first and the second campaign as a result of the intervention. The exception is Dune C, which was mostly built between the second and third campaigns. It is in this time interval that this dune registers the greatest changes, increasing its volume by almost 17 m3/m. In the other dunes, very small variations occurred between the 2nd and 3rd campaigns, with increases or decreases on the order of 1 m3/m, about 1% of the volume per unit width of the dunes after the intervention.
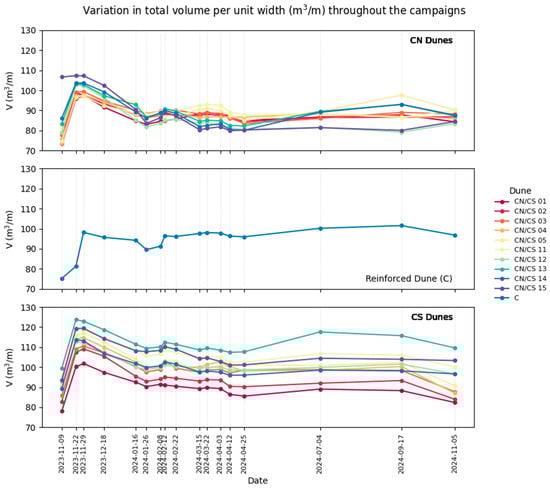
Figure 10.
Changes in cross-shore profile area (volume per unit width) over time. Dune C is the reinforced dune. CN## denotes dunes north of dune C and CS## indicates the dunes south of dune C, as shown in Figure 5.
If the evolution over time is considered, it can be observed that the dunes located to the north of Dune C tend to lose volume with time, particularly between the 2nd and the 6th campaigns. This volume reduction in this period ranges from 9.8 m3/m (CN02) to 23.8 m3/m (CN15), which represent losses between 10.2% and 22.2% of the initial volume of the dunes. Thereafter, volumes remain relatively stable, with moderate increases or decreases. Note that the CN15 dune, in Figure 10, after the 3rd campaign, shows lower volumes than those existing before the restoration. This is due to the fact that the place occupied by this dune, before the intervention, was used to collect sand, as shown in Figure S1 (see dashed line), where the initial accumulation of sand can be clearly observed.
There is a clear trend indicating that the farther north the dunes are located, the greater the reduction in their volume. In this way, dunes CN12 to CN15, from campaigns 2 to 17, have volume losses between 22.2 and 27.1 m3/m (between 20.7% and 25.2%). On the contrary, dunes CN01 to CN05, in the same time interval, show losses between 10.5 and 15.7 m3/m (10.8% to 15.8%) of the volume of sand placed during the intervention.
In contrast, the behavior of Dune C is quite different. It can be seen that the differences in volume undergo very small changes over time, indicating that the dune’s volume remains almost constant. This is consistent with the evolution of the profile of this dune, as shown in Figure 8. Only in campaigns 6 and 7 is a slight loss of sediment observed (with a maximum of 8.6 m3/m, 8.8% of the volume of the restored dune). However, part of the lost volume is subsequently recovered, and the difference in volume between the 17th and 3rd campaigns is only 1.4 m3/m, which represents a loss of 1.4% of the volume of the restored dune.
With respect to the dunes located south of Dune C, a similar pattern can be observed, with significant reductions in volume between the 2nd and 6th campaigns and a slight increase in volume until the 8th campaign, before remaining relatively constant with some oscillations until the end of the period studied. The differences in dune volume between the 2nd and 17th campaigns range from 12.6% to 16% of the volume of the restored dunes, with the exception of Dune CS03, which only loses 9.6% of its volume in this time span.
4. Discussion
Coastal dunes have demonstrated a positive impact as nature-based solutions (NBSs) in various regions, such as California, USA [14]. Many researchers highlight their general resilience [13], which allows them to recover after periods of degradation or disturbance, whether caused by natural processes or human activities. As a result, numerous studies focus on dune restoration and regeneration [30,31]. However, some authors argue that instead of attempting to restore dunes to their historical conditions, innovative approaches that enhance the provision of desired ecosystem services should be prioritized [69].
This work is based on the restoration of a dune system similar to the pre-existing ones at La Marquesa beach (NW Mediterranean), trying to mimic the historical situation of the area. However, the main difference is that between all the sand dunes, a ‘reinforced’ one (Dune C) was built using a composite made with sand and seagrass wrack, trying to improve its resilience. This type of restoration is in line with what has been stated by [70], who suggested that investing in ecosystem restoration should secure a net gain in the functioning of the native ecosystem.
Measurements recorded during the first campaign (see dashed line in Figure 9 and Figure S1) indicate that, prior to the restoration, there was only an artificial foredune next to the road, built to protect it and also to protect the adjacent rice fields from flooding. The intervention was carried out between the first and third campaigns, as indicated in Section 2.2, so that in this third campaign, the dunes were at, or very close to, their highest elevation. From this moment onwards, the dunes began to lose sand (see Figure S1) as, between the 1st and 6th campaigns, they were subjected to several episodes of intense NW and W winds, with speeds of over 10 m/s and even 15 m/s (Figure 7). Thus, after the 7th campaign, two and a half months after the 3rd campaign, a very significant reduction in the elevation of the dune crests is noted, which at some points, may be about half of the regrowth achieved by the intervention. All dunes show this pattern except Dune C, where hardly any variations in the dune profile occurred during this time interval. From that point onwards, changes in both dune profile and volume occurred more gradually, with most dunes showing a slight decrease in crest elevation and total volume, until the 14th campaign. However, in the summer period (between the 14th and 16th campaigns), although most of the dunes maintain a constant volume, and some show a certain increase (Figure 10). In this period, milder winds (<8 m/s) are observed, with a greater percentage coming from the E-S sector. Dune C, however, stood out as an exception, with its transverse profile exhibiting only minor changes and its total volume remaining nearly constant throughout the study period.
The analysis of the evolution of the longitudinal profiles (Figure 9) corroborates the aforementioned, i.e., a rapid erosion of the dune crests between the 3rd and the 7th campaigns (2.5 months) and, subsequently, a slower loss of elevation of the crests. Once again, the singular behavior of Dune C stands out, as it can be observed that it practically maintains its elevation throughout the period studied.
It should be noted that the sand lost in the upper part of the dunes is deposited either at the toe of the dunes (Figure 8) or in the interdune space (Figure 9). This can be seen in Figure 11a,b, which compares the difference in elevation across the study area between the last campaign (the 17th) and the 1st campaign (before the intervention) and between the last campaign (the 17th) and the 3rd campaign (just after dune construction). This is in line with what was proposed by [71], who indicate that to assess the evolution of dune systems, their morphological changes must be analyzed.
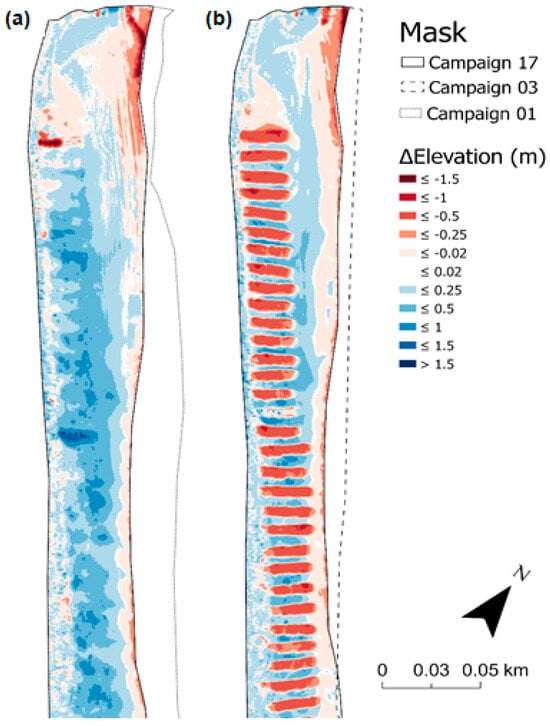
Figure 11.
(a) Variation in elevation (ΔElevation) in the last campaign compared to the first campaign (before the intervention). (b) Variation in elevation in the last campaign compared to the third campaign (after the intervention). The arrow indicates the north direction.
Figure 11b shows several zones with different morphodynamical behavior. The first, located next to the shoreline, shows slight erosion, although in the northernmost part, this erosion is more significant. This may be attributed to the presence of a relict offshore submerged delta, as noted by [72]. The second is behind the dunes, where a slight accretion can be observed. The third corresponds to the interdune areas, where level rises on the order of 0.5 m or even higher are recorded. These rises extend to the toe of the dunes, but only in the northern half (between dunes CS01 and CN15), while in the southern part, this sand deposit at the toe of the dunes is not observed. Finally, the last area is the dune field itself, where all the dunes (except one) show a loss in level on the order of 0.5 m. The exception is Dune C, which, one year after the intervention, still shows elevations similar to those immediately after the intervention. This is further evidence of the greater persistence and resilience shown by the dune reinforced with seagrass wrack compared to sand-only dunes.
Figure 11a displays the effect of the restoration, showing that the average elevation of the beach remains up to 0.5 m higher than the initial elevation, one year after the intervention, even though most of the dunes have eroded significantly. This suggests that the construction of the dunes generated an artificial gradient of beach levels, probably too high for the existing conditions in the area, because there are no natural external sources of beach nourishment. This led to the redistribution of the sand along the entire length of the beach, except for the northernmost area which is very exposed, raising the height of the beach and increasing its level of protection against erosion and flooding. This is consistent with the findings of other authors, who suggested that the width of the beach controls the wave energy reaching the dune and may limit such wave energy, increasing beach protection [29,73], together with the total beach volume of the emerged beach [74,75]. A slight decrease in elevation is observed in the strip closest to the shoreline, likely caused by wave action and storm surges. This erosion pattern mirrors pre-intervention conditions and is more evident toward the northern end of the study area.
It is worth noting the different behavior of the dune reinforced with seagrass wrack. As can be seen in the aerial photos of Figure 12, Dune C maintains a higher elevation than the surrounding dunes during the three study periods: five months, more than seven months, and almost one year after the intervention. This, besides indicating a greater resistance of the seagrass-wrack-reinforced dune, has other implications for coastal management, because higher dunes better maintain their role in protecting the coast from erosion and flooding. Considering that restorations are not one-time events, but they require periodic attention and adaptive management to increase the chances of successful projects [76], dunes reinforced with seagrass wrack can increase the time between re-fillings and, therefore, significantly reduce the beach protection costs.
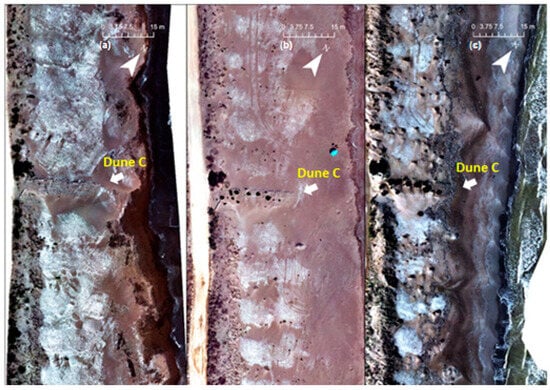
Figure 12.
(a) An aerial photo of Dune C in the 14th campaign (2024-04-25); (b) an aerial photo 2.3 months later (2024-07-04); (c) an aerial photo in the last campaign (2024-11-05). The arrow indicates the reinforced dune (Dune C) location.
Likewise, the appearance of vegetation on Dune C is noteworthy. The most abundant identified species were Cakile maritima and Salsola kali—annual halophytic pioneer plants that contribute to early dune development and facilitate the establishment of primary foredune-building species [77]. Five months after the restoration, the germination of incipient vegetation can be seen (Figure 12a). However, 2.3 months later, the vegetation has developed considerably and there are several bushes scattered along the dune (Figure 12b). Finally, 11.5 months after dune restoration, the vegetation has fully developed in the reinforced dune (Figure 12c). In this stage, more efficient dune builders and stabilizers were identified, such as Elymus farctus, a perennial rhizomatous grass that plays a significant role in dune formation and stabilization, especially in the embryonic and foredune zones of coastal systems [78]. This vegetation has grown spontaneously, without any anthropogenic contribution. As pointed out by several authors, seagrass beach debris can provide nutrients contributing to further colonization by plants [46,47,48] and, therefore, to dune stabilization [26,79]. These nutrients come from the organic matter of the Posidonia oceanica debris incorporated into Dune C, which, according to laboratory analyses, accounts for between 13.2% and 22.8% of the total weight of the sand–wrack mixture. In addition, beach plants contribute to increasing sand elevation, creating increased contour heights [80].
However, although the anchoring effect of vegetation contributes to dune stabilization, it cannot be considered the sole contributing factor, as vegetation typically emerges several months after the intervention. Several authors [81,82] have reported that the presence of organic matter in sediments enhances cohesion by acting as a binder between sand grains. Moreover, it increases the sediment’s water retention capacity, further improving its apparent cohesion.
Therefore, besides increasing the resilience of dunes and reducing the costs of re-filling, as indicated above, the addition of seagrass wrack has other positive implications, such as providing valuable use for such debris, contributing to resource optimization and providing a more sustainable management of this waste.
Finally, this study also illustrates that the use of UAVs for mapping is a low-cost and fast alternative to traditional time-consuming surveying campaigns, as shown by [66,67,72,83,84]. They provide high-resolution aerial imagery, allowing the monitoring of the evolution of coastal areas and, in particular, coastal dunes.
5. Conclusions
This study examines the evolution of a restored dune field, comparing the performance of conventional sand dunes with that of another dune reinforced with a sand-seagrass wrack mixture (Dune C). The objective is to determine whether the incorporation of seagrass wrack improves dune resilience against driving forces.
To analyze the performance of this ‘reinforced’ dune with respect to the sand-only dunes, 17 UAV flights (campaigns) were carried out for a period of one year, between 9 November 2023 and 5 November 2024. These flights made it possible to construct DEMs of the restored area and thus to study the evolution of the various dunes over this time span.
The results show that, over the period studied, while the sand-only dune crests erode significantly, Dune C remains virtually unchanged. Thus, while conventional dunes lose at some points up to half the level reached during restoration (erosion of up to 1 m), in Dune C, the loss in level is 5 to 12 cm, although at some points, it can reach 25 cm. In addition, the volumes per unit width measured at the dune crests show reductions between 22% and 27% in the northernmost dunes. In the other conventional dunes, the reduction is between 10% and 16%, while in Dune C, it is limited to 1.4%.
Sand eroded from the dune crests is deposited in the interdune space and at the toe of the dunes, generating level rises between 20 and 50 cm. This shows that the sand used during the restoration is redistributed along the entire length of the beach, raising the height of the beach and increasing its level of protection against erosion and flooding. Only the strip closest to the shoreline shows a slight loss in level, probably due to storm surge and waves, which generate an erosive beach trend, similar to that observed before the intervention.
In addition, about one year after the restoration, Dune C maintains a higher elevation than the surrounding dunes and has also developed vegetation, that has grown spontaneously, without any anthropogenic involvement. This vegetation contributes to dune stabilization.
Therefore, we conclude that the results are highly promising, as the addition of seagrass wrack markedly enhances dune resilience and, consequently, strengthens its function in protecting the coast against erosion and flooding. However, given that the findings are based on a single wrack–sand dune experiment and have not yet been replicated, they should be interpreted with caution. Further studies using similar configurations are required to validate the effectiveness of this approach. Such validation would benefit coastal management in two key ways: by extending the intervals between nourishment interventions—thereby reducing beach maintenance costs—and by contributing to the sustainable management of seagrass debris.
Supplementary Materials
The following supporting information can be downloaded at https://www.mdpi.com/article/10.3390/rs17193263/s1. Figure S1: The evolution of all studied cross-sectional profiles over time, considering the data from the 17 campaigns; Figure S2: The evolution of longitudinal elevation profiles over time, considering the data from the 17 campaigns.
Author Contributions
Conceptualization, V.G., A.E. and A.S.-A.; methodology, V.G., J.P.S. and A.E.; software, M.M.D. and F.V.; validation, M.M.D., F.V. and C.M.; formal analysis, V.G., M.M.D., J.P.S. and C.M.; investigation, M.M.D., J.P.S. and C.M.; resources, F.V. and C.M.; data curation, M.M.D., F.V. and C.M.; writing—original draft preparation, V.G. and J.P.S.; writing—review and editing, V.G., M.M.D. and J.P.S.; visualization, M.M.D., J.P.S. and F.V.; supervision, V.G., J.P.S., A.E. and A.S.-A.; project administration, V.G., J.P.S., A.E. and A.S.-A.; funding acquisition, V.G., J.P.S., A.E. and A.S.-A. All authors have read and agreed to the published version of the manuscript.
Funding
This research work was funded by the Ministerio de Ciencia, Innovación y Universidades from the Spanish Government through the project ECOPLANTS (ref. PID-2020-119058RB-I00).
Data Availability Statement
The data presented in this study are available on request from the corresponding author because the research project is still ongoing. At the end of the project, they will be openly available in a public repository.
Acknowledgments
This work acknowledges the REST-COAST project, which provided relevant information on the Ebro Delta. The REST-COAST project receives funding from the European Union’s Horizon 2020 Research and Innovation action under grant agreement No. 101037097. The authors also want to acknowledge the Ministerio para la Transición Ecológica of the Spanish Government, which carried out the building of the dunes, as well as the collaboration of Puertos del Estado of the Ministerio de Transportes y Mobilidad Sostenible (Spanish Government), which provided the wind data used.
Conflicts of Interest
The authors declare no conflicts of interest.
References
- Temmerman, S.; Meire, P.; Bouma, T.J.; Herman, P.M.; Ysebaert, T.; De Vriend, H.J. Ecosystem-based coastal defence in the face of global change. Nature 2013, 504, 79–83. [Google Scholar] [CrossRef]
- Morris, R.L.; Konlechner, T.M.; Ghisalberti, M.; Swearer, S.E. From grey to green: Efficacy of eco-engineering solutions for nature-based coastal defense. Glob. Chang. Biol. 2018, 24, 1827–1842. [Google Scholar] [CrossRef] [PubMed]
- Temmerman, S.; Kirwan, M.L. Building land with a rising sea. Science 2015, 349, 588–589. [Google Scholar] [CrossRef]
- Sierra, J.P.; Garcia-Leon, M.; Gracia, V.; Sanchez-Arcilla, A. Green measures for Mediterranean harbours under a changing climate. Proc. Inst. Civ. Eng. Marit. Eng. 2017, 170, 55–66. [Google Scholar] [CrossRef]
- Slinger, J.; Stive, M.; Luijendijk, A. Nature-based solutions for coastal engineering and management. Water 2021, 13, 976. [Google Scholar] [CrossRef]
- Silva, R.; Martínez, M.L.; Odériz, I.; Mendoza, E.; Feagin, R.A. Response of vegetated dune-beach systems to storm conditions. Coast. Eng. 2016, 109, 53–62. [Google Scholar] [CrossRef]
- Schoonees, T.; Gijón Mancheño, A.; Scheres, B.; Bouma, T.J.; Silva, R.; Schlurmann, T.; Schüttrumpf, H. Hard structures for coastal protection, towards gender designs. Estuar. Coasts 2019, 42, 1709–1729. [Google Scholar] [CrossRef]
- Gracia, V.; Sierra, J.P.; Caballero, A.; García-León, M.; Mösso, C. A methodological framework for selecting an optimal sediment source within a littoral cell. J. Environ. Manag. 2021, 296, 113207. [Google Scholar] [CrossRef]
- Moraes, R.P.L.; Reguero, B.G.; Mazarrasa, I.; Ricker, M.; Juanes, J.A. Nature-based solutions in coastal and estuarine áreas of Europe. Front. Environ. Sci. 2022, 10, 928. [Google Scholar] [CrossRef]
- Unguendoli, S.; Biolchi, L.G.; Aguzzi, M.; Pillai, U.P.A.; Alessandri, J.; Valentini, A. A modelling application of integrated nature based solutions (NBS) for coastal erosion and flooding mitigation in the Emilia-Romagna coastline (Northeast Italy). Sci. Total Environ. 2023, 867, 161357. [Google Scholar] [CrossRef]
- Berard, N.A.; Mulligan, R.P.; da Silva, A.M.F.; Dibajnia, M. Evaluation of XBeach performance for the erosion of a laboratory sand dune. Coast. Eng. 2017, 125, 70–80. [Google Scholar] [CrossRef]
- Schweiger, C.; Kaehler, C.; Koldrack, N.; Schuettrumpf, H. Spatial and temporal evaluation of storm-induced erosion modelling based on a two-dimensional field case including an artificial unvegetated research dune. Coast. Eng. 2020, 161, 103752. [Google Scholar] [CrossRef]
- Farrell, E.J.; Fernandez, I.D.; Smyth, T.; Li, B.; Swann, C. Contemporary research in coastal dunes and Aeolian processes. Earth Surf. Process. Landf. 2023, 49, 108–116. [Google Scholar] [CrossRef]
- Walker, I.J.; Hilgendorf, Z.; Gillies, J.A.; Turner, C.M.; Furtak-Cole, E.; Nikolich, G. Assessing performance of a “nature-based” foredune restoration project, Oceano Dunes, California, USA. Earth Surf. Process. Landf. 2023, 48, 143–162. [Google Scholar] [CrossRef]
- Harley, M.D.; Ciavola, P. xManaging local coastal inundation risk using real-time forecasts and artificial dune placements. Coast. Eng. 2023, 77, 77–90. [Google Scholar] [CrossRef]
- Dang, K.B.; Nguyen, T.T.; Ngo, H.H.; Burkhard, B.; Müller, F.; Dang, V.B.; Nguyen, H.; Ngo, V.L.; Pham, T.P.N. Integrated methods and scenarios for assessment of sand dunes ecosystem services. J. Environ. Manag. 2021, 289, 112485. [Google Scholar] [CrossRef]
- Peña-Alonso, C.; Gallego-Fernández, J.B.; Hernández-Calvento, L.; Hernández-Cordero, A.I.; Ariza, E. Assessing the geomorphological vulnerability of arid beach-dune systems. Sci. Total Environ. 2018, 635, 512–525. [Google Scholar] [CrossRef] [PubMed]
- EC. Council Directive 92/43/EEC on the conservation of natural habitats and of wild fauna and flora. Off. J. Eur. Union 1992, 206, 7–50. [Google Scholar]
- EC. Commission Staff Working Document: Fitness Check of the of the EU Nature Legislation (Birds and Habitats Directives) Directive 2009/147/EC of the European Parliament and of the Council of 30 November 2009 on the Conservation of Wild Birds and Council Directive 92/43/EEC of 21 May 1992 on the Conservation of Natural Habitats and of Wild Fauna and Flora (SWD(2016) 472 Final); European Commission: Brussels, Belgium, 2016. [Google Scholar]
- FEMA. National Flood Insurance Program. Floodplain Management Requirements. A Study Guide and Desk Reference for Local Officials; Federal Emergency Management Agency: Washington, DC, USA, 2005. [Google Scholar]
- DELWP. Marine and Coastal Policy; Department of Environment, Land, Water and Planning, Victorian Government: Melbourne, VIC, Australia, 2020. [Google Scholar]
- Defeo, O.; McLachlan, A.; Schoeman, D.S.; Schlacher, T.A.; Dugan, J.; Jones, A.; Lastra, M.; Scapini, F. Threats to sandy beach ecosystems: A review. Estuar. Coast. Shelf Sci. 2009, 8, 1–12. [Google Scholar] [CrossRef]
- Matias, A.; Ferreira, O.; Mendes, I.; Dias, J.A.; Vila-Consejo, A. Artificial construction of dunes in the south of Portugal. J. Coast. Res. 2005, 21, 472–481. [Google Scholar] [CrossRef]
- Jackson, N.I.; Nordstrom, K.F. Aeolian sediment transport on a recovering storm-eroded foredune with sand fences. Earth Surf. Process. Landf. 2018, 43, 1310–1320. [Google Scholar] [CrossRef]
- Itzkin, M.; Moore, L.J.; Ruggiero, P.; Hacker, S.D. The effect of sand fencing on the morphology of natural dune systems. Geomorphology 2020, 352, 106995. [Google Scholar] [CrossRef]
- Arens, S.M.; Baas, A.C.W.; Van Boxel, J.H.; Kaleman, C. Influence of reed stem density on foredune development. Earth Surf. Process. Landf. 2001, 26, 1161–1176. [Google Scholar] [CrossRef]
- Ballesteros-Pelegrín, G.A.; García-Marín, R.; Ibarra-Marinas, D.; Sánchez-Balibrea, J.; Belmonte-Serrato, F.; Zamora-López, A.; Fernández-Ramos, J.F.; Martínez-Arnal, N. Actions for the conservation and restoration of the dunes and wetlands in the Salinas of San Pedro del Pinatar: LIFE-Salinas project (Murcia, southeast of Spain). Engineering 2022, 3, 387–399. [Google Scholar] [CrossRef]
- Cohn, N.; Brodie, K.; Conery, I.; Spore, N. Alongshore variable accretional and erosional coastal foredune dynamics at event to interannual timescales. Earth Space Sci. 2022, 9, e2022EA002447. [Google Scholar] [CrossRef]
- Garzon, J.L.; Costas, S.; Ferreira, O. Biotic and abiotic factors governing dune response to storm events. Earth Surf. Process. Landf. 2022, 47, 1013–1031. [Google Scholar] [CrossRef]
- Bryant, D.B.; Anderson Bryant, M.; Sharp, J.A.; Bell, G.L.; Moore, C. The response of vegetated dunes to wave attack. Coast. Eng. 2019, 152, 103506. [Google Scholar] [CrossRef]
- D’Alessandro, F.; Tomasicchio, G.R.; Francone, A.; Leone, E.; Frega, F.; Chiaia, G.; Saponieri, A.; Damiani, L. Coastal sand dune restoration with an eco-friendly technique. Aquat. Ecosyst. Health Manag. 2020, 23, 417–426. [Google Scholar] [CrossRef]
- Schreck Reis, C.; Antunes do Carmo, J.; Freitas, H. Learning with Nature: A sand dune system case study (Portugal). J. Coast. Res. 2008, 26, 1506–1515. [Google Scholar] [CrossRef]
- Antunes do Carmo, J.; Reis, C.S.; Freitas, H. Rehabilitation of a geotextile-reinforced sand dune. J. Coast. Res. 2009, SI56, 282–286. [Google Scholar]
- Almarshed, B.; Figlus, J.; Miller, J.; Verhagen, H.J. Innovative coastal risk reduction through hybrid design: Combining sand cover and structural defenses. J. Coast. Res. 2020, 36, 174–188. [Google Scholar] [CrossRef]
- Odériz, I.; Knöchelmann, N.; Silva, R.; Feagin, R.A.; Martínez, M.L.; Mendoza, E. Reinforcement of vegetated and unvegetated dunes by a rocky core: A viable alternative for dissipating waves and providing protection? Coast. Eng. 2020, 158, 103675. [Google Scholar] [CrossRef]
- Roig, F.X.; Rodríguez-Perea, A.; Martín-Prieto, J.A.; Pons, G.X. Soft management of beach dune systems as a tool for their sustainability. J. Coast. Res. 2009, SI56, 1284–1288. [Google Scholar]
- Provost, L.A.; Eisemann, E.R.; Anderson, C.P.; Waldron, M.C.B. Wrack placement to augment constructed dunes: A field investigation. Front. Built Environ. 2022, 8, 907608. [Google Scholar] [CrossRef]
- Pal, D.; Hogland, W. An overview and assessment of the existing technological options for management and resource recovery from beach wrack and dredged sediments: An environmental and economic perspective. J. Environ. Manag. 2022, 302, 113971. [Google Scholar] [CrossRef]
- De Falco, G.; Simeone, S.; Baroli, M. Management of beach-cast Posidonia oceanica seagrass on the island of Sardinia (Italy, Western Mediterranean). J. Coast. Res. 2008, 24, 69–74. [Google Scholar] [CrossRef]
- Simeone, S.; De Falco, G. Morphology and composition of beach-cast Posidonia oceanica litter on beaches with different exposures. Geomorphology 2012, 151–152, 224–233. [Google Scholar] [CrossRef]
- Simeone, S.; De Muro, S.; De Falco, G. Seagrass berm deposition on a Mediterranean embayed beach. Estuar. Coast. Shelf Sci. 2013, 135, 171–181. [Google Scholar] [CrossRef]
- Rotini, A.; Chiesa, S.; Manfra, L.; Borrello, P.; Piermarini, R.; Silvestri, C.; Cappucci, S.; Parlagreco, L.; Devoti, S.; Pisapia, M.; et al. Effectiveness of the “Ecological Beach” model: Beneficial management of Posidonia beach casts and banquette. Water 2020, 12, 3238. [Google Scholar] [CrossRef]
- Ruju, A.; Buosi, C.; Coco, G.; Porta, M.; Trogu, D.; Ibba, A.; De Muro, S. Ecosystem services of reed and seagrass debris on a urban Mediterranean beach (Poetto, Italy). Estuar. Coast. Shelf Sci. 2022, 271, 107862. [Google Scholar] [CrossRef]
- Nordstrom, K.F.; Jackson, N.L.; Korotky, K.H. Aeolian sediment transport across beach wrack. J. Coast. Res. 2011, SI59, 211–217. [Google Scholar] [CrossRef]
- Del Vecchio, S.; Jucket, T.; Carboni, M.; Acosta, A.T.R. Linking plant communities on land and at sea: The effects of Posidonia oceanica wrack on the structure of dune vegetation. Estuar. Coast. Shelf Sci. 2017, 184, 30–36. [Google Scholar] [CrossRef]
- Alcoverro, T.; Manzanera, M.; Romero, J. Nutrient mass balance of the seagrass Posidonia oceanica: The importance of nutrient retranslocation. Mar. Ecol. Prog. Ser. 2000, 194, 13–21. [Google Scholar] [CrossRef]
- Cardona, L.; Garcia, M. Beach cast seagrass material fertilizes the foredune vegetation of Mediterranean coastal dunes. Acta Oecol. 2008, 34, 97–103. [Google Scholar] [CrossRef]
- Del Vecchio, S.; Marbà, N.; Acosta, A.; Vignolo, C.; Traveset, A. Effects of Posidonia oceanica beach-cast on germination, growth and nutrient uptake of coastal dune plants. PLoS ONE 2013, 8, e70607. [Google Scholar] [CrossRef] [PubMed]
- Duarte, C.M. How can beaches be managed with respect to seagrass litter? In European Seagrasses: An Introduction to Monitoring and Management; Borum, J., Duarte, C.M., Krause-Jansen, D., Greeve, T.M., Eds.; EU Project Monitoring and Managing of European Seagrasses: Copenhagen, Denmark, 2004; pp. 83–84. [Google Scholar]
- Rovira, A.; Ibáñez, C. Sediment management options for the lower Ebro River and its delta. J. Soils Sedim. 2007, 7, 285–295. [Google Scholar] [CrossRef]
- Mösso, C.; Sierra, J.P.; Gracia, V.; Mestres, M.; Rodríguez, A. Short-term morphodynamic changes in a fetch limited beach at the Ebro delta (Spain), under low wave-energy conditions. J. Coast. Res. 2011, SI64, 185–189. [Google Scholar]
- Grases, A.; Gracia, V.; García-León, M.; Lin-Ye, J.; Sierra, J.P. Coastal flooding and erosion under a changing climate: Implications at a low-lying coast (Ebro Delta). Water 2020, 12, 346. [Google Scholar] [CrossRef]
- Bolaños, R.; Jordà, G.; Cateura, J.; López, J.; Puigdefàbregas, J.; Gómez, J.; Espino, M. The XIOM: 20 years of regional coastal observatory in the Spanish Catalan coast. J. Mar. Syst. 2009, 77, 237–260. [Google Scholar] [CrossRef]
- Sánchez-Arcilla, A.; González-Marco, D.; Doorn, N.; Kortenhaus, A. Extreme values for coastal, estuarine and riverine environments. J. Hydraul. Res. 2008, 46 (Suppl. S2), 183–190. [Google Scholar] [CrossRef]
- CIIRC. Estat de la Zona Costanera a Catalunya; Centre Internacional d’Investigació dels Recursos Costaners, Generalitat de Catalunya: Barcelona, Spain, 2008. [Google Scholar]
- Medvedev, A.; Telnova, N.; Alekseenko, N.; Koshkarev, A.; Kuznetchenko, P.; Asmaryan, S.; Narikov, A. UAV-Derived Data Application for Environmental Monitoring of the Coastal Area of Lake Sevan, Armenia with a Changing Water Level. Remote Sens. 2020, 12, 3821. [Google Scholar] [CrossRef]
- Mancini, F.; Dubbini, M.; Gattelli, M.; Stecchi, F.; Fabbri, S.; Gabbianelli, G. Using Unmanned Aerial Vehicles (UAV) for High-Resolution Reconstruction of Topography: The Structure from Motion Approach on Coastal Environments. Remote Sens. 2013, 5, 6880–6898. [Google Scholar]
- Alvarez, L.V.; Moreno, H.A.; Segales, A.R.; Pham, T.G.; Pillar-Little, E.A.; Chilson, P.B. Merging Unmanned Aerial Systems (UAS) Imagery and Echo Soundings with an Adaptive Sampling Technique for Bathymetric Surveys. Remote Sens. 2018, 10, 1362. [Google Scholar]
- Gonçalves, J.; Henriques, R. UAV photogrammetry for topographic monitoring of coastal areas. ISPRS J. Photogramm. Remote Sens. 2015, 104, 101–111. [Google Scholar] [CrossRef]
- Doukari, M.; Batsaris, M.; Papakonstantinou, A.; Topouzelis, K. A Protocol for Aerial Survey in Coastal Areas using UAS. Remote Sens. 2019, 11, 1913. [Google Scholar]
- Lin, Y.C.; Cheng, Y.T.; Zhou, T.; Ravi, R.; Hasheminasab, S.M.; Flatt, J.E.; Troy, C.; Habib, A. Evaluation of UAV LiDAR for Mapping Coastal Environments. Remote Sens. 2019, 11, 2893. [Google Scholar] [CrossRef]
- Tmušić, G.; Manfreda, S.; Aasen, H.; James, M.R.; Gonçalves, G.; Ben-Dor, E.; Brook, A.; Polinova, M.; Arranz, J.J.; Mészáros, J.; et al. Current Practices in UAS-based Environmental Monitoring. Remote Sens. 2020, 12, 1001. [Google Scholar] [CrossRef]
- Zanutta, A.; Lambertini, A.; Vittuari, L. UAV photogrammetry and ground surveys as a mapping tool for quickly monitoring shoreline and beach changes. J. Mar. Sci. Eng. 2020, 8, 52. [Google Scholar] [CrossRef]
- Turner, I.L.; Harley, M.D.; Drummond, C.D. UAVs for coastal surveying. Coast. Eng. 2016, 114, 19–24. [Google Scholar] [CrossRef]
- Duffy, J.P.; Shutler, J.D.; Witt, M.J.; DeBell, L.; Anderson, K. Tracking Fine-Scale Structural Changes in Coastal Dune Morphology Using Kite Aerial Photography and Uncertainty-Assessed Structure-from-Motion Photogrammetry. Remote Sens. 2018, 10, 1494. [Google Scholar] [CrossRef]
- Moloney, J.G.; Hilton, M.J.; Sirguey, P.; Simons-Smith, T. Coastal dune surveying using a low-cost remotely piloted aerial system (RPAS). J. Coast. Res. 2018, 345, 1244–1255. [Google Scholar] [CrossRef]
- Laporte-Fauret, Q.; Marieu, V.; Castelle, B.; Michalet, R.; Bujan, S.; Rosebery, D. Lowcost UAV for high-resolution and large-scale coastal dune change monitoring using photogrammetry. J. Mar. Sci. Eng. 2019, 7, 63. [Google Scholar] [CrossRef]
- Shahbazi, M.; Sohn, G.; Théau, J.; Menard, P. Development and evaluation of a UAV-photogrammetry system for precise 3D environmental modeling. Sensors 2015, 15, 27493–27524. [Google Scholar] [CrossRef]
- Balaguer, L.; Escudero, A.; Martín-Duque, J.F.; Mola, I.; Aronson, J. The historical reference in restauration ecology: Re-defining a cornerstone concept. Biol. Conserv. 2014, 176, 12–20. [Google Scholar] [CrossRef]
- Gann, G.D.; McDonald, T.; Walder, B.; Aronson, J.; Nelson, C.R.; Jonson, J.; Hallet, J.G.; Eisenberg, C.; Guariguata, M.R.; Liu, J.; et al. International principles and standards for the practice of ecological restauration. Second edition. Restor. Ecol. 2019, 27, S1–S46. [Google Scholar] [CrossRef]
- Pagán, J.L.; Bañón, L.; López, I.; Bañón, C.; Aragonés, L. Monitoring the dune-beach system of Guardamar del Segura (Spain) using UAV, SfM and GIS techniques. Sci. Total Environ. 2019, 687, 1034–1045. [Google Scholar] [CrossRef]
- Lavoie, C.; Jimenez, J.; Canals, M.; Lastras, G.; de Mol, G.; Amblas, D.; Liquete, C.; de Batist, M.; Clarke, J.E.H. Influence on present-day coastal dynamics and evolution of a relict subaqueous delta lobe: Sol de Riu lobe, Ebro Delta. Cont. Shelf Res. 2014, 74, 94–104. [Google Scholar] [CrossRef]
- Crapoulet, A.; Héquette, A.; Marin, D.; Levoy, F.; Patrice, B. Variations in the response of the dune coast of northern France to major storms as a function of available beach sediment volume. Earth Surf. Process. Landf. 2017, 27, 1603–1622. [Google Scholar] [CrossRef]
- Pye, K.; Blott, S.J. Geomorphology assessment of beach and dune erosion and accretion using LIDAR: Impact of the stormy 2013–14 winter and longer term trends on the Sefton Coast, UK. Geomorphology 2016, 266, 146–167. [Google Scholar] [CrossRef]
- Fairley, I.; Horrillo-Caraballo, J.; Masters, I.; Karunarathna, H.; Reeve, D.E. Spatial variation in coastal dune evolution in a high tidal range environment. Remote Sens. 2020, 12, 3689. [Google Scholar] [CrossRef]
- Hilderbrand, R.H.; Watts, A.C.; Randle, A.M. The myths of restoration ecology. Ecol. Soc. 2005, 10, 19. [Google Scholar] [CrossRef]
- Lammers, C.; Reijers, V.C.; van der Heide, T. Scale-dependent interactions in coastal biogeomorphic landscapes: Pioneer both inhibits and facilitates primary foredune builder across spatial scales. Geomorphology 2024, 46, 109486. [Google Scholar] [CrossRef]
- Rodwell, J.S. (Ed.) British Plant Communities: Volume 5: Maritime Communities and Vegetation of Open Habitats; Cambridge University Press: Cambridge, UK, 2000. [Google Scholar]
- Gao, J.; Kennedy, D.M.; McSweeney, S. Patterns of vegetation expansion during dune stabilization at the decadal scale. Earth Surf. Process. Landf. 2023, 48, 3059–3073. [Google Scholar] [CrossRef]
- Bush, N.; Bush, E.; Sokolova, Y.; Bush, N.; Blanchard, P. Utilizing the physiological mechanisms of coastal plants for vegetative restoration of barrier islands. Ocean Coast. Manag. 2018, 161, 222–227. [Google Scholar] [CrossRef]
- Oldham, C.; McMahon, K.; Brown, E.J.; Bosserelle, C.; Lavery, P.S. A preliminary exploration of the physical properties of seagrass wrack that affect its offshore transport, deposition, and retention on a beach. Limnol. Oceanogr. 2014, 4, 120–135. [Google Scholar] [CrossRef]
- Mazarrasa, I.; Marbá, N.; Garcia-Orellana, J.; Masqué, P.; Arias-Ortiz, A.; Duarte, C.M. Effect of environmental factors (wave exposure and depth) and anthropogenic pressure in the C sink capacity of Posidonia oceanica meadows. Limnol. Oceanogr. 2017, 62, 1436–1450. [Google Scholar] [CrossRef]
- Fabbri, S.; Grottoli, E.; Armaroli, C.; Ciavola, P. Using high-spatial resolution UAV-derived data to evaluate vegetation and geomorphological changes on a dune field involved in a restoration endeavor. Remote Sens. 2021, 13, 1987. [Google Scholar] [CrossRef]
- Pinton, D.; Canestrelli, A.; Moon, R.; Wilkinson, B. Estimating ground elevation in coastal dunes from high-resolution UAV-LIDAR point clouds and photogrammetry. Remote Sens. 2023, 15, 226. [Google Scholar] [CrossRef]
Disclaimer/Publisher’s Note: The statements, opinions and data contained in all publications are solely those of the individual author(s) and contributor(s) and not of MDPI and/or the editor(s). MDPI and/or the editor(s) disclaim responsibility for any injury to people or property resulting from any ideas, methods, instructions or products referred to in the content. |
© 2025 by the authors. Licensee MDPI, Basel, Switzerland. This article is an open access article distributed under the terms and conditions of the Creative Commons Attribution (CC BY) license (https://creativecommons.org/licenses/by/4.0/).