1. Introduction
In Global Navigation Satellite System (GNSS) signal transmission, the ionosphere is the dominant source of positioning error [
1]. Dual-frequency receivers can effectively eliminate ionospheric error by utilizing the dispersive properties of the ionosphere and combining measurements at two distinct frequencies. However, most low-cost GNSS receivers operate on a single frequency, so they rely on ionospheric correction models to mitigate this error. Widely adopted ionospheric correction models include Global Ionosphere Map (GIM) and the Klobuchar Model (KM).
GIM provides vertical total electron content (VTEC) values at global grid points with a spatial resolution of 2.5° in latitude and 5° in longitude. To correct ionospheric errors using GIM, one must identify four grid points surrounding each ionospheric piercing point (IPP), interpolate VTECs at those four points to that at IPP, and then convert the interpolated results to slant total electron content (STEC) for the signal path. The final GIM products have 2 to 8 TECU (TEC Units) accuracy [
2], making GIM one of the most accurate global GNSS ionospheric models available. However, since the final GIM is generated through post-processing, its application in real-time positioning is inherently limited.
To support real-time applications, several International GNSS Service (IGS) analysis centers generate forecast GIMs, typically released 1–2 days in advance. Li et al. [
3] analyzed the long-term performance of forecast GIMs from three centers and found that the Center for Orbit Determination in Europe (CODE) provided the most accurate model. Wang et al. [
4] proposed a forecasting VTEC model using an adaptive autoregressive method. When compared with the final CODE GIM and validated against Jason-2 and Jason-3 altimeter data, their model achieved a root mean square error (RMSE) of 1.5 TECU, demonstrating high predictive accuracy [
5].
KM is a widely used ionospheric correction model that provides real-time global estimates of ionospheric delay. To apply KM, users compute the STEC along the signal path between satellite and receiver. The model can mitigate approximately 50–60% of the ionospheric delay [
6]. KM implementation requires eight coefficients, which are broadcast within the GPS navigation message. These parameters are updated and uploaded to satellites daily, although some values may remain unchanged for multiple days [
7]. KM employs a single set of coefficients for worldwide application, resulting in varying performance across different geographic regions, with the lowest correction accuracy in equatorial and low-latitude regions [
8].
To address KM’s limitations, regional satellite navigation systems such as the BeiDou Navigation Satellite System (BDS)-2 and the Quasi-Zenith Satellite System (QZSS) transmit their own tailored sets of KM coefficients. BDS-2 generates its Klobuchar parameters using dual-frequency GNSS observations from a dense network of permanent reference stations across China, thereby enhancing ionospheric delay correction within China and neighboring regions [
9]. Similarly, QZSS partitions its service coverage into Japan Area and Wide Area, and in addition to the standard GPS Klobuchar coefficients, it broadcasts regionally optimized Klobuchar parameters for each area [
10]. These regionally specific approaches are designed to improve ionospheric correction accuracy beyond that achievable with the single, globally applicable KM coefficients.
Recent studies have sought to improve the performance of KM by estimating refined sets of Klobuchar coefficients tailored to specific regions. Yuan et al. [
11] derived KM parameters using the Geometry-Free (GF) combination of carrier phase observations from both the Crustal Movement Observation Network of China (CMONOC) and IGS station networks, treating the GF combination as an observable in a least-squares (LS) adjustment. Application of these derived coefficients yielded improvements in positioning accuracy of up to 82% compared to no delay correction. Tongkasem et al. [
12] employed the Levenberg–Marquardt method to generate KM coefficients based on STEC values derived from dual-frequency observations at four sites in Thailand. These optimized coefficients improved STEC estimation accuracy by approximately 21.7% relative to standard KM. Nishimoto et al. [
13] estimated KM coefficients through a spherical harmonic (SH) analysis of GNSS data from a dense Japanese network, achieving reductions in vertical RMSE of up to 77.7% compared to conventional Klobuchar values. Similarly, Ratnam et al. [
14] applied multi-shell SH functions to GPS-Aided GEO Augmented Navigation (GAGAN) TEC data and adjusted the Klobuchar coefficients based on the resulting ionospheric delay estimates. This methodology improved STEC accuracy by 62.3–77.1% compared to standard KM. Collectively, these studies demonstrate that regionally optimized KM coefficients can significantly improve ionospheric delay correction.
However, the above approaches may require observations from extensive GNSS station networks, involving complex data collection and processing. For example, when using a SH-based model, KM parameters must be re-estimated after the SH coefficients are updated, a requirement undermining the simplicity and computational efficiency that are hallmarks of the original KM. This study investigates whether KM performance can be improved by relying solely on IGS GIM data, thereby minimizing the need for complex data processing while retaining the model’s inherent advantages.
We tested a method for estimating regionally optimized KM coefficients using IGS GIM to enhance the accuracy of KM in ionospheric delay correction. We utilized, first, STEC observations from up to five permanent GNSS sites in South Korea and, second, VTEC values from 120 grid points in and around the Korean Peninsula as input datasets. The regionally refined Klobuchar parameters were derived through LS fitting to minimize the difference between model predictions and observed values. The remainder of this paper is structured as follows:
Section 2 provides a comparative overview of the GIM and KM ionospheric models, followed by a detailed explanation of the improved parameter estimation methodology and the associated mathematical formulations.
Section 3 describes the STEC-based estimation methodology, utilizing data from one or five South Korean stations, and presents the findings.
Section 4 introduces the VTEC-based approach applied to a broader area covering 120 grid points and assesses the long-term stability of the proposed method through comprehensive validation.
Section 5 discusses the validation strategy, addressing the challenges of directly comparing TEC observations and demonstrating the models’ reliability through the analysis of satellite positioning errors.
2. Least-Squares Estimation with Klobuchar Model and GIM
2.1. Klobuchar Model
The KM is based on the assumption that ionospheric electrons are concentrated in a single thin layer positioned 350 km above the Earth’s surface. The ionospheric delay
from this model is set to a constant value of 5 ns at night, and a half-cosine function daytime variation centered on 14:00 local time. The KM can be represented by Equation (1), which requires the three-dimensional coordinates of the station and satellite, the observation time, and eight Klobuchar coefficients. This equation is based on a polynomial that expresses the cosine function as a Taylor series [
6].
F is a mapping function that converts VTEC to STEC, given by
, where
E is the elevation angle of the signal path;
DC is the constant nighttime delay of 5 ns;
AMP, the amplitude of the cosine function, is given by Equation (2).
Here
represents the geomagnetic latitude of the IPP, the point where the Line of Sight (LoS) vector connecting the station position and a specific satellite intersects the thin ionosphere layer. If the
AMP value calculated using the geomagnetic latitude and four Klobuchar coefficients
is less than 0, it is set to 0. In Equation (1),
x in the Taylor series expansion is calculated from
, where
t is the observation epoch in GPS week-seconds.
PER is the period, given by Equation (3), for which four additional Klobuchar coefficients
are required.
If the calculated
PER is less than 72,000, it is adjusted to 72,000. If the absolute value of
x appearing in Equation (1) is greater than or equal to 1.57 (corresponding to nighttime), the ionospheric delay is simply the product of the mapping function
F and
DC. Additional details can be found in references such as [
6].
2.2. GIM
GIM is a gridded ionospheric model generated by processing the data collected from permanent stations worldwide in near-real-time or post-processing. It models the ionosphere as a single thin layer, similar to the KM, but assumes a layer altitude of 450 km rather than KM’s 350 km. The model has a spatial resolution of 5° longitude and 2.5° latitude, providing VTEC in TECU at each grid point. Currently, multiple IGS analysis centers are responsible for generating GIMs. They regularly produce two products: the final GIM and the rapid GIM. The IGS collects the GIM products from these analysis centers and compiles them into a final combined model. However, the final GIM has a latency of approximately 13 to 20 days [
2].
In this study, VTEC data from the final GIM provided by IGS and STEC observations were used in estimating refined Klobuchar coefficients using least-squares estimation (LSE). GIM provides VTEC on a global grid at two-hour intervals. Determining VTEC values at any other epoch requires temporal interpolation, for which the cubic spline method was applied [
15]. Spatial interpolation was conducted as follows. First, the latitude and longitude of the IPP, defined as for KM, but with assumed ionospheric altitude 450 km, were calculated. Then, the VTEC value at the IPP was obtained by interpolating VTEC values from four surrounding grid points. Bi-linear interpolation using the distances to these grid points was applied [
16]. When VTEC needed to be converted to STEC in a specific LoS direction, the obliquity factor
F from [
1] was used.
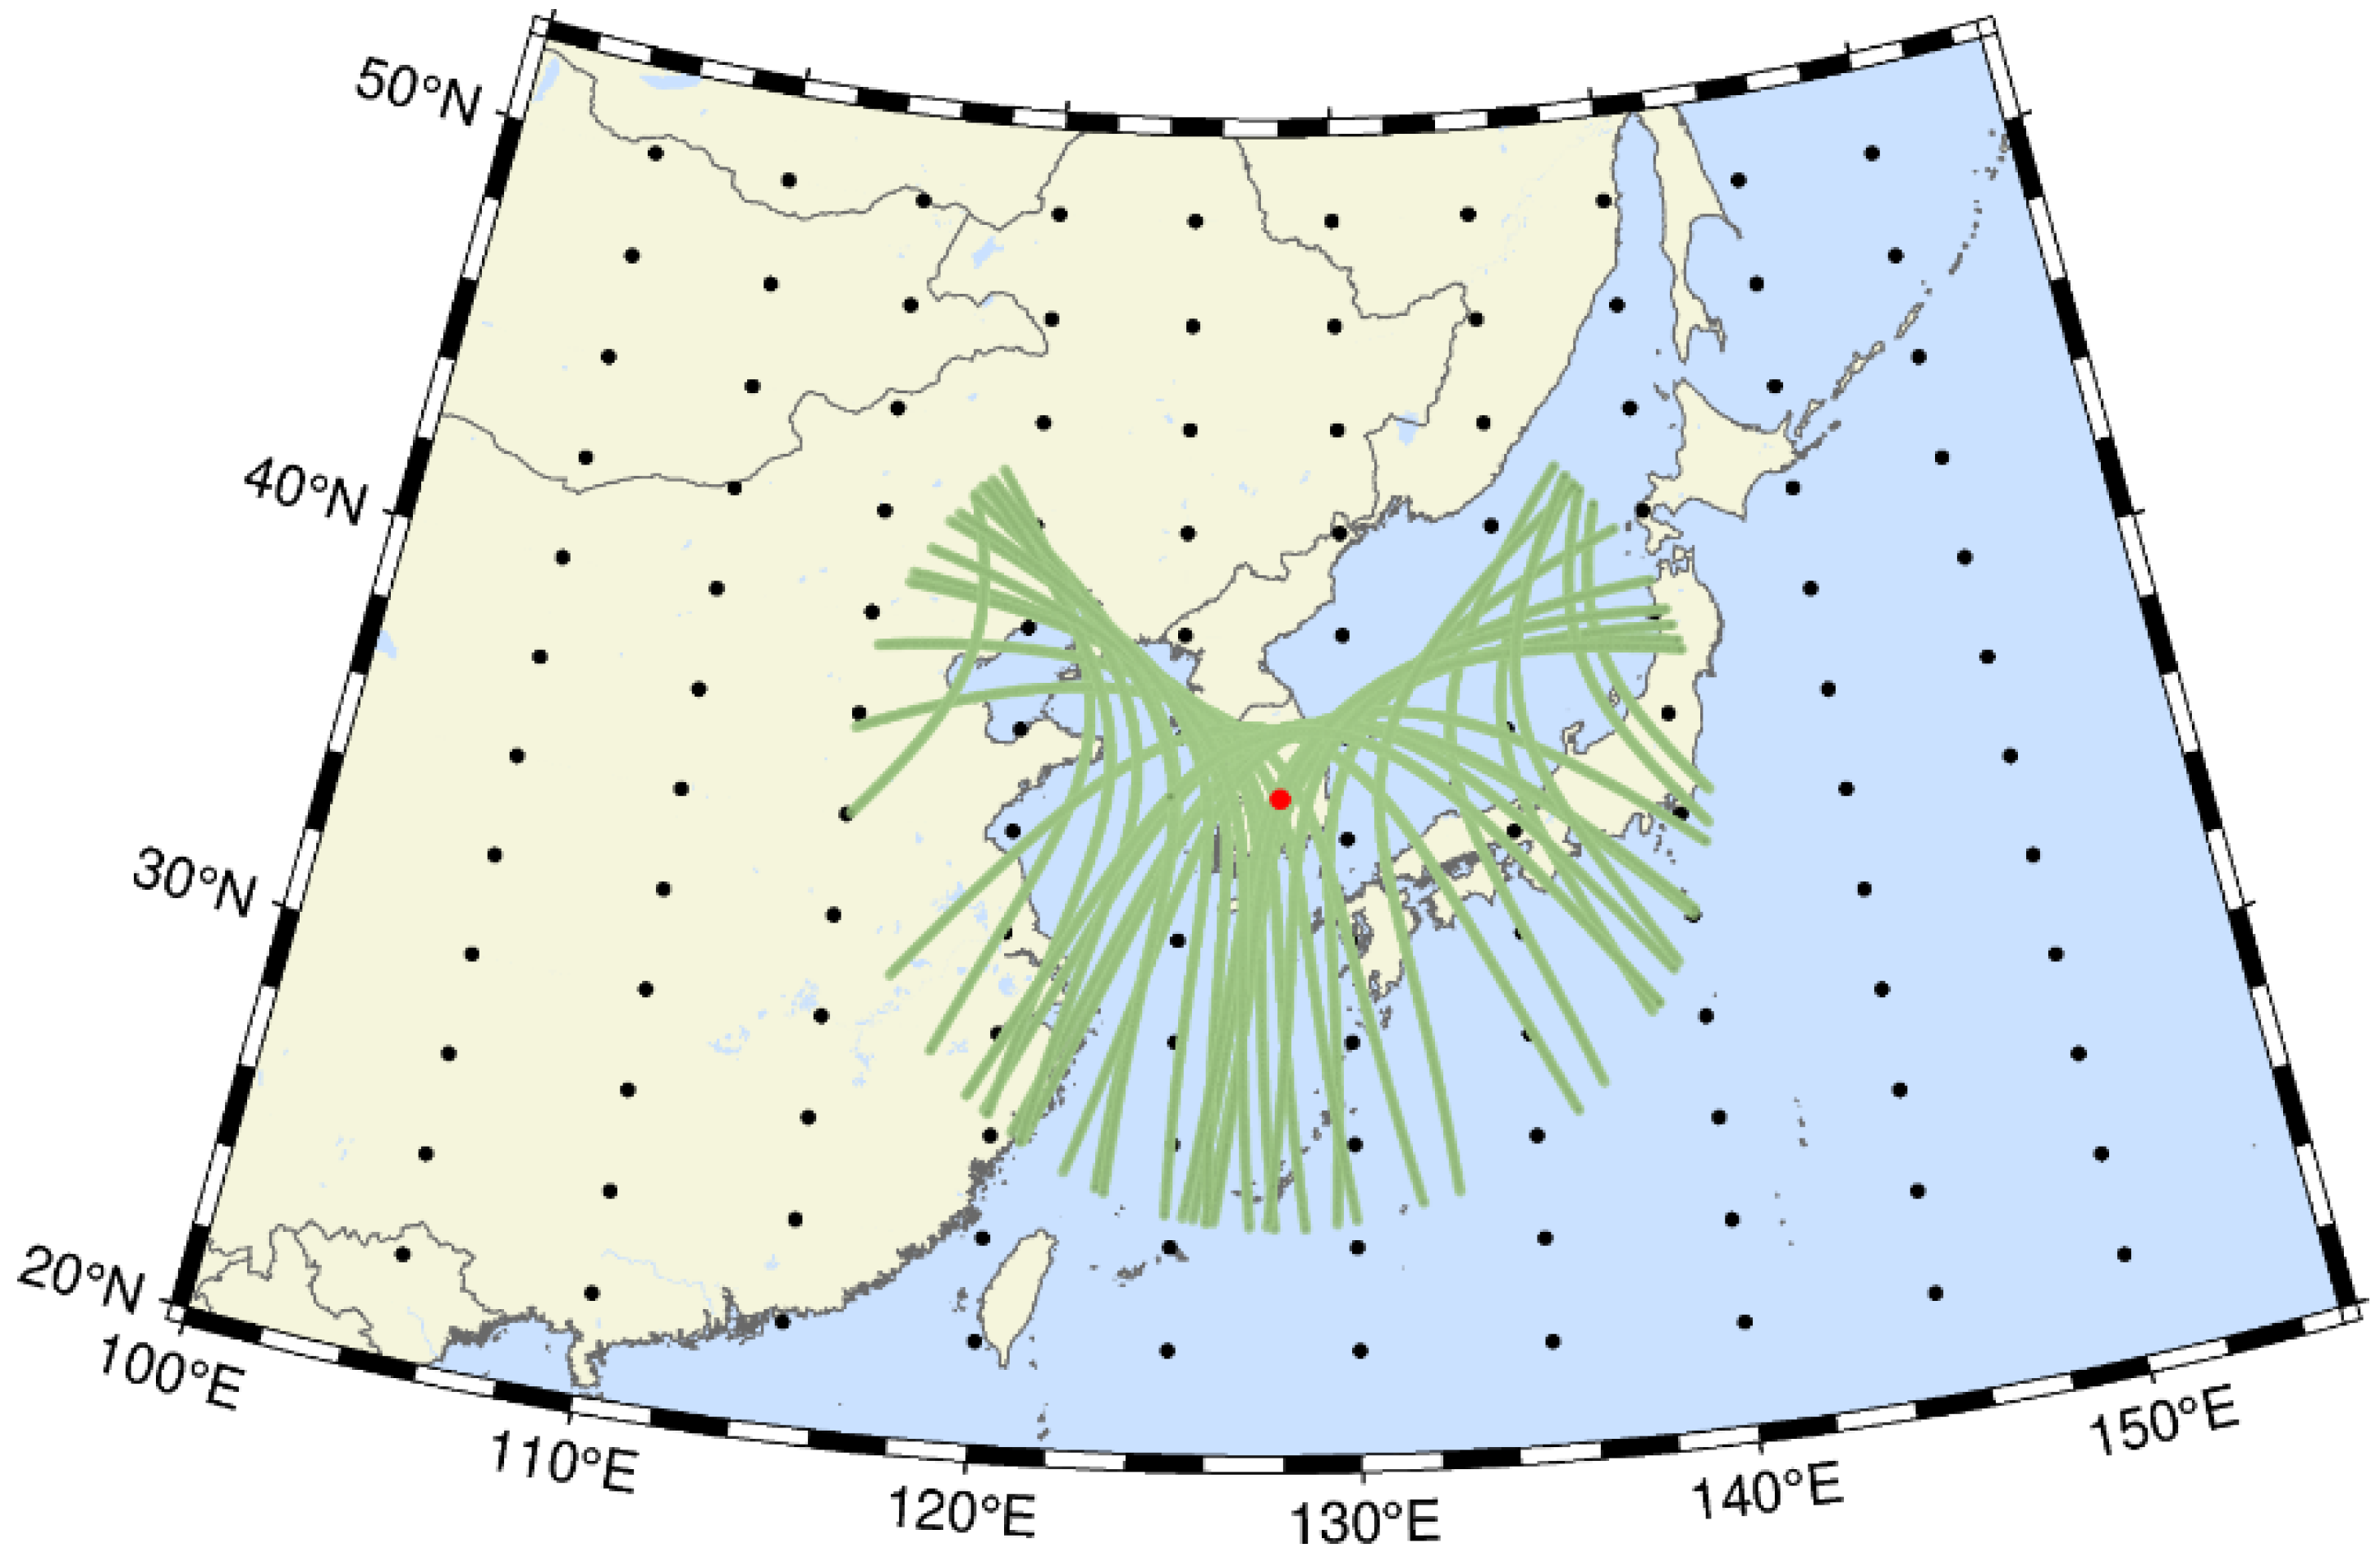
To generate and validate regionally optimized Klobuchar coefficients for the regional satellite navigation service rather than the global one, the Korean peninsula and its surrounding area were selected as the test region. The IPP trajectories of daily GPS satellite observations from a central location on the peninsula are depicted in
Figure 1, assuming an elevation cutoff angle of 15°. To include a wider region than the Korean Peninsula, the study area of 22.5°–50.0°N and 105.0°–150.0°E was adopted as suggested by [
17]. This has 12 and 10 GIM grid points in the latitude and longitude directions, respectively, a total of 120 grid points, as shown in
Figure 1.
2.3. Least-Squares Estimation
In this study, we applied the LS method to estimate the coefficients of the KM. The LSE is a technique used to estimate parameters by minimizing the square of the difference between observed values and those predicted by the model. The predicted values are computed from the model itself. The matrix equation for the nonlinear LSE is represented as
, where the notation is consistent with that used in [
18]. Here,
J is the Jacobian matrix, containing the partial derivatives of Equation (1) with respect to the eight unknown coefficients. The Jacobian matrix is given in Equation (4), with superscripts 1 through
n corresponding to the IDs of the
n observed satellites. We assume that the total number of observations is
n. Other relevant matrices are provided in Equations (5) and (6). The
K matrix represents the difference between the ionospheric delays calculated by GIM and the KM. Additionally, the
X matrix contains the increments of the eight unknown coefficients. We set the maximum number of iterations to five to obtain the most probable values for these coefficients.
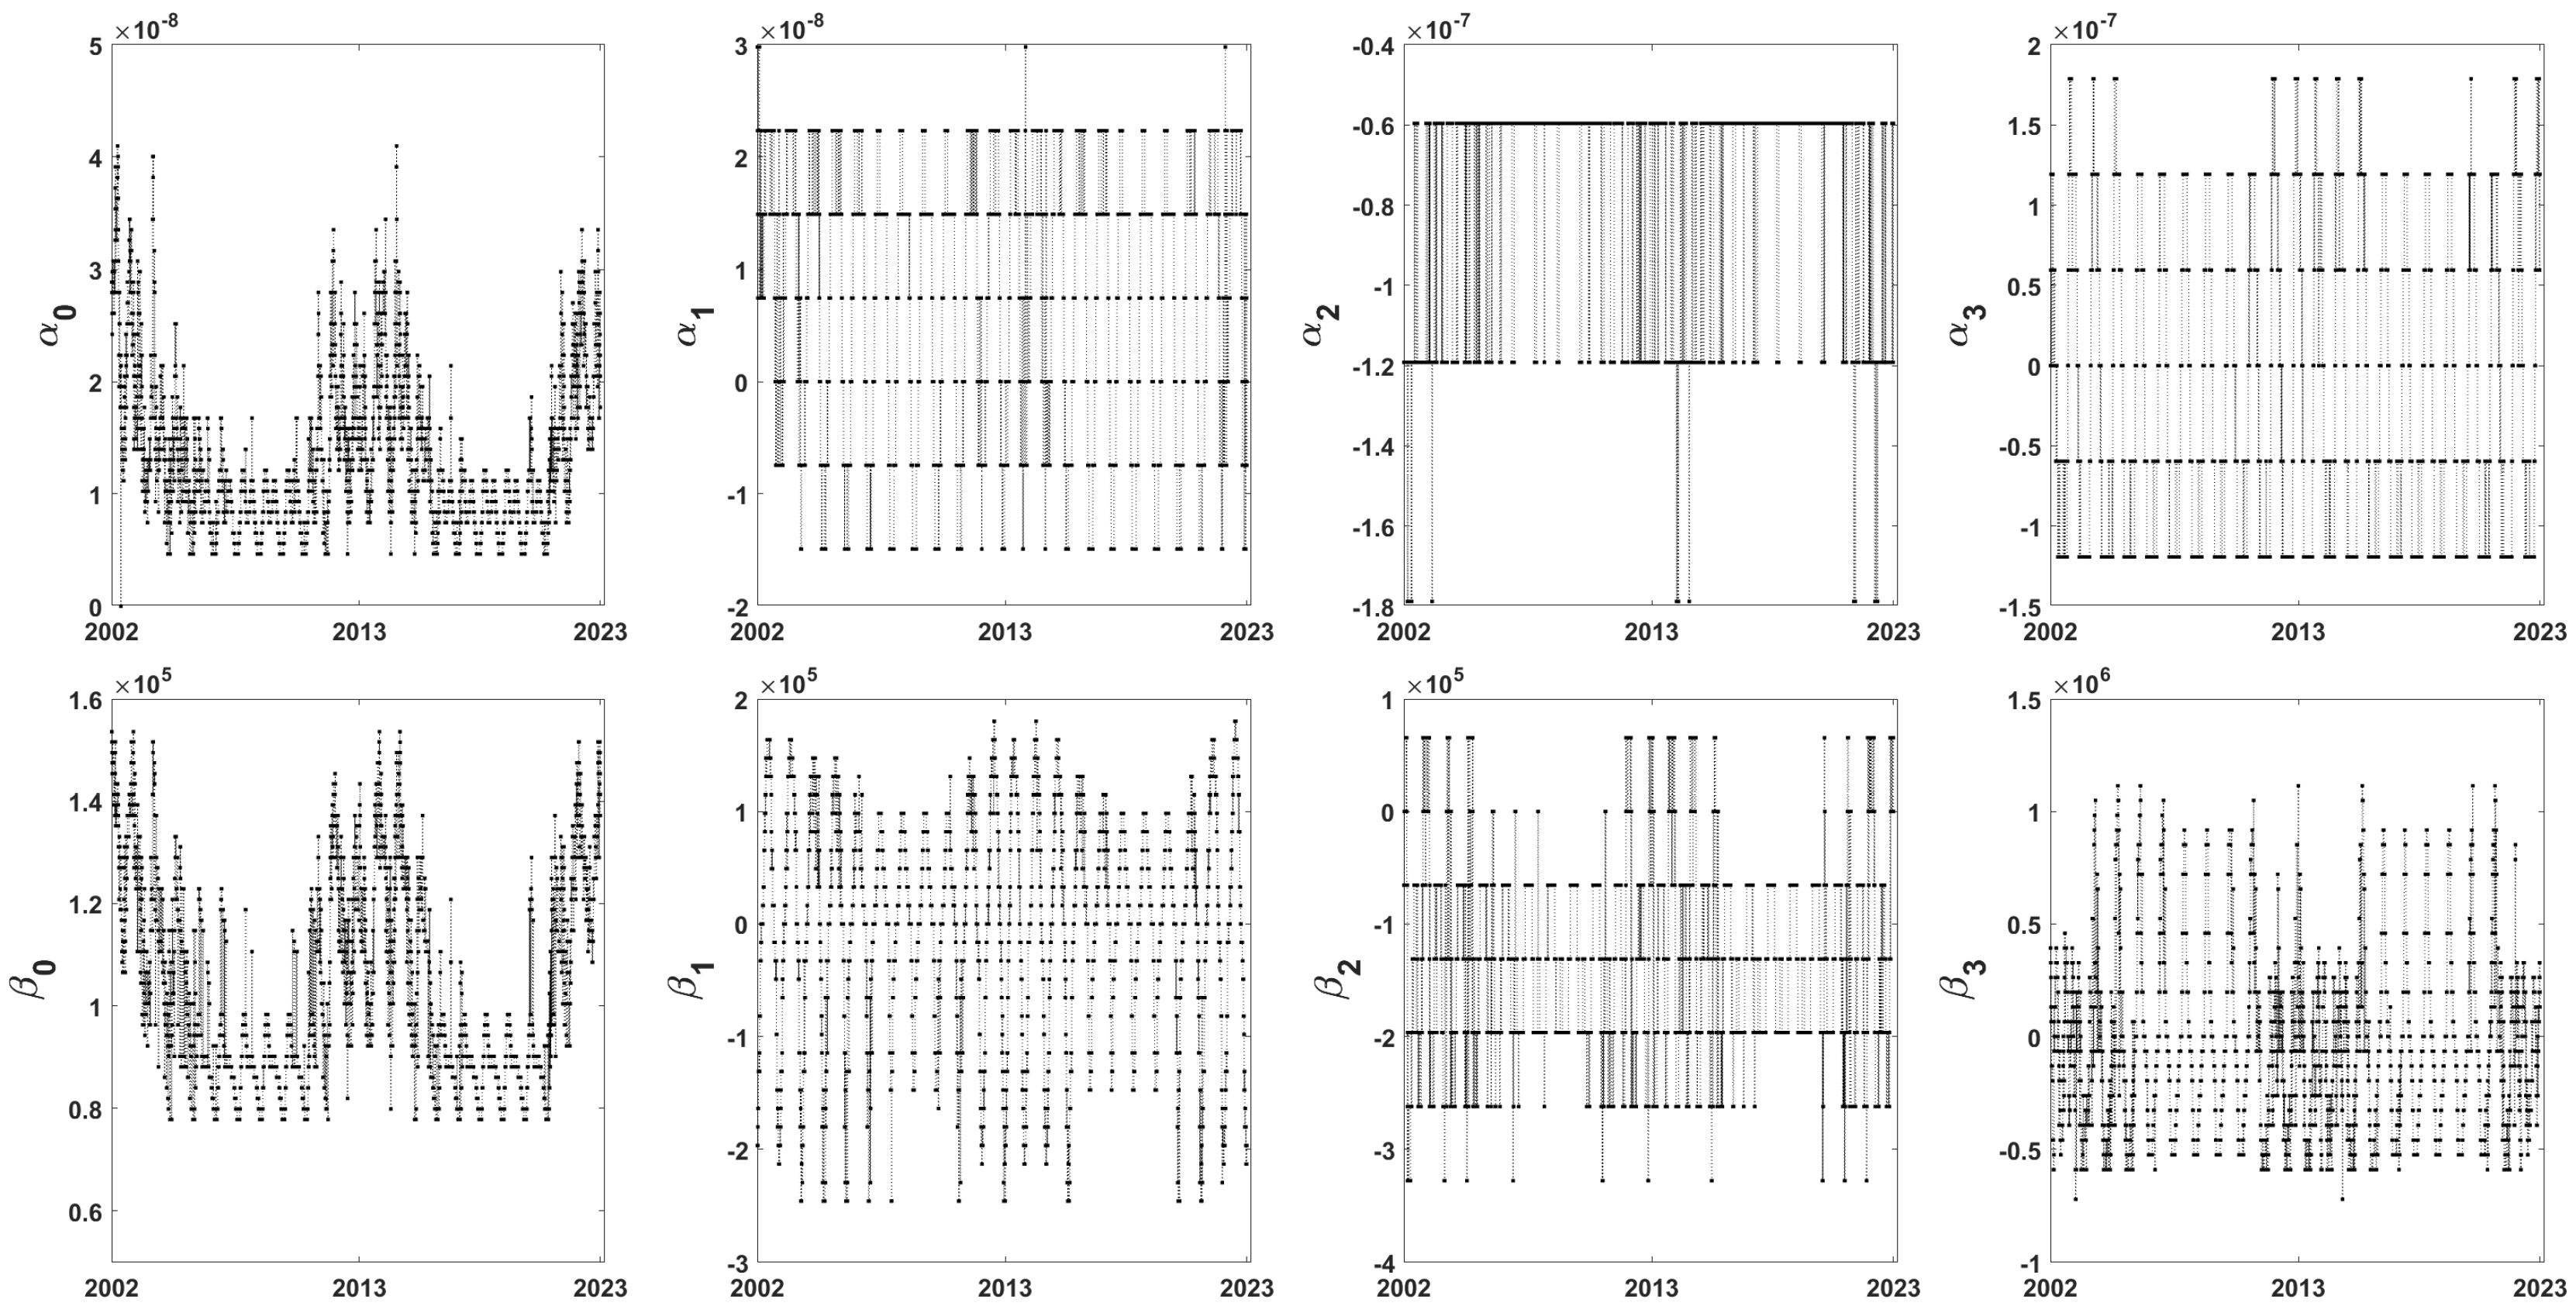
To select the initial values for LSE, the Klobuchar coefficients for 22 years corresponding to two solar cycles were analyzed.
Figure 2 shows the 22-year time series of eight coefficients received at the IGS DAEJ site located in Korea. In addition to
, which has only 3 values for 22 years,
,
and
have just seven, six, and seven values, respectively. Even though these four parameters have a limited number of values of less than ten, they show long-term patterns according to solar cycles in addition to annual signals. In the case of
, which has the largest number of values, totaling 41, seasonal and long-term signals are evident.
and
have different fluctuation characteristics, but their types of values are similar, with 27 and 28, respectively. Finally, it is noteworthy that
has the largest number of values among the
parameters, 38, and shows a very similar fluctuation pattern to
. Although we could not obtain information on how the values of the eight parameters of KM are selected, it is encouraging that most of the parameters have clear periodic patterns according to solar activity and seasons. However, the limited number of combinations is presumed to be one of the reasons why the accuracy of the KM is limited to 50–60% [
6].
In our preliminary study, we tested the minimum, maximum, and average values of each coefficient over 22 years as initial values for the LSE. Additionally, we incorporated the Klobuchar coefficients from the day of analysis and the previous day as initial conditions. Our findings revealed that the most stable and efficient estimations were obtained by utilizing the average values of the eight Klobuchar coefficients. It is important to note that all subsequent analysis results were based on these average coefficient values as the initial conditions in the LSE.
To ensure the validity and stability of the algorithm proposed in this study, we performed a preliminary analysis of the estimated coefficients. This analysis revealed no outliers; therefore, a separate outlier-handling process was not applied. In addition, since the results obtained with and without elevation-dependent weighting were nearly identical, no weighting strategy based on satellite elevation angle was used. Finally, we examined the rate of change in the correction coefficients across iterations and confirmed that the convergence characteristics were sufficiently stable. Together, these examinations substantiate the credibility of the proposed methodology.
2.4. STEC vs. VTEC
The observations used to estimate the eight coefficients correspond to “obs” in the matrix equation K = obs − com. These values are derived directly from the VTEC provided by the GIM and can be applied without modification. Alternatively, STEC can be calculated from the VTEC at the computed IPP location by applying the obliquity factor. Conversely, for “com” the ionospheric delay was computed iteratively using Equation (1), with the average Klobuchar coefficients over 22 years adopted as the initial conditions. In this study, coefficients estimated using GIM-derived STEC are denoted as KRS, while those based on VTEC are denoted as KRV. Here, “KR” stands for Klobuchar Regional, with “S” indicating STEC and “V” indicating VTEC. Finally, for accuracy verification, the ionospheric delay calculated using the GPS Klobuchar coefficients of the day is referred to as KG.
In the case of STEC-based LSE, “obs” are taken at 30 s intervals for all visible satellites from the chosen site. This process involves two computation steps: interpreting the navigation message and localizing the IPP. Additionally, more computation time is required for spatio-temporal interpolation of the given VTEC values, which are provided at 2 h intervals. In contrast, when using VTEC, grid point locations act as observation stations. Therefore, there is no need to calculate satellite orbits, and the IPP can be assumed to align with the zenith direction at the grid point. This significantly reduces the computational load, as spatial interpolation is not necessary. Furthermore, we utilized the original VTEC measurements provided by the GIM without any temporal interpolation. More details of the LSE procedures for STEC and VTEC analyses, along with their results, are discussed in
Section 3 and
Section 4, respectively.
3. STEC-Based Estimation
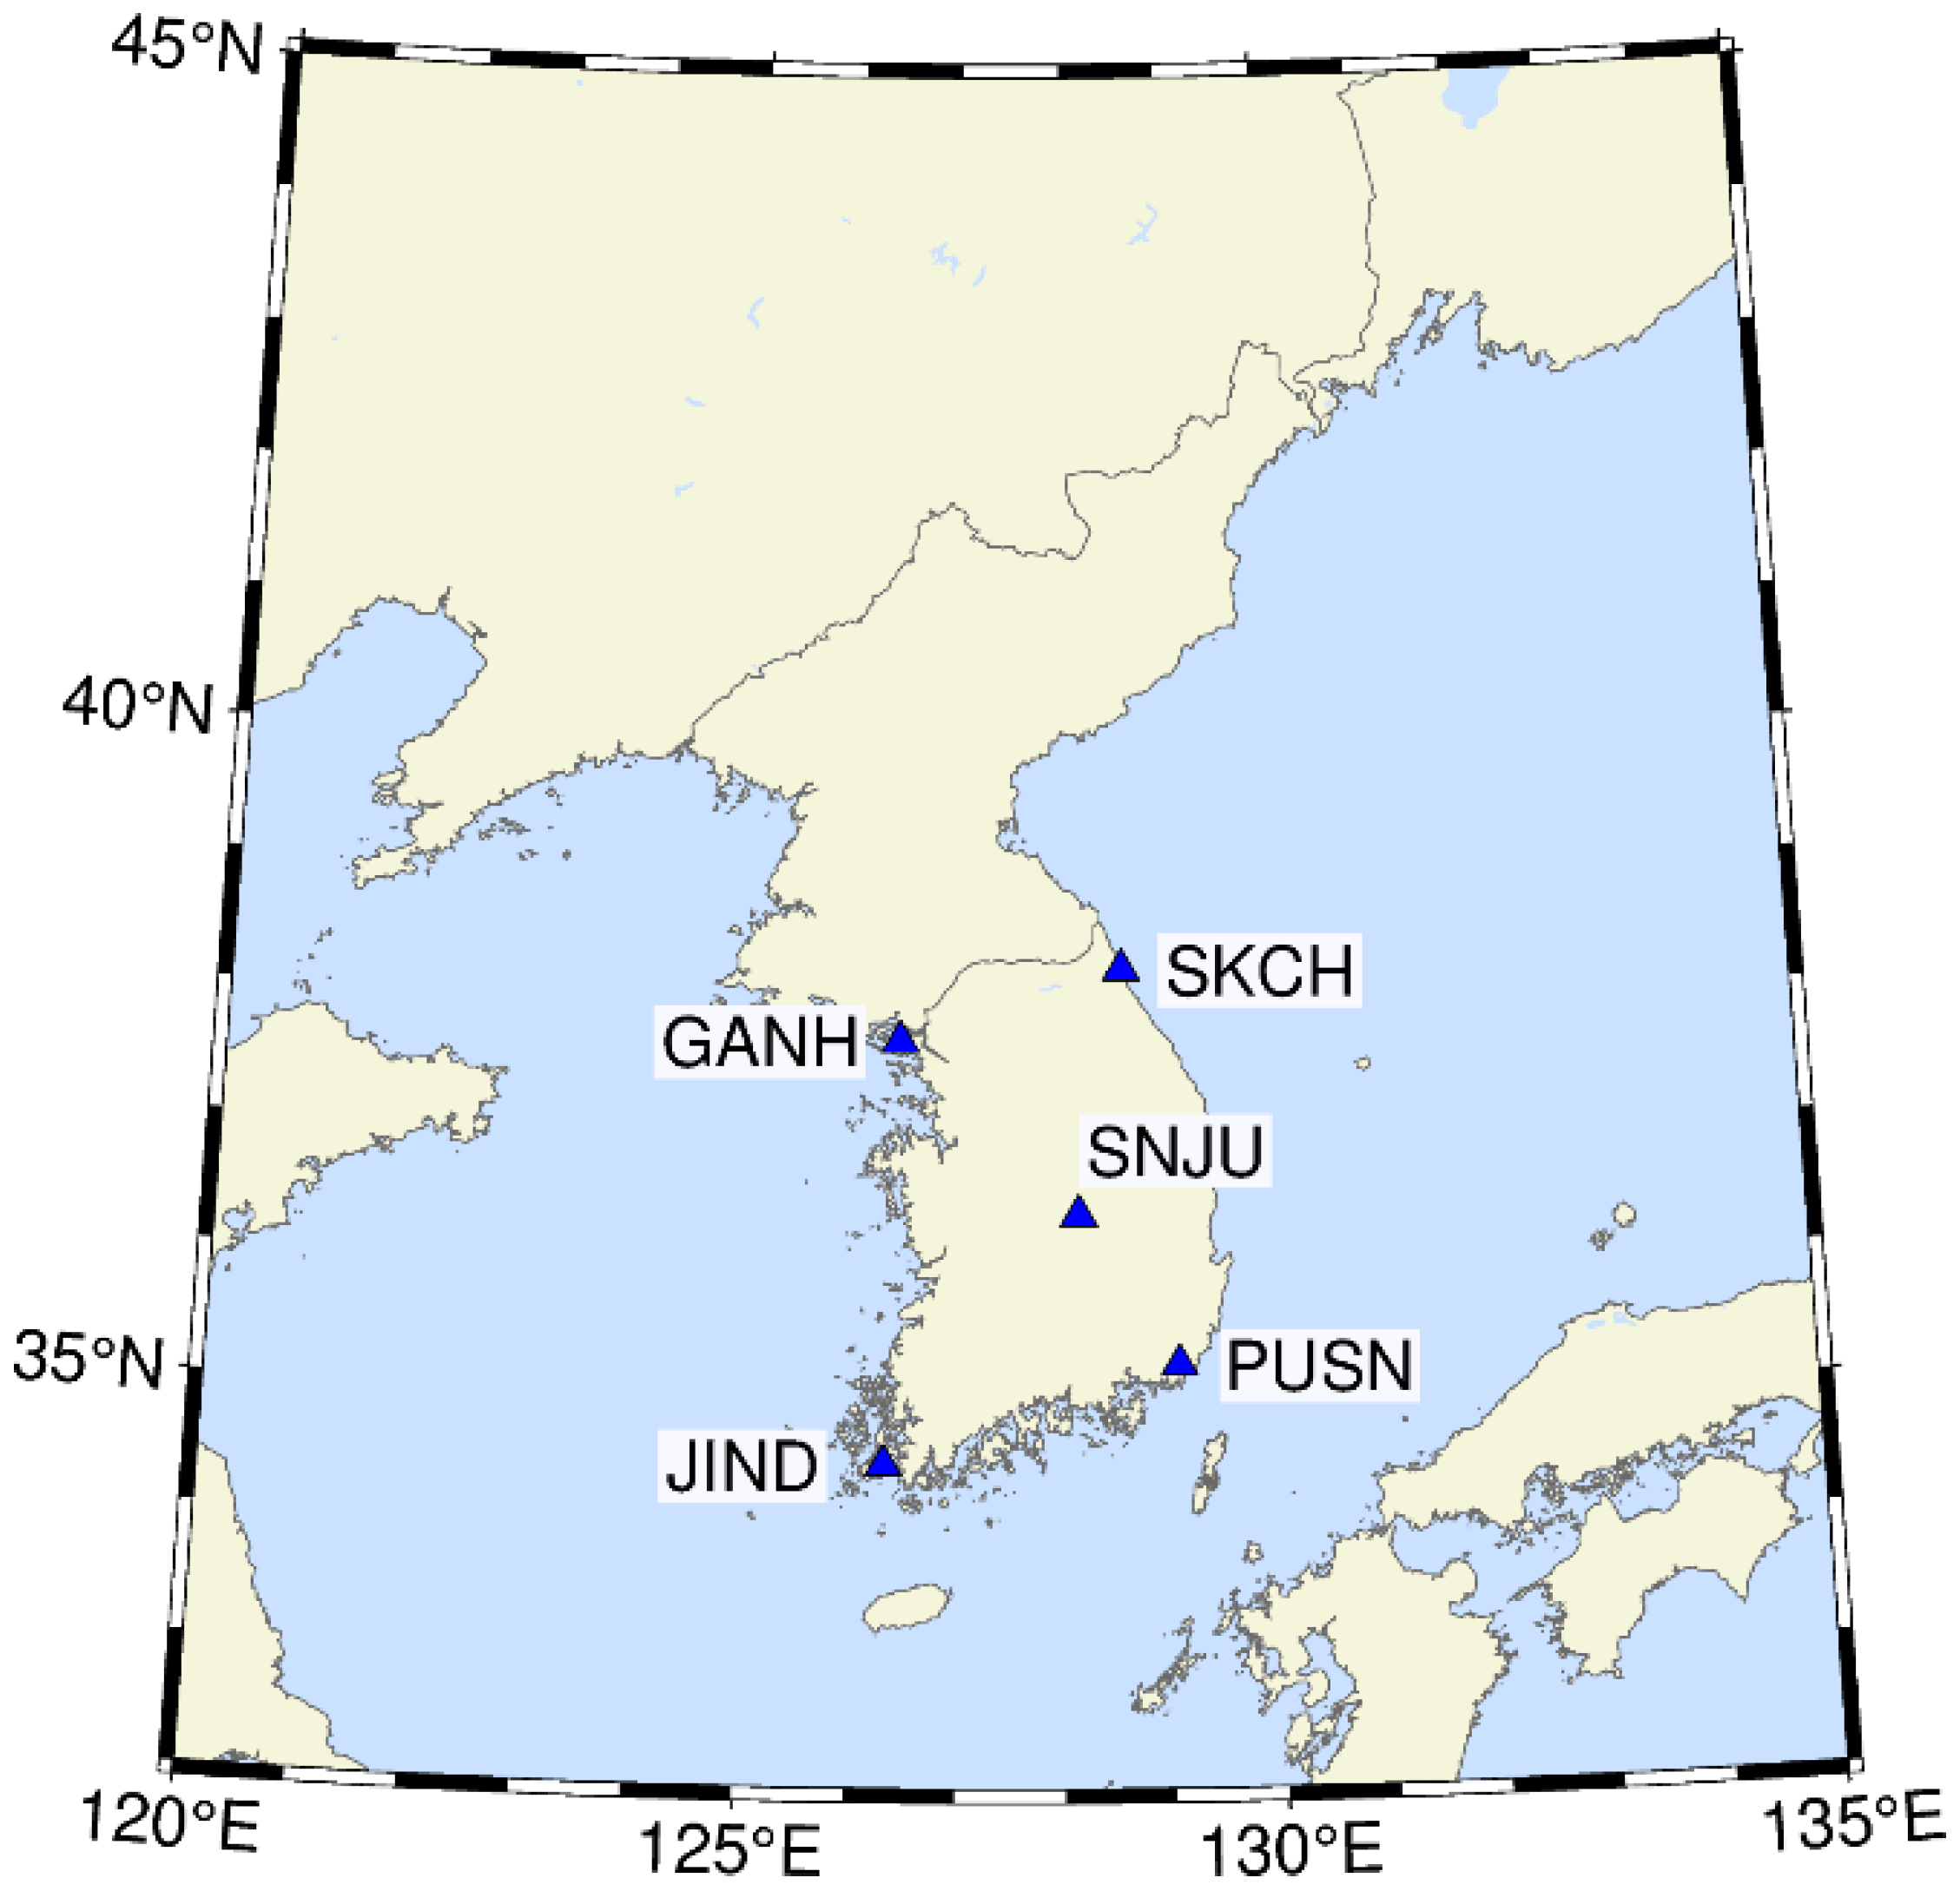
The test dataset used to generate the KRS model, which estimates Klobuchar coefficients based on STEC values, was collected from the year 2022. Continuous seven-day datasets for each of four months (1–7 January, 1–7 April, 1–7 July, and 1–7 October) were selected to represent the seasonal variations in ionospheric density. SNJU station, in the central Korean Peninsula, was selected as the STEC observation point. The geographic locations of SNJU and four additional GNSS stations in Korea, to be discussed later in this section, are shown in
Figure 3.
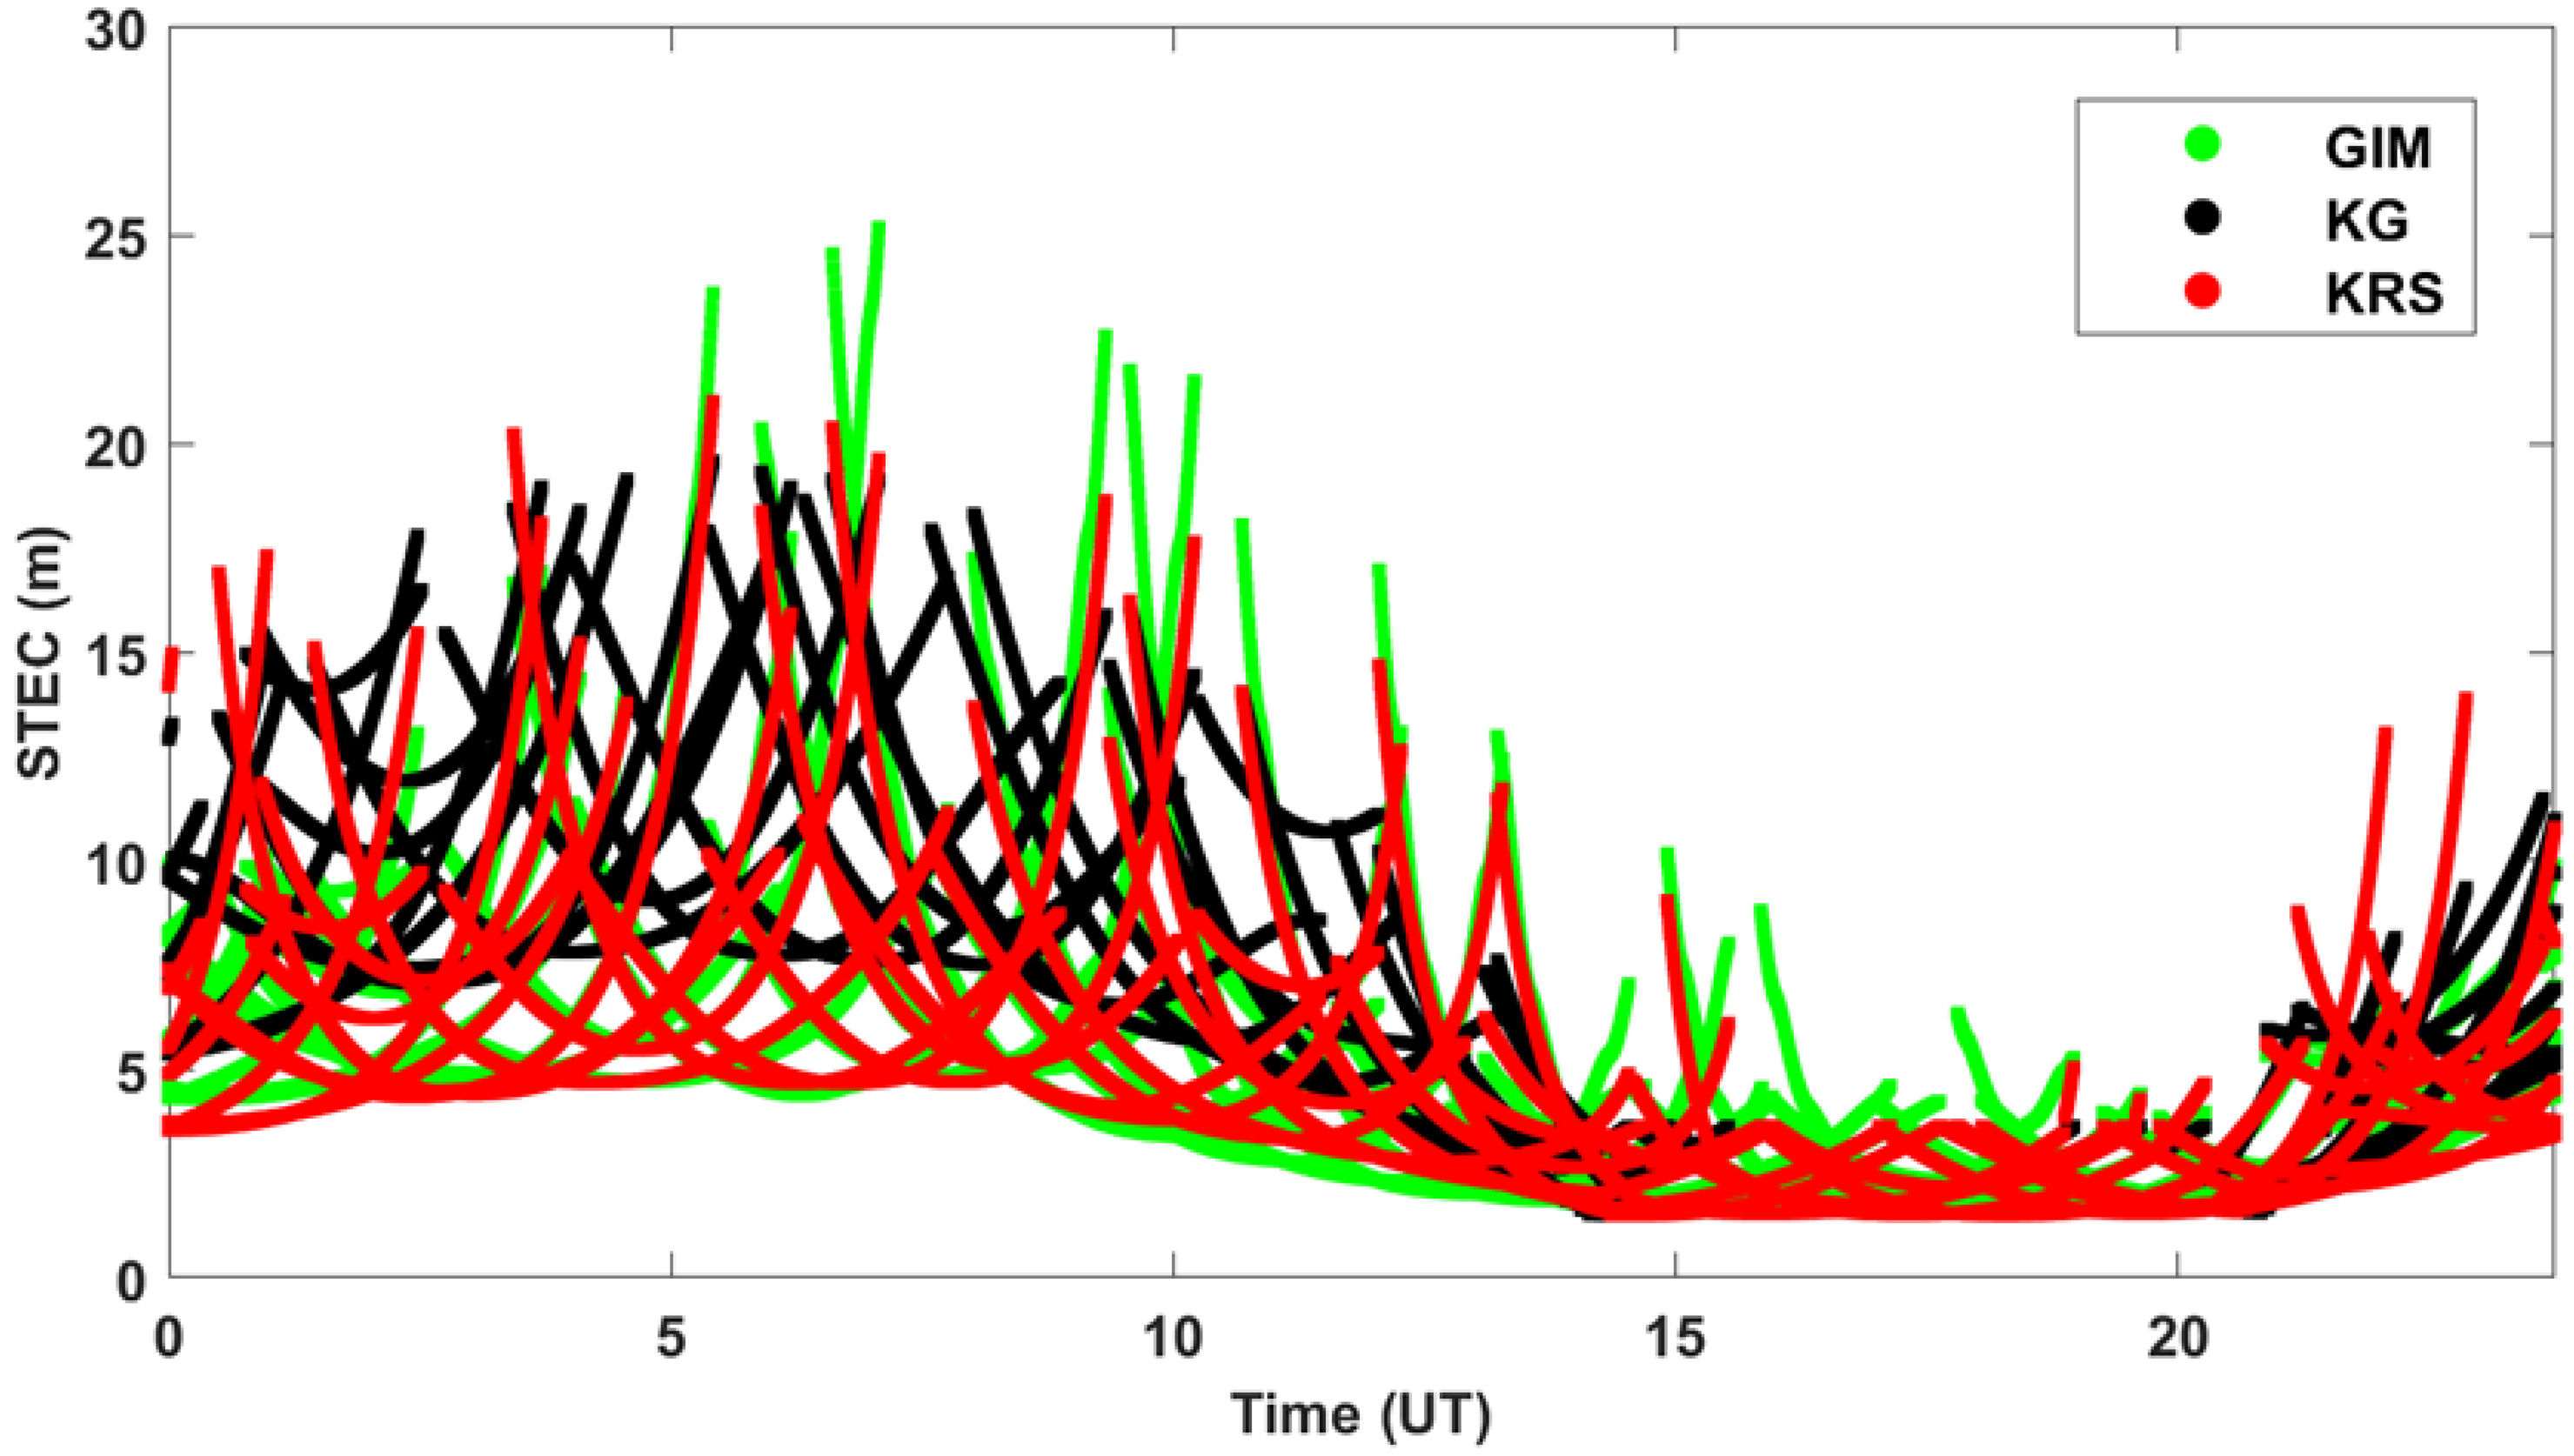
Figure 4 shows three types of computed STEC values of ionospheric delay errors at the SNJU site, based on KG, KRS, and GIM models, from 31 satellites, for Day of Year (DOY) 274 (1 October), 2022. These delays are denoted as equivalent distances in meters. The KG results (black lines) were calculated using the KM with the eight coefficients provided in the navigation message for that day, at 30 s intervals. The GIM-based ionospheric delay (green lines), served as the benchmark for evaluation. KRS (red lines) was derived by performing LS fitting to the GIM predictions.
It is evident that the KRS model shows values and trends similar to those of GIM. The RMS difference between the KRS and GIM models was 0.83 m. In contrast, the RMS difference between KG and GIM was 2.69 m, nearly three times larger. This corresponds to a KRS improvement ratio of 69.1%. Another feature of
Figure 4 is that the difference between KRS and KG during the UT hours of 14:00–21:00, which correspond to nighttime in local time (0.06 m), was significantly lower than that for other hours (2.65 m). This is because the DC was fixed at 5 ns in the estimation process for the KRS model, as in KM. If the DC value were additionally estimated, different results would be expected, as in previous studies [
19,
20,
21].
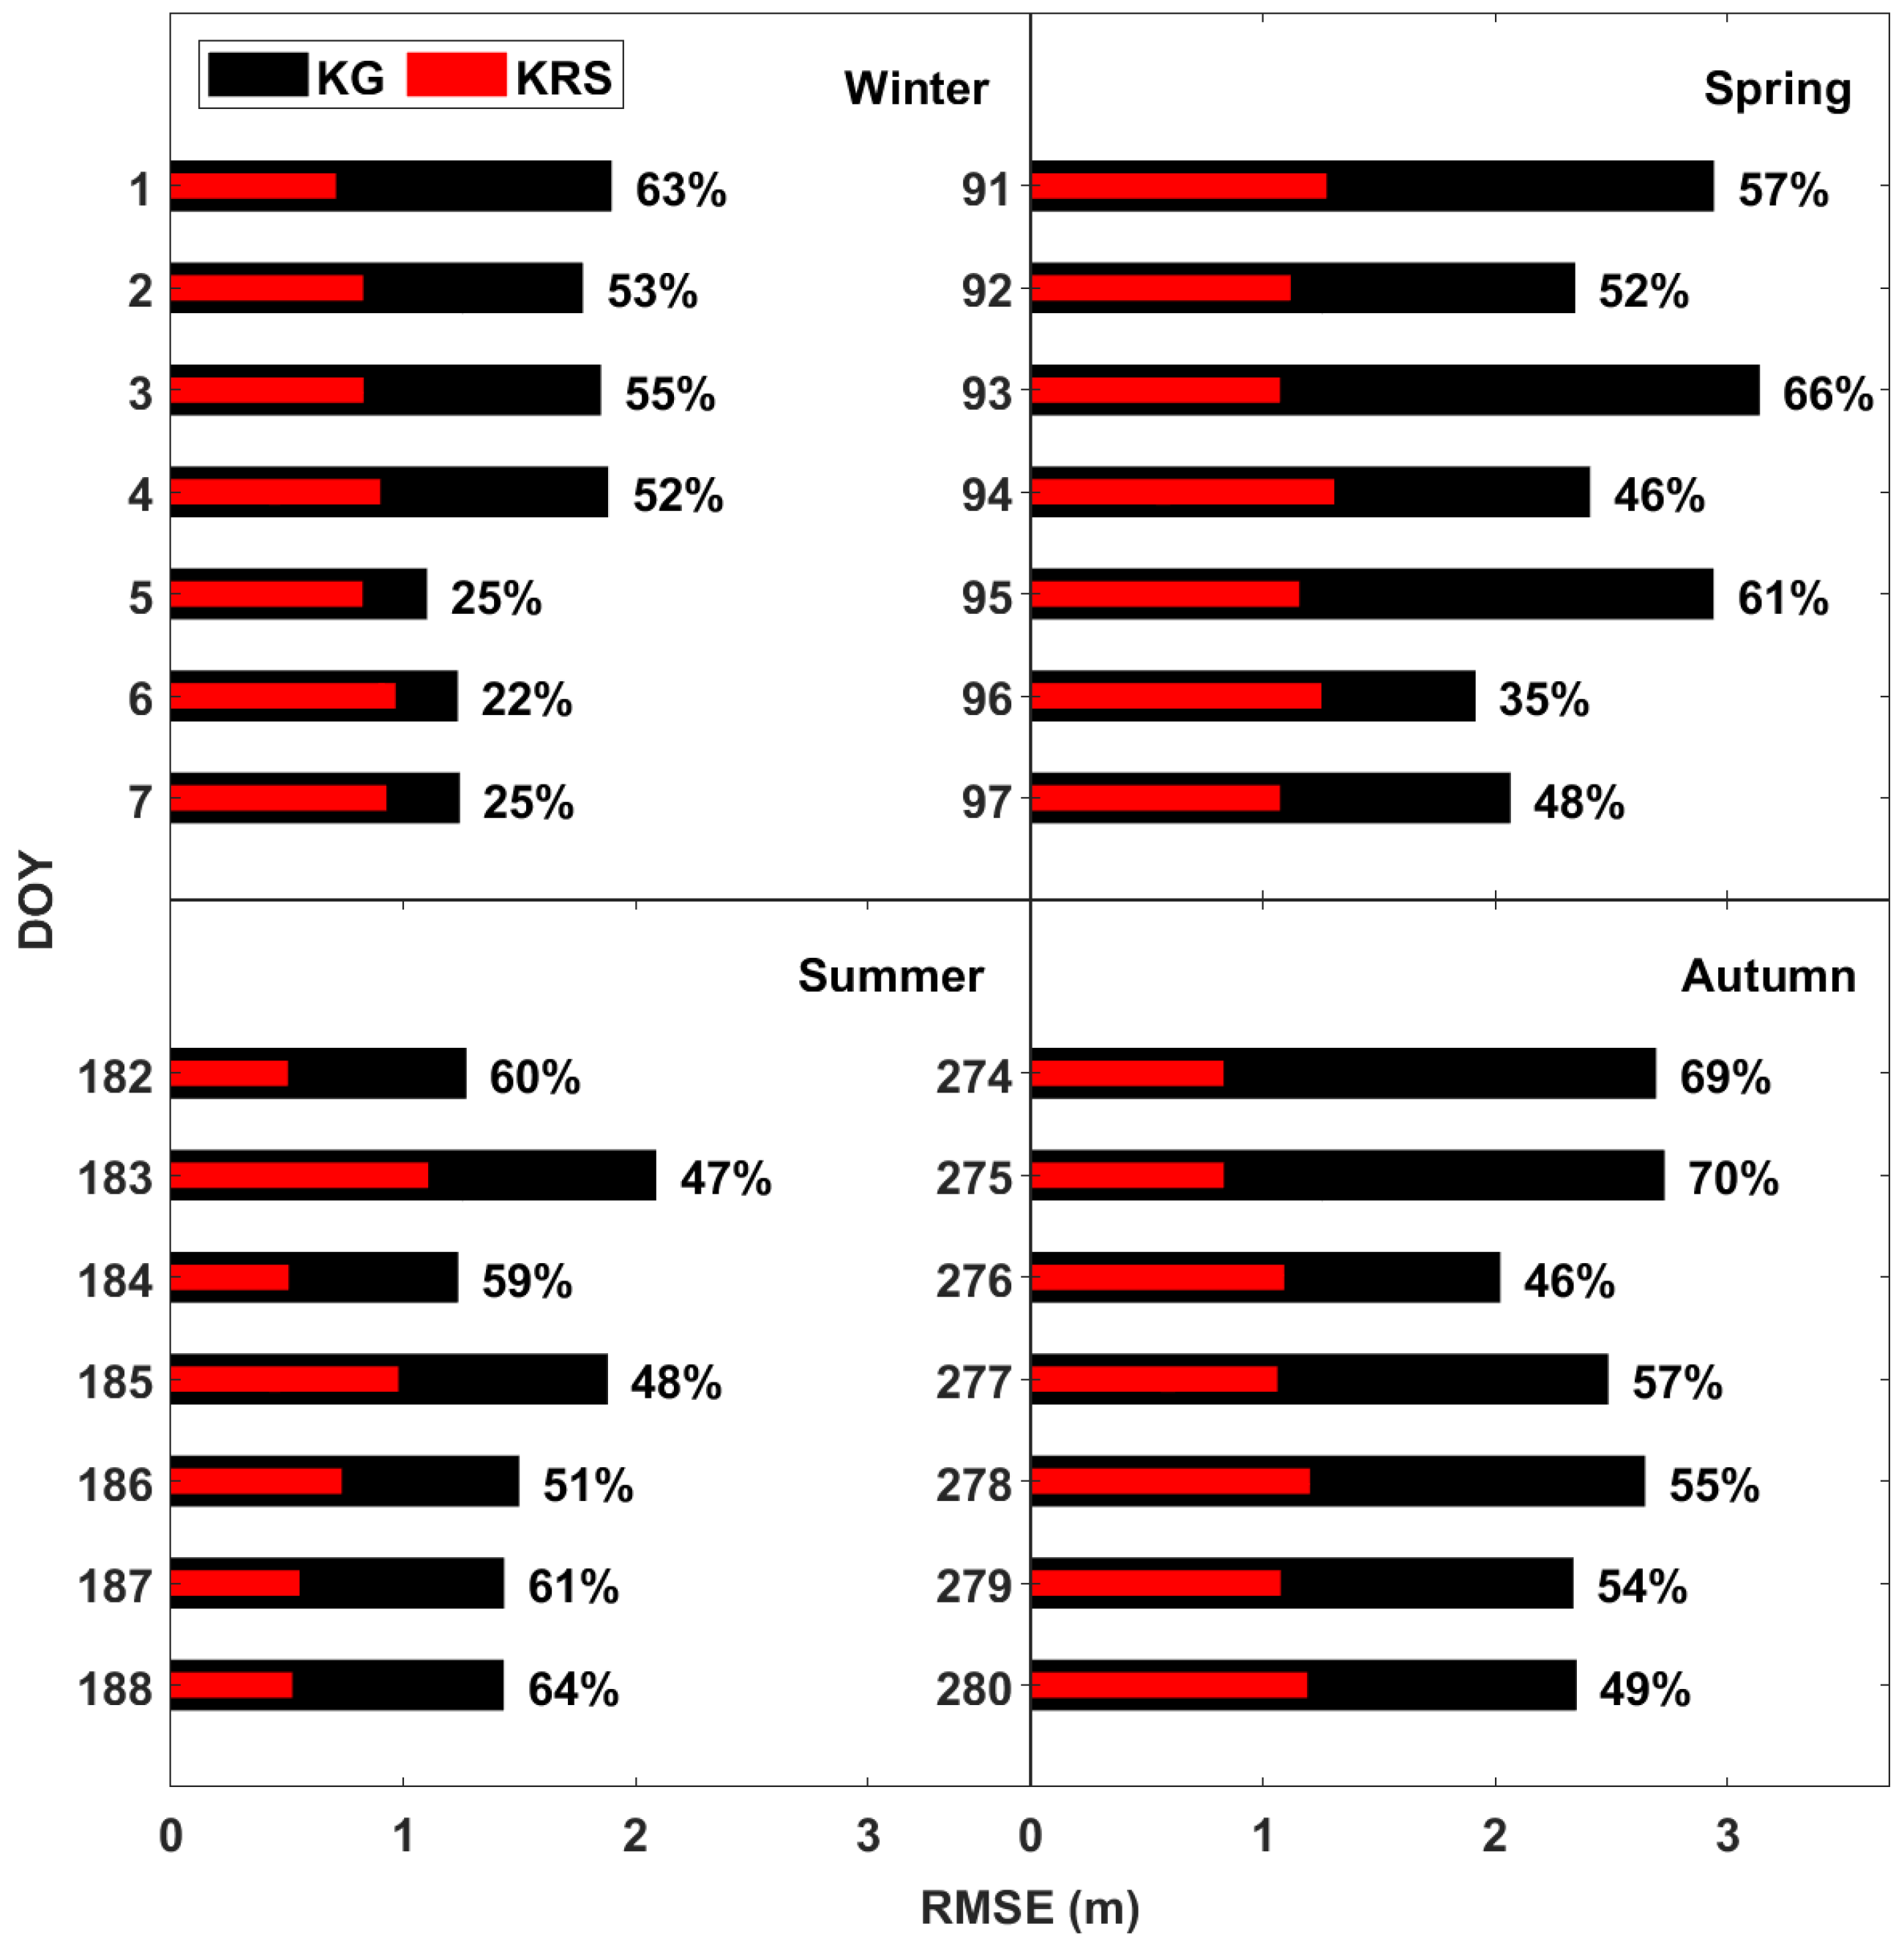
Figure 5 shows the RMSEs of KRS (red bars) and KG (black bars) relative to GIM, obtained for seven days each season. The numbers on the right sides of the bars are the RMSE improvement rates (in %) of KRS compared to KG. All KRS RMSE values were found to be lower than KG. The mean RMSEs for the entire 28 days were 0.94 m and 2.03 m for KRS and KG, respectively, a difference of 1.09 m. Comparing seasons, the most significant improvement was observed in autumn, with the maximum over all seasons being 69.5% on DOY 275.
Table 1 presents seasonally averaged (over 7 days) RMSE, standard deviation, and RMSE improvement ratio of KRS to KG. All RMSE values were computed with respect to GIM. In autumn, the maximum improvement was observed at 57.1%, demonstrating the best performance among the four seasons. Both spring and summer showed improvements greater than 50%. In contrast, winter had the lowest improvement ratio of 42.2%. Its RMSE was 0.86, the second smallest among all seasons, while summer had the smallest RMSE. These results show that KRS maintained high accuracy regardless of the season, demonstrating resilience to seasonal variations.
So far, we have developed a KRS model based on STEC for one site and verified its performance by season. Although it is located at the center of South Korea, this site cannot be evaluated as fit to represent the entire country because it only considers the ionospheric characteristics of one specific location. We therefore added one site at each of the four corners of the country, as shown in
Figure 3, and estimated “Korea-wide” Klobuchar coefficients.
To evaluate the accuracy of these 5-site KRS coefficients, we selected the seven days of autumn (DOY 274–280) that showed the greatest improvement in the previous analysis.
Table 2 lists the latitude of each site and compares seven-day averaged RMSE values using KG, KRS with one site (“KRS-1S”) and five sites (“KRS-5S”).
The RMSE of KG ranged from 2.44 to 2.57 m, consistent with the autumn value of 2.47 m in
Table 1. The difference between the 1S and 5S configurations is consistent for the central SNJU site, increasing at the corners, but only to within 0.17 m. Both KRS models show increasing RMSE with decreasing latitude. Although the models are fitted to GIM, this latitude dependency likely arises from the challenges of modeling the ionosphere close to the equator. However, the increase is less pronounced when five stations are utilized.
4. VTEC-Based Estimation
Recently, numerous studies have been published regarding the generation of GIM in near real-time, or even GIM prediction [
3,
4]. Then the Klobuchar coefficients can be updated every hour or two. This would significantly increase the computational requirements for KRS with STEC data from multiple sites. Therefore, we estimated Klobuchar coefficients utilizing VTEC instead of STEC. Using GIM VTEC directly reduces the computational load substantially. For a regional model, further reductions can be achieved using only GIM data from grid points near the target area.
Here, as noted in
Section 2.4, the grid point and IPP positions coincide. We assumed virtual stations at all 120 grid points, each with one visible satellite at elevation 90° and azimuth 0°. No further computation steps were necessary, so estimation time is significantly reduced. The estimation method of
Section 3 was used, with STEC replaced by VTEC, for this KRV model.
The KRV model’s RMS differences from GIM were compared to those from KG and KRS at each of the five Korean sites. The dates selected for the analysis were 1 January, (DOY 001), 1 April (DOY 091), 1 July (DOY 182), and 1 October (DOY 274) 2022. The bar graphs in
Figure 6 show RMSE values obtained from the three models in comparison to GIM-based STEC for all visible satellites at each site on each date. Averaged over the five sites, KRV showed improvements compared to KG of 60.7%, 53.6%, 55.6%, and 64.4%, respectively, on the four days. These improvement rates are comparable to those from KRS without exceeding 5% of the difference. Additionally, the maximum RMSE difference between KRS and KRV is 0.1 m. Therefore, the accuracy levels of KRS and KRV can be considered comparable.
Figure 6 shows that both KRS and KRV models were more accurate than KG on all test dates. KRS represents the ionospheric characteristics of specific stations, while KRV represents the entire region. Both models produced similar RMSE values, and increasing trends with decreasing latitude, but KRV is considered a more useful regional model.
The above comparison over four days, one from each season, indicated that KRS and KRV were equivalent in all seasons. To test further, KRV was then used for the entire year of 2022 in two steps: (1) VTEC was computed at 2 h intervals at each of the 120 grid points of
Figure 1 using KG and KRV; (2) the resulting VTECs were each compared to the GIM VTEC by calculating the RMSE values. At each grid point, 13 values were obtained daily (including midnight at both start and end of each day). With 120 grid points, daily RMS were computed for 1560 differences (120 × 13 = 1560).
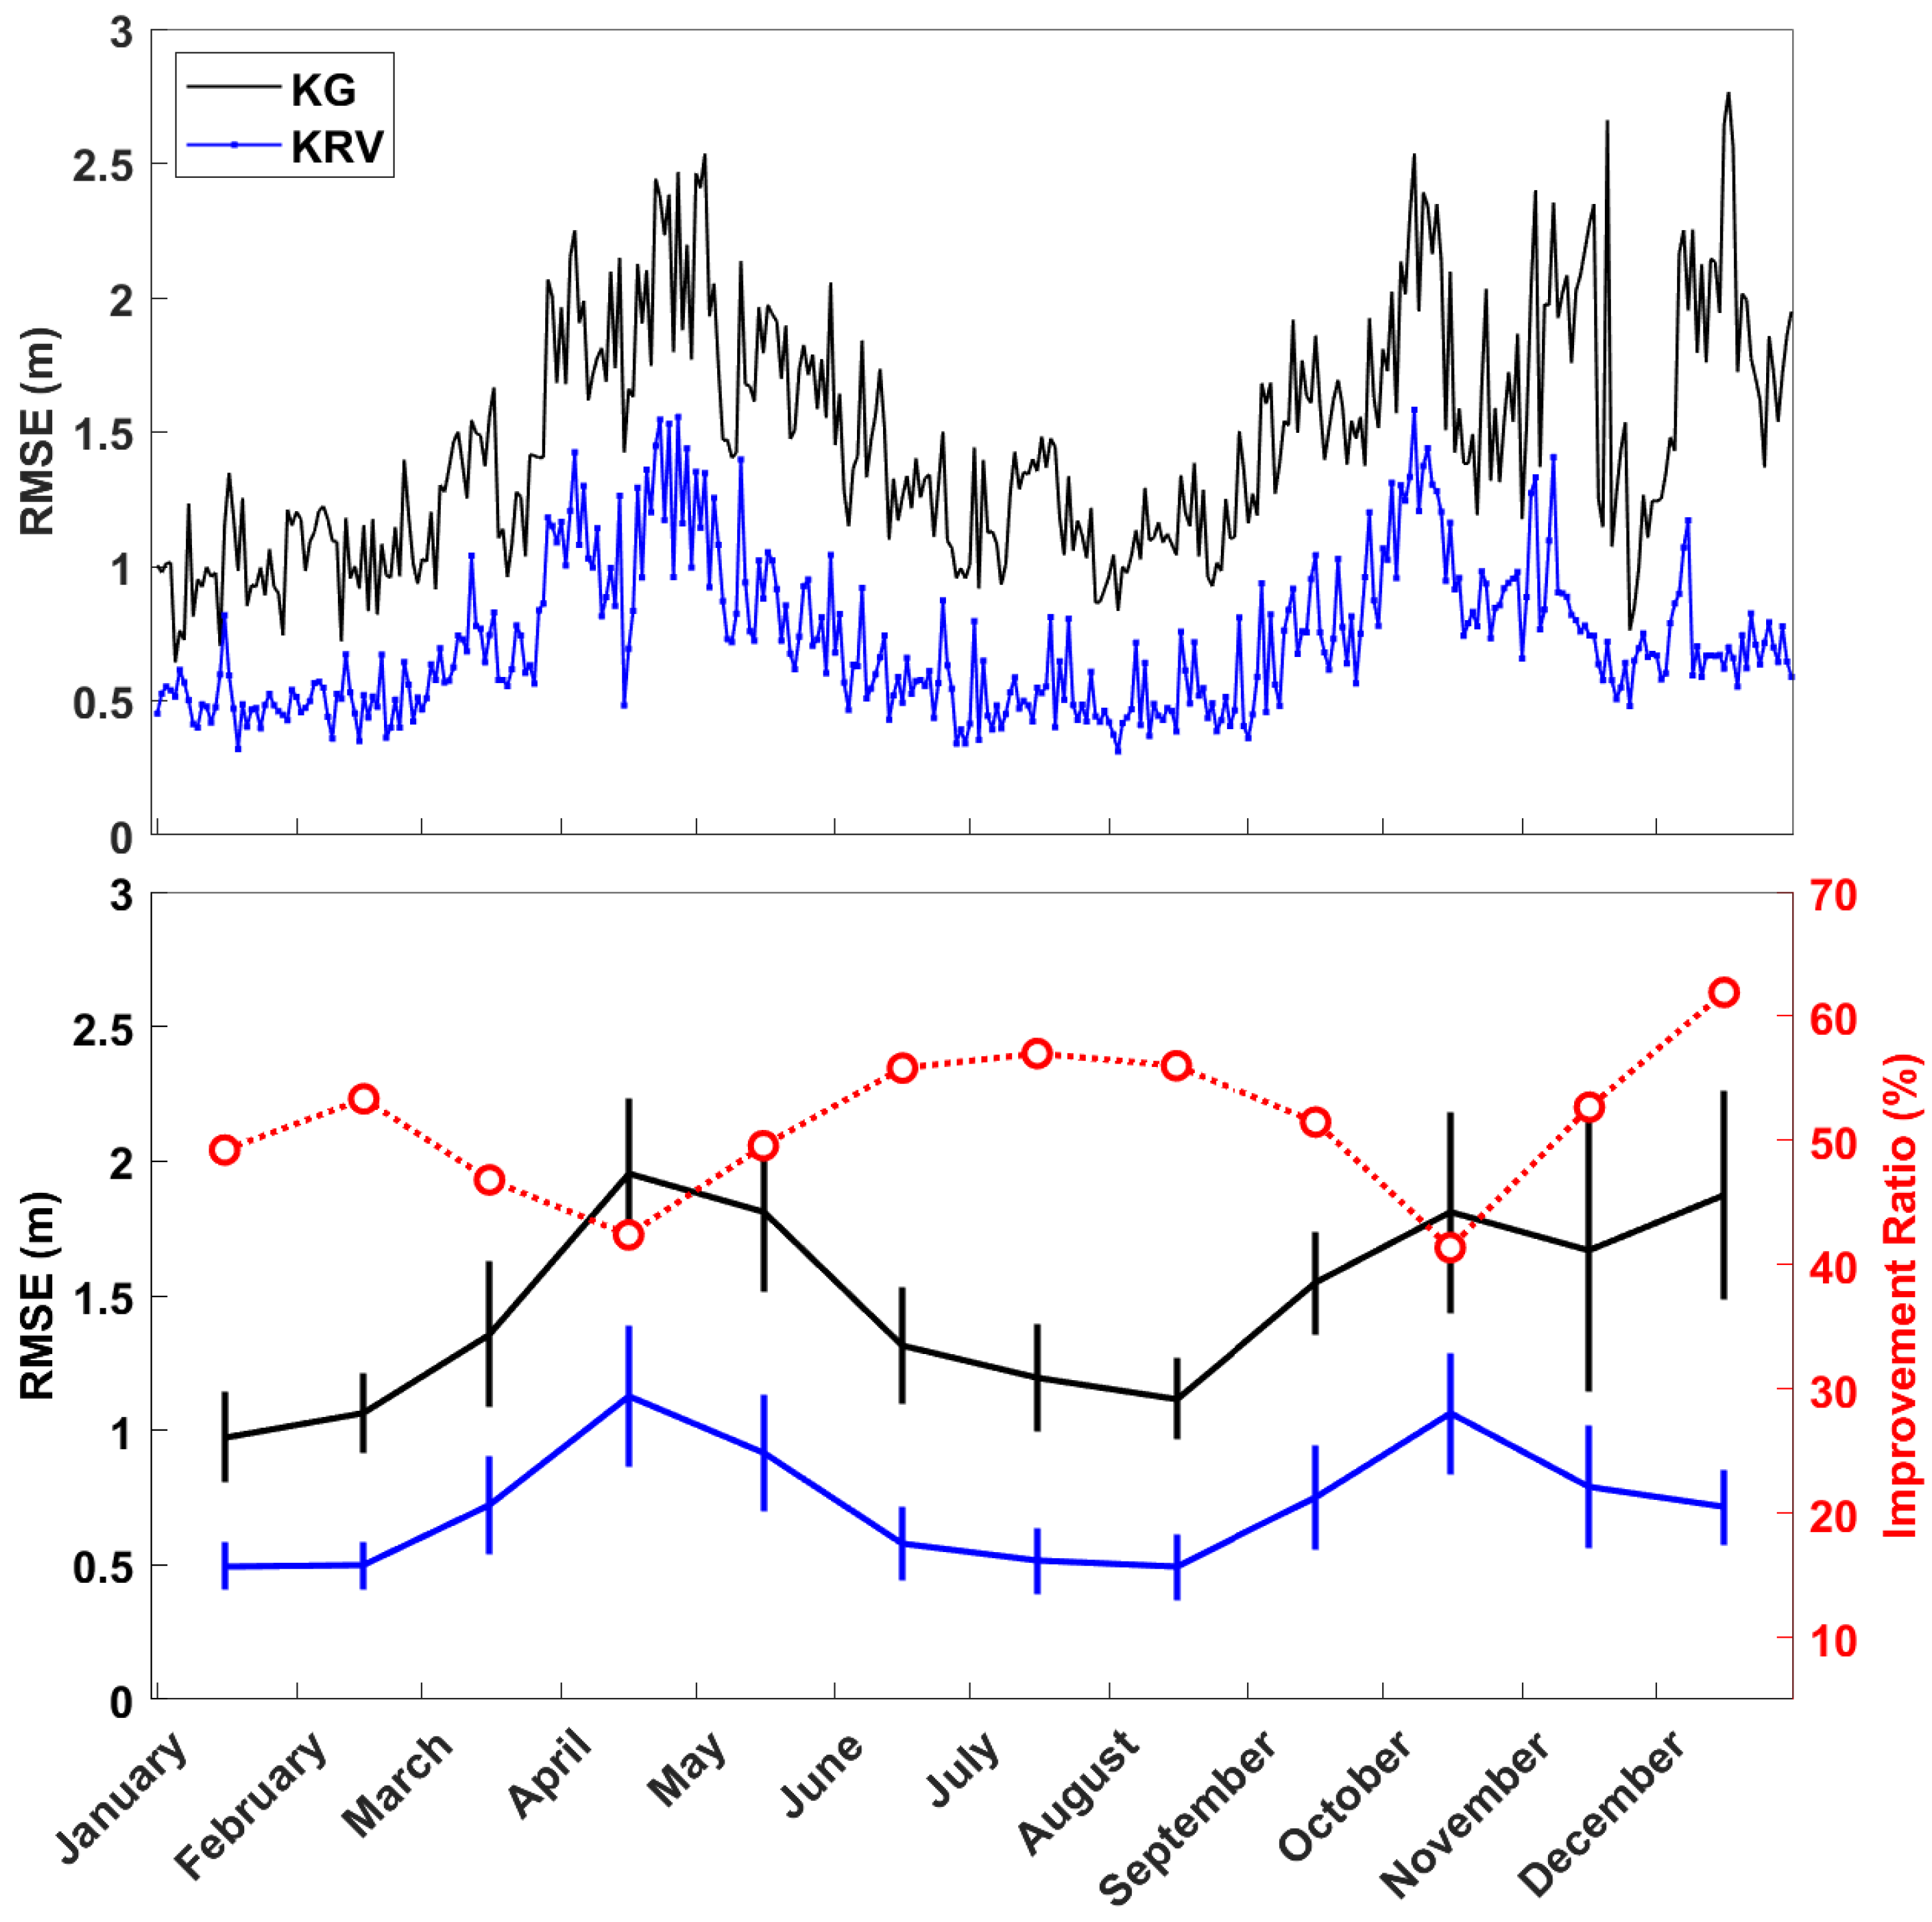
Figure 7 (upper panel) displays the resulting daily RMSE values for KG and KRV over the full year. On every single day KRV had a lower RMSE than KG. The annual average RMSE was 0.7 m for KRV compared to 1.5 m for KG, a reduction of ~50%.
Figure 7 (lower panel) displays the monthly averages, with standard deviations, of the daily RMSE values (left
y-axis). KRV (blue) consistently had lower average RMSE than KG (black) for all months. KRV also had lower standard deviation (length of error bar) for all months except September. We conclude that KRV demonstrates both superior performance and greater stability. The difference in average RMSE between the two models varied from a minimum of 0.48 m in January to a maximum of 1.26 m in December.
Both the KG and KRV models exhibited similar semi-annual variations, with their highest average RMSE values in April and October. This is related to ionospheric characteristics during these post-equinox months of increased solar activity [
22]. From April to June, corresponding to spring, and from September to November, corresponding to autumn, both the RMSE value and standard deviation increase. This suggests that KRV standard deviation increased with decreased estimation accuracy due to heightened solar activity.
The KG mean and standard deviation showed sudden, uncharacteristic increases in December. We investigated the hypothesis that the KG model’s accuracy declined due to the approaching solar maximum by examining monthly Kp and F10.7 indices for 2022. We found that the Kp index values in December were at similar levels to those in the three autumn months, although the F10.7 index was higher. Therefore, the sudden increases in the KG model’s mean and standard deviation in December are unlikely to be solely attributable to geomagnetic activity and may instead be more closely related to the elevated solar radio flux observed during that period.
The accuracy improvement ratio of the KRV model over KG, that is the difference between their RMSE values divided by the KG value, is shown as the red dotted line in
Figure 7 (lower panel) with the right
y-axis. The improvement ratio is clearly inversely correlated with the RMSE; as solar activity increases, the estimates’ accuracy decreases, resulting in a lower improvement ratio. The ratio increases even in December, when the KG model performs badly. This supports the validity and robustness of our methodology.
5. Discussion
In this study, regional Klobuchar coefficients were estimated using the IGS GIM, and the same GIM was subsequently employed for accuracy assessment. It should be noted, however, that the GIM does not represent direct and ground-truth observations of ionospheric TEC. While the accuracy of the IGS GIM has generally been reported to lie within 2–8 TECU, solely relying on this dataset for validation of the Klobuchar-type models developed in this study is insufficient, thereby necessitating independent validation methods. Ionospheric TEC values can be obtained from radar altimetry observations or from dual-frequency GNSS measurements. Radar altimetry satellites such as Jason-2 and Jason-3 can provide TEC estimates along the signal path from the satellite to the sea surface. However, their approximately ten-day revisit time limits their temporal resolution, reducing their effectiveness for direct comparison with GIM that are updated daily [
23,
24]. Dual-frequency GNSS ground station data also allow for TEC estimation; however, this process requires extensive preprocessing, including outlier detection, receiver clock jump correction, and cycle slip detection. Furthermore, phase-levelled pseudorange observations, which are commonly employed, are often contaminated by excessive noise and thus unsuitable for robust validation [
25]. An alternative validation approach is to employ ionosonde measurements as reference values, but such data were unavailable for the study region, Korea. Consequently, rather than employing radar altimetry, dual-frequency GNSS, or ionosonde data, the developed model was validated indirectly through its application to a satellite positioning algorithm. Specifically, Standard Point Positioning (SPP) was performed using observations from the SNJU station (
Figure 4), and the resulting positioning errors were analyzed.
The SPP procedure used for accuracy verification was implemented as follows. GPS code pseudorange measurements were obtained from Receiver Independent Exchange (RINEX) files recorded at the SNJU station. Positioning was performed continuously over 24 h at 30 s intervals. Tropospheric errors were corrected by estimating the zenith delay using the empirical Global Pressure and Temperature (GPT) model, subsequently mapped to the line-of-sight delay via the Global Mapping Function (GMF) [
26]. Ionospheric error corrections were applied separately using the KG, KRS, KRV, and GIM models to facilitate performance comparison. Satellites with elevation angles below 15° were excluded from the calculations, and those with elevation angles between 15° and 30° were down-weighted. A weighted least-squares method was employed to compute positioning solutions and analyze directional errors.
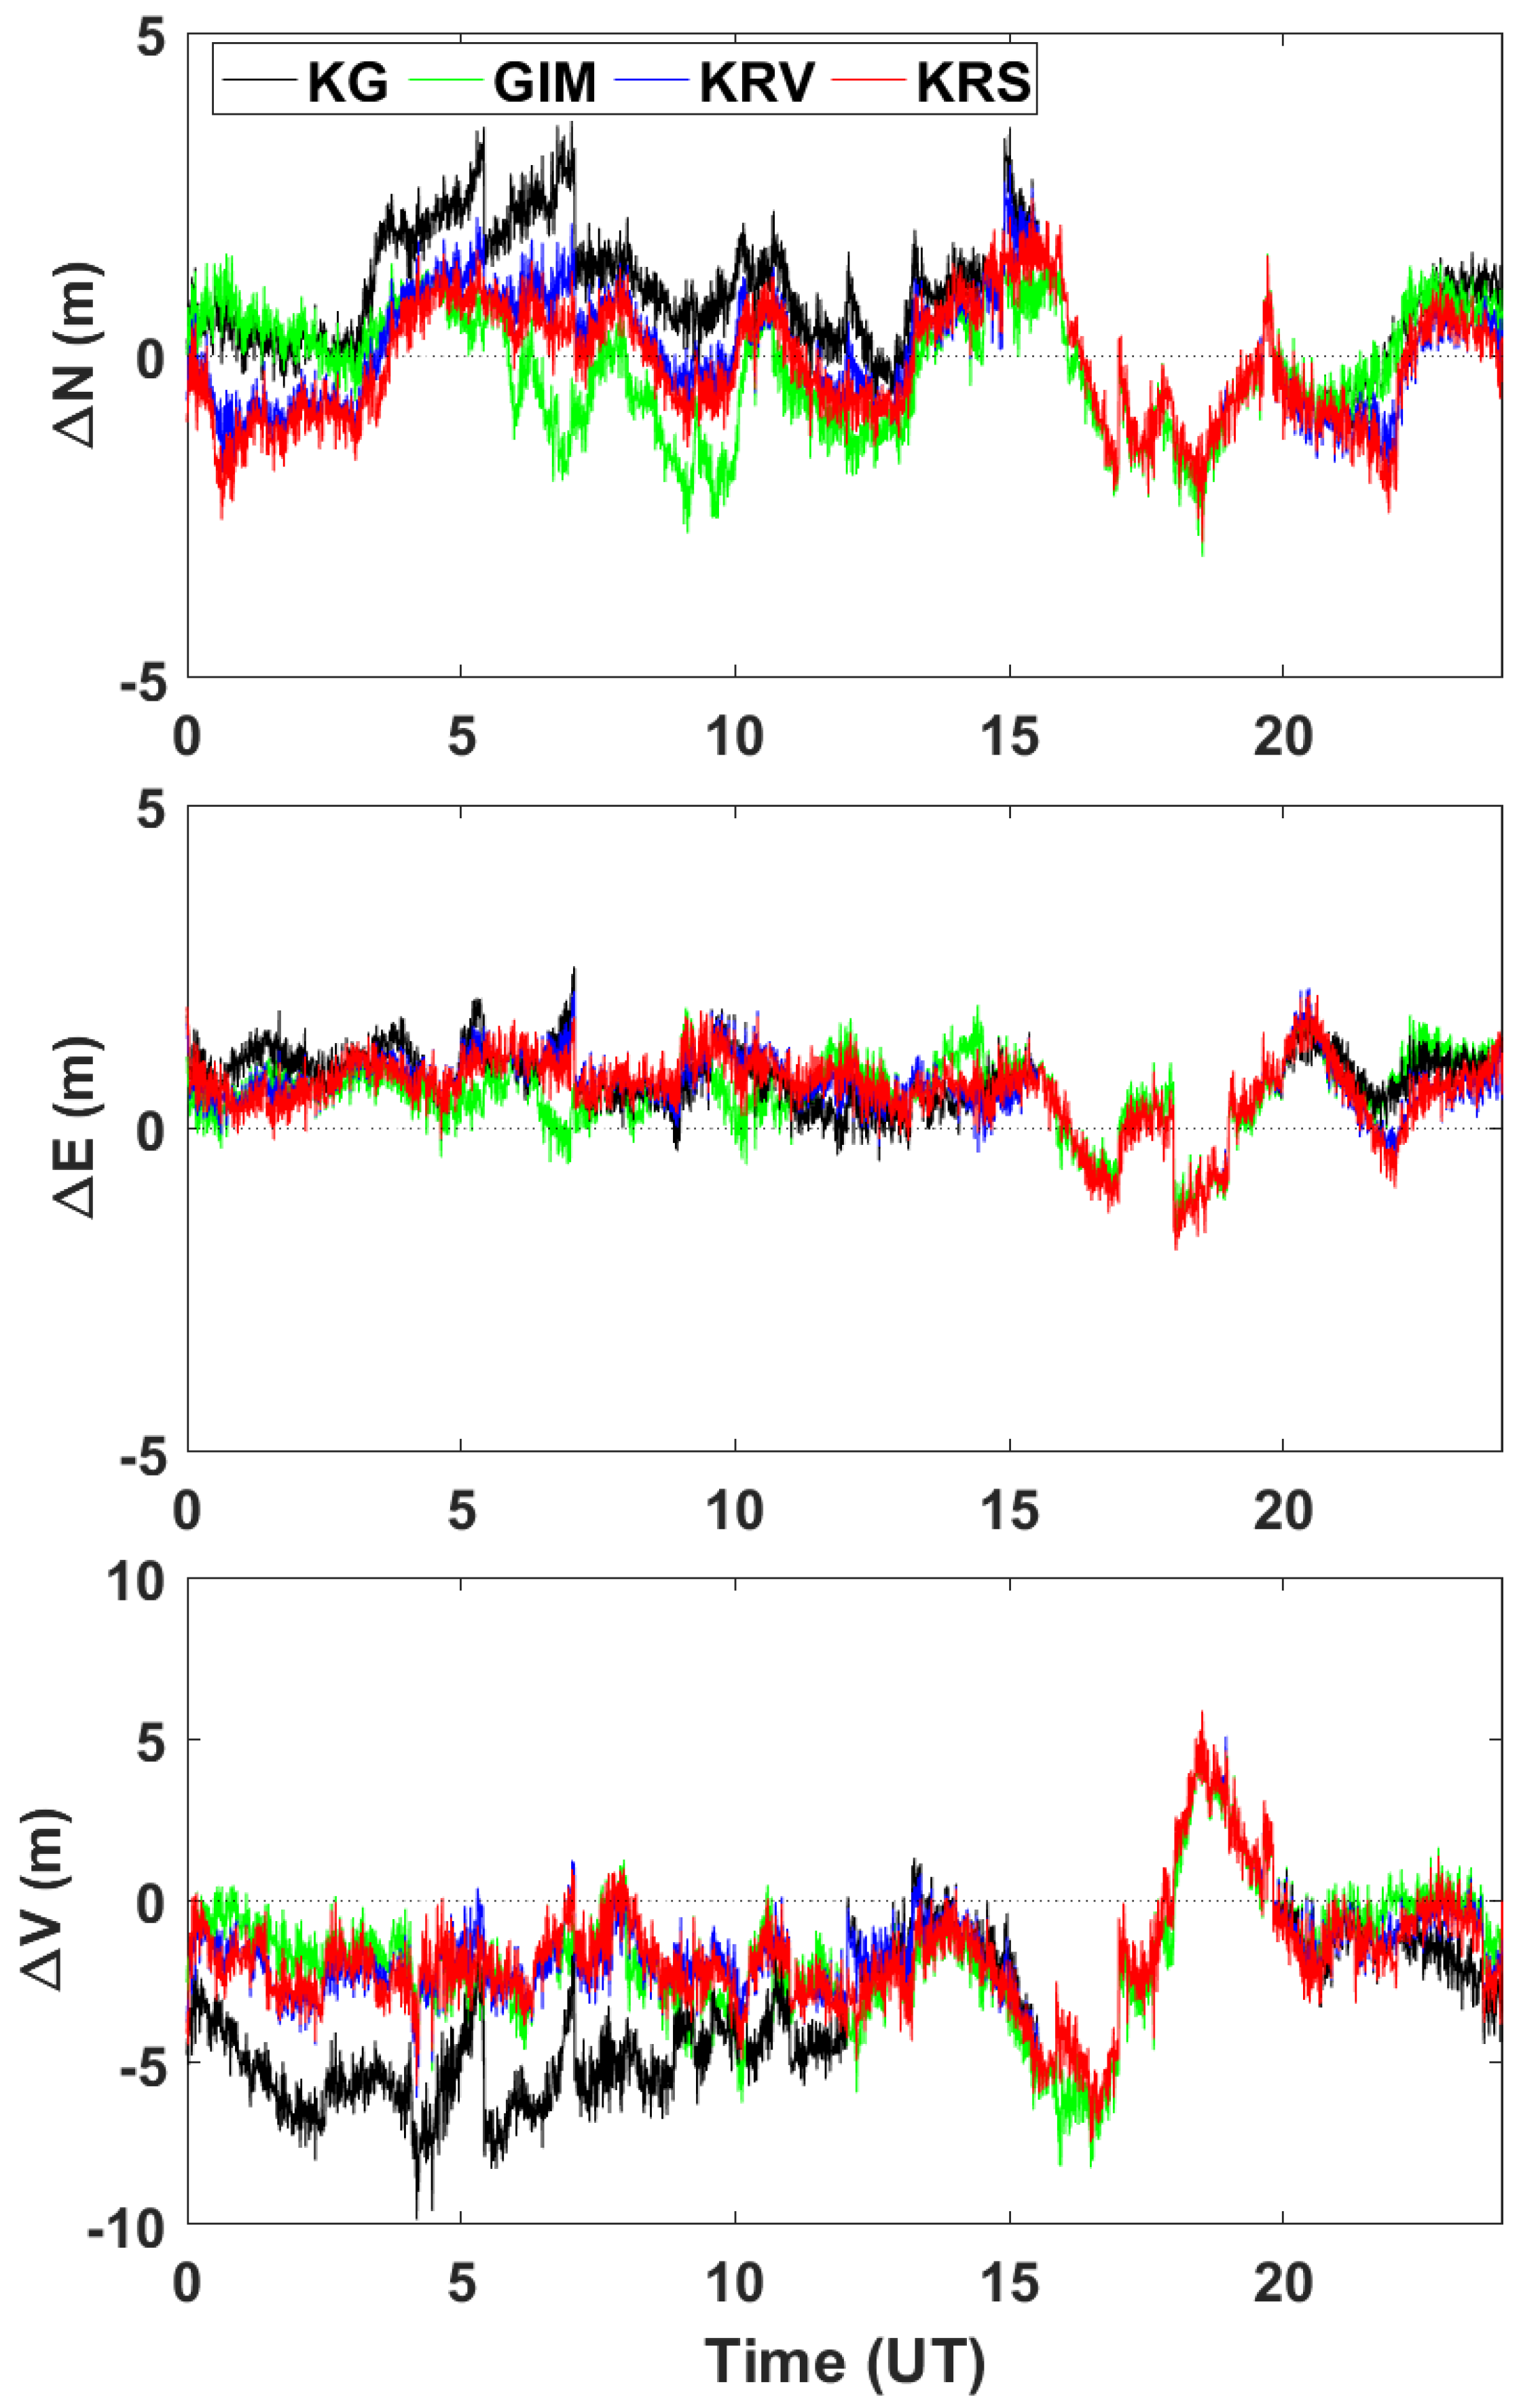
Figure 8 presents the time series of positioning errors for DOY 274, which corresponds to the same date shown in
Figure 4. The KG model exhibited larger errors than the other models during the daytime, a trend particularly pronounced in the north and vertical components. This indicates that, similar to the results in
Figure 4, the KG model experienced degraded positioning accuracy due to the reduced reliability of STEC computations during daytime hours. Although it is well known that the ionosphere has a substantial impact on the vertical component of position estimates, the other models, except KG, mitigated vertical errors more effectively. Notably, the positioning errors obtained from the KRV and KRS models followed similar patterns overall, and both achieved a level of performance comparable to that of GIM by maintaining accuracy close to that of the reference.
Table 3 provides a summary of the RMSE values for each component represented in the time series shown in
Figure 8. In the horizontal direction, the KG model exhibited the poorest accuracy, whereas the KRS, KRV, and GIM models showed comparable performance, with differences of less than 1 cm. In line with previous observation, the KG model exhibited the poorest performance in the vertical component, while the KRS and KRV models achieved higher accuracy than GIM. Notably, the KRV model produced the smallest vertical error, leading to the best overall 3D accuracy. These findings highlight an improvement in ionospheric correction performance compared with the conventional KG model. To determine whether this behavior was specific to DOY 274 or consistent across different periods, the analysis was extended to seven representative days in each season.
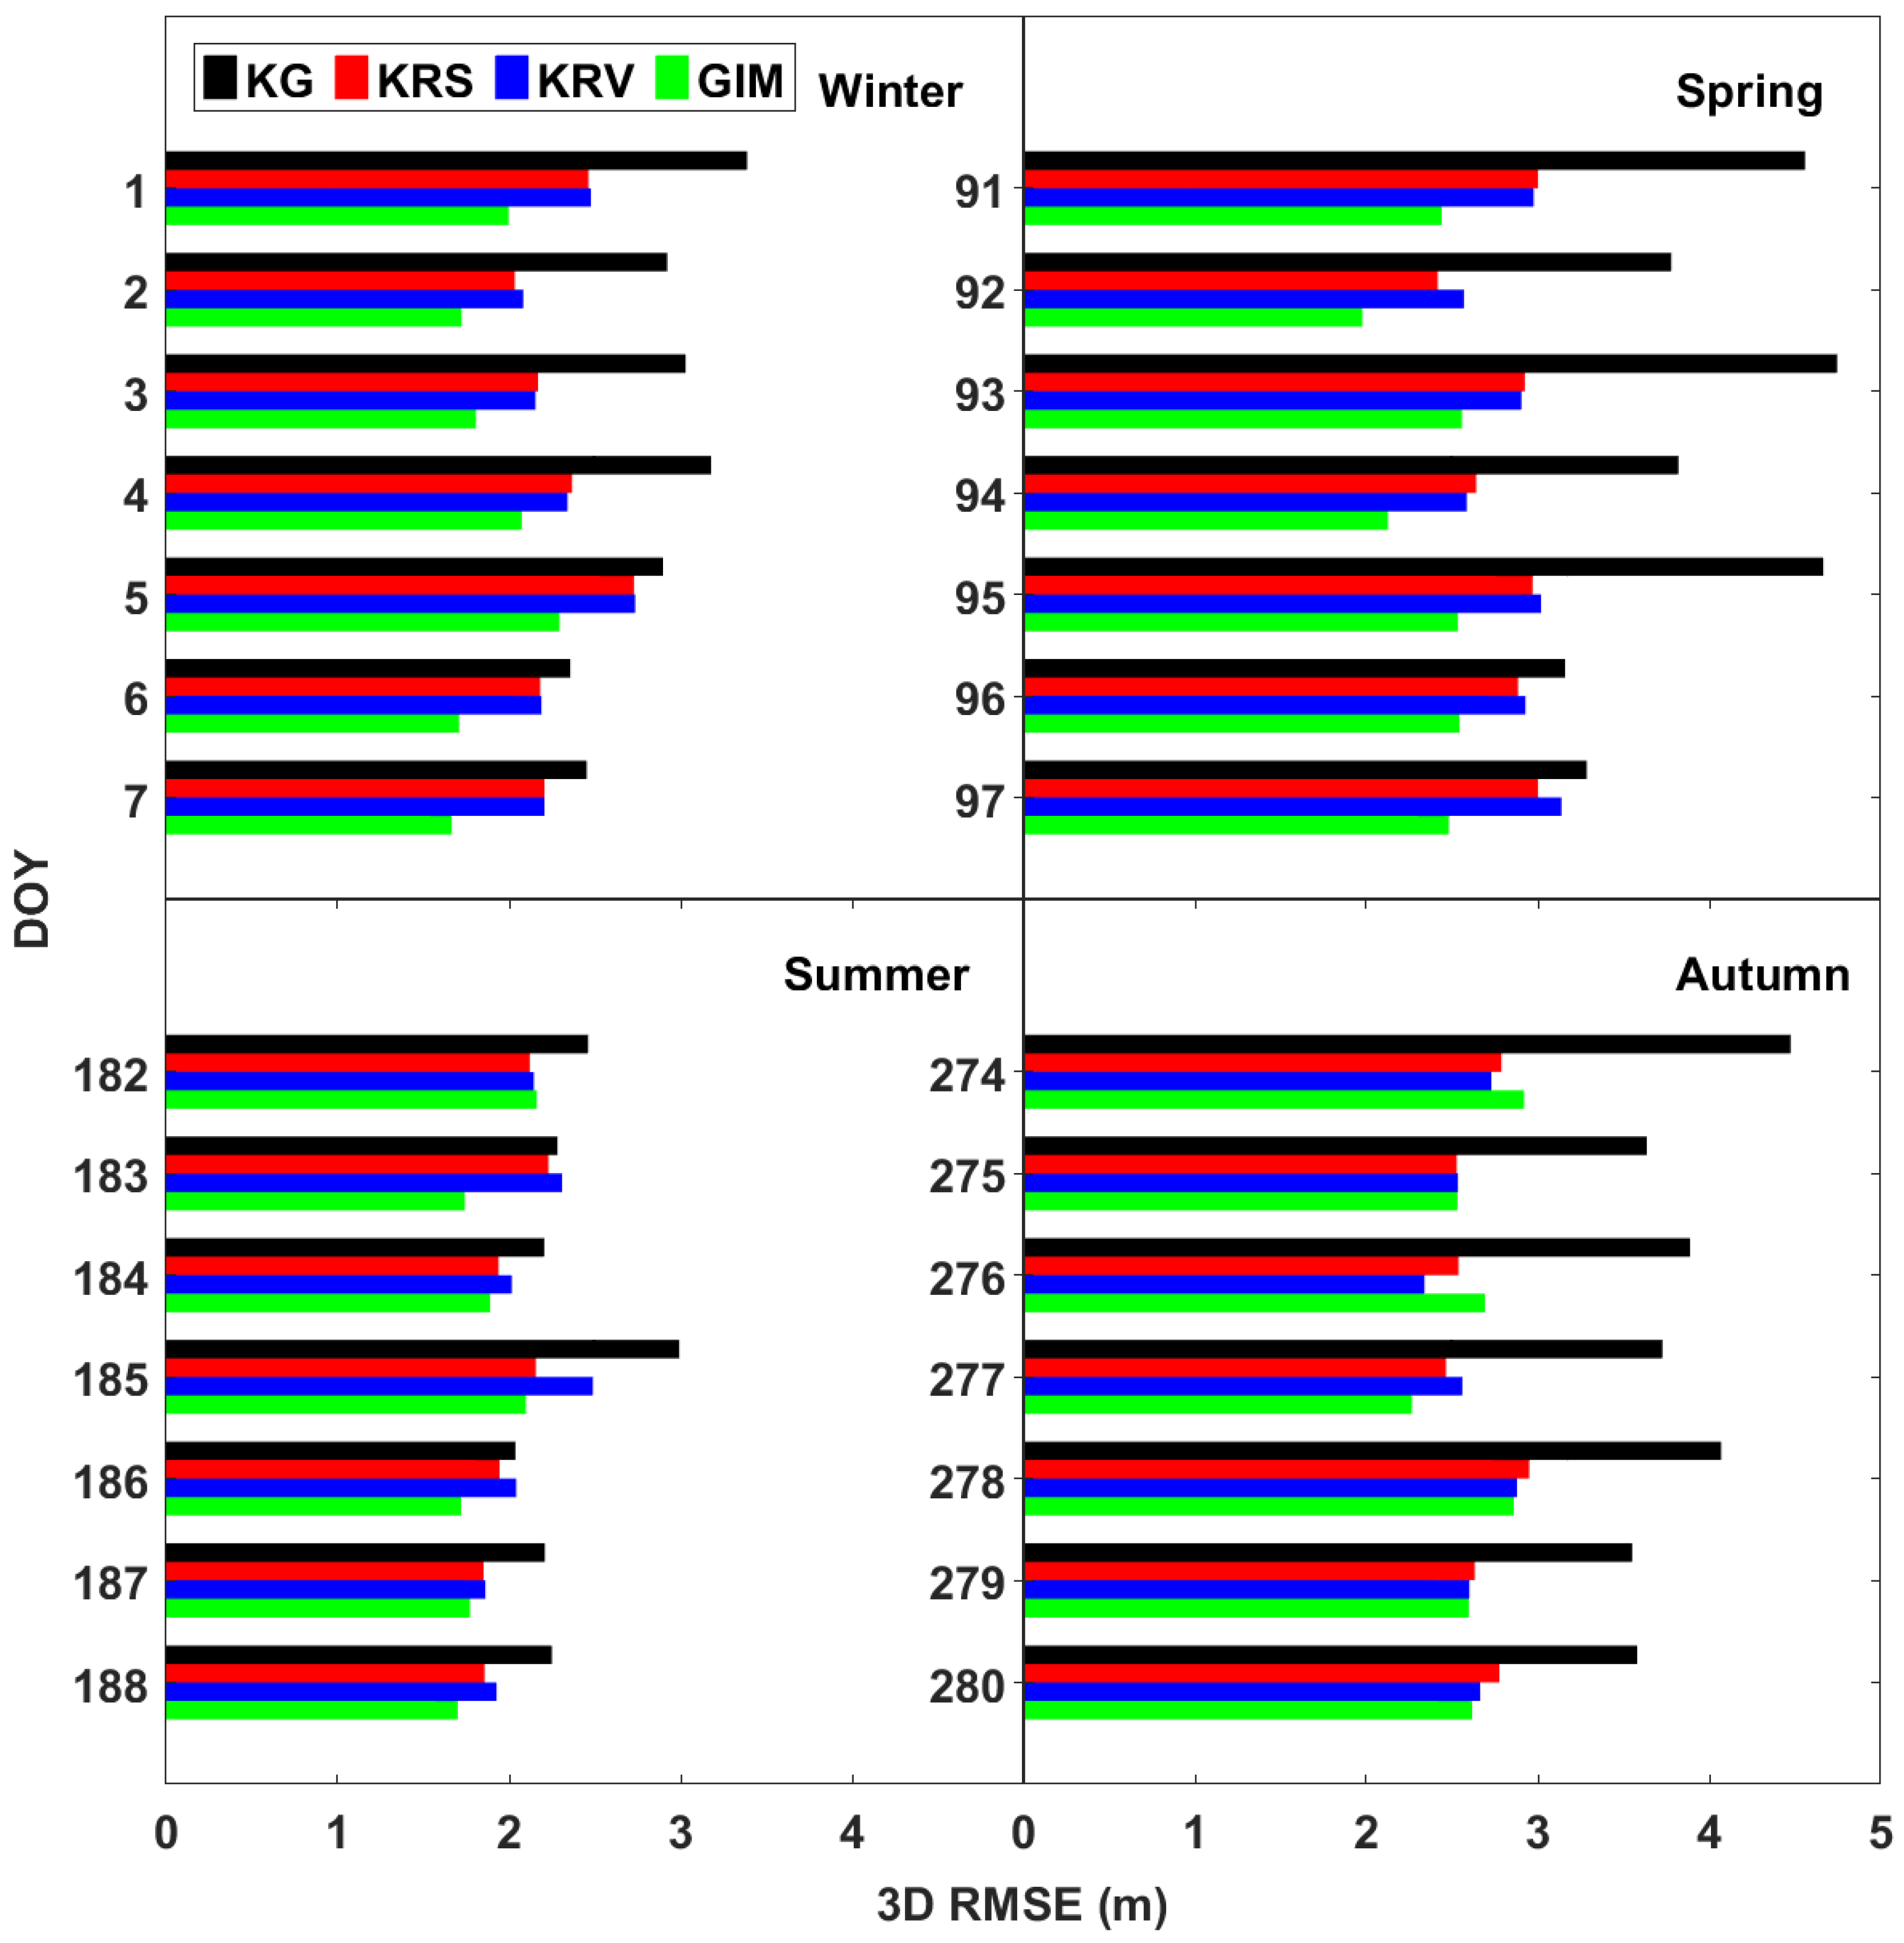
Seasonal characteristics were analyzed using seven-day consecutive datasets for each season, corresponding to the periods shown in
Figure 5: DOY 001–007, 091–097, 182–188, and 274–280 in 2022.
Figure 9 presents the daily 3D RMSE values for each model. The results indicate that the KG model occasionally achieved accuracy comparable to KRV during summer, but its overall accuracy was consistently lower. The 28-day average 3D RMSE was highest for KG at 3.27 m, whereas KRS and KRV recorded similar values of 2.46 m and 2.48 m, respectively, representing an improvement of approximately 0.8 m relative to KG. The standard deviations of the 28-day 3D RMSE were 0.81 m for KG, 0.39 m for GIM, 0.37 m for KRS, and 0.36 m for KRV, indicating that KRV provided the most stable performance.
To investigate seasonal characteristics, we calculated the seasonal RMSE and the performance improvement of KRS and KRV relative to KG (
Table 4). The results indicate that KRS and KRV exhibited comparable performance across all seasons, with RMSE values similar to those of GIM. Both models achieved improvements over KG ranging from 17.3% to 44.6%. The improvements were slightly smaller in winter and summer, likely due to the relatively lower errors of the KG model during those seasons. KRS and KRV consistently maintained stable performance across all seasons and demonstrated reliable improvements, notably in spring and fall when ionospheric activity was higher. These findings confirm the effectiveness of the proposed method, as it consistently outperformed KG while maintaining stable accuracy despite seasonal ionospheric variations.
6. Conclusions
This study introduced a regionally optimized method for generating Klobuchar coefficients directly from IGS-provided GIM data, enhancing ionospheric corrections for GNSS positioning over the Korean Peninsula and its surrounding areas. By estimating coefficients through least-squares fitting of both STEC and VTEC derived from GIM, two regional models were proposed: KRS and KRV, respectively. The KRS model demonstrated significant improvement over the standard Klobuchar (KG) model, reducing the RMS error by over 50% on average across different seasons. The KRV model, designed for computational efficiency, achieved comparable accuracy to KRS while substantially reducing computational load.
Although direct validation against ground-truth TEC measurements was limited, the models were indirectly validated via satellite positioning results, confirming their practical applicability and robustness for regional ionospheric correction. Through comprehensive annual and seasonal analyses, both KRS and KRV consistently outperformed the global KG model in ionospheric delay estimation throughout the Korean region. While the KRS model demands higher computational resources due to orbit and IPP calculations, the KRV model attains nearly equivalent accuracy by utilizing only VTEC values at predefined grid points.
In addition, while this study utilized post-processed GIM data, the method is anticipated to facilitate real-time estimation using predicted GIMs with a latency of 1 to 2 days. Expanding the grid coverage beyond the Korean Peninsula could enable broader regional applications. Overall, the results indicate that implementing GIM-based regional Klobuchar modeling provides an effective pathway to enhance GNSS positioning performance in localized and regional service contexts.
