1. Introduction
Extreme climate events and storms are considered global high-risk hotspots and pose a significant threat to coastal communities [
1,
2,
3]. Accurate monitoring of these events is crucial for assessing flood resilience in a changing climate [
4,
5], especially in nearshore and coastal environments characterized by complex geometries and physical processes [
2,
3]. Traditionally, such monitoring relies on in situ measurements collected by different networks, such as wave buoys, which are considered the most reliable tools for observing the distribution of energy and wave characteristics from the open ocean to shallow water areas and coasts [
6]. However, observational data are relatively sparse, and their spatial distribution is extremely limited in areas where the deployment of in situ sensors is not feasible. Due to this limited spatial coverage (i.e., localized measurements), coastal waves remain poorly documented and are currently lacking at local scales [
7]. The use of numerical models has increasingly been adopted as an alternative to overcome the shortcomings of in situ monitoring of extreme hydrodynamics, providing a scientific basis for issuing flood warnings. However, numerical modeling requires extremely high computational resources and a large amount of real-time spatio-temporal observations to improve predictive capacity and reduce numerical uncertainties.
The growth of satellite observations in recent decades, including altimetry datasets, has greatly improved the temporal and spatial coverage of nearshore and coastal areas by providing a range of physical measurements. These measurements can be used for timely and accurate monitoring of hydrodynamics in both global and local studies across different time scales, from short- to long-term [
7]. Although significant efforts have been made to demonstrate their potential for assessing coastal changes [
8], these applications are still in an early stage [
5]. Research continues to focus on evaluating the accuracy of different satellite missions, including recent advances in radar altimetry technology, which allow for improvements in spatial and range resolution while reducing noise in conventional nadir altimetry [
9,
10]. Their use depends on the system of interest (open coasts, deltas, wetlands, estuaries, etc.) and is particularly important in complex environments, such as semi-enclosed basins or channels, for monitoring changes in wave characteristics [
11] as well as for validating and calibrating numerical models [
5]. Because individual satellite altimeters are limited in their spatial and temporal coverage, combining multiple datasets can help fill these gaps and are especially useful for monitoring wave changes during short-term events, such as storms, at local and regional scales. This multi-source altimetry approach has proven effective in providing observational data along China’s coastal areas [
5,
11] and in improving the predictive ability of numerical models. However, the accuracy of this integrated approach for monitoring the spatiotemporal evolution of hydrodynamics during storms and other high-energy periods has not yet been thoroughly investigated in different coastal environments influenced by multiple physical drivers and bathymetric changes [
5,
12].
This context introduces the main objective of the present work: to investigate the use of multi-source altimetry observations—combining SWOT nadir with nine conventional altimeters—for monitoring storm waves during the winter periods of 2022–2023 and 2023–2024, and for analyzing their evolution within a semi-open basin, namely the English Channel (NW France), where modulated hydrodynamic energy may intensify under extreme conditions, leading to increasingly frequent coastal flooding. Accurate SWH measurements gain more insights and become substantially more accessible when using data from Sar and InSar sensors [
13,
14,
15], as in the case of SWOT-SAR-interferometry wide-swath altimetry mission [
16]. This work is carried out in the framework of SWOT mission, launched in December 2022 for at least three years, which provides measurements from a single satellite pass [
17] and global measurements of sea surface height (SSH) that can be used to map long swell parameters [
18] and SWH [
19,
20].
This research is structured into five sections.
Section 2 presents the available data in the English Channel and the methods used.
Section 3 evaluates the accuracy of multi-source altimetry observations, against in situ measurements and numerical models, for monitoring storm evolution and assessing short-scale changes in wave features.
Section 4 summarizes the key findings, discusses their limitations and considers their implications. Finally,
Section 5 presents the main conclusions and outlines future perspectives on integrating SWOT’s 2D view to improve wave estimates in nearshore and coastal basins.
3. Results
3.1. Monitoring of Waves During Storm Events
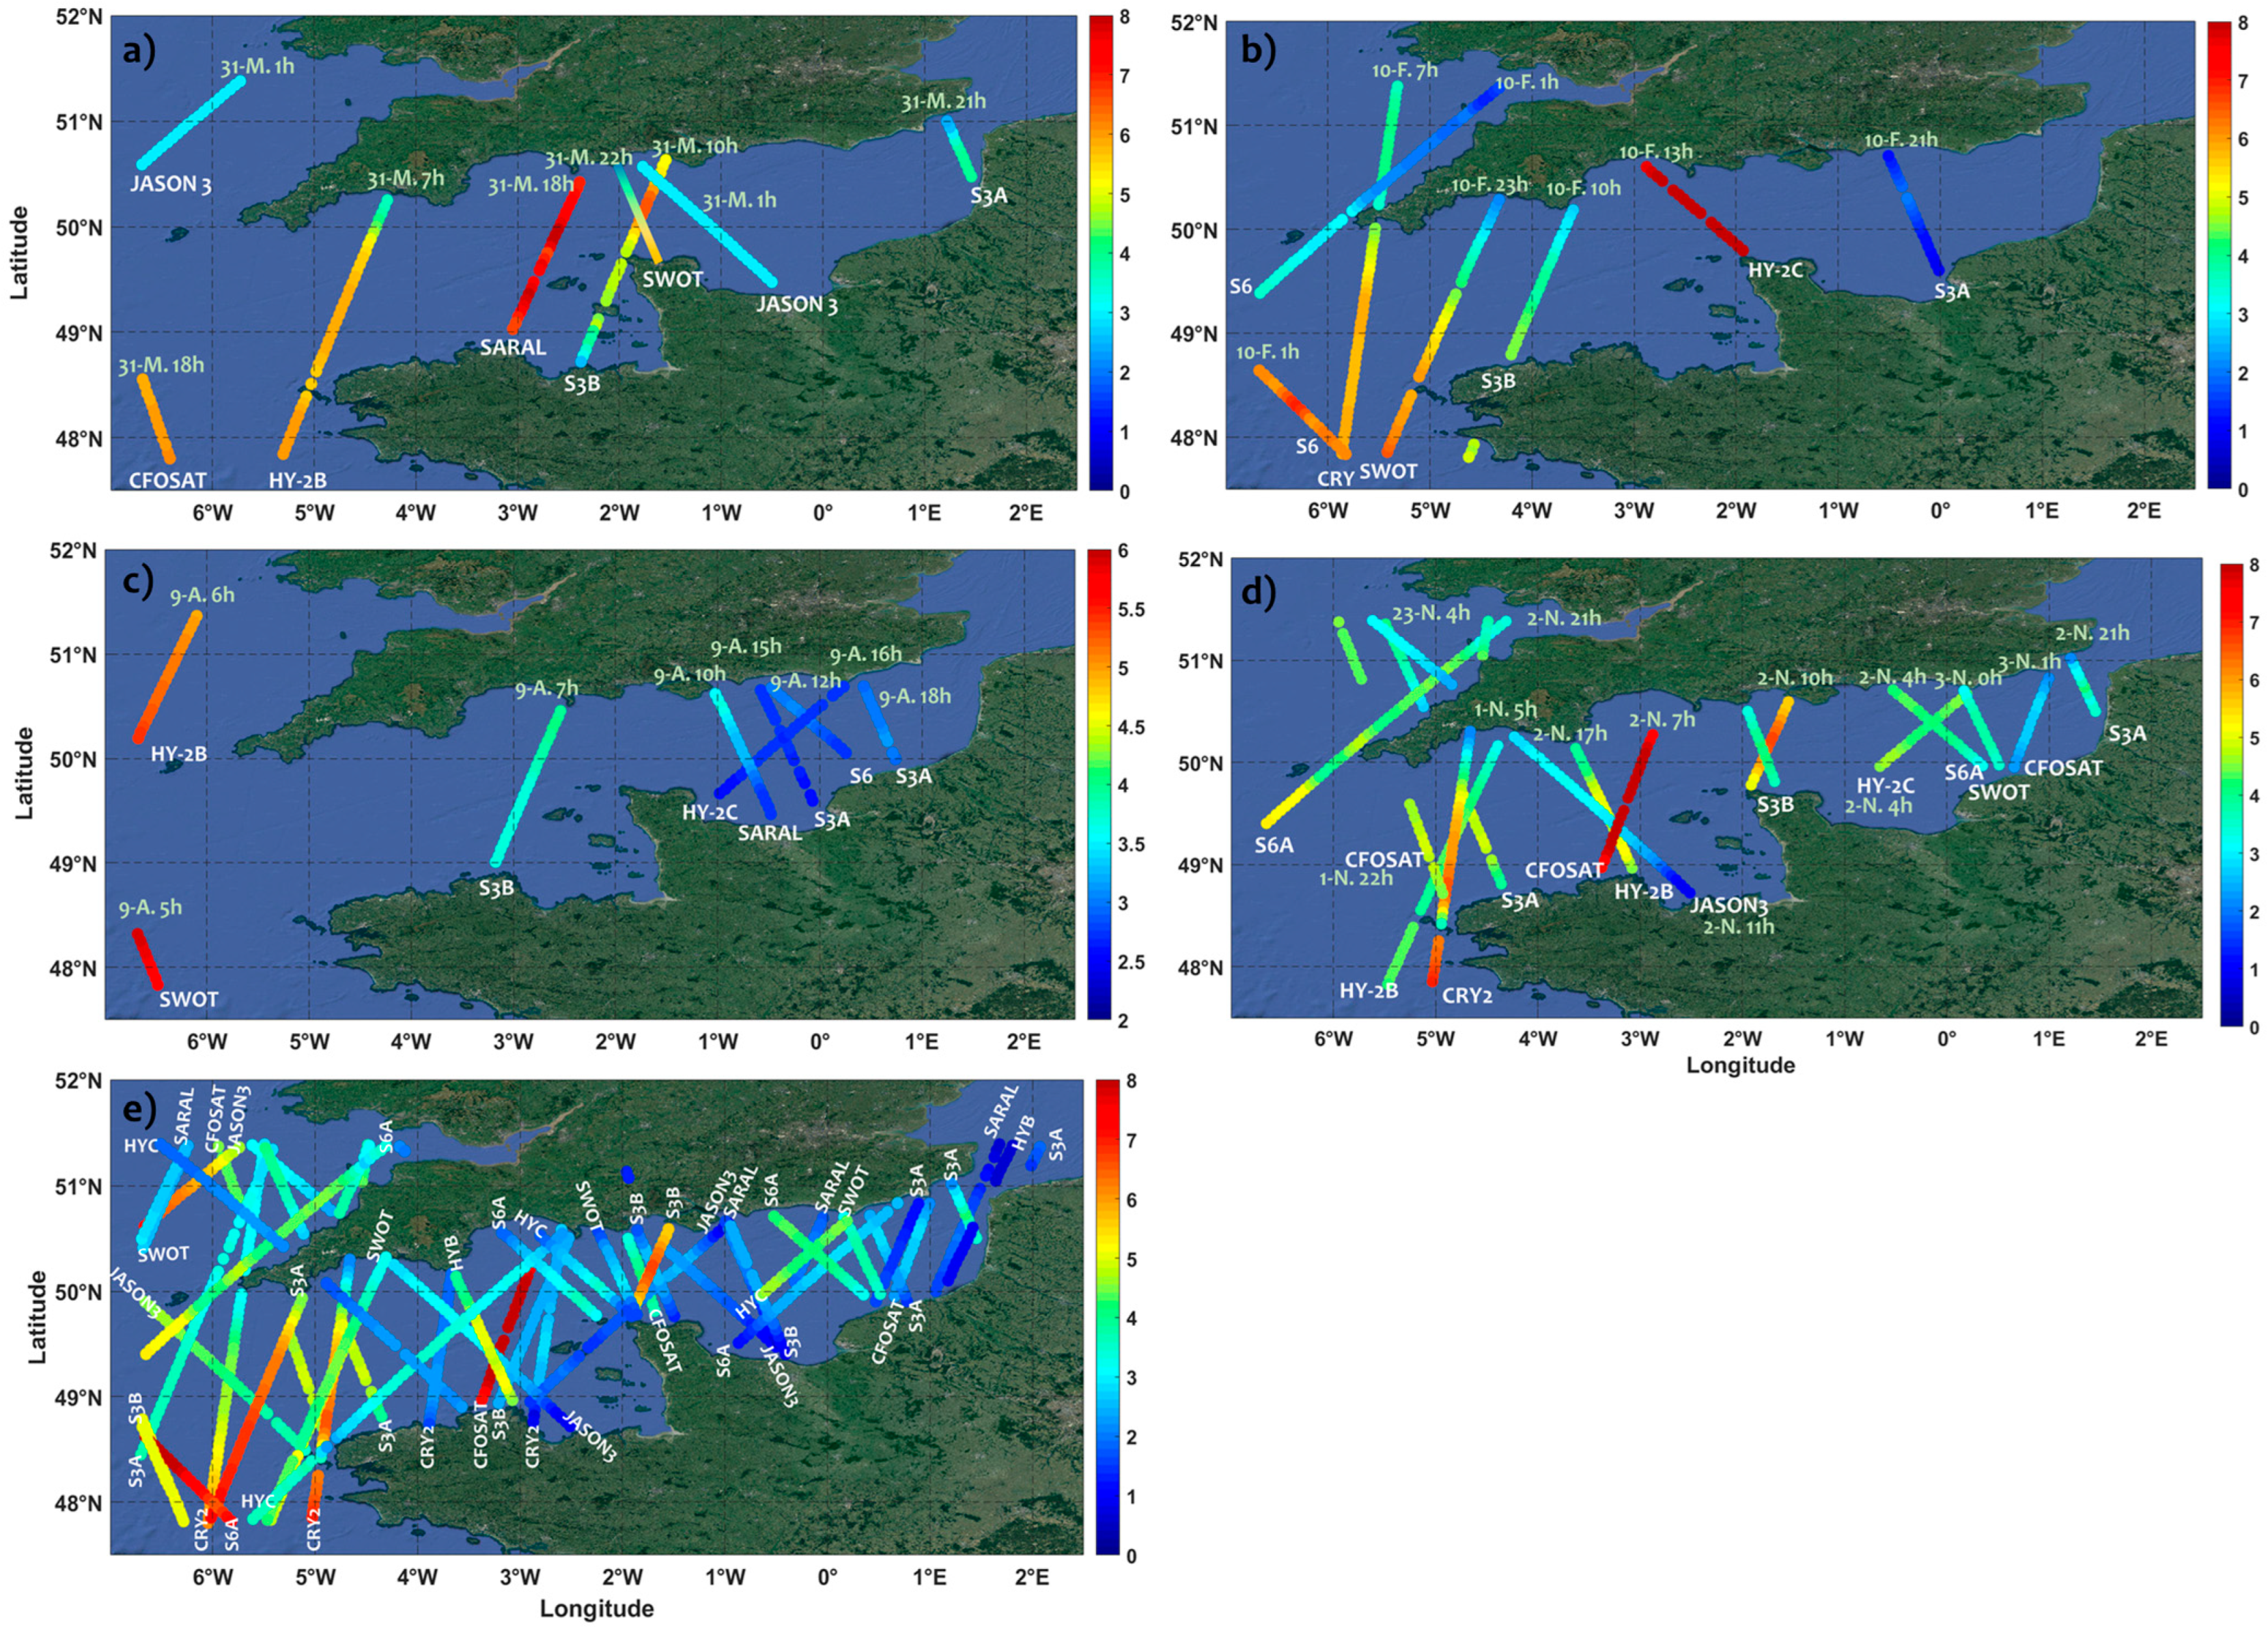
This section examines the evolution of nearshore and coastal waves during four storms in the winters of 2022–2023 (Mathis) and 2023–2024 (Ciaran, Karlotta, and Pierrick), using a multi-source dataset (ten missions including SWOT). Mathis (
Figure 3a) was captured by eight tracks, including Jason-3 (two tracks), CFOSAT, Saral, Sentinel-3A/B, HY-2B/C, and SWOT Cal/Val. Karlotta (
Figure 3b) was monitored by seven tracks, including CryoSat-2, Sentinel-6A (two tracks), Sentinel-3A/B, HY-2C, and SWOT Science Orbit. Pierrick (
Figure 3c) was observed by eight tracks, including Sentinel-3A/B, Sentinel-6A, HY-2B/C, and SWOT. Ciaran (
Figure 3d) was covered by eleven tracks from most altimeters, with more than two tracks for S3A, S6A, and HY-2B.
The spatio-temporal coverage, provided by reachable altimeters across the English Channel during each storm, is displayed in
Figure 3. Long storms, such as Ciaran (lasting over 24 h), were sampled more frequently, with each altimeter recording multiple measurements.
The track distribution within the Channel and near coastal zones offers coverage every 1–4 h, enabling mapping of peak wave heights and their dissipation near the coastline. In some cases, two altimeters were operated simultaneously at different locations, e.g., CFOSAT and Saral, or S3A and S6A during Mathis (31 March, 18:00) and Ciaran (2 November, 21:00).
The distribution of SWH along the Channel, as highlighted by
Figure 3a–d, exhibits significant changes in waves with depth and between both sides of the Channel (UK and French coasts). For example, S3B track records higher SWH near Weymouth (UK) than Roscoff (France) during both Storm Mathis (31 March, 10:00) and Storm Pierrick (9 April, 07:00), whereas waves are bigger near the French coast during Karlotta (10 February, 10:00).
The SWH distribution along the S6A track during Karlotta (10 February, 18:00) and Ciaran (2 November, 21:00) shows a decrease in wave energy from the Atlantic toward Cardiff (Wales). HY-2B, crossing the Channel from the Atlantic to Devonport (UK), displays significant variations in SWH along the track during the early stage of Ciaran (1 November, 05:00), with notable dissipation in shallow areas and near the shore; this variation appears more uniform at the start of Storm Mathis (31 March, 07:00).
Figure 3e illustrates the evolution of SWH over a five-day period (30 October–4 November 2023), encompassing the storm event of Ciaran and two days before and after the event. An enhanced coverage of the Channel is observed by combining 45 satellite tracks: 7 from S3A, 5 each from S3B and S6A, and 4 each from Jason-3, Saral, CFOSAT, and SWOT.
The integration of multi-source satellite observations provides comprehensive temporal and spatial coverage, extending from the North Atlantic to the Channel entrance and along its axis toward the North Sea.
Beyond capturing extreme wave events, the multi-source altimetry observations provide a spatio-temporal mapping of waves and reveal the distribution of energy increasingly modulated along the basin during the storm and dissipated in shallow water afterward.
A comparative analysis of SWH between the entrance and the center of the Channel during Storm Ciaran reveals ~20–25% of energy modulation. After Ciaran, waves from the centrum of the Channel (~75 m of depth) exhibit ~36% of dissipation at reduced depth (~35–20 m) close to the Seine Bay (
Figure 3e).
3.2. Time Evolution of Nearshore and Coastal Waves
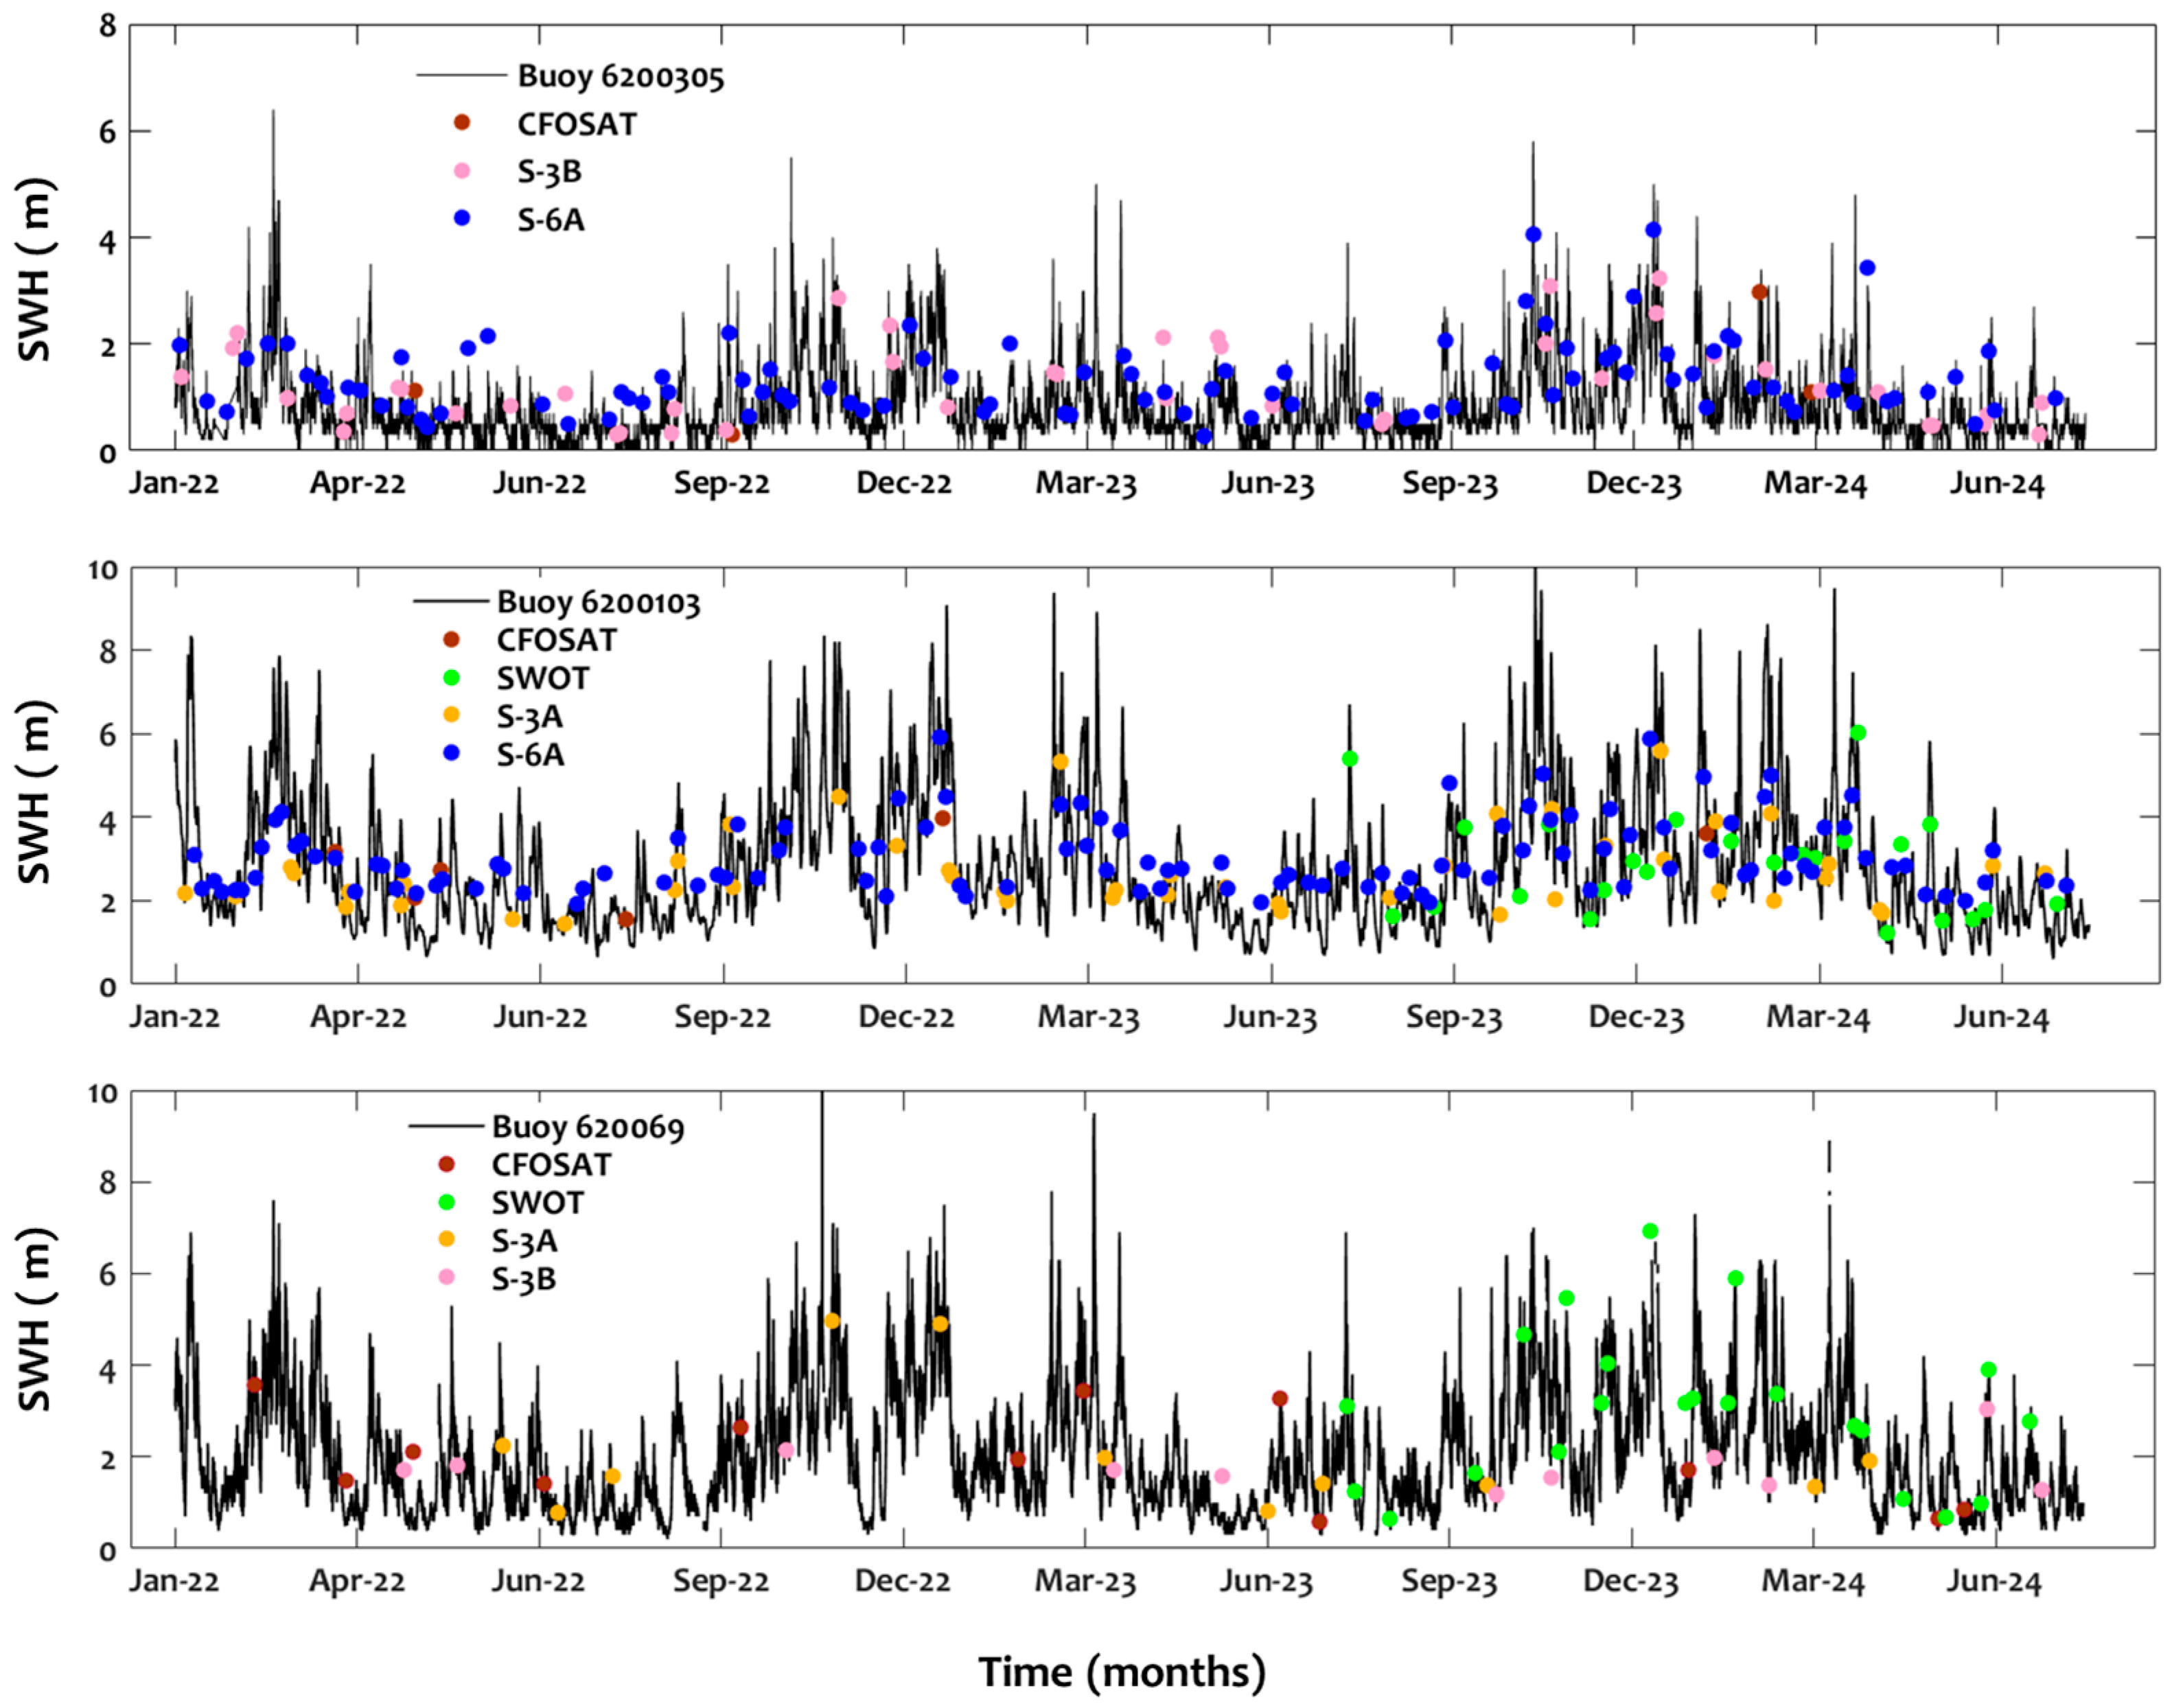
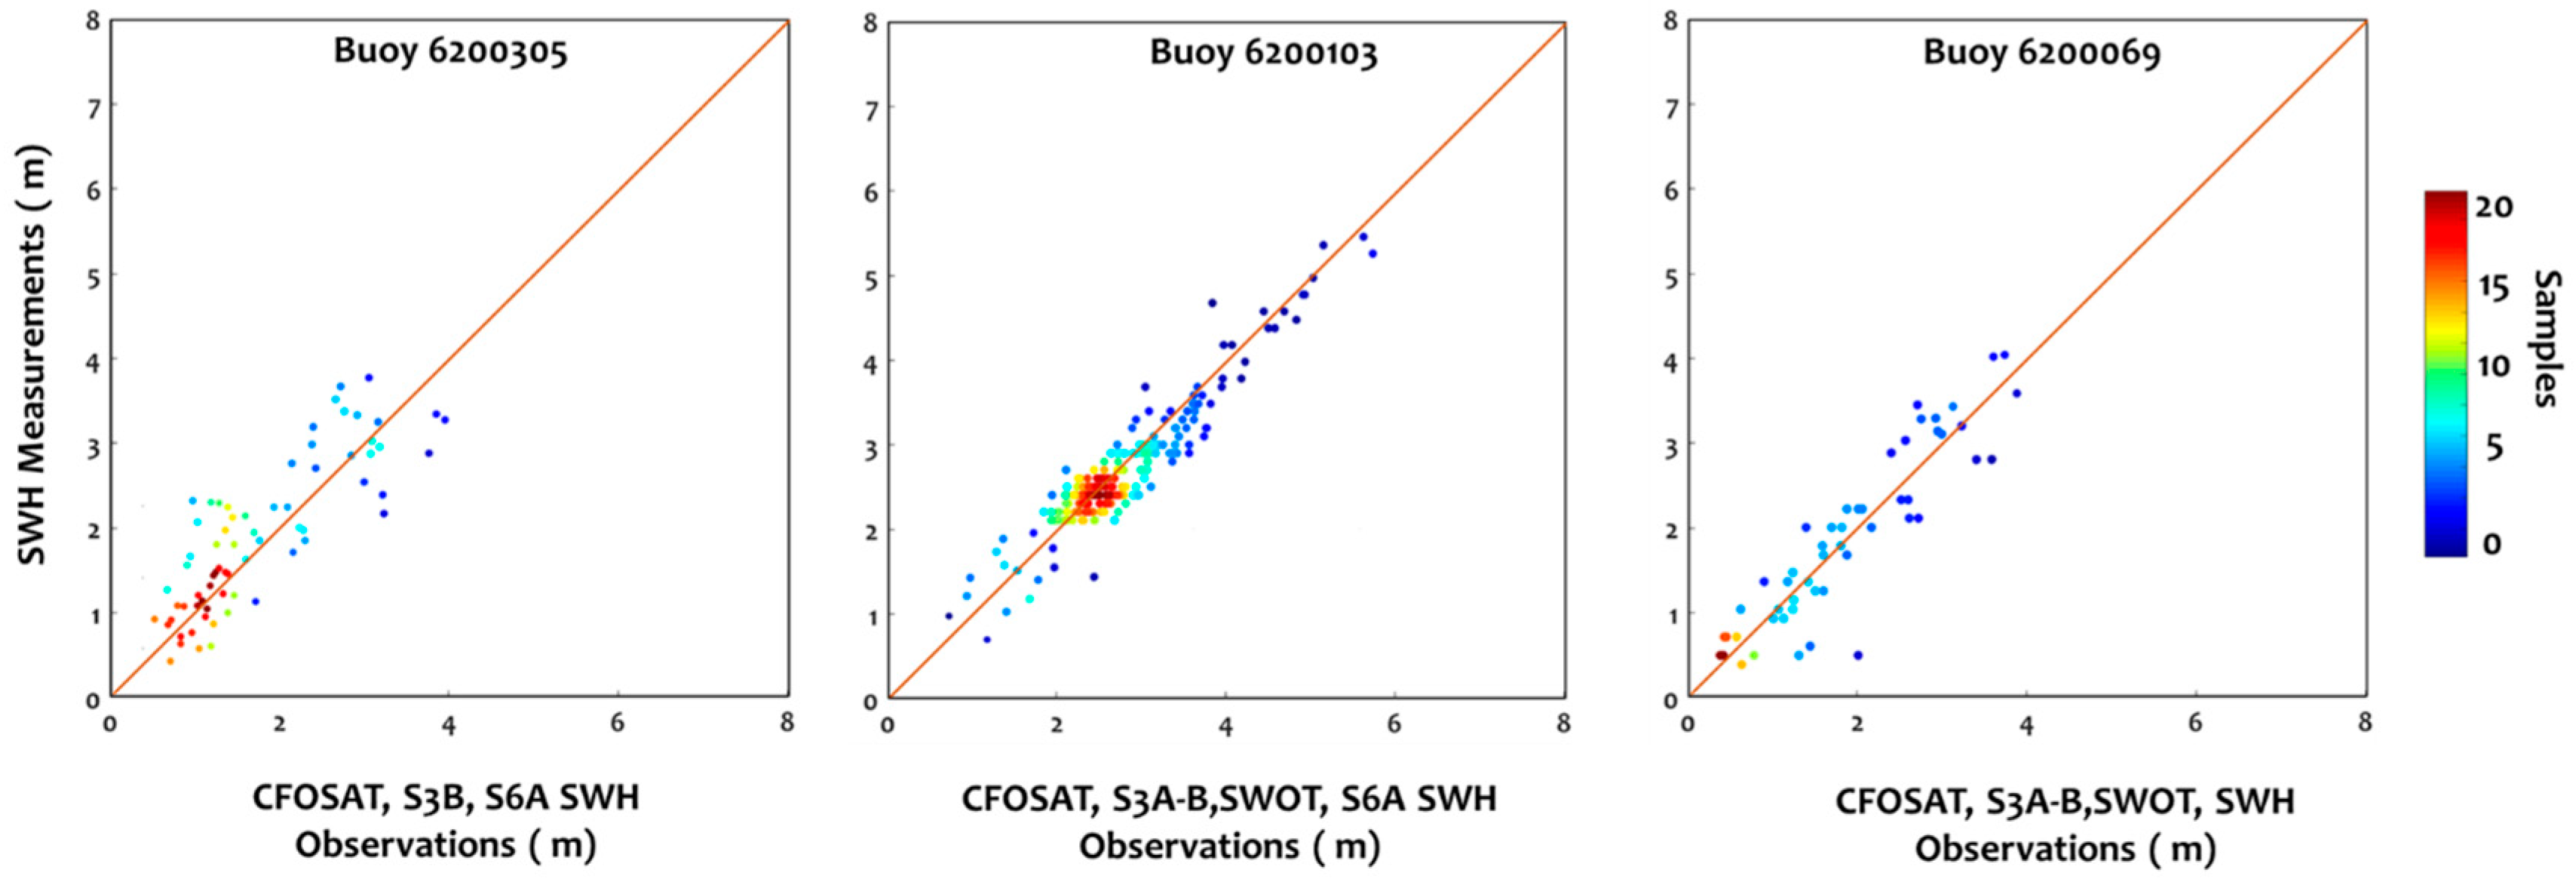
The multi-source SWH records were compared to buoy measurements (
Figure 4): buoy 6200305 with CFOSAT, SWOT, S-3A, S-3B, and S-6A; buoy 6200103 with CFOSAT, SWOT, S-3A, and S-6A; and buoy 6200069 with CFOSAT, SWOT, S-3A, and S-3B.
Overall, altimetry SWH observations reproduce significant wave heights accurately, including extreme waves (Hs > 3 m). Comparisons with S-3A and S-3B yield a mean RMSE (Root Mean Square Error) of 0.75 m and SD (Standard Deviation) of 0.62 m, with moderate waves (Hs < 2 m) overestimated by 15%. Strong agreement is also observed between in situ measurements and altimetry SWH from CFOSAT, SWOT, and S-6A, with RMSE and SD below 0.42 m.
The correlation coefficient R
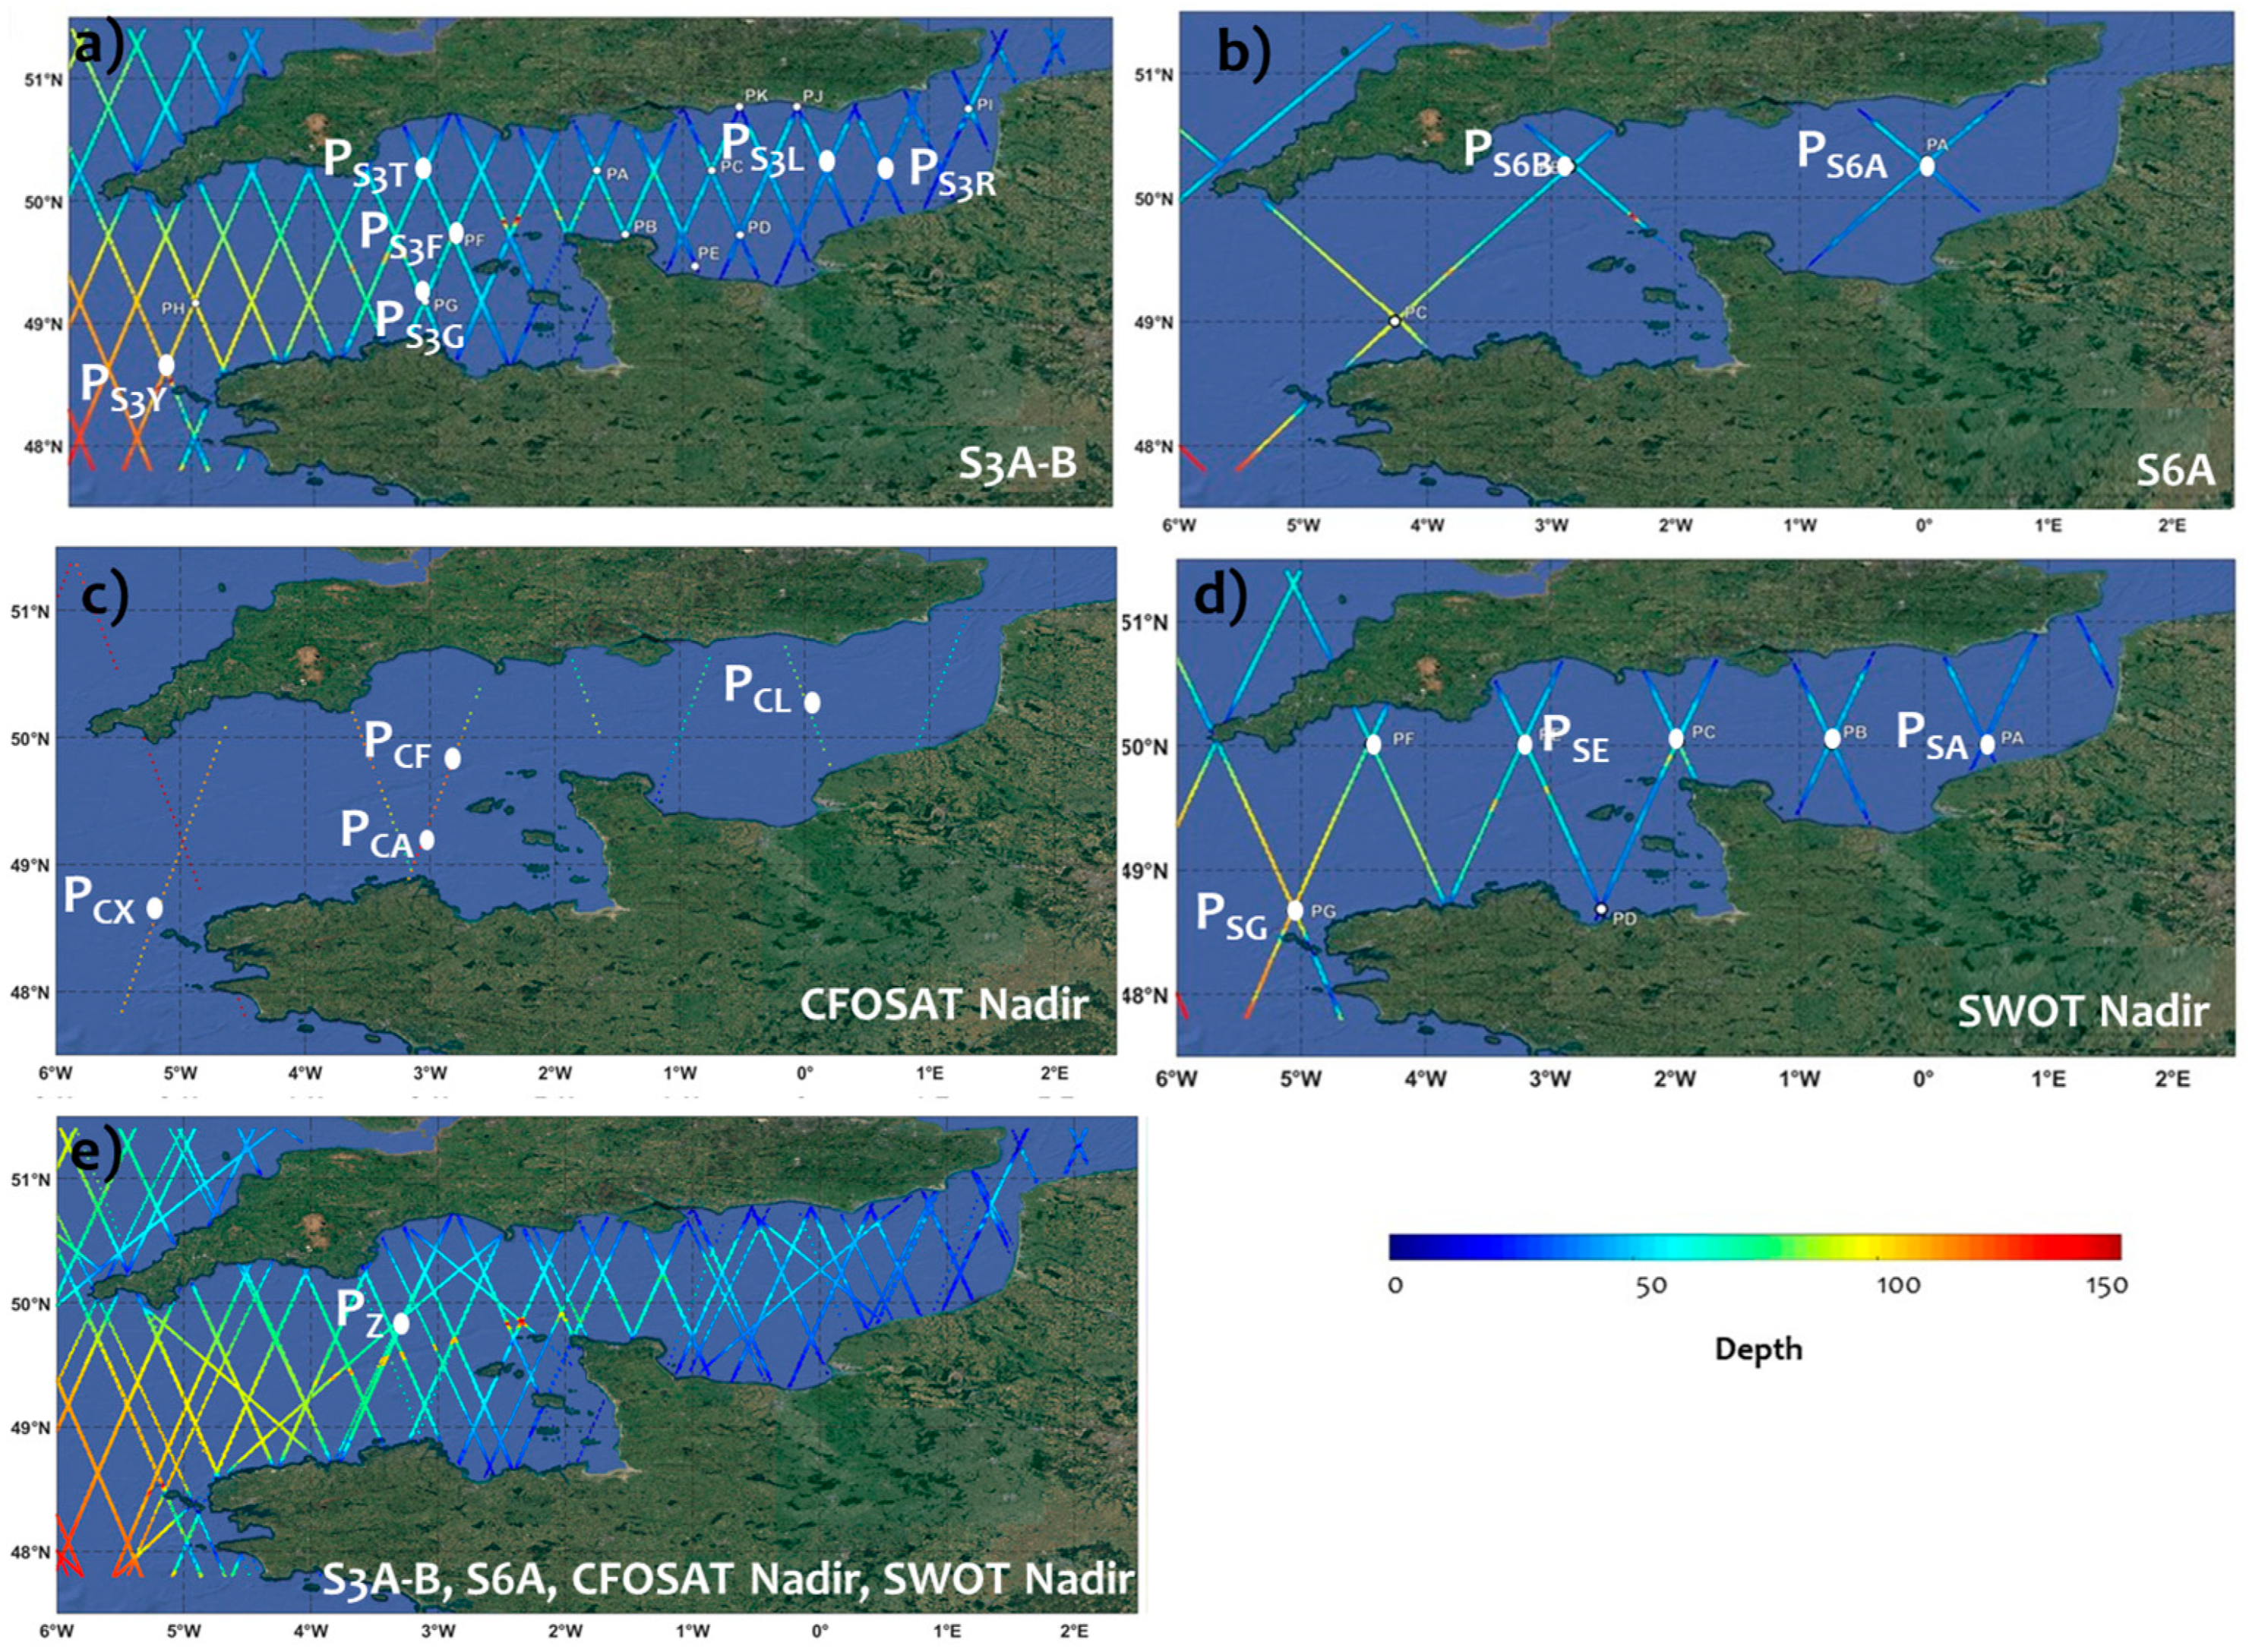
2 between altimetric and buoy-measured SWH was quantified at multiple locations near buoys 6200305 and 6200069 (P
S3L, P
S6A, P
CL close to the buoy 6200305; P
S3F, P
S6B, P
CF, P
SE close to the buoy 6200305; P
S3Y, P
CX, P
SG close to the buoy 6200069 as shown in
Figure 2) at distances ranging from 5 to 50 km. SWH estimates from five altimeters (Sentinel 3-A, 3-B, S-6A, CFOSAT, SWOT) show reasonable agreement with buoy measurements, with a mean correlation coefficient of approximately 0.90. Correlation exceeds 0.96 in sites located within a 10 km radius of the buoys and declines to ~0.86 when this radius is around 50 km (
Table 3).
Scatter-point density plots comparing SWH observations (S3, S6, and CFOSAT for 6200305; S3, S6, CFOSAT, SWOT for 6200103; S3, CFOSAT, SWOT for 6200069) are shown in
Figure 5. Results indicate that SWH closely matches buoy-measured wave variances.
Near the Seine Bay, coherence between buoy 6200305 and altimetry (S6A) shows slight bias, with SWH overestimated in moderate seas and underestimated in energetic states. Discrepancies are strongest in complex, shallow areas like the semi-enclosed Channel, where wave reflection between French and UK coasts intensifies during storms [
26]. They also reflect buoy–track distance, as altimetry data were extracted from the nearest point offshore. Then, accuracy of buoy–altimeter SWH comparisons decreases with separation distance, and most differences are attributable to the buoy–track offset (>50 km), producing large discrepancies.
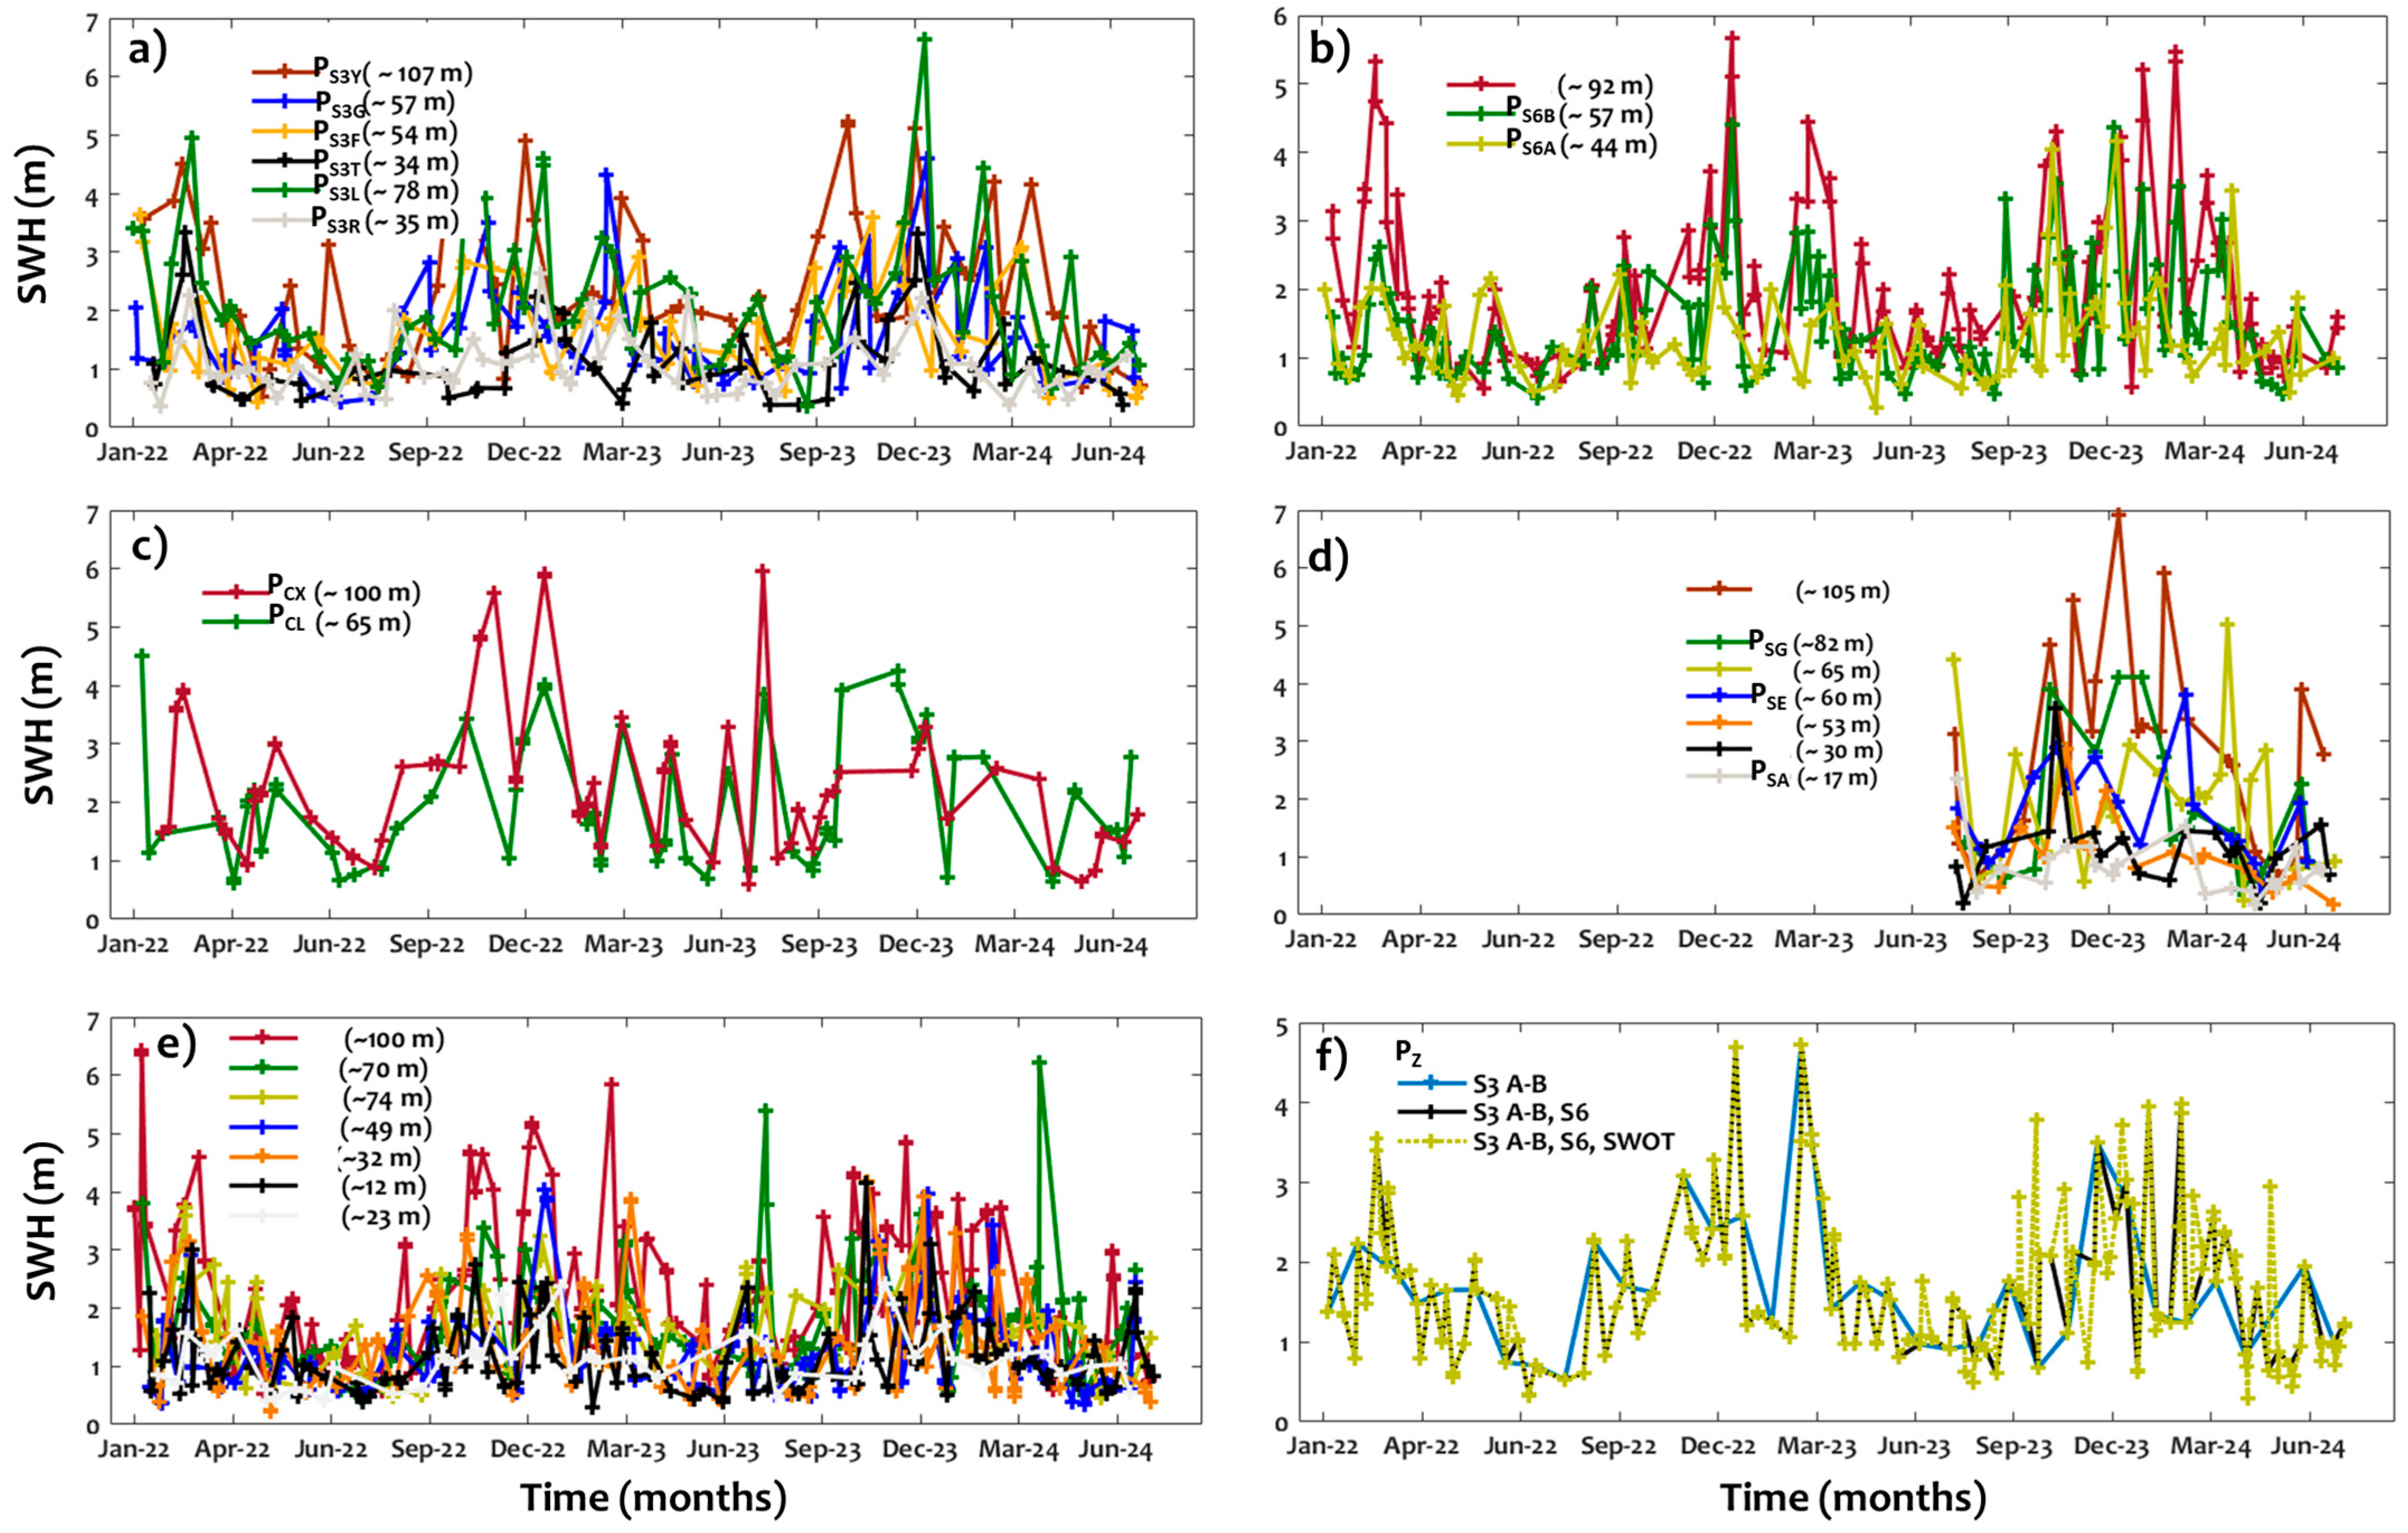
Altimeter SWH data from S3A-B (combined S3A and S3B missions), S6A, CFOSAT, and SWOT were used to examine temporal wave variability across the Channel at varying depths (locations defined in
Figure 2), from its entrance (~100 m) to nearshore (~20 m) and coastal areas. Individual mission time series are shown in
Figure 6a–d, and the integrated multi-mission dataset in
Figure 6e. The multi-source SWH dataset provides high-resolution temporal coverage, capturing wave multi-timescale variability, from daily to seasonal and annual scales, with moderate waves from May to October and energetic winter waves from November to April. SWH estimates, from individual altimeters, are limited in accuracy but improve considerably when combined, capturing most short-scale variability, including extreme events. Depth-resolved SWH time series reveal ~35% dissipation at 80–65 m, followed by an additional ~10% attenuation at 25–35 m (
Figure 6e).
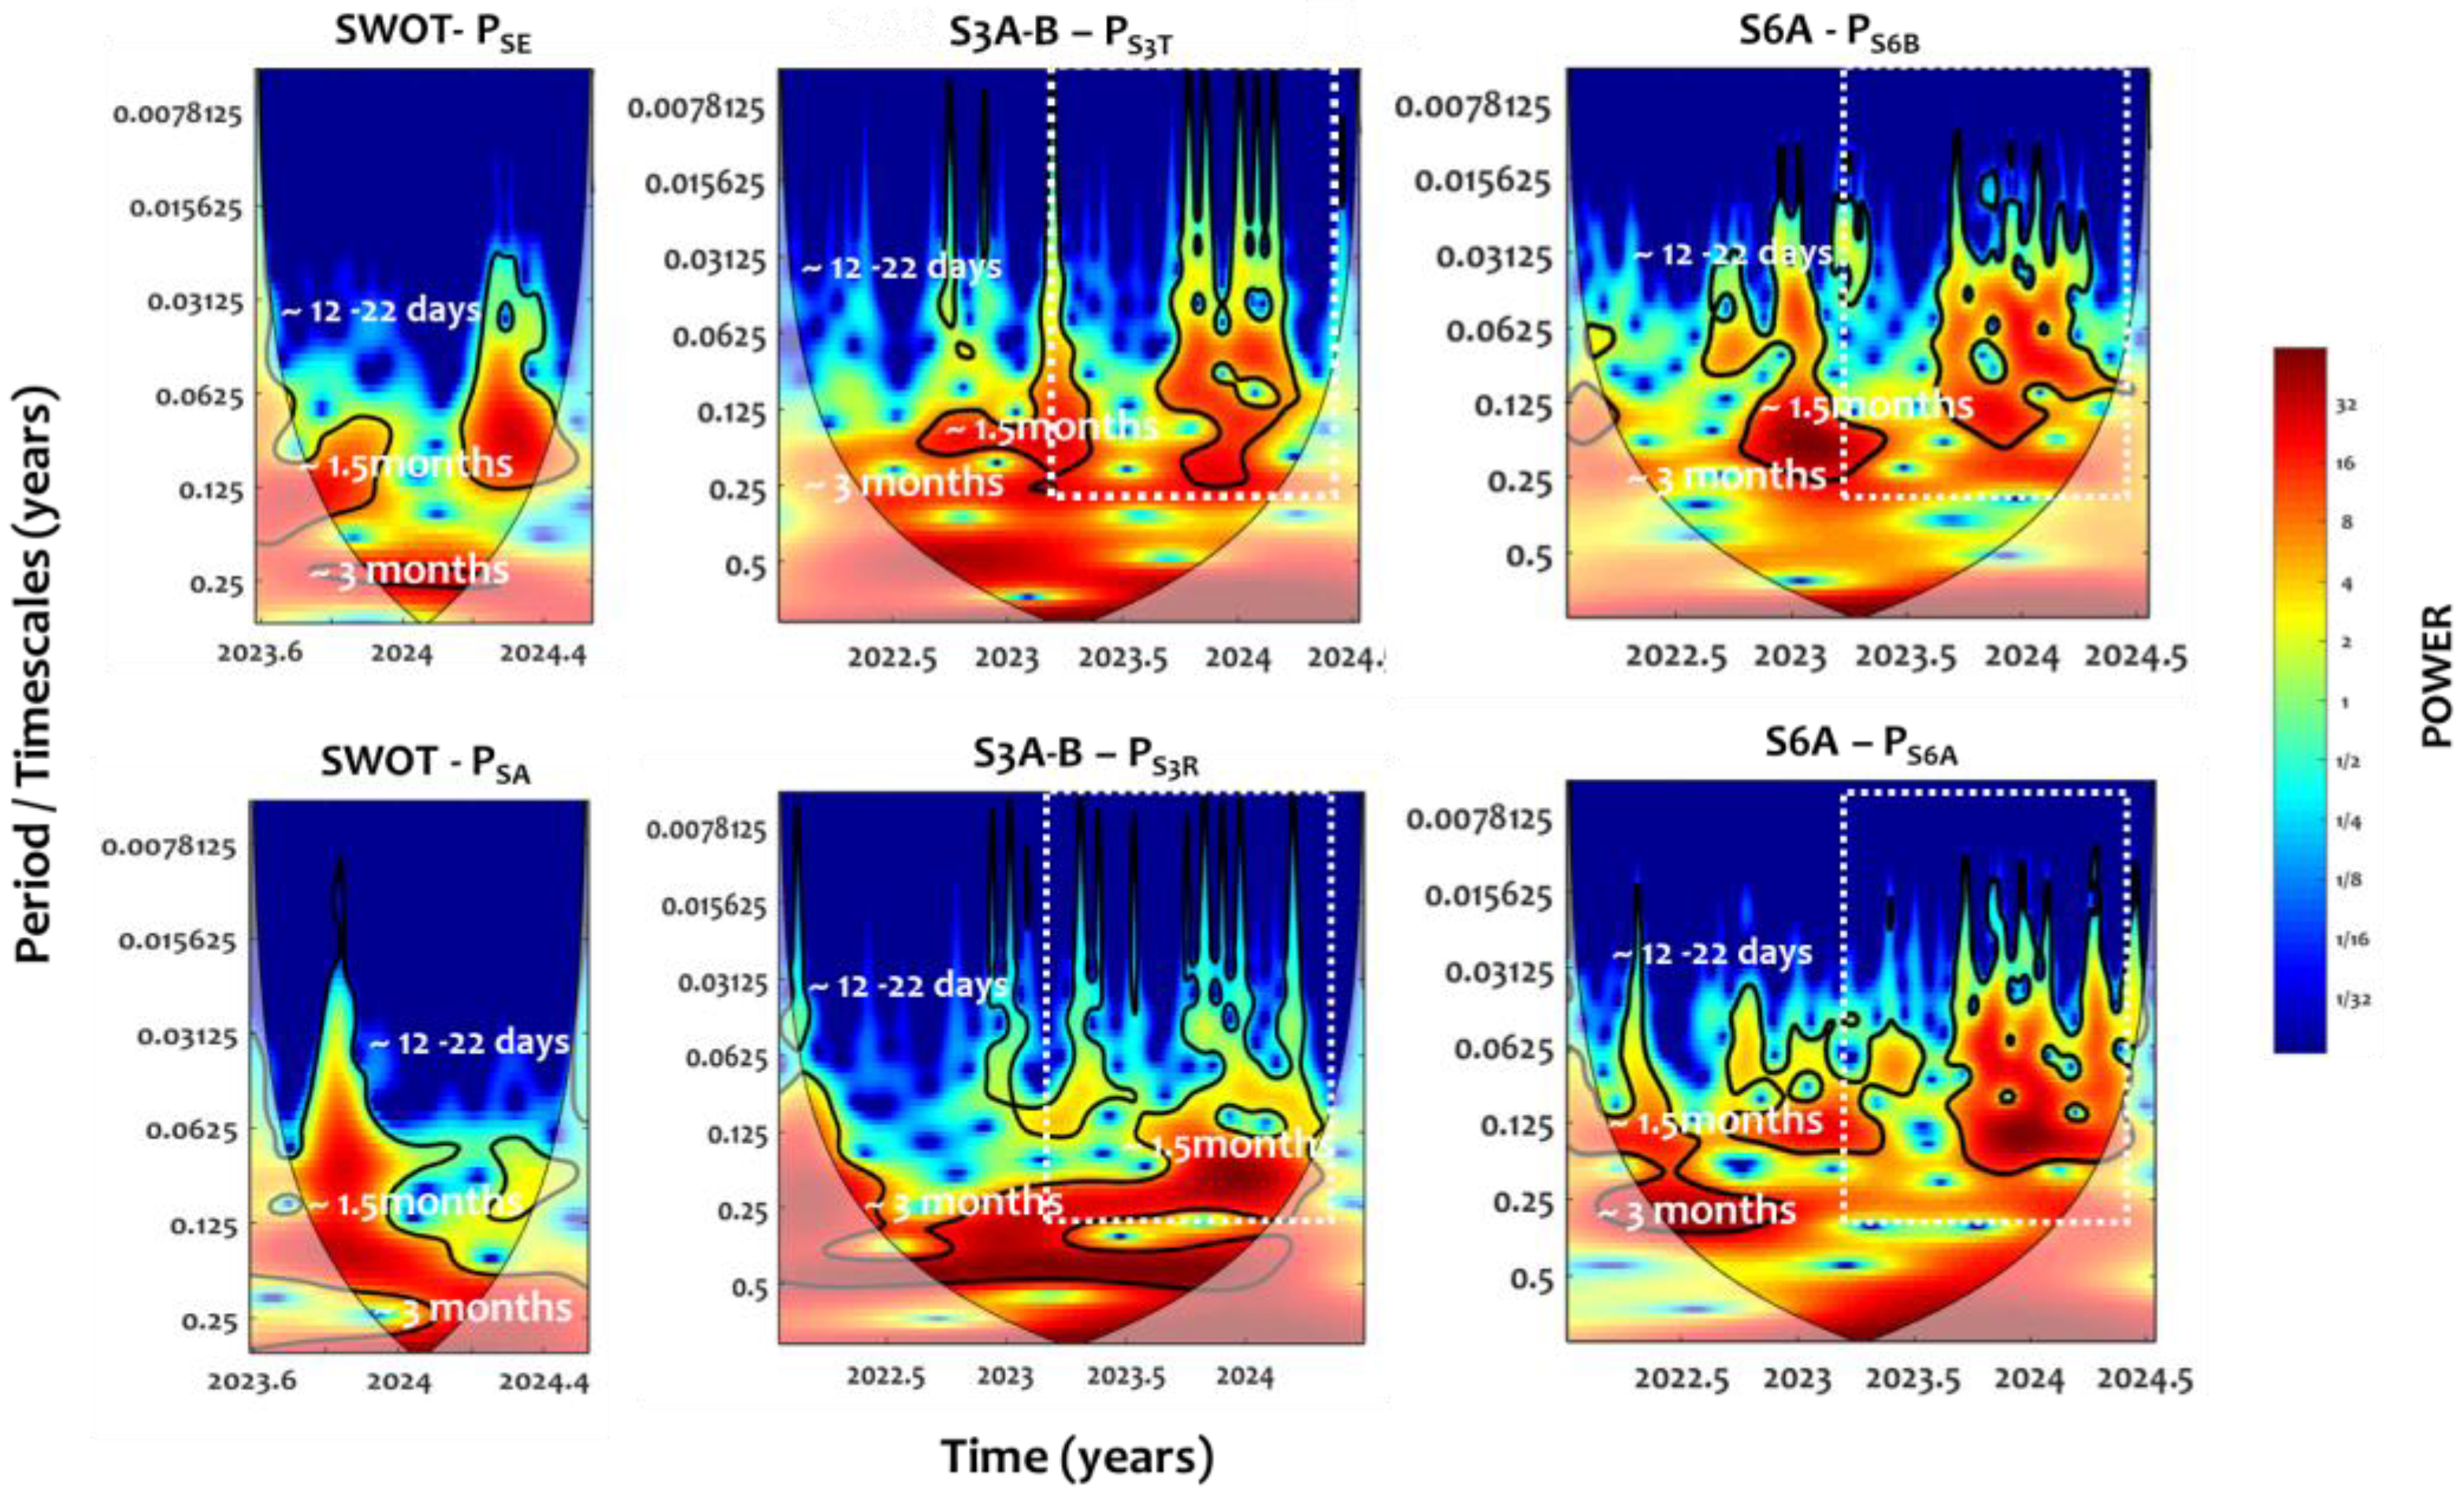
Spectral analysis of an 18-month wave time series (January 2022–July 2024) from combined altimeters was conducted to assess the ability of multi-source data to capture variability across timescales, including high-energy short periods. Continuous Wavelet Transform (CWT) analysis revealed spectral variability ranging from short (high-frequency) to long (low-frequency) scales. The multi-source SWH signal was analyzed at two locations as follows: (1) deep areas near the Channel entrance and Channel Islands (P
S3T for S3A-B, P
S6B for S6A, P
SE for SWOT;
Figure 2, top panel of
Figure 7), and (2) shallow areas near the coast (P
S3R for
S3A-B, PS6A for S6A, P
SA for SWOT;
Figure 2, bottom panel of
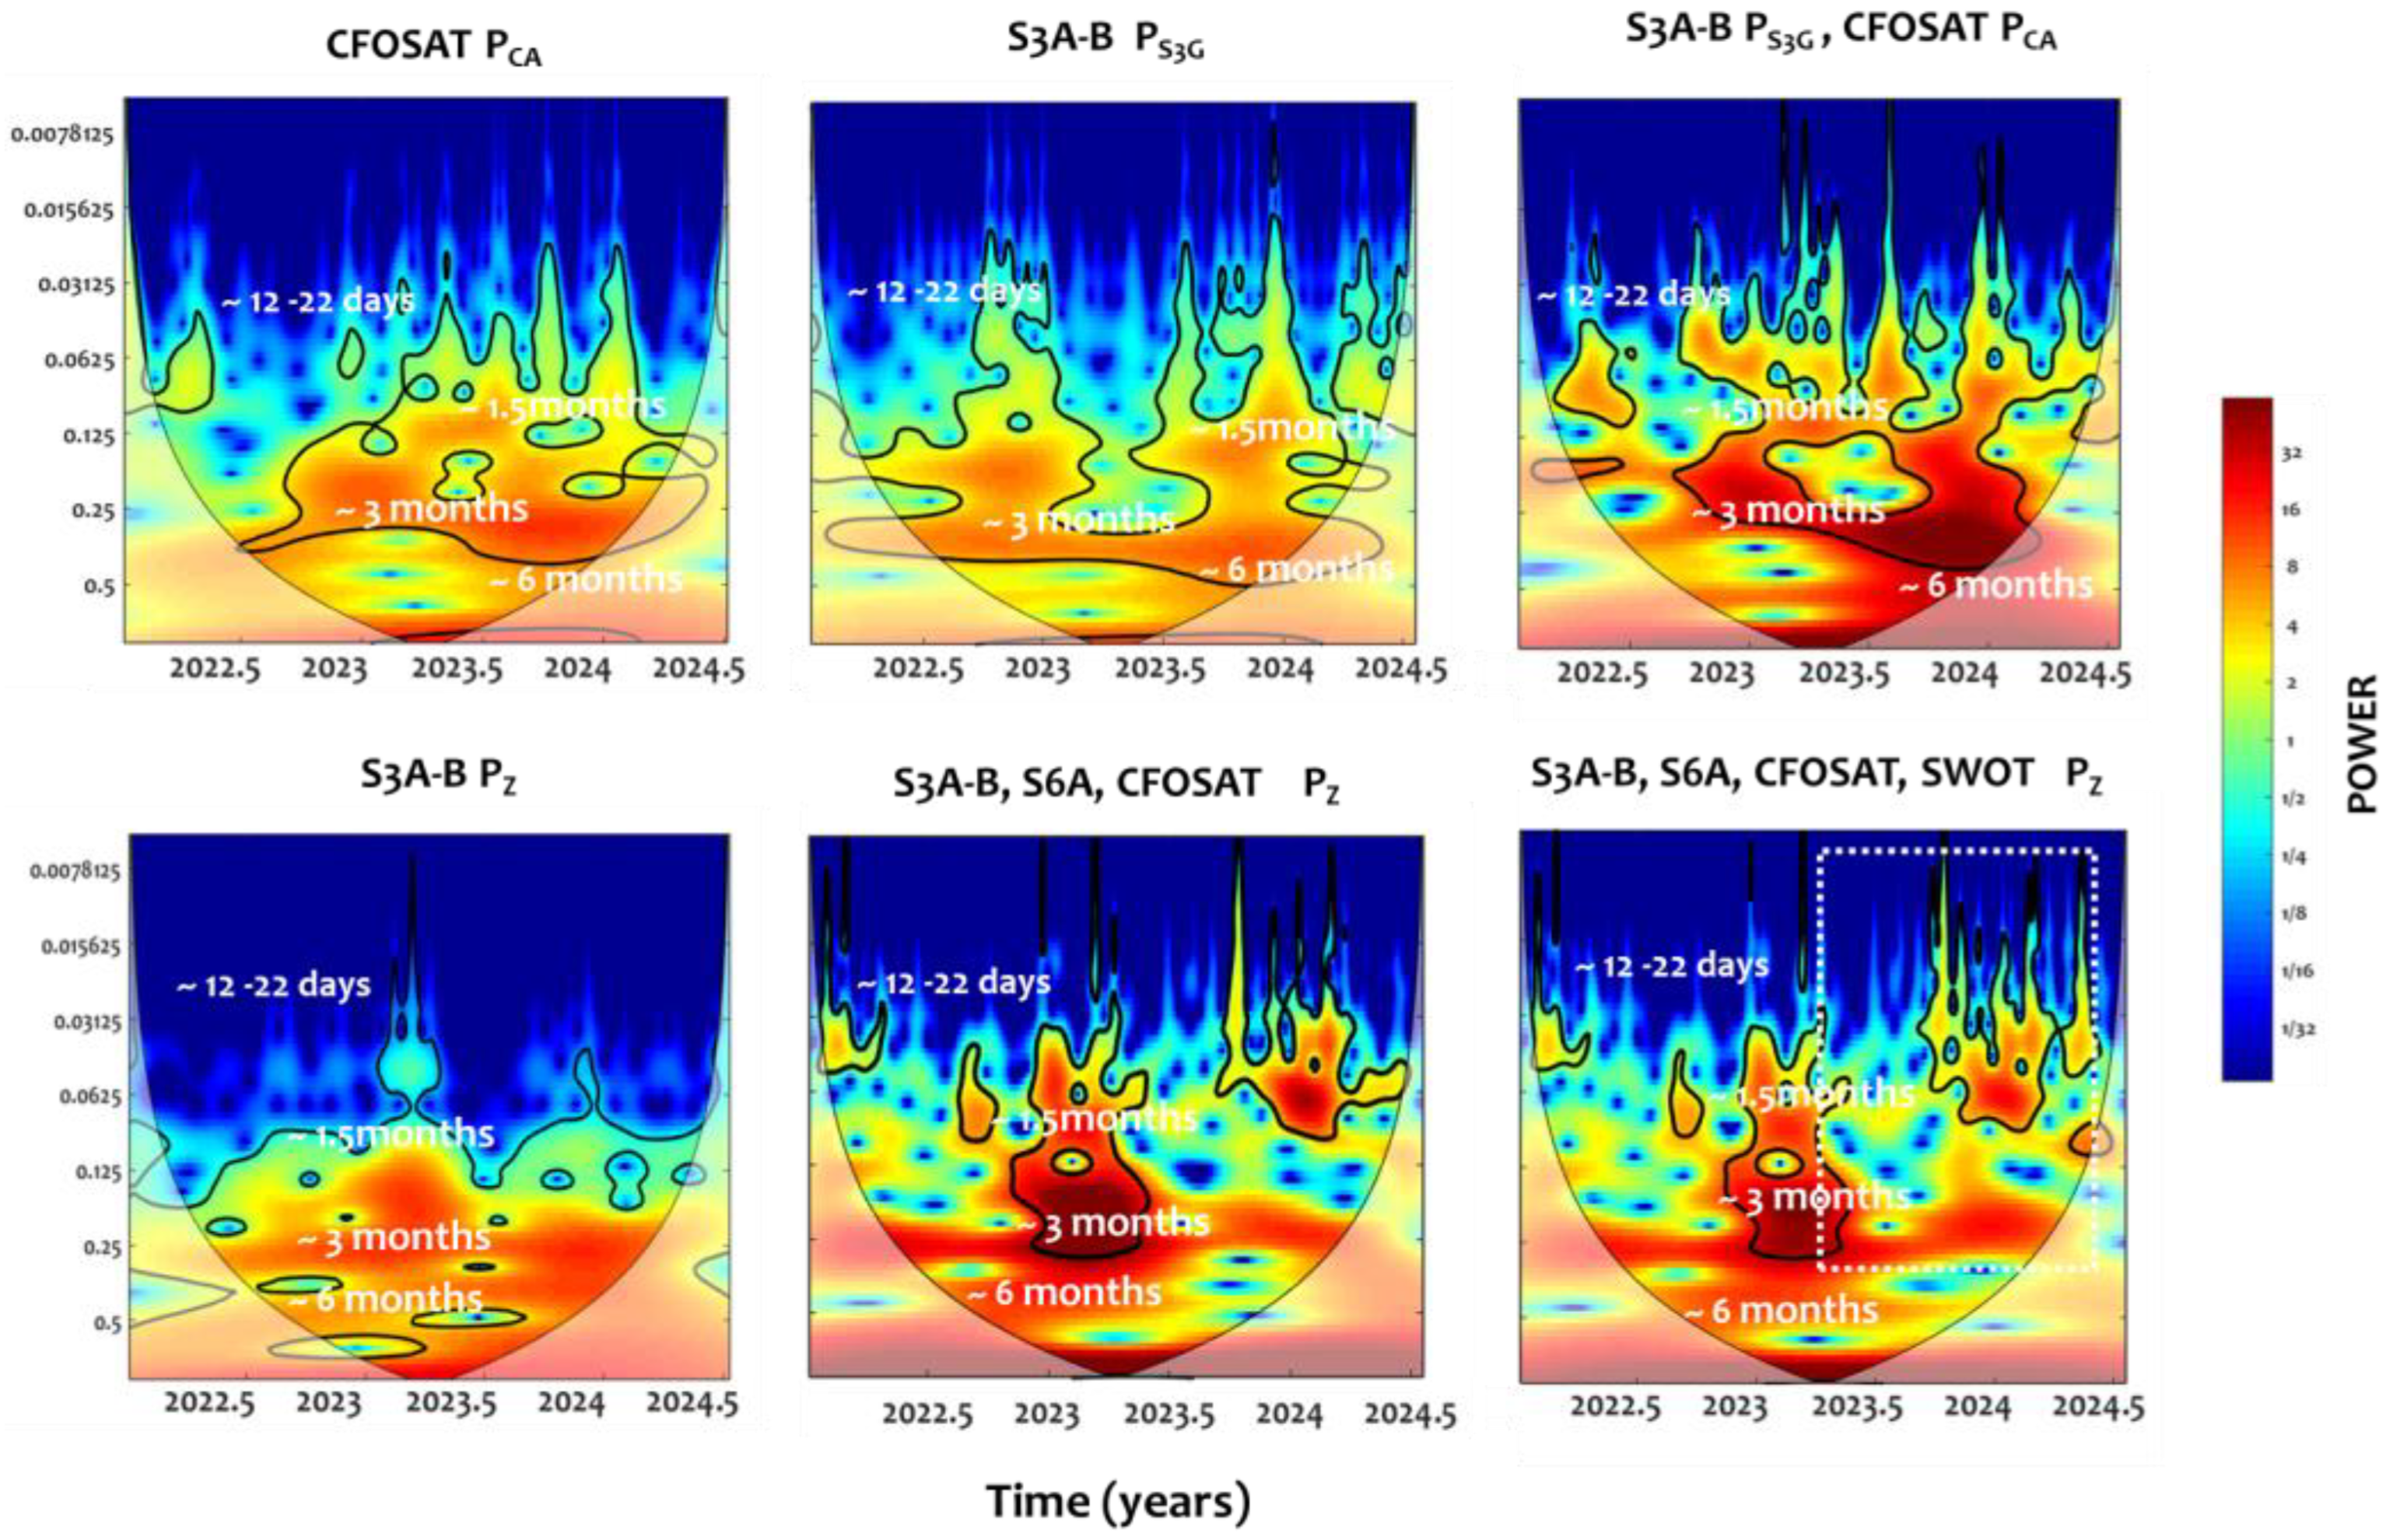
Figure 7). Frequency comparisons were then carried out for CFOSAT (P
CA), S3A-B (P
S3G), and S6A with SWOT (P
Z;
Figure 2e), as shown in the top and bottom panels of
Figure 8.
Figure 7 and
Figure 8 present the CWT of SWH, with variance shown from blue (low) to red (high). The black line marks the cone of influence, where power may be underestimated due to zero-padding, and thick black contours indicate 99% confidence limits from Monte Carlo simulations (>95% significance). Each diagram depicts variance power across time (
x-axis) and frequency/scale (
y-axis). Analysis focused on short frequencies, corresponding to oscillation periods less than half the record length, which contribute strongly to total variance. Significant variance appears at short scales, with wavelengths of ~12 days to ~3 months, extending to ~6 months in some cases depending on record length.
CWT diagrams (
Figure 7) were used to compare SWOT, S3A-B, and S6A in capturing SWH variability across timescales. Wavelet plots reveal multiple wavelength bands (frequencies), each representing a power range (variance). All three altimeters show similar high-variance regions (>20%, red in the diagram) over wavelengths of ~12 days to ~3–6 months, though with heterogeneous energy structures and distributions. This confirms that SWH variability spans inter-daily (~12–22.5 days) to inter-monthly (~1.5–6 months) scales, shaping distinct wave patterns.
Energy concentration at short timescales (days) may be partly influenced by the repeat cycles of Sentinel-3A/B, S6A, and SWOT. The heterogeneous power distribution across timescales brings about differences in sampling frequency (higher sampling captures higher frequencies) and record length (longer series capture lower frequencies). Low-frequency variability (~6 months) is absent in SWOT data due to the limited length of data (only recorded during 2023–2024).
CWT diagrams (
Figure 7) for 2022–2024 show energy concentrated in winter (October 2022–March 2023 and November 2023–April 2024), with high-variance spots linked to storm events, clearly captured by S3A-B and S6A. These patterns highlight SWH variability at inter-monthly and seasonal scales.
Figure 8 shows the spectral content of SWH from multi-source altimetry, assessed individually for each altimeter and jointly in combination, at two Channel entrance sites (P
CA and P
S3G in top panel; P
Z in bottom panel) near Roscoff in the Channel Islands. Results reveal two variability modes: high frequencies (~12–22.5 days) and low frequencies (3–6 months), with low-frequency variance < 16%. Combining S3A-B and CFOSAT increases variance at inter-monthly to seasonal scales to 32%, yielding a clearer variability pattern. Inter-daily frequencies are better resolved in the combined dataset, capturing short, high-energy events.
S3A-B captures the frequency distribution of SWH variability, further enhanced when combined with S6A, CFOSAT, and SWOT, yielding higher variance and clearer energy patterns across timescales. These patterns peak during the energetic winters of 2023–2024, with ~1.5- and ~3-month frequencies well resolved in the combined dataset, demonstrating SWOT’s improved accuracy in capturing multi-frequency SWH features when integrated with other altimeters.
Enhanced detection of SWH variability across scales from multi-source altimetry arises from increased temporal sampling, capturing short, high-energy events often missed by individual altimeters. Four energetic storms were identified during 2023–2024 (
Table 1). Individual altimeters could capture at most one event (e.g., Storm Mathis by S3A but not CFOSAT), whereas the multi-source approach effectively captured three storms—Mathis, Ciaran, and Karlotta—covering 75% of events. Conventional altimeters are further limited by spatial gaps between cross-tracks [
29,
30], partly mitigated by SWOT’s wide swath, which provides two-dimensional coverage, reduces data voids, and improves spatial completeness.
3.3. Spatial Evolution of Wave Features Along the Altimeter Tracks
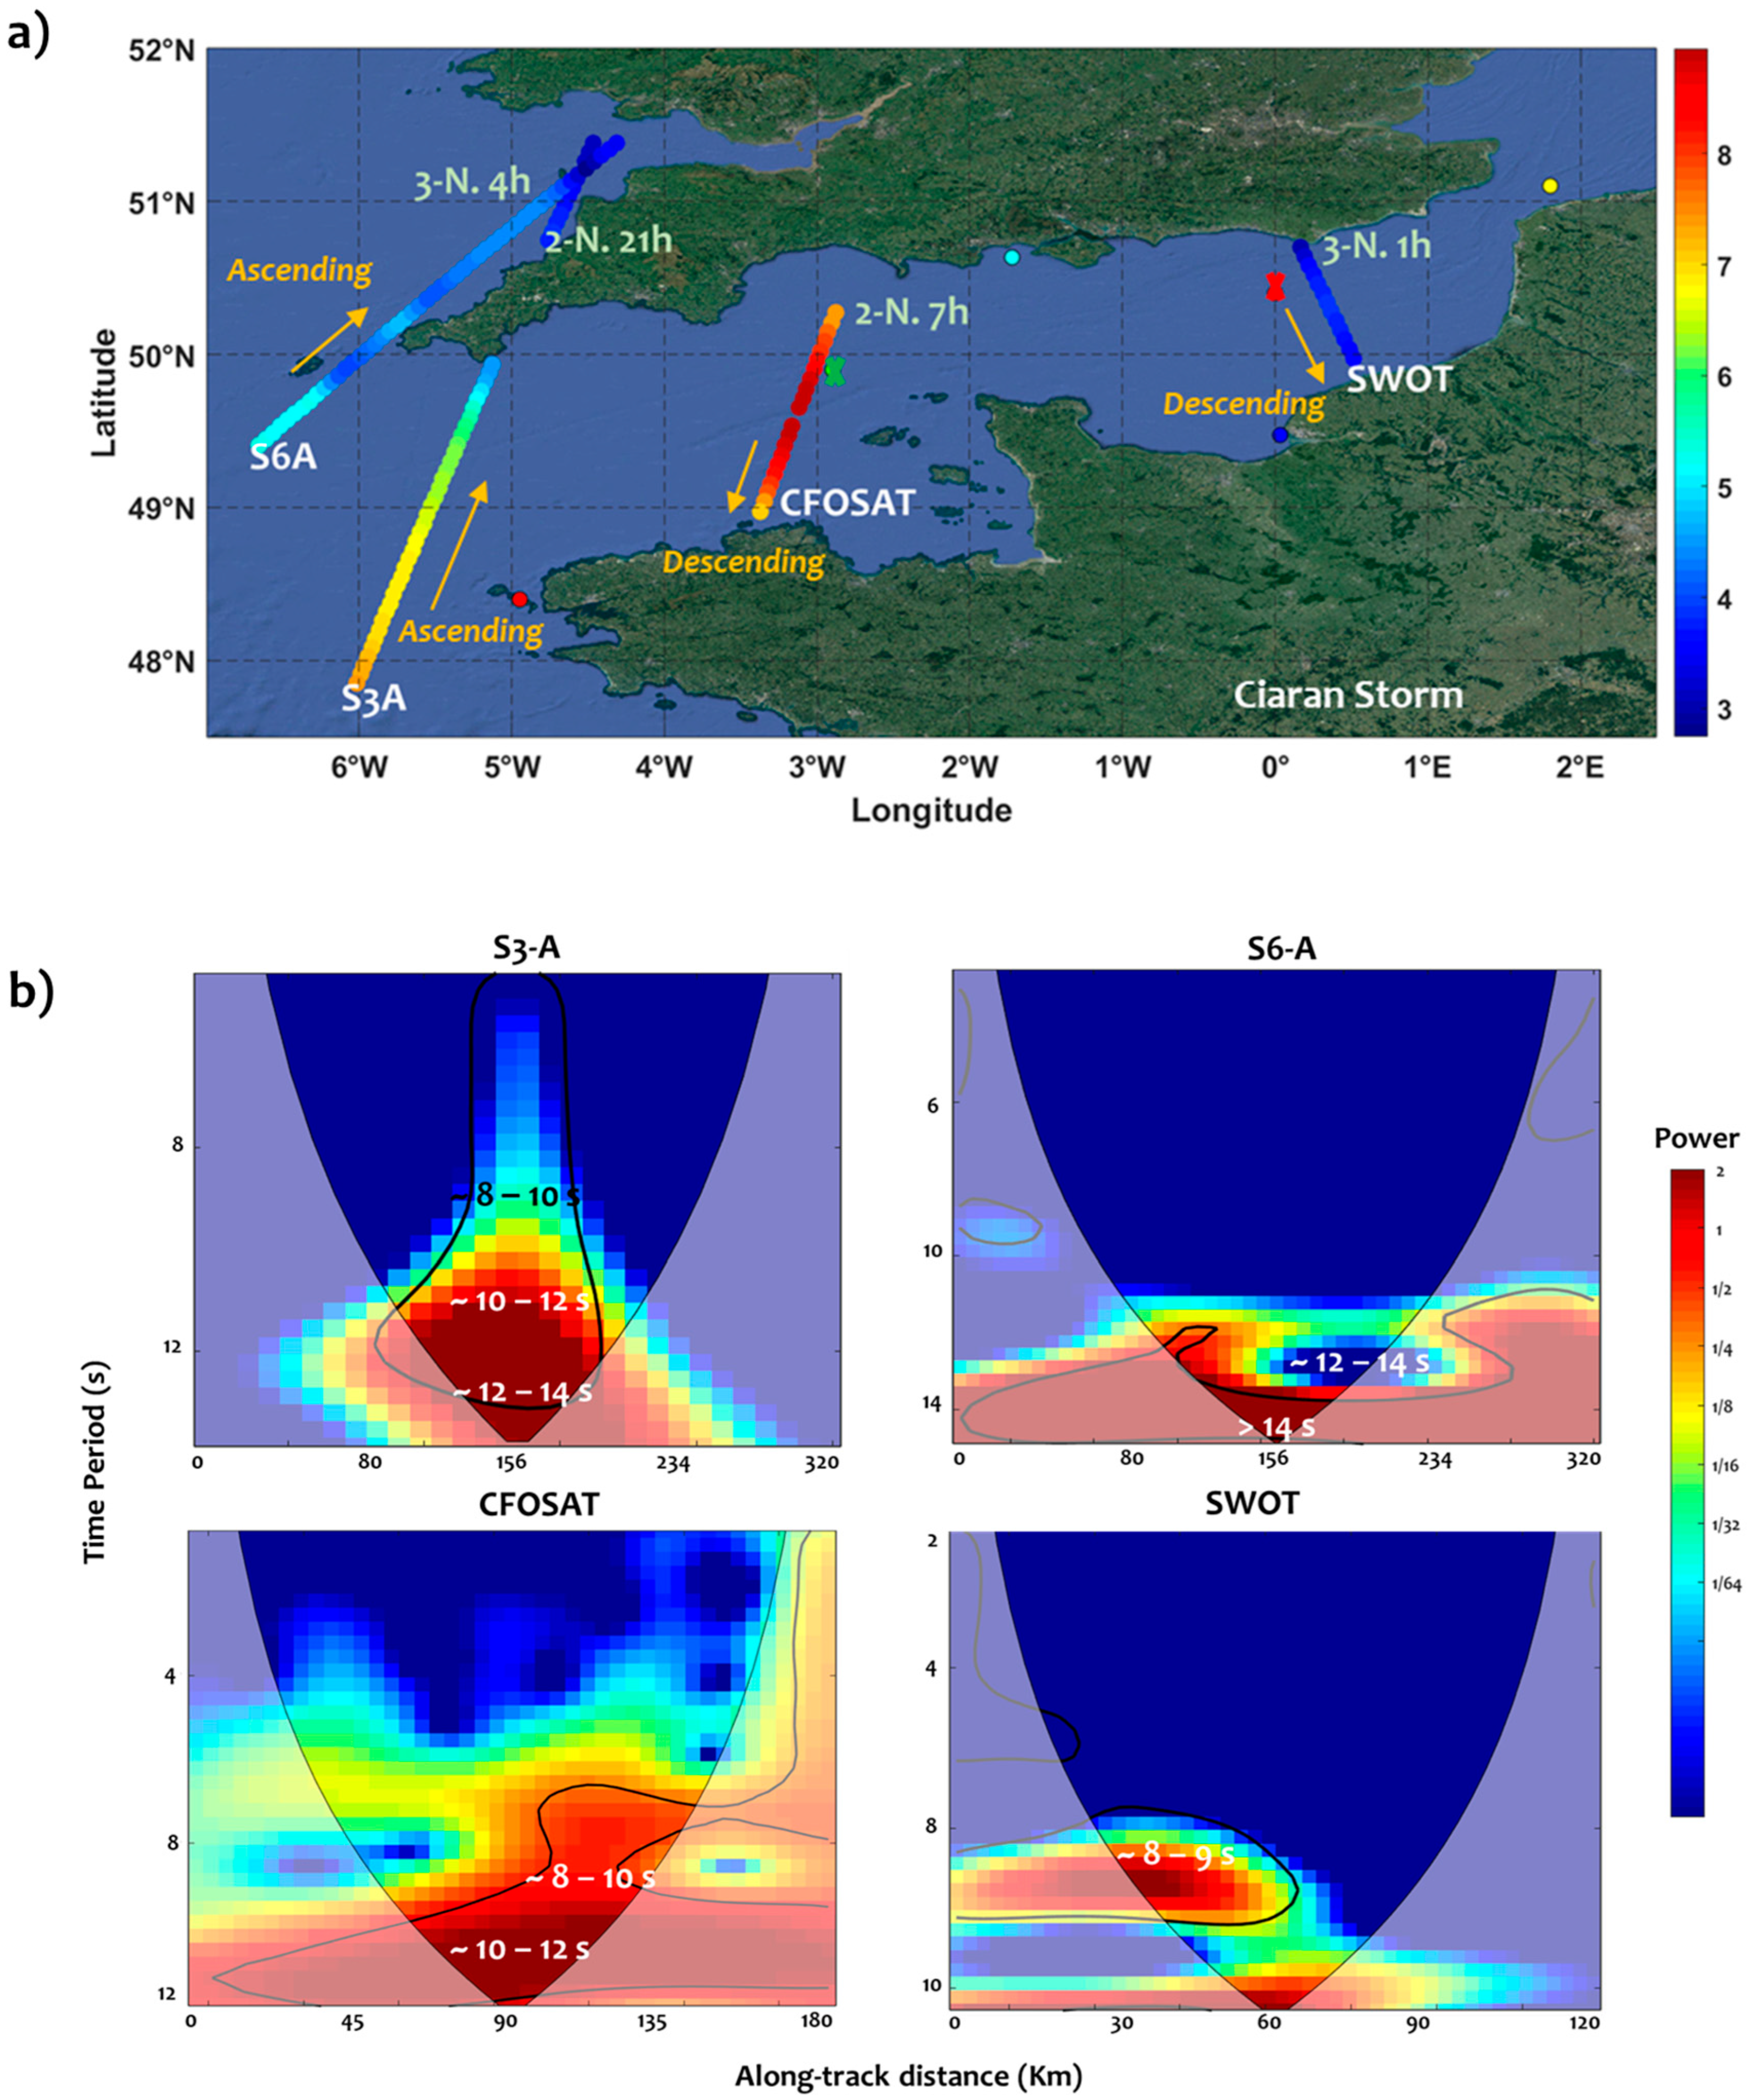
This section analyzes SWH measurements along altimetry tracks to assess the spatial variability of wave features from the nearshore to the coast, using four tracks from Sentinel-3A, S6A, CFOSAT, and SWOT that crossed the Channel at different times during Storm Ciaran (1 November 22:00–3 November 04:00 2023) as follows: S3A (2 November 21 h) and CFOSAT (2 November 7 h) sampled the Channel’s midsection during the storm, while S6A (3 November 4 h) and SWOT (3 November 1 h) covered its later stages (
Figure 9a).
Wavelet spectral analysis of SWH along the tracks was calculated from the coast to deeper zones (following each ascending or descending pass;
Figure 9a). The CWT reveals four spatial variability modes (>14 s, 12–14 s, 10–12 s, and 8–10 s;
Figure 9b), highlighting distinct distributions of wave energy from the open ocean to the Channel and nearshore areas. S6A, mapping SWH in the Atlantic near the UK’s southwest peninsula, captured energetic wave classes dominated by >14 s and ~12–14 s. At the Channel entrance, S3A recorded higher-frequency waves, limited to ~14 s, with two high-variance bands (~12–14 s and ~10–12 s) and reduced variance at ~8–10 s. Near Roscoff (Channel Islands), CFOSAT recorded SWH up to 7–8 m (
Figure 9a) with energetic waves of ~10–12 s and <10 s periods (
Figure 9b). Within the Channel, at the east of the Seine Bay, SWOT captured reduced waves at the end of Storm Ciaran, with shorter periods of ~8–9 s (
Figure 9b).
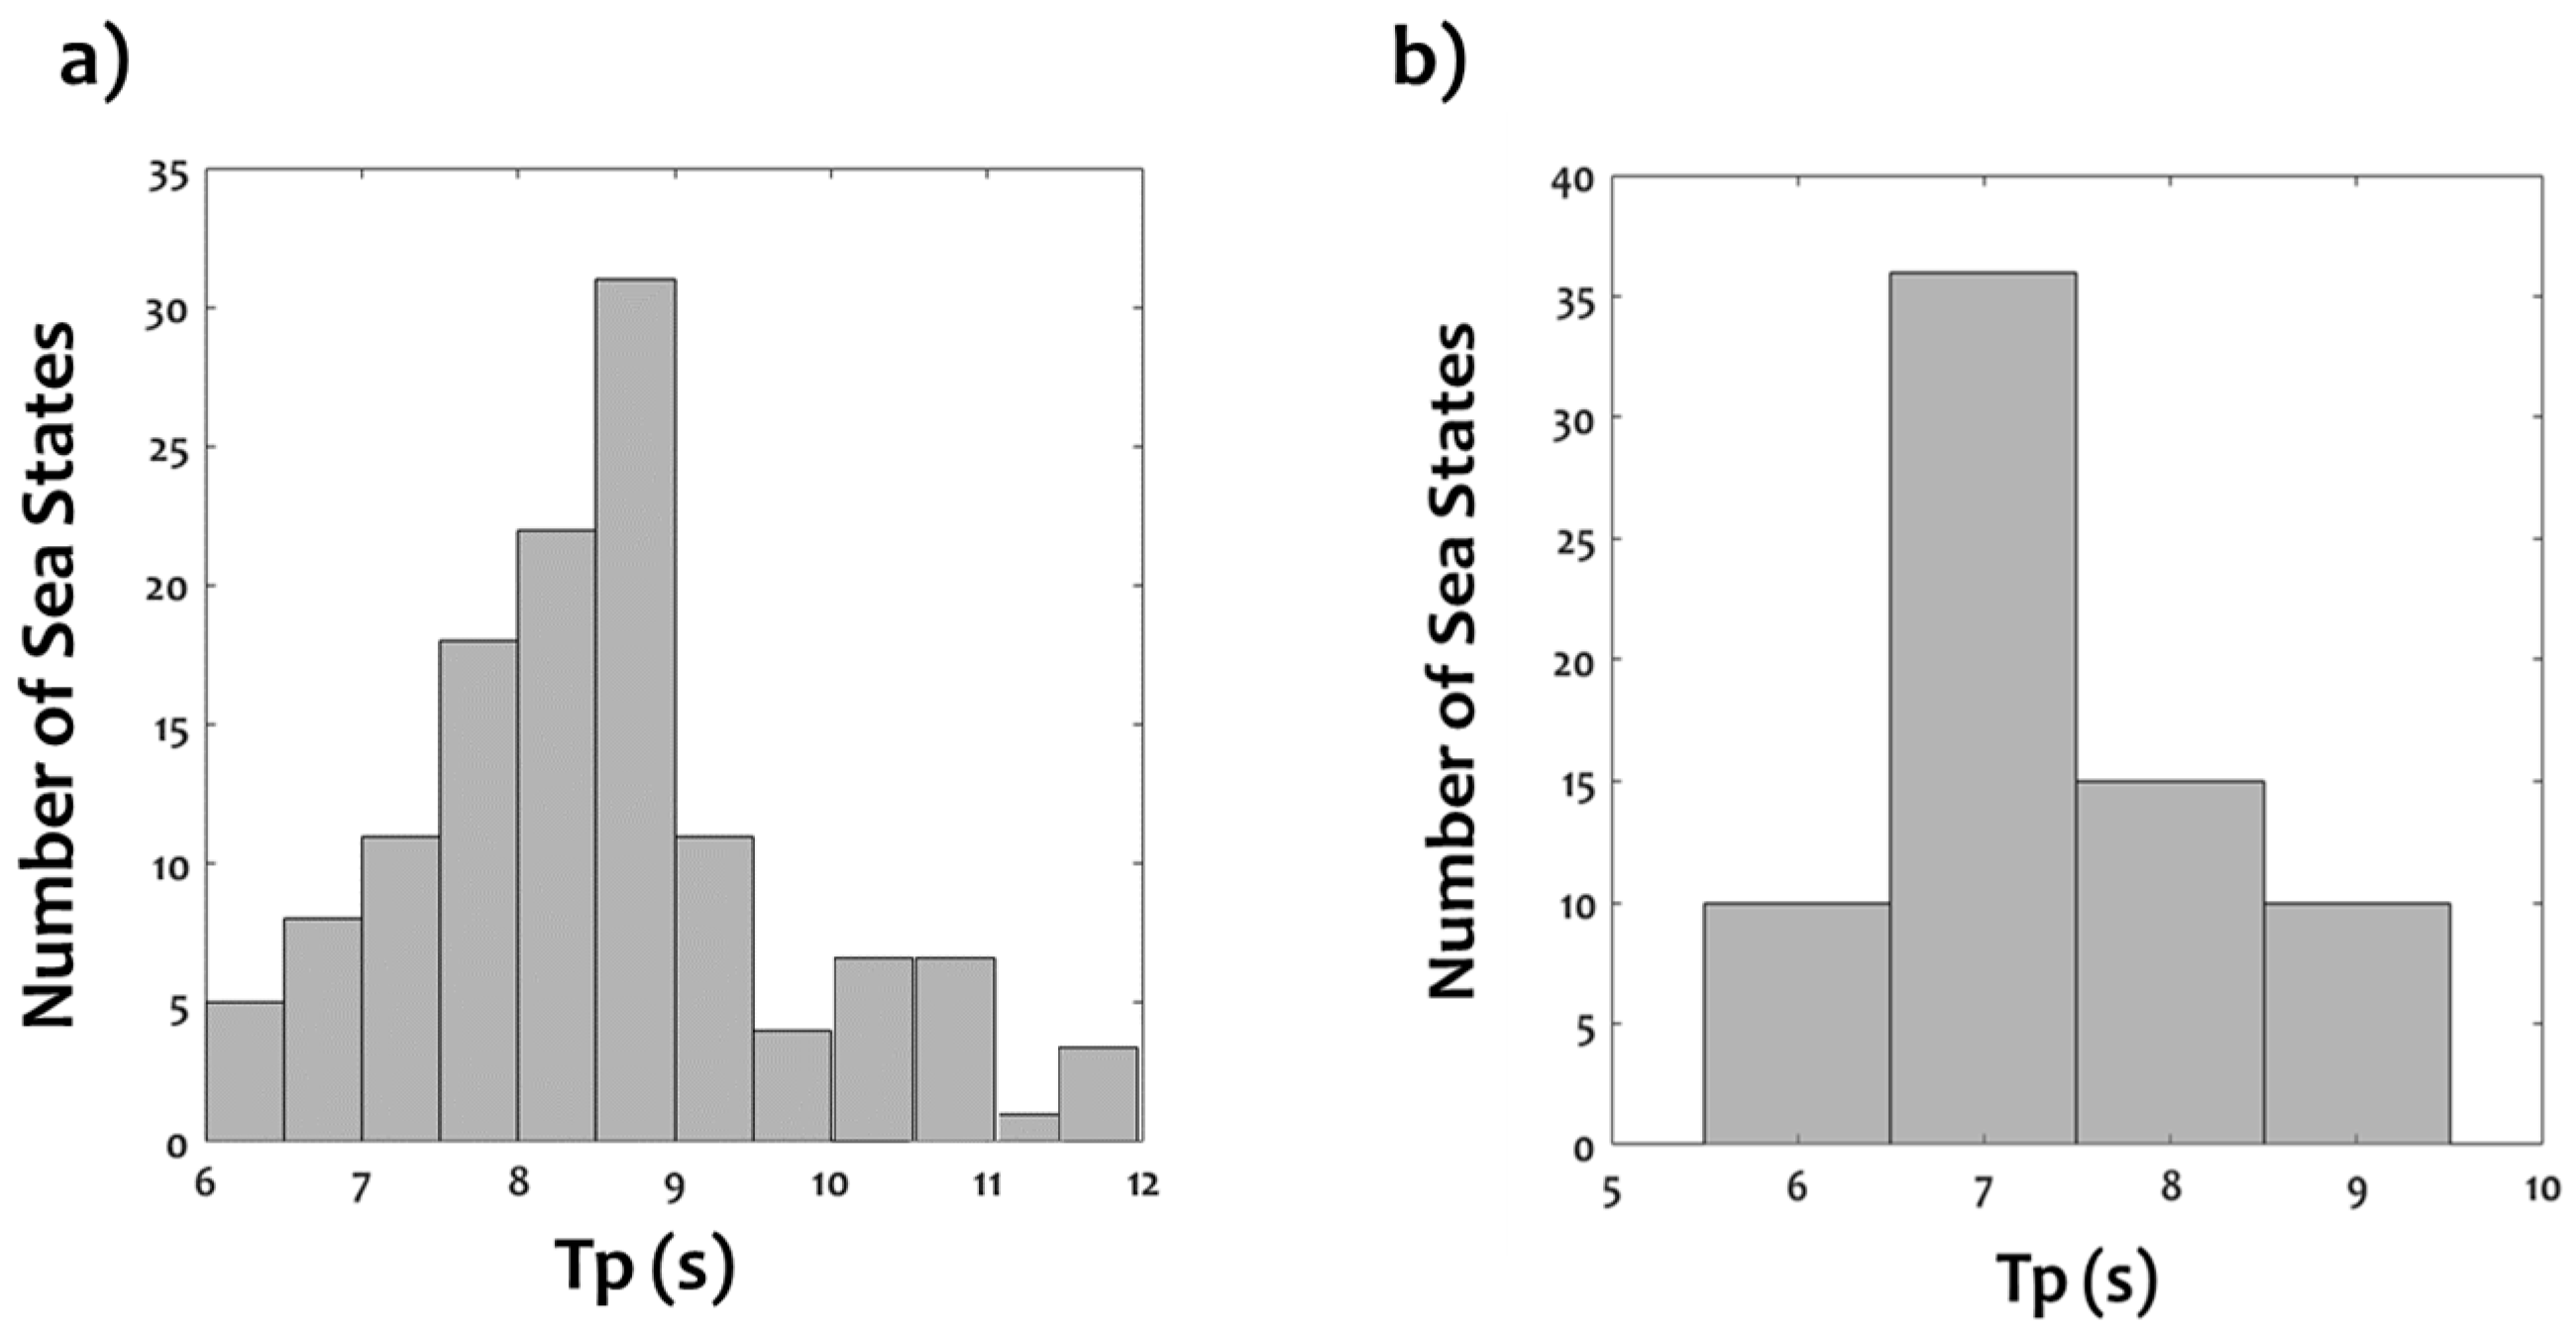
Observed wave features were compared with in situ buoy measurements of wave period (
Figure 10), which summarizes period distributions from buoys 6200305 (red crosses) and 6200103 (green crosses), shown in
Figure 9a, during Ciaran. The probability density function (PDF) of wave periods near to Roscoff indicates a dominant mode of waves with ~9 s (
Figure 10a; wave buoy 6200103), decreasing to ~7–8 s at the east of the Seine Bay (
Figure 10b; wave buoy 6200305).
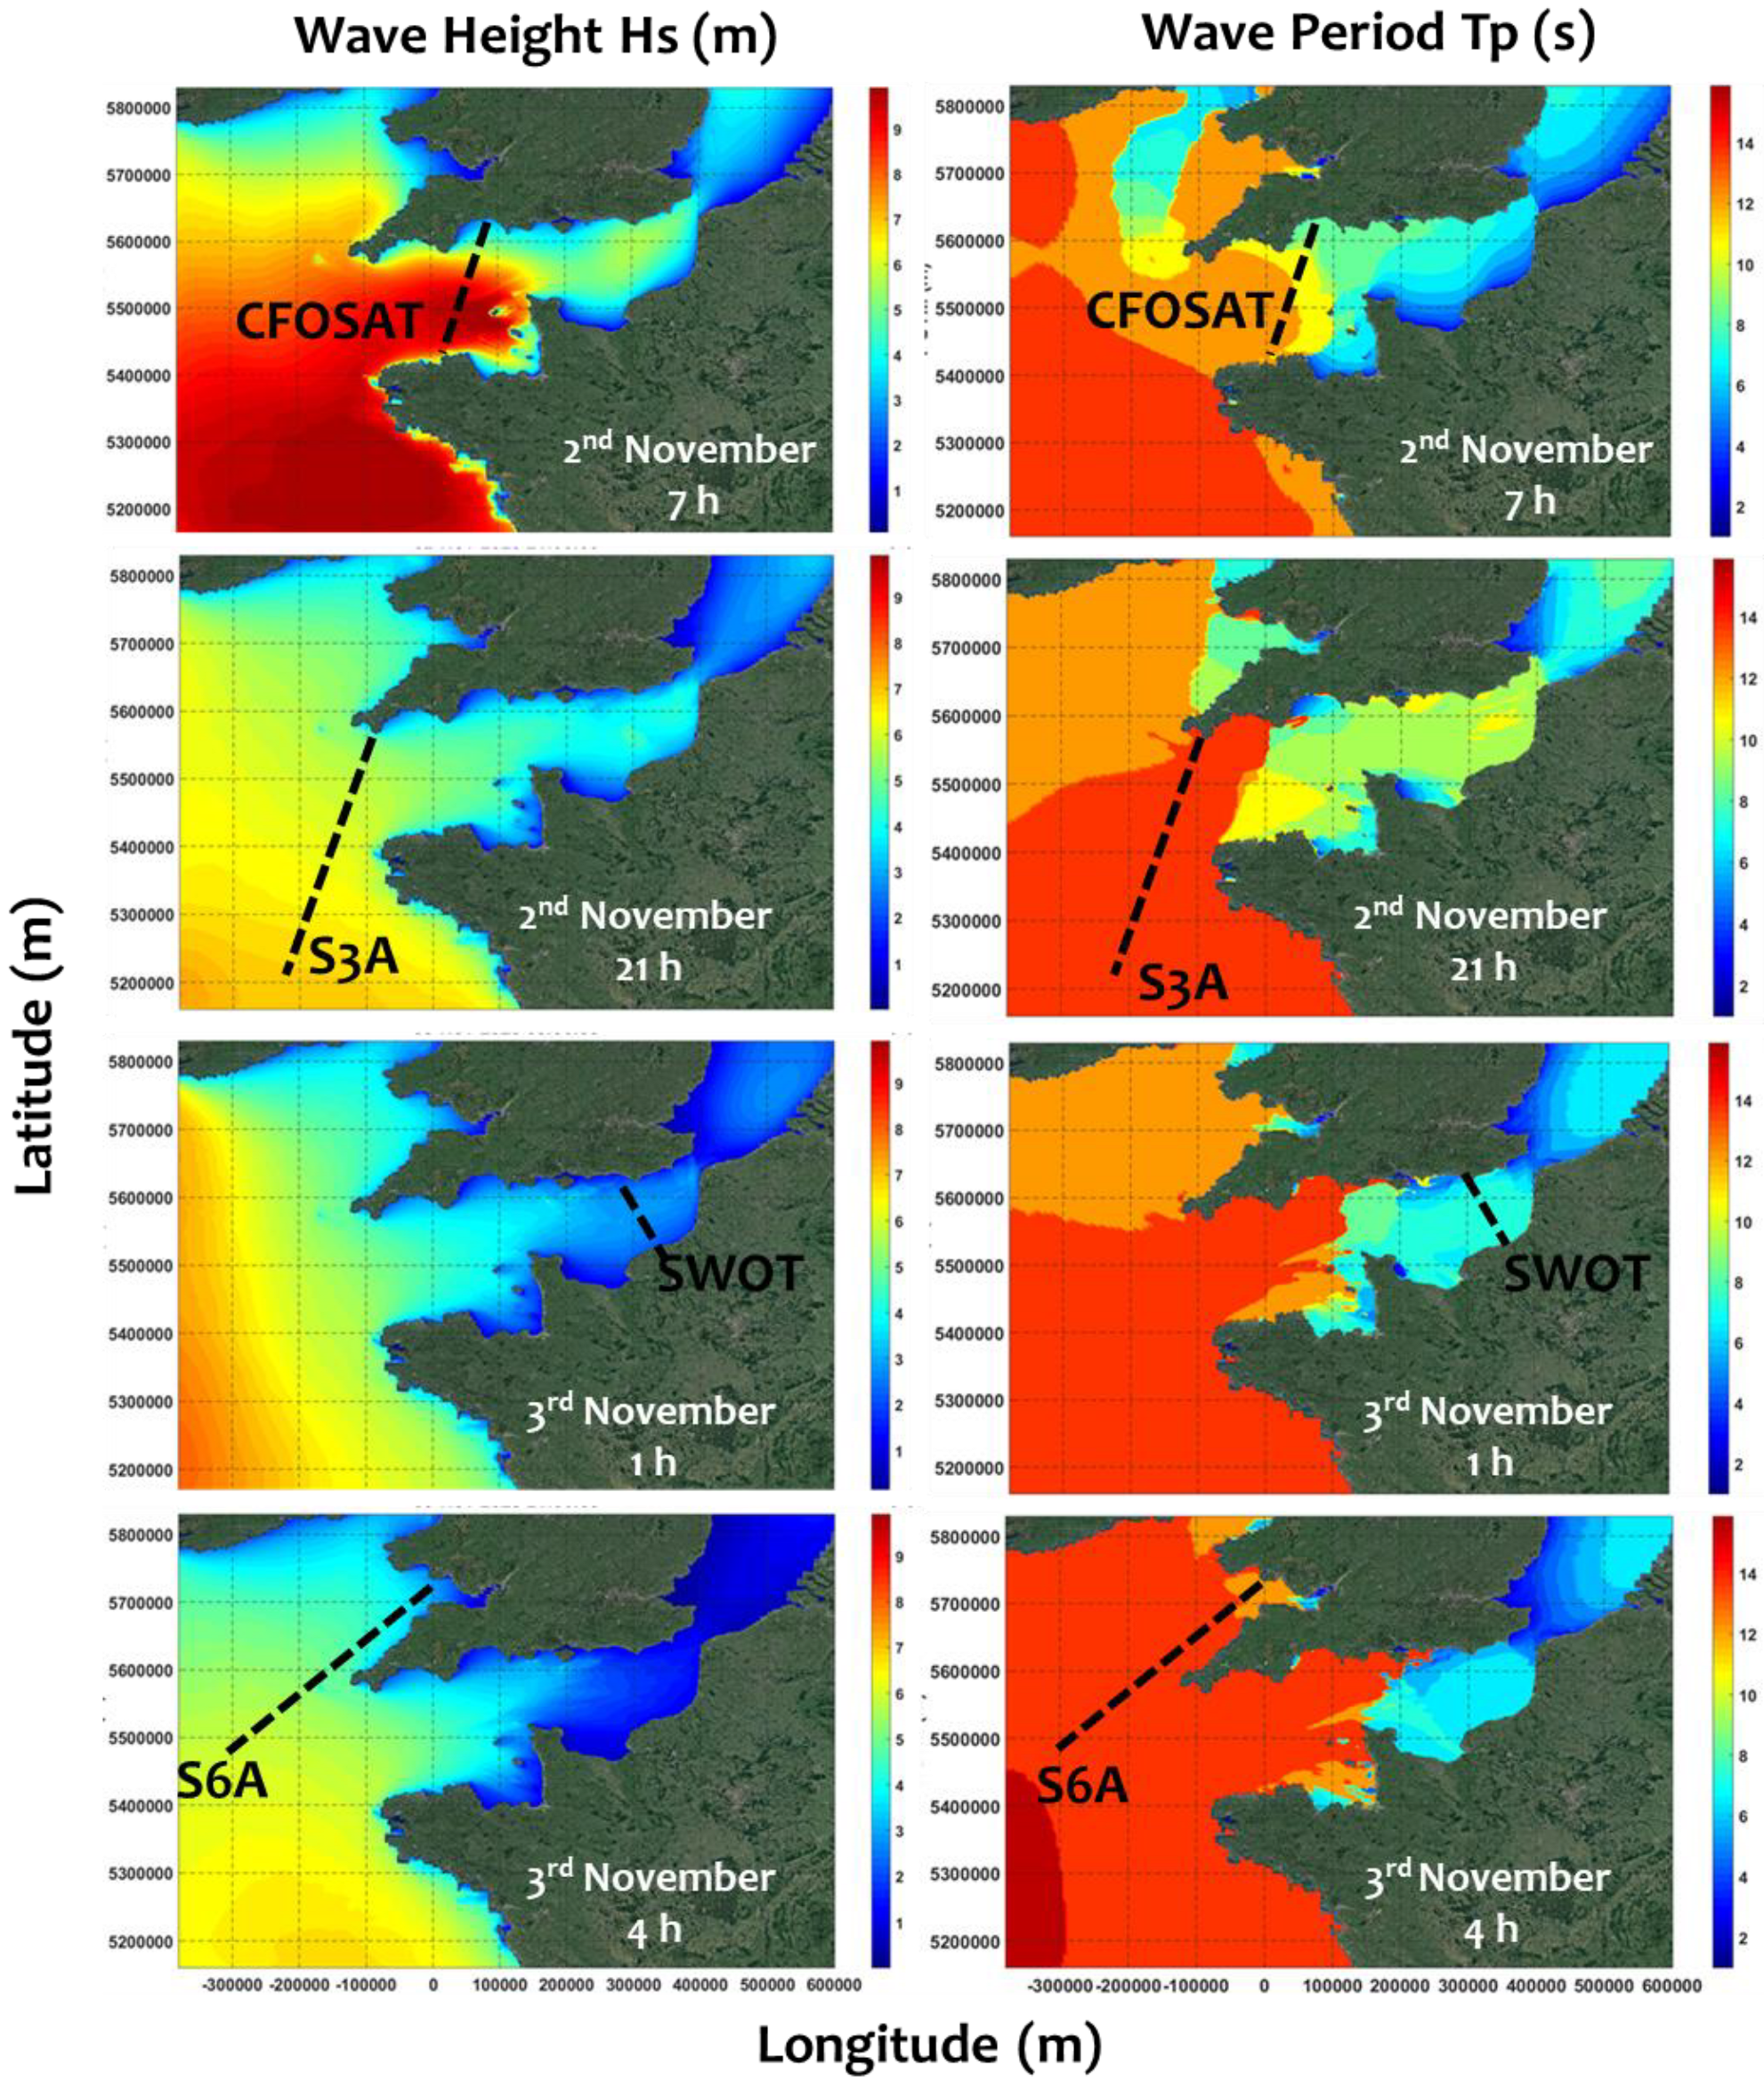
Wave modeling from the Atlantic to the English Channel and adjacent coasts was performed with DELFT3D during Storm Ciaran. Simulated Hs (significant wave height) and Tp (peak period) maps were extracted at the dates and times of the altimeter passes, with track positions shown in
Figure 11. Comparisons between altimeter-derived SWH and wave simulations were performed in time (altimeter pass dates) and space (along tracks). Results show good agreement, with a mean RMSE of 0.25 cm and SD of 0.2 cm. Spectral analyses (CWT,
Figure 9) reveal multiple wave modes (~8–10 s, 10–12 s, 12–14 s, >14 s), which are well reproduced by modeled Tp with RMSE < 1.2 s.
Comparative analysis shows that SWH estimates from CFOSAT and SWOT reproduced over 82% of simulated spatial wave changes along tracks. In shallow waters and near the coast (Seine Bay and Normandy), only SWOT reached higher variances (>87%), declining to ~78% for S3A and S6A. Simulated wave periods were reasonably reproduced by altimetry (>80% agreement), with improved performance from SWOT and CFOSAT nadir.
The multi-source approach provides substantial insight into wave feature changes from the Channel entrance to its center, consistent with numerical modeling (
Figure 11). As noted by [
21,
22], this shift is mainly driven by energy modulation from wave refraction near the seabed, which intensifies during storms with significant reflection between the UK and French coasts.
Previous studies [
21,
22] demonstrated the complexities of the English Channel arising from nonlinear interactions of waves with tidal currents, water level, and storm surges. These processes intensify during storms, producing wave modulation within the basin and energy reflection between the UK and French coasts.
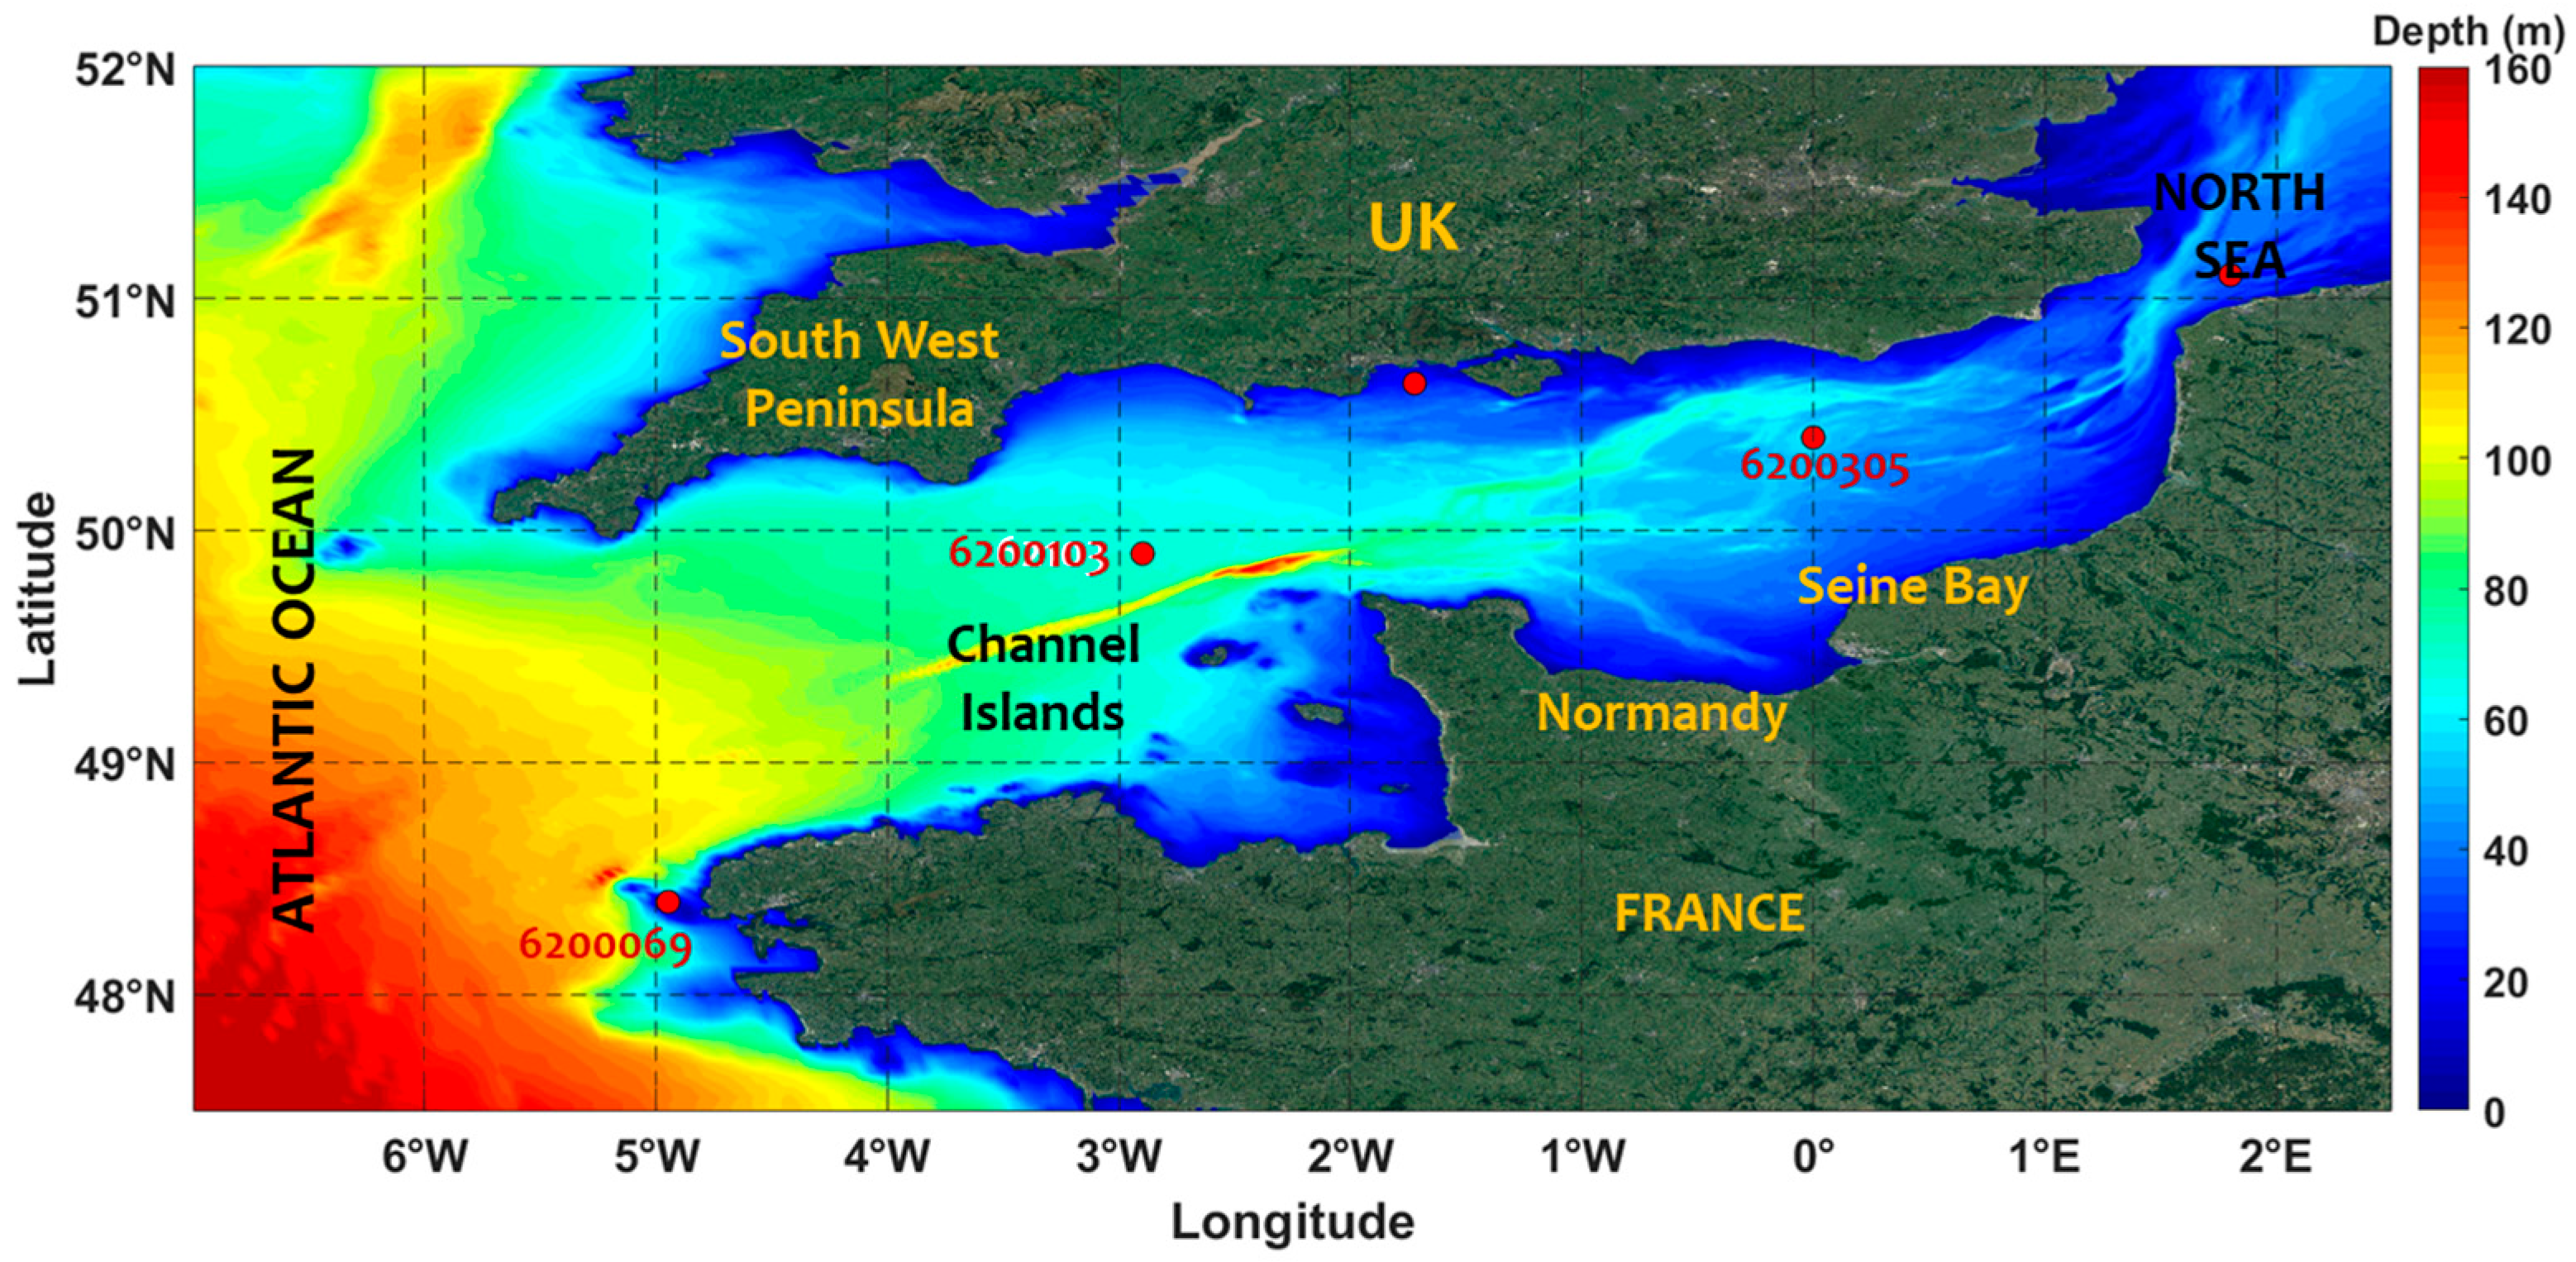
Small-scale wave variability is evident around the Channel Islands in CFOSAT data, reflecting nearshore–coastal interactions. These interactions become nonlinear where wave transformations coincide, especially in complex bathymetry (
Figure 1). S3A data over the Channel entrance (~100–120 m depth) and across the UK island reveal small-scale variability near the coast, with short waves (~6–8 s). At the end of Ciaran, SWOT observed modulated waves with more homogeneous structures (~8–9 s).
Spectral analysis of SWH provides insight into wave features and their bathymetric modulation, clarifying fluctuations in frequency, wave groups, and height gradients. Assessing these features from satellite altimetry is complex and requires retracking techniques [
31]. Identifying dominant frequencies controlling wave fluctuations improves the separation of swell from the total SWH signal, particularly in delay/Doppler altimetry with high burst repetition frequency [
32]. Combined with aliasing effects, common in SAR data, this underscores the need for high-rate along-track sampling to fully capture long waves, including in shallow and coastal areas [
33].
4. Discussion
In this work, a merged multi-source SWH dataset from 10 satellite missions was developed to monitor the evolution of coastal storm waves at a regional scale (English Channel) and a local scale (French and UK coasts), in combination with in situ measurements and numerical simulations [
21,
22]. This integrative approach proves more effective than single-altimeter observations, particularly in complex coastal environments such as the English Channel, where wave energy is strongly reflected between coasts during storms.
Multi-source altimetry effectively maps short-scale wave features from the Atlantic into the English Channel and toward coastal areas, particularly during storms and high-energy periods. It enhances spatial and temporal coverage of SWH variability from nearshore to coastal zones, with S3A/B, S6A, HY-2B/2C, Saral, Jason-3, and CFOSAT contributing to the Seine Bay, and CryoSat-2 to the Channel entrance and near the Channel Islands (UK).
Significant wave heights from five altimeters (CFOSAT, S3A, S3B, S6A, SWOT) were compared with buoy data under time-matching conditions, showing strong agreement with an average correlation of 95%. Discrepancies mainly reflect spatial mismatches, with R2 < 0.9 beyond 50 km, and increase in nearshore and shallow waters.
In fact, nearshore and coastal waves in semi-open basins undergo physical transformations that drive modulation in some zones and dissipation in others, depending on seabed topography and shoreline geometry. These modifications can be highly localized (meters to kilometers), complicating comparisons with buoys which are distant from altimetry tracks (>50 km, as shown here). In addition, buoy-derived wave frequencies must be correlated and aligned with satellite-based SWH to ensure valid comparisons. This requires further investigation, as highlighted by [
34], who corrected buoy SWH using data matching, error statistics, and linear least-squares fitting. Their results showed time-varying corrections consistent with 10 m wind, with an average adjustment of 3.8 m.
Multi-source satellite observations provide broad temporal and spatial coverage, mapping wave energy from the Atlantic into the Channel and North Sea. Depth-resolved SWH time series show ~35% dissipation at 80–65 m, followed by ~10% attenuation at 25–35 m near the Seine Bay. During storms, such as the case of Ciaran, the energy is strongly modulated within the basin (~20–25% from the Channel entrance to its center at ~75 m), with ~36% dissipated near the Seine Bay in the storm’s final stages.
The time evolution of SWH was analyzed via spectral analysis of multi-source altimetry to identify variability across inter-daily to inter-monthly scales. Multi-timescale modes at daily scales, typically associated with storms and high-energy periods, were captured; however, these short-scale signals may also reflect satellite repeat orbits and should be interpreted with caution. During 2023–2024, multi-source altimetry captured three of four major storms (75%), versus at most one detected by individual altimeters. Longer time series (>18 months), such as those combining SWOT with conventional altimeters, are needed for more consistent estimates.
Spatial changes in wave features during Storm Ciaran, one of the most energetic storms in the English Channel (winter 2023–2024), were analyzed using altimetry (CFOSAT, SWOT, S3A, S6A) and DELFT3D simulations. Spectral analysis along the tracks identified waves with periods ~8–10 s, 10–12 s, 12–14 s, and >14 s at different times from the Channel entrance to the coast. SWH from CFOSAT and SWOT reproduced >82% of simulated spatial wave changes, with SWOT exceeding 87% variance in shallow waters compared to ~78% for S3A and S6A. Wave periods were also well captured (>80% agreement), with best performance from SWOT and CFOSAT nadir.
Similar storm-driven wave evolution has been reported in the English Channel [
21,
22], driven by abrupt bathymetric changes and strong winds, such as in Raz Blanchard. SWOT has also revealed short-wavelength features during severe storms in the Indian Ocean (June 2023), attributed to wave-direction fluctuations and nonlinear interactions over shallow topography [
19]. These processes highlight gaps in understanding wave evolution, beyond the scope of this study. Comparable spatial changes in storm surges have been detected in the western Pacific using multi-sensor altimetry and in situ data, showing strong modulation during high-energy events [
5,
35].
The integrative multi-source altimetry approach is valuable for mapping bathymetric influences and assessing fluctuations in wave frequencies, groups, and height gradients—crucial for understanding wave modulation, transformation (e.g., refraction, reflection), and long-wavelength features during storms in semi-enclosed basins. However, capturing long waves can be limited by reduced quality of altimetry-derived parameters due to narrow along-track sampling [
36,
37], with distortions arising when ocean wavelengths approach the delay/Doppler sampling scale [
38]. Developing accurate processing techniques is therefore essential for resolving wave components and their complex interactions, a key challenge in oceanography.
Overall, our results show that multi-source, altimeter-derived wave climate data are more valuable than the sparse spatial coverage of individual altimeters. While single missions can capture hydrodynamic features, combining altimeters greatly improves spatial and temporal coverage, enabling the detection of storm waves in coastal environments with complex bathymetry and nonlinear shallow-water processes [
32]. Accurate exploitation of geophysical patterns and their temporal evolution requires high time-sampling, achievable only through multi-altimeter integration. As individual repeat orbits exceed 10 days, a single track may sample a storm shorter than 24 h only once, but multi-altimeter datasets provide multiple passes for longer storms (>5 days).
Satellite altimeters not only monitor local hydrodynamic features but also provide accurate information on the spatial and temporal evolution of wave dynamics. This integrative approach improves the reliability of numerical wave models during storms and supports real-time operational data assimilation, reducing uncertainties in simulations. Previous studies have highlighted the value of multi-source altimetry [
5,
35,
39,
40]. Over 25 years of multi-source altimetry and coastal tide gauge data have been used to monitor storm surges in China’s coastal regions, demonstrating that combined altimeters account for ~26% of tide-gauge-identified events and capture both extreme signals and surge dynamics [
5]. At the global scale, assimilation of ERS-2 and Jason-1 altimetry into the WAM model improved wave forecasts more effectively with two altimeters than with one [
39]. Similarly, assimilation of SARAL/AltiKa, Jason-2, and Jason-3 using Optimal Interpolation improved wave prediction reliability in the Indian Ocean by ~15%, compared with ~4–6% for wind forecasting [
40]. Long-term impacts have also been assessed as follows: a regional 3D wave model for 1970–2100 under SSP5–8.5, improved with altimetry assimilation, showed the strongest effects of sea-level and wave changes on wide continental shelves and macro-tidal areas, such as Mont-Saint-Michel Bay, France [
35].
