Abstract
Synthetic Aperture Radar (SAR) plays a pivotal role in remote-sensing target detection. However, domain shift caused by distribution discrepancies across sensors, coupled with the scarcity of target-domain samples, severely restricts the generalization and practical performance of SAR detectors. To address these challenges, this paper proposes a few-shot SAR target-detection framework tailored for cross-sensor scenarios (CS-FSDet), enabling efficient transfer of source-domain knowledge to the target domain. First, to mitigate inter-domain feature-distribution mismatch, we introduce a Multi-scale Uncertainty-aware Bayesian Distribution Alignment (MUBDA) strategy. By modeling features as Gaussian distributions with uncertainty and performing dynamic weighting based on uncertainty, MUBDA achieves fine-grained distribution-level alignment of SAR features under different resolutions. Furthermore, we design an Adaptive Cross-domain Interactive Coordinate Attention (ACICA) module that computes cross-domain spatial-attention similarity and learns interaction weights adaptively, thereby suppressing domain-specific interference and enhancing the expressiveness of domain-shared target features. Extensive experiments on two cross-sensor few-shot detection tasks, HRSID→SSDD and SSDD→HRSID, demonstrate that the proposed method consistently surpasses state-of-the-art approaches in mean Average Precision (mAP) under 1-shot to 10-shot settings.
1. Introduction
As an active microwave remote-sensing technology, Synthetic Aperture Radar (SAR) exploits signal processing and aperture synthesis to achieve high-resolution imaging and offers all-weather, all-day, and strong anti-interference observation capabilities [1]. By transmitting and receiving multi-polarization and multi-band electromagnetic waves, SAR is unaffected by illumination and meteorological conditions, efficiently probes surface structures and targets, and produces high-resolution images. SAR image target detection, a core step in SAR data interpretation, has been widely applied in maritime management, military reconnaissance, disaster monitoring, urban planning, and traffic navigation [2,3,4,5,6].
In recent years, ship detection in SAR imagery has become a research focus. Nevertheless, targets such as ships exhibit complex backscattering characteristics and are easily affected by geometric distortion, speckle noise, and background clutter, posing severe challenges for detection. Traditional methods, including Constant False Alarm Rate (CFAR) algorithms [7,8] and texture- or structure-based techniques [9,10], are simple and widely adopted in engineering, yet their limited feature-representation capacity makes it difficult to suppress speckle noise and handle complex backgrounds, resulting in constrained detection performance.
The success of deep learning, especially Convolutional Neural Networks (CNNs), in computer vision has driven innovation in SAR target detection. Two-stage detectors, such as the Region-based Convolutional Neural Networks (R-CNN) family [11,12,13], markedly improve accuracy through region-proposal generation and refined classification–regression, but their performance heavily relies on large-scale annotated data. Influenced by speckle noise and complex backgrounds, they often produce redundant or false proposals, limiting efficiency and generalization. Single-stage detectors, represented by You Only Look Once (YOLO) variants [14,15], directly regress category and location in an end-to-end manner, significantly enhancing efficiency and reducing training and inference costs. Nevertheless, both two-stage and single-stage frameworks depend strongly on annotated source-domain data, whereas annotating SAR images is labor-intensive, hampering real-world deployment, but using simulated, synthetic, or augmented data can improve the situation [16,17,18].
In practice, different SAR detection tasks involve diverse sensors, imaging parameters, and environmental conditions, leading to significant distribution discrepancies between source and target domains. Directly applying a source-trained model to the target domain results in drastic performance degradation, making it imperative to enhance cross-domain generalization.
Traditional domain-adaptation techniques comprise feature-transformation and distribution-alignment approaches. The former maps source and target domains into a unified subspace to reduce distribution gaps, exemplified by Subspace Alignment (SA) [19] and Transfer Component Analysis (TCA) [20]. The latter directly minimizes the distribution distance, such as through Maximum Mean Discrepancy (MMD) [21] and sample-reweighting methods [22]. In addition, several studies have concentrated on super-resolution domain-adaptation techniques [23], which can be grouped into three main categories: Feature-Based, Model-Based, and Semi-Model-Based approaches. Feature-driven methods rely on transformations in feature space; typical implementations include template matching and Bayesian classifiers. Model-driven methods achieve domain transfer through physical modeling, such as scattering-center parameterization. Semi-model-driven methods combine the advantages of the first two by using quasi-invariant local feature modeling. Lane et al. [24] proposed a Bayesian super-resolution algorithm based on Markov chain Monte Carlo that estimates the full posterior probability distribution of a target’s scattering field within a Bayesian framework, thereby quantifying the uncertainty introduced by the super-resolution process and markedly improving classification accuracy in low-resolution scenarios. Shi et al. [25] presented an automatic SAR target-recognition method that integrates a Super-Resolution Generative Adversarial Network (SRGAN) with a Deep Convolutional Neural Network (DCNN); SRGAN first enhances the visual resolution and feature representation of low-resolution images, and DCNN then performs high-accuracy classification, significantly boosting recognition performance under complex conditions.
To overcome these limitations, recent studies have focused on Unsupervised Domain Adaptation (UDA) based on deep learning, which requires no target-domain labels and leverages source-domain annotations for knowledge transfer, thereby enhancing target-domain performance. Current mainstream UDA techniques, including adversarial learning [26,27,28,29,30,31,32,33], self-training with pseudo-labels [34,35,36], and distribution-metric approaches [37,38], have greatly advanced cross-domain detection. However, cross-sensor SAR scenarios exhibit enormous inter-domain gaps due to differing imaging mechanisms, parameter configurations, and background environments. Existing UDA methods still struggle with refined distribution alignment and cross-domain feature representation, leaving domain shift unresolved.
To tackle these challenges, this paper introduces a few-shot SAR target-detection framework for cross-sensor scenarios (CS-FSDet), aiming to enable efficient source-domain knowledge transfer and boost target-domain generalization. The main contributions are as follows.
- We propose a novel cross-sensor few-shot SAR target-detection framework that integrates two innovative modules, MUBDA and ACICA, significantly improving detection under sample scarcity and distribution discrepancy.
- We introduce MUBDA, which models SAR features as posterior Gaussian distributions and employs an MMD loss incorporating multi-scale Gaussian kernels and uncertainty-driven dynamic weighting, achieving fine-grained alignment of source and target distributions across scales and classes and substantially mitigating domain shift.
- We design the ACICA module, which fuses cross-domain attention information by computing spatial-attention similarity and learning interaction weights adaptively, thereby suppressing domain-specific noise and enhancing domain-shared target-feature representation, leading to improved robustness and detection accuracy.
The remainder of this paper is organized as follows. Section 2 provides a detailed overview of related research areas, including few-shot SAR target detection and representative works in cross-domain scenarios. Section 3 formalizes the task definition and systematically describes the overall methodological framework, with a focus on the technical details of the Multi-scale Uncertainty-aware Bayesian Distribution Alignment module (MUBDA) and the Adaptive Cross-Domain Interactive Coordinate Attention module (ACICA). Section 4 presents the complete experimental setup and comparison protocols, followed by a comprehensive analysis and discussion of the experimental results. Finally, Section 5 concludes the paper and discusses possible directions for future research in cross-sensor few-shot SAR target detection.
2. Related Works
2.1. Sar Object Detection
In traditional SAR image target detection, the Constant False Alarm Rate (CFAR) algorithm is widely used because it adaptively adjusts the detection threshold based on local background statistics. Chen et al. [7] proposed an adaptive variable-window CFAR method that employs multi-scale local contrast to adjust the window size according to ship dimensions. Wang et al. [8] introduced an intensity-space (IS) domain transformation that fuses pixel intensity with spatial correlation to build an IS index, thereby enhancing ship-structure contrast. Texture- or structure-based approaches aim to improve target–background separability. Charalampidis et al. [9] transferred fractal-feature computation to wavelet-transformed edge images, effectively reducing the false-alarm rate. Gu et al. [10] devised a two-step azimuth-estimation method that combines the Hough transform with contour matching under a weighted center-line decision criterion. Although these methods improve detection to some extent, they generally lack adaptive modeling of complex SAR scenes and diverse targets, limiting robustness.
Deep-learning methods rely on data-driven feature learning and can automatically extract more discriminative and robust features, thus offering clear advantages in SAR target detection. Jiao et al. [39] designed a densely connected multi-scale network that fuses multi-level features in a top-down manner to generate proposals and employs a hard-example-focusing loss to boost performance. Li et al. [40] created a lightweight Faster R-CNN that uses feature relay amplification and multi-scale skip connections to improve efficiency. Li et al. [41] combined feature fusion, transfer learning, hard-example mining, and optimization techniques to enhance Faster R-CNN for SAR ship detection. Despite their accuracy, two-stage detectors still require large annotated datasets and entail high training costs.
Single-stage detectors such as YOLO attract attention for their end-to-end efficiency and lower data demands. Wang et al. [42] improved YOLOv5s by optimizing input resolution and anchor design and by adding an asymmetric pyramid non-local module with a Sim Attention Mechanism (SimAM), suppressing complex near-shore interference. Li et al. [43] introduced a feature-selection module and rectangular convolution kernels to better detect dense ships and replaced traditional non-maximum suppression with the Confluence algorithm. Yu et al. [44] integrated a coordinate-attention mechanism and a bidirectional feature pyramid network into YOLOv5, greatly enhancing multi-scale fusion and spatial modeling. Recently, YOLO-series detectors have achieved accuracy comparable to or exceeding that of two-stage methods while retaining high speed.
2.2. Cross-Domain SAR Object Detection
In practice, differences in imaging conditions, sensor types, and target properties often introduce significant cross-domain distribution shifts in SAR images, leading to severe performance degradation when a source-trained detector is applied directly to a target domain. Domain adaptation (DA) has therefore become a research focus. Traditional DA methods based on feature transformation or distribution alignment adapt poorly to SAR images and struggle with complex cross-sensor disparities. Neural-network-based DA, with its strong feature-learning and end-to-end optimization capabilities, shows greater potential.
Hu et al. [45] combined CFAR with a memory-augmented autoencoder (MemAE) for weakly supervised ship detection, reducing false alarms and annotation costs. Zheng et al. [46] proposed a dual-teacher collaborative training framework in which cross-domain and SAR semi-supervised tasks are handled by separate teacher–student models, and interactive knowledge distillation improves detection. Liao et al. [47] transferred optical-image knowledge to the SAR domain through a feature-adaptation module and reconstructed unlabeled SAR images with a decoder. Although weakly and semi-supervised methods have advanced performance, they still require some target-domain labels and thus cannot fully satisfy practical needs.
Unsupervised domain adaptation (UDA) aims to bridge the distribution gap between labeled source and unlabeled target domains, greatly enhancing generalization. Current UDA methods for SAR detection fall into three categories:
- Adversarial-learning approaches. Chan et al. [26] proposed a cross-domain adversarial framework that fuses polarimetric features and employs channel-fusion and adversarial modules to enhance representation. Xu et al. [27] introduced a multi-level alignment network that enforces consistency at image, convolutional, and instance levels. Pan et al. [28] used an imbalanced discriminator alignment strategy with differentiated constraints to avoid negative transfer. Chen et al. [29] combined pixel-level translation and feature-level alignment to reduce distribution gaps among heterogeneous SAR images. Yu et al. [30] decreased optical–SAR differences via multi-stage training. Zhao et al. [31] applied vector orthogonalization with adversarial learning to disentangle domain-invariant and domain-specific features. Wu et al. [32] introduced a cross-domain attention mechanism and multi-scale fusion for high-quality optical-to-SAR translation. Liu et al. [33] used source-assisted hierarchical semantic calibration to preserve discriminative features.
- Self-training or pseudo-label methods. Yang et al. [34] developed a self-training framework that balances contributions through cross-domain interaction and optimizes multi-scale features with an improved Cycle-Consistent Adversarial Network with Sigmoid-Constrained Attention (CycleGAN-SCA) and new losses. Zhang et al. [35] separated cross-modal learning from detector training, generating adaptive pseudo-labels before using a multi-teacher model. Zou et al. [36] reduced pseudo-label error accumulation via confidence-guided adaptation and dynamic label filtering.
- Discrepancy-metric approaches. These methods quantify and minimize source-target distribution differences to improve generalization and offer higher training stability. Research in this direction for SAR detection is still limited and demands further exploration. The present study follows this approach and seeks to fill this gap.
3. Materials and Methods
3.1. Overall Architecture
To systematically address inter-domain feature discrepancies in cross-sensor SAR target detection—stemming from differences in resolution, noise distribution, and imaging conditions—we propose an end-to-end few-shot SAR detection framework. Its core innovations are the Multi-scale Uncertainty-aware Bayesian Distribution Alignment module (MUBDA) and the Adaptive Cross-domain Interactive Coordinate Attention module (ACICA). As shown in Figure 1, the workflow comprises the following key stages.
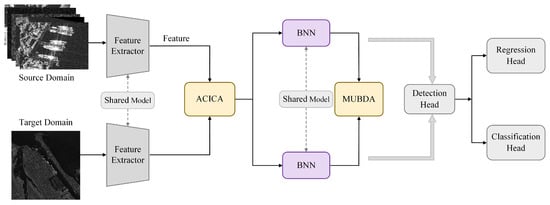
Figure 1.
Schematic illustration of the proposed end-to-end cross-sensor few-shot SAR target detection framework.
First, SAR images from the source and target domains are fed into a parameter-shared feature extractor, yielding multi-scale features in a unified representation space. To capture predictive uncertainty and achieve joint alignment of mean and covariance distribution structures, the features pass through a Bayesian Neural Network (BNN) that represents each spatial location as a Gaussian posterior with mean and covariance, facilitating downstream distribution alignment.
For feature-level alignment, the MUBDA module employs multi-scale, multi-bandwidth kernel fusion and entropy-based uncertainty weighting to finely calibrate source and target feature distributions under varying resolutions, noise intensities, and class conditions, thereby reducing cross-domain shift. In parallel, the ACICA module introduces cross-domain spatial-attention similarity and adaptive interaction-weight learning, explicitly enhancing domain-shared feature representation while suppressing domain-specific interference.
The cross-domain fused features output by these two modules are forwarded to a detection head, where a regression branch and a classification branch perform bounding-box localization and category prediction, respectively, achieving end-to-end cross-domain SAR target detection. The feature extractor and BNN parameters are shared between source and target domains, maximizing the exploitation of domain-shared information and improving generalization.
In summary, the proposed architecture integrates dynamic distribution alignment (MUBDA) with explicit attention-based interaction (ACICA) to resolve inter-domain distribution inconsistencies at their source, enabling efficient and robust cross-sensor SAR target detection.
The architecture jointly leverages shared feature extraction and Bayesian uncertainty modeling for both source and target domains. The integration of the MUBDA and ACICA modules enables dynamic probabilistic alignment and interactive attention fusion, respectively. These enhanced features are passed to unified detection heads for precise localization and classification, effectively bridging cross-domain discrepancies under diverse sensor conditions.
3.2. Multi-Scale Uncertainty-Aware Bayesian Distribution Alignment
To address the significant shifts in scale and noise distribution between high-resolution source domain and low-resolution target domain SAR images, this paper proposes a resolution-adaptive Bayesian uncertainty-weighted distribution alignment method (MUBDA). As shown in Figure 2, this approach integrates several innovative mechanisms, including Bayesian neural network posterior distribution modeling, mean-covariance adaptive kernel alignment, multi-kernel fusion strategy, uncertainty-based dynamic weighting, and multi-scale category-conditioned alignment. Together, these modules enable fine-grained calibration of distribution shifts between the source and target domains at the feature level, providing a solid theoretical foundation and practical support for improved cross-domain SAR target detection.
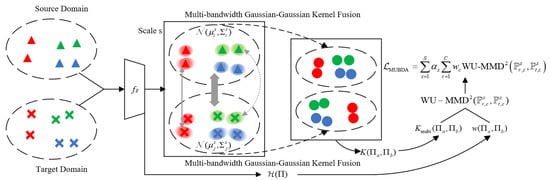
Figure 2.
Visualization of the MUBDA computation process. Samples of the same color across domains indicate identical class labels. A flatter ellipse signifies a larger covariance, whereas a lighter ellipse color denotes higher uncertainty, such as at object boundaries and in noise regions. The thick gray arrow represents the large-bandwidth kernel responsible for global distribution alignment, the thin gray arrow represents the medium-bandwidth kernel responsible for class-level alignment, and the gray dashed arrow represents the small-bandwidth kernel responsible for local detail alignment.
3.2.1. Posterior Distribution Retrieval for Bayesian Neural Networks
First, to quantify the model’s predictive uncertainty at each spatial location, we use a Bayesian neural network (BNN) to explicitly model the posterior distribution of features as a Gaussian. Specifically, let the shared feature extraction backbone be denoted as . For an input image x, at the s-th level of the feature pyramid network (FPN) and spatial position (or detection box index) i, the network outputs the corresponding posterior Gaussian distribution parameters as follows:
where is the mean vector of the latent feature at that position, and is the corresponding covariance matrix. This posterior distribution not only provides an expectation representation for the feature but, more importantly, captures the model’s predictive uncertainty at this position through , which can be quantified by the entropy:
3.2.2. Mean-Covariance Adaptive Distribution Alignment Kernel
To align both the means and uncertainties in the feature distribution space, we further introduce a closed-form Gaussian–Gaussian kernel that fuses mean and covariance information:
where is a numerical stability term, and and represent two Gaussian distributions. This kernel function is equivalent to an exponential mapping of the Mahalanobis distance defined by the parameters and of the two Gaussians, and the determinant term adaptively adjusts the uncertainty weighting, reflecting the “volume” of the fused distribution and balancing coverage and difference.
3.2.3. Multi-Kernel Fusion Strategy
Furthermore, considering the significant variations in noise and texture scales of SAR images at different resolutions, a single fixed-bandwidth kernel cannot accommodate diverse scale differences. Therefore, this paper proposes a multi-bandwidth kernel fusion strategy with adaptive bandwidths and weights, allowing dynamic coverage of a broader range of scale shifts. Specifically, the multi-kernel fusion kernel is expressed as
where is the Gaussian–Gaussian kernel with bandwidth , and . Unlike traditional approaches, both the bandwidths and the weights in this paper are adaptively learned in an end-to-end manner. For each kernel component m, the bandwidth is generated by feeding the statistical features (such as global mean, variance, maximum, entropy, etc.) of the corresponding scale into a lightweight neural network (such as an Multilayer Perceptron), followed by a softplus activation to ensure positivity:
where is a learnable mapping function, , and is the feature tensor at the m-th scale, where GAP is the Global Average Pooling. At the same time, the weights for each kernel are obtained by applying a softmax normalization to a set of learnable parameters :
3.2.4. Uncertainty-Driven Dynamic Weighting
In addition, considering that high-noise regions or object boundaries in SAR images often exhibit higher uncertainty, assigning equal weights to all regions during alignment may introduce errors. To address this, for any pair of Gaussian distributions , we design an inverse entropy-based dynamic weighting mechanism to suppress the influence of high-uncertainty regions during alignment:
where is the entropy of the Gaussian distribution, and controls the attenuation strength of entropy on the weight. This design assigns smaller weights to distributions with higher uncertainty, thereby enhancing the robustness of alignment.
3.2.5. Dual-Domain Independent Coordinate Attention Feature Extraction
To further improve domain adaptation precision, MUBDA aligns distributions across multiple feature scales and target categories. Let the set of posterior Gaussians for the source domain at scale s and category c be , and the set for the target domain be . The weighted uncertainty maximum mean discrepancy (WU-MMD) is then defined as:
where , , and .
To account for differences across scales and categories, we further introduce scale weights and category weights and define the final distribution alignment loss function as
where denotes the importance of the s-th scale, typically set to or determined by cross-validation. can be set according to sample frequency or the inverse of average uncertainty to balance the contribution of each category. By combining multi-scale and category-aware adaptive weighting strategies, this method enables precise calibration of the feature distribution shift between the source and target domains. When approaches zero, it indicates that the posterior Gaussian distributions (including both means and uncertainties) of the source and target domains have been well aligned across all scales and categories. Moreover, the cross-domain generalization ability of the MUBDA method under few-shot conditions is reinforced by three cooperative mechanisms. First, its core lies in using a Bayesian Neural Network to model features as Gaussian distributions, explicitly aligning the means and covariances of source- and target-domain features. Compared with conventional approaches that align only means, this higher-order distribution alignment captures the overall structure and uncertainty of feature distributions more completely, making effective use of source-domain statistics to fill distribution gaps when target-domain samples are extremely scarce. Second, MUBDA introduces a multi-scale, multi-bandwidth fusion mechanism designed to accommodate statistical differences in resolution, scale, and class among cross-domain data. By covering global, class-level, and local-detail statistics, this mechanism greatly alleviates the “extremely sparse distribution statistics” problem caused by a lack of target-domain samples, thereby avoiding feature mismatches and information loss and enhancing the generality of domain alignment. Finally, by means of an uncertainty-aware dynamic weighting strategy (Equation (7)), the model automatically assigns lower loss weights to high-noise, high-entropy samples according to the entropy of their Gaussian distributions. This strategy suppresses the ineffective transfer of noise and errors when target-domain annotations are sparse, ensuring robust model training. Together, these higher-order distribution-modeling and uncertainty-driven adaptive-alignment components improve the robustness and generalization of few-shot cross-domain detection. To facilitate understanding, the overall procedure of the proposed Multi-scale Uncertainty-aware Bayesian Distribution Alignment is summarized in Algorithm 1.
| Algorithm 1 Multi-scale Uncertainty-aware Bayesian Distribution Alignment (MUBDA) |
|
3.3. Adaptive Cross-Domain Interactive Coordinate Attention
Given that SAR images acquired from different sensors exhibit substantial cross-domain feature shifts due to inherent differences in imaging conditions such as operating frequency, polarization, and spatial resolution, we propose an Adaptive Cross-Domain Interactive Coordinate Attention (ACICA) module to significantly improve the generalization performance of cross-domain SAR target detection models. As shown in Figure 3, building upon the traditional coordinate attention mechanism, this module introduces cross-domain spatial attention similarity calculation and adaptive interaction weight learning, thereby enabling explicit feature interaction between the source and target domains, suppressing domain-specific interference, enhancing the expression of domain-shared target features, and ultimately improving the accuracy and robustness of cross-domain detection.
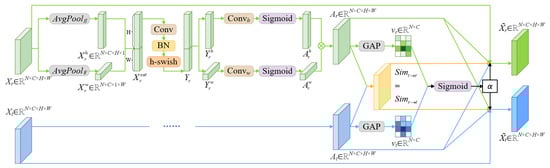
Figure 3.
Architecture of ACICA Module.
3.3.1. Dual-Domain Independent Coordinate Attention Feature Extraction
Specifically, for the source domain feature and the target domain feature , spatial coordinate attention is independently applied to extract spatial attention features for both domains. Taking the source domain as an example, the feature is subjected to adaptive average pooling along the height (H) and width (W) dimensions to obtain
where and denote the features pooled along the height and width, respectively. These are then concatenated along the spatial dimension to form
This concatenated feature is passed through convolution, batch normalization, and an h-swish activation function for nonlinear feature transformation, resulting in
where h-swish [48] is the activation function. The transformed feature is then split again and normalized by the Sigmoid function to obtain height and width attention weights:
Finally, the attention weights along height and width are fused to yield the spatial coordinate attention map for the source domain:
The extraction of the target domain attention feature follows the same procedure.
3.3.2. Cross-Domain Spatial Attention Similarity Computation
To quantify and utilize the spatial correlation between domain attention features, we further compute the pixel-wise cosine similarity of spatial attention between source and target domains. For spatial location , the similarity is defined as
Similarly, the similarity from target to source, , is equivalent. In implementation, these similarity measures are extended to match the feature dimension, i.e., .
3.3.3. Cross-Domain Interaction Parameter
To achieve adaptive adjustment of interaction weights, we employ a data-driven strategy to determine the cross-domain interaction parameter . First, global average pooling is performed on the spatial attention maps and for the source and target domains, yielding global attention descriptors:
These global attention descriptors are concatenated and input into a multilayer perceptron (such as a convolution or fully connected layer), followed by a Sigmoid activation to yield the interaction strength , allowing dynamic adjustment based on the inter-domain feature relationship:
3.3.4. Cross-Domain Attention Interaction Fusion Strategy
Finally, integrating the above features, we obtain the enhanced source and target domain feature representations. The enhanced source domain feature is
where ⊙ denotes element-wise multiplication. This fusion strategy preserves the spatial structure of the original features while introducing cross-domain attention interaction, thereby achieving feature enhancement and semantic alignment. This significantly improves the generalization and detection accuracy of the model in cross-domain SAR target detection tasks. Under few-shot conditions, the ACICA module further alleviates the lack of spatial-semantic representation caused by scarce target-domain annotations through adaptive fusion of cross-domain spatial-attention information. Its operation consists of two main stages. (i) Adaptive interaction of attention features: the cosine similarity of spatial coordinate attention between the source and target domains is computed at each spatial location to enable interaction and initial alignment of cross-domain spatial structures; the dynamically generated interaction weight (Equation (20)) then adjusts the supplementation strength of source-domain information to the target domain on the basis of the spatial-feature differences in the current batch. (ii) Feature enhancement and fusion (Equation (22)): target-domain features explicitly incorporate the similarity-weighted source-domain spatial attention, allowing effective transfer of spatial-structure information and thus compensating for incomplete spatial-semantic representation due to sparse annotations in the target domain. Through this efficient cross-domain transfer of spatial-structure information, ACICA markedly improves feature-transfer effectiveness under few-shot conditions.
4. Experiments
To evaluate the effectiveness of the proposed method, we conducted extensive experiments. This section first describes the datasets, implementation details, and evaluation metric, then compares our approach with state-of-the-art (SOTA) methods, and finally validates its components through ablation studies.
4.1. Datasets
Two datasets acquired by different sensors—SAR Ship Detection Dataset (SSDD) [41] and High Resolution SAR Images Dataset (HRSID) [49]—were selected. Both datasets contain only a single target category, and their annotation labels are uniformly designated as “ship”. Because of the significant distribution gap between them, they form a challenging cross-sensor benchmark. Representative images are shown in Figure 4.
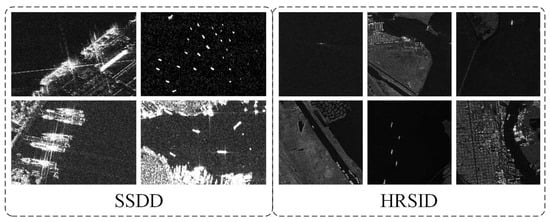
Figure 4.
Some images were selected from SSDD datasets and HRSID datasets.
4.1.1. SSDD
SSDD is specifically designed for detecting small ship targets in SAR imagery. It was collected mainly from three spaceborne SAR sensors—Radarsat-2, TerraSAR-X, and Sentinel-1—and contains four polarization channels (HH, VV, VH, and HV). The dataset consists of 1160 SAR images with spatial resolutions ranging from 1 m to 15 m. A total of 2456 ship instances are annotated, covering isolated small vessels with weak features and densely distributed ship clusters with mutual occlusion. These characteristics pose a severe challenge to the feature-extraction capability of detectors. The dataset is divided at a ratio of 8:2 into a training set of 928 images and a test set of 232 images.
4.1.2. HRSID
HRSID is a high-resolution SAR ship-detection dataset containing 5604 images, all acquired by Sentinel-1B, TerraSAR-X, and TanDEM-X satellites. Each image has a fixed size of 800 × 800 pixels and covers typical maritime scenes such as ports, canals, and open seas. Targets show small average size, wide size variation, and dense spatial distribution, while the images exhibit strong scattering noise, various sea clutter, and complex background interference. These factors impose high requirements on multi-scale target perception and robustness in complex environments. For training and evaluation, 1100 images were randomly selected and split into 65% for training and 35% for testing.
4.2. Implementation Details
The An asymmetric adaptation paradigm for few-shot domain adaptive object detection (AsyFOD) [50] model was adopted as the baseline network. All experiments were conducted on the same software and hardware platform: the Linux operating system and the PyTorch 1.12.1 deep-learning framework; hardware included eight NVIDIA GeForce RTX 4090 GPUs (24 GB each) and a 13th-generation Intel Core i5-13600KF CPU. AdamW was used as the optimizer with an initial learning rate of 0.01, a momentum factor of 0.937, and a weight-decay coefficient of 0.0005. Each model was trained for 100 epochs with a batch size of 64. For fairness, no pretrained weights or data-augmentation techniques were employed.
4.3. Evaluation Metric
Mean Average Precision (mAP) was used to assess detector performance. It is defined as the arithmetic mean of the areas under the precision–recall (P–R) curves over all classes and is computed as
where P I have ensured that all variables and values in the equation follow the same format. denotes the ratio of correctly predicted positive samples to all positive predictions, and R measures the proportion of actual positives that are correctly retrieved. They are calculated as
with TP being true positives (correctly detected ships) and FP being false positives (background regions incorrectly identified as ships). A prediction is counted as TP if the Intersection-over-Union (IoU) between the predicted and ground-truth bounding boxes is at least 0.5; otherwise, it is counted as FP. FN denotes false negatives, namely, the number of actual positives that the model fails to detect.
4.4. Comparisons with State-of-the-Art Methods
To validate the effectiveness of the proposed method under the dual challenges of cross-sensor variation and limited samples, two domain-adaptation SAR target-detection tasks were constructed:
- HRSID→SSDD: HRSID as the source domain and SSDD as the target domain.
- SSDD→HRSID: SSDD as the source domain and HRSID as the target domain.
With full bounding-box and category annotations available in the source domain and only scarce annotations in the target domain, we performed comprehensive comparisons with five SOTA cross-domain detectors—Hierarchical Transferability Calibration Network (HTCN) [51], Semi-supervised domain adaptive YOLO (SSDA-YOLO) [52], An adaptive method for cross-domain few-shot object detection (AcroFOD) [53], AsyFOD [50], and A benchmark for cross-domain few-shot object detection (CD-FSOD) [54]. All methods were evaluated on the same target-domain test sets.
4.4.1. HRSID→SSDD
Extensive experiments were conducted on the HRSID→SSDD task to tackle the combined challenges of cross-sensor differences and data scarcity. The results show that our method maintains a stable performance advantage across all shot settings.
As shown in Table 1, in the most challenging 1-shot scenario, our method achieves an mAP of 67.55%, outperforming the runner-up AsyFOD (64.77%) by 2.78%. This confirms its superior initial learning and generalization ability under extreme sample scarcity. The advantage persists in the more practically relevant 5-shot and 10-shot settings: the 5-shot mAP reaches 73.96%, exceeding the runner-up CD-FSOD (71.21%) by 2.75%, while the 10-shot mAP attains 76.69%, 2.03% higher than AsyFOD (74.66%). For the 2-shot and 3-shot settings, our method also surpasses CD-FSOD by 2.46% and 1.27%, respectively. Moreover, under the 20-shot setting, our method also outperforms the runner-up (AsyFOD) by 2.96%. These results demonstrate strong robustness across different quantities of target-domain training samples and confirm that the proposed method effectively addresses both cross-sensor discrepancies and few-shot learning challenges.

Table 1.
mAP comparison with SOTA methods on the HRSID→SSDD task. Best results are shown in bold. K-shot denotes K annotated samples per class in the target domain (i.e., “per-class” setting), and the reported mAP results are averaged over multiple random samplings.
To highlight the superiority of our approach, detection results under the 5-shot setting are visualized in Figure 5. In the second row, the image contains 11 small vessels in an open-sea scene; only our method correctly detects all targets. In the fifth row, with a complex port background featuring dense container stacks and cranes, only our method achieves zero false positives and zero missed detections. In the fourth row, where ships overlap and occlude one another, our method detects more targets than all competitors. In the canal scene of the third row, our method identifies two ships with significantly higher confidence than other approaches. These observations confirm the outstanding performance of our method under the combined challenges of cross-sensor variation and limited samples.
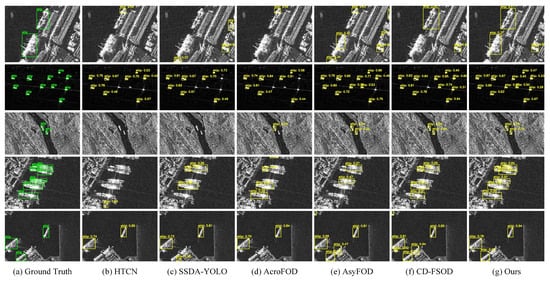
Figure 5.
Qualitative comparison under the 5-shot setting: proposed method vs. SOTA models on the HRSID→SSDD task.
4.4.2. SSDD→HRSID
To further assess generalization in cross-sensor and data-scarce scenarios, we built the SSDD→HRSID task, where HRSID contains smaller average ship sizes than SSDD. Systematic experiments were conducted, and the results are presented in Table 2 and illustrated in Figure 6.
Table 2.
mAP comparison with SOTA methods on the SSDD→HRSID task. Best results are shown in bold. K-shot denotes K annotated samples per class in the target domain (i.e., “per-class”setting), and the reported mAP results are averaged over multiple random samplings.
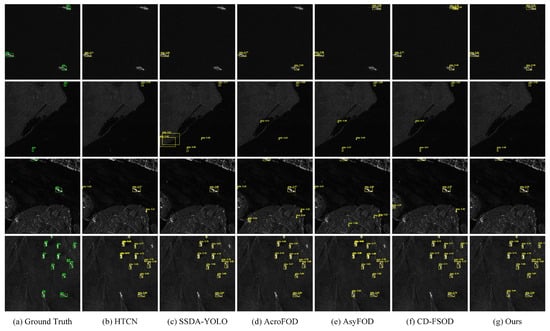
Figure 6.
Qualitative comparison under the 5-shot setting: proposed method vs. SOTA models on the SSDD→HRSID task.
Table 2 shows that our method excels in the 1-shot setting, surpassing the runner-up by 2.05%. The mAP steadily improves as the shot number increases, indicating efficient exploitation of additional samples. Across all shot settings, our method maintains a 1.26–2.17% lead over the closest competitor, once again verifying its effectiveness in mitigating domain shift and enhancing few-shot generalization.
Figure 6 visualizes 5-shot detection results. In the first-row open-sea image, HTCN, SSDA-YOLO, AcroFOD, and AsyFOD miss targets, while CD-FSOD splits one ship into two false detections; our method detects all ships without error. In the near-shore images of the second and third rows, high background-target similarity severely interferes with the SOTA models, causing missed or false detections, whereas our method remains error-free. The fourth-row image contains 12 densely packed, variably oriented small ships; all competing models miss some targets, but our method correctly detects every ship.
Overall, the proposed method demonstrates superior feature-extraction capability and interference suppression, shows stronger robustness to target-scale variation and complex backgrounds, and delivers markedly better comprehensive performance than the SOTA models.
4.5. Ablation Studies
To verify the effectiveness of MUBDA and ACICA in addressing the dual challenges of cross-sensor variation and limited samples, we conducted ablation experiments using AsyFOD as the baseline under different shot settings.
4.5.1. HRSID→SSDD
Table 3.
Ablation results on HRSID→SSDD adaptation; best values are in bold.
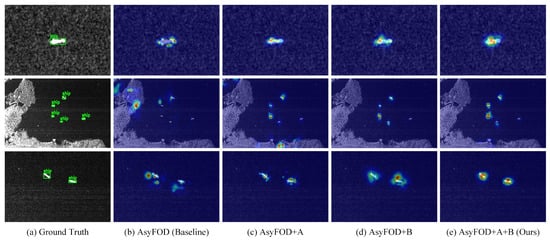
Figure 7.
Visualization of ablation results under the 5-shot setting for HRSID→SSDD. A: MUBDA; B: ACICA. Darker colors indicate stronger model attention to regional features.
Across all shot settings, both modules consistently improve performance. The smallest gain appears in the 10-shot scenario (mAP = 2.03%). The greatest improvement occurs in the 5-shot setting (mAP = 5.82%): the condition number of the covariance matrix in MUBDA drops sharply, stabilizing distribution estimation, while the signal-to-noise ratio of ACICA’s cross-domain attention similarity rises markedly, enhancing semantic-alignment reliability. Notably, the combined effect of the two modules yields super-additive gains in every shot setting. For example, in the 5-shot case, the individual improvements of MUBDA and ACICA are mAP = 1.32% and mAP = 1.99%, respectively, whereas their joint improvement reaches = 5.82%, far exceeding the theoretical additive gain of 3.31%. This confirms a fundamental synergy between the modules.
Under the 5-shot setting, qualitative comparisons further validate the modules. In the first and third rows of Figure 7, AsyFOD’s salient regions focus on speckle-noise areas, whereas adding either module corrects this bias, with MUBDA performing better, confirming its strong alignment capability. In the second row, AsyFOD misallocates attention to noise and ship-like background, but ACICA substantially alleviates this problem, demonstrating powerful interference suppression. The combined use of MUBDA and ACICA precisely concentrates salient regions on true ship areas, outperforming both the baseline and the individual modules, and evidencing their synergy. These findings show that MUBDA and ACICA effectively tackle few-shot challenges and mitigate cross-domain shifts caused by different sensors.
4.5.2. SSDD→HRSID
To further assess generalization under cross-sensor variation and data scarcity, especially for small-vessel detection, we performed ablation experiments on the SSDD→HRSID task. Results are provided in Table 4 and Figure 8.
Table 4.
Ablation results on SSDD→HRSID adaptation; best values are in bold.
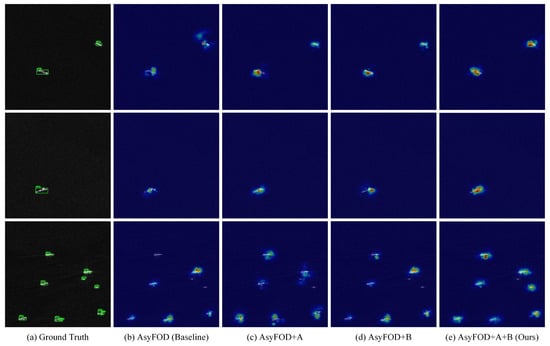
Figure 8.
Visualization of ablation results under the 5-shot setting for SSDD→HRSID. A: MUBDA; B: ACICA. Darker colors indicate stronger model attention to regional features.
From the 1-shot to 20-shot settings, both modules raise mAP: MUBDA by 0.26%–1.02% and ACICA by 0.72%–1.33%. When applied together, the improvement increases to 1.26%–2.33%.
In Figure 8, the baseline’s salient regions in the second image of the first row are misaligned relative to the two ship targets, whereas adding MUBDA or ACICA redirects attention to the correct areas. In the first- and second-row images, salient regions broaden and overlap the hulls more closely as each module is added, reaching maximum coverage in the full method (e). This shows that MUBDA and ACICA guide the model to focus on true target areas, with their combined effect surpassing either alone. In the third row, the baseline fails to attend to a ship at the top; MUBDA or ACICA increases attention to that target, and the full method (e) achieves the highest response. These results confirm the proposed method’s superior detection capability for small vessels under cross-sensor and data-scarce conditions.
4.6. Hyperparameter Analysis
In Equations (5) and (19), the hyper-parameters and are set empirically: mitigates the adverse impact of high-uncertainty regions on distribution alignment, whereas controls the strength with which target-domain attention is fused into source-domain features. To evaluate their sensitivity, we carried out exhaustive ablation experiments under the 5-shot setting for the HRSID→SSDD and SSDD→HRSID tasks, testing the grid [0.1,1.0] and [0.1,5.0]. The resulting mAP scores are listed in Table 5 and Table 6. Using the experimental defaults = 0.5 and = 1, the proposed method achieves the best performance on both tasks—73.96% (HRSID→SSDD) and 66.86% (SSDD→HRSID).
Table 5.
mAP on HRSID→SSDD for different – combinations. Best values are in bold.
Table 6.
mAP on SSDD→HRSID for different – combinations. Best values are in bold.
5. Discussion
Although the proposed CS-FSDet method demonstrates a marked performance advantage in cross-sensor few-shot SAR target detection, several scientific phenomena and engineering challenges merit further investigation.
First, the MUBDA module leverages Bayesian uncertainty modeling and multi-scale kernel fusion to refine feature-distribution alignment, effectively mitigating cross-domain shifts induced by sample scarcity and resolution discrepancies. Nonetheless, the experimental results show that model stability and robustness remain vulnerable under extreme data imbalance or when noise levels greatly exceed those of typical scenes. This finding suggests that, in practical applications, an alignment mechanism based solely on a Gaussian assumption may not fully capture the more complex distribution structures of the target domain, indicating a need for more universally applicable distribution-modeling strategies.
Second, the ACICA module enhances features through explicit spatial-attention interaction; however, when the imaging mechanisms of the source and target domains differ substantially, the effectiveness of spatial-structure transfer diminishes. In several test cases, detection performance for densely occluded or very small targets still has room for improvement, implying that the current attention-interaction mechanism requires stronger generalization in complex structural scenes. It is also notable that the two modules yield synergistic gains in most scenarios, yet the theoretical limits and underlying mechanisms of their interaction have not been fully revealed. Future work should probe their cooperative dynamics through theoretical analyses and interpretability studies.
From an application standpoint, all experiments in this study employ idealized cross-domain few-shot settings and do not account for factors common in real SAR imagery, such as anomalous samples, open-set target categories, or extreme variations in imaging conditions. Furthermore, data acquisition and annotation costs continue to constrain progress in the SAR field. Although the proposed method performs well under very limited data, reducing dependence on manual annotation in extremely low-label or label-free environments remains an important avenue for future exploration.
6. Conclusions
This study proposes a few-shot SAR target-detection framework for cross-sensor scenarios (CS-FSDet) to counteract the severe performance degradation that occurs when models are transferred across sensors with scarce target-domain data. The key contributions are as follows:
- We introduce the Multi-scale Uncertainty-aware Bayesian Distribution Alignment (MUBDA) method, which fuses multi-scale features, class information, and uncertainty weighting to align feature distributions between high-resolution source data and low-resolution target data.
- We design the Adaptive Cross-domain Interactive Coordinate Attention (ACICA) module, which explicitly models source–target relationships via spatial-attention similarity and an adaptive interaction mechanism, thereby suppressing inter-domain discrepancies and enhancing shared features.
- The synergy between MUBDA and ACICA markedly improves cross-domain knowledge transfer efficiency.
On the HRSID→SSDD and SSDD→HRSID tasks, the proposed method consistently outperforms state-of-the-art approaches by 1.27%–2.78% and 1.26%–2.17% mAP, respectively, across all shot settings. In particular, under the 5-shot HRSID→SSDD setting, our method raises the mAP of the baseline AsyFOD by 5.82%. These results strongly validate the effectiveness of the proposed approach.
Although our framework enhances cross-sensor few-shot SAR detection, it still faces limitations in open-set scenarios. Future work will focus on alleviating the representation gap for unseen classes under cross-sensor domain shift to further improve generalization and robustness in open-set target detection.
Author Contributions
Conceptualization, C.L.; methodology, C.L.; software, C.L. and Z.D.; validation, C.L., Y.H., X.Z. and Y.W.; formal analysis, C.L.; investigation, C.L.; resources, C.L.; data curation, C.L.; writing—original draft preparation, C.L.; writing—review and editing, Y.H. and H.H.; visualization, C.L.; supervision, H.H.; funding acquisition, H.H. All authors have read and agreed to the published version of the manuscript.
Funding
This research was funded in part by the National Natural Science Foundation of China under Grant 62171329.
Data Availability Statement
The HRSID and SSDD datasets used in this study are open datasets.
Conflicts of Interest
The authors declare no conflicts of interest.
References
- Meng, L.; Yan, C.; Lv, S.; Sun, H.; Xue, S.; Li, Q.; Zhou, L.; Edwing, D.; Edwing, K.; Geng, X.; et al. Synthetic aperture radar for geosciences. Rev. Geophys. 2024, 62, e2023RG000821. [Google Scholar] [CrossRef]
- Zhu, X.X.; Montazeri, S.; Ali, M.; Hua, Y.; Wang, Y.; Mou, L.; Shi, Y.; Xu, F.; Bamler, R. Deep learning meets SAR: Concepts, models, pitfalls, and perspectives. IEEE Geosci. Remote Sens. Mag. 2021, 9, 143–172. [Google Scholar] [CrossRef]
- Mondini, A.C.; Guzzetti, F.; Chang, K.T.; Monserrat, O.; Martha, T.R.; Manconi, A. Landslide failures detection and mapping using Synthetic Aperture Radar: Past, present and future. Earth Sci. Rev. 2021, 216, 103574. [Google Scholar] [CrossRef]
- Zhao, S.; Zhang, Y.; Luo, Y.; Kang, Y.; Wang, H. Dynamically self-training open set domain adaptation classification method for heterogeneous SAR image. IEEE Geosci. Remote Sens. Lett. 2024, 21, 4003705. [Google Scholar] [CrossRef]
- Zheng, J.; Li, M.; Chen, H.; Zhang, P.; Wu, Y. Deep Fourier-based task-aware metric network for few-shot SAR target classification. IEEE Trans. Instrum. Meas. 2025, 74, 5502314. [Google Scholar] [CrossRef]
- Jeong, S.; Kim, Y.; Kim, S.; Sohn, K. Enriching SAR ship detection via multistage domain alignment. IEEE Geosci. Remote Sens. Lett. 2021, 19, 4018905. [Google Scholar] [CrossRef]
- Chen, S.; Li, X. A new CFAR algorithm based on variable window for ship target detection in SAR images. Signal Image Video Process. 2019, 13, 779–786. [Google Scholar] [CrossRef]
- Wang, C.; Bi, F.; Zhang, W.; Chen, L. An intensity-space domain CFAR method for ship detection in HR SAR images. IEEE Geosci. Remote Sens. Lett. 2017, 14, 529–533. [Google Scholar] [CrossRef]
- Charalampidis, D.; Stein, G.W. Target detection based on multiresolution fractal analysis. In Proceedings of the Signal Processing, Sensor Fusion, and Target Recognition XVI, New Orleans, LA, USA, 9–11 April 2007; SPIE: Bellingham, WA, USA, 2007; Volume 6567, pp. 512–519. [Google Scholar]
- Gu, D.; Xu, X. Multi-feature extraction of ships from SAR images. In Proceedings of the 2013 6th International Congress on Image and Signal Processing (CISP), Hangzhou, China, 16–18 December 2013; Volume 1, pp. 454–458. [Google Scholar]
- Girshick, R. Fast r-cnn. In Proceedings of the IEEE International Conference on Computer Vision, Santiago, Chile, 7–13 December 2015; pp. 1440–1448. [Google Scholar]
- Ren, S.; He, K.; Girshick, R.; Sun, J. Faster r-cnn: Towards real-time object detection with region proposal networks. In Proceedings of the NIPS’15: 29th International Conference on Neural Information Processing Systems, Montreal, QC, Canada, 7–12 December 2015. [Google Scholar]
- He, K.; Gkioxari, G.; Dollár, P.; Girshick, R. Mask r-cnn. In Proceedings of the IEEE International Conference on Computer Vision, Venice, Italy, 22–29 October 2017; pp. 2961–2969. [Google Scholar]
- Redmon, J.; Farhadi, A. YOLO9000: Better, faster, stronger. In Proceedings of the IEEE Conference on Computer Vision and Pattern Recognition, Honolulu, HI, USA, 21–26 July 2017; pp. 7263–7271. [Google Scholar]
- Ge, Z.; Liu, S.; Wang, F.; Li, Z.; Sun, J. Yolox: Exceeding yolo series in 2021. arXiv 2021, arXiv:2107.08430. [Google Scholar] [CrossRef]
- Huang, Z.; Zhang, X.; Tang, Z.; Xu, F.; Datcu, M.; Han, J. Generative artificial intelligence meets synthetic aperture radar: A survey. IEEE Geosci. Remote Sens. Mag. 2024, 2–44. [Google Scholar] [CrossRef]
- Lane, R.O.; Holmes, W.J.; Lamont-Smith, T. Target recognition in diverse synthetic aperture radar image datasets with low size weight and power processing hardware. IET Radar Sonar Navig. 2024, 18, 2066–2076. [Google Scholar] [CrossRef]
- Slesinski, J.; Wierzbicki, D. Review of Synthetic Aperture Radar Automatic Target Recognition: A Dual Perspective on Classical and Deep Learning Techniques. IEEE J. Sel. Top. Appl. Earth Obs. Remote Sens. 2025, 18, 18978–19024. [Google Scholar] [CrossRef]
- Fernando, B.; Habrard, A.; Sebban, M.; Tuytelaars, T. Unsupervised visual domain adaptation using subspace alignment. In Proceedings of the IEEE International Conference on Computer Vision, Sydney, NSW, Australia, 1–8 December 2013; pp. 2960–2967. [Google Scholar]
- Pan, S.J.; Tsang, I.W.; Kwok, J.T.; Yang, Q. Domain adaptation via transfer component analysis. IEEE Trans. Neural Netw. 2010, 22, 199–210. [Google Scholar] [CrossRef]
- Gretton, A.; Borgwardt, K.M.; Rasch, M.J.; Schölkopf, B.; Smola, A. A kernel two-sample test. J. Mach. Learn. Res. 2012, 13, 723–773. [Google Scholar]
- Cortes, C.; Mansour, Y.; Mohri, M. Learning bounds for importance weighting. Adv. Neural Inf. Process. Syst. 2010, 23, 442–450. [Google Scholar]
- El-Darymli, K.; Gill, E.W.; Mcguire, P.; Power, D.; Moloney, C. Automatic target recognition in synthetic aperture radar imagery: A state-of-the-art review. IEEE Access 2016, 4, 6014–6058. [Google Scholar] [CrossRef]
- Lane, R.O. Bayesian super-resolution with application to radar target recognition. Ph.D. Thesis, University College London, London, UK, 2008. [Google Scholar]
- Shi, X.; Zhou, F.; Yang, S.; Zhang, Z.; Su, T. Automatic target recognition for synthetic aperture radar images based on super-resolution generative adversarial network and deep convolutional neural network. Remote Sens. 2019, 11, 135. [Google Scholar] [CrossRef]
- Chan, H.; Qiu, X.; Gao, X.; Lu, D. A complex background SAR ship target detection method based on fusion tensor and cross-domain adversarial learning. Remote Sens. 2024, 16, 3492. [Google Scholar] [CrossRef]
- Xu, C.; Zheng, X.; Lu, X. Multi-level alignment network for cross-domain ship detection. Remote Sens. 2022, 14, 2389. [Google Scholar] [CrossRef]
- Pan, B.; Xu, Z.; Shi, T.; Li, T.; Shi, Z. An imbalanced discriminant alignment approach for domain adaptive SAR ship detection. IEEE Trans. Geosci. Remote Sens. 2023, 61, 5108111. [Google Scholar] [CrossRef]
- Chen, Z.; Zhao, L.; He, Q.; Kuang, G. Pixel-level and feature-level domain adaptation for heterogeneous SAR target recognition. IEEE Geosci. Remote Sens. Lett. 2022, 19, 4515205. [Google Scholar] [CrossRef]
- Yu, W.; Li, J.; Wang, Z.; Yu, Z. Boosting SAR Aircraft Detection Performance with Multi-Stage Domain Adaptation Training. Remote Sens. 2023, 15, 4614. [Google Scholar] [CrossRef]
- Zhao, S.; Luo, Y.; Zhang, T.; Guo, W.; Zhang, Z. A feature decomposition-based method for automatic ship detection crossing different satellite SAR images. IEEE Trans. Geosci. Remote Sens. 2022, 60, 5234015. [Google Scholar] [CrossRef]
- Wu, B.; Wang, H.; Zhang, C.; Chen, J. Optical-to-SAR Translation Based on CDA-GAN for High-Quality Training Sample Generation for Ship Detection in SAR Amplitude Images. Remote Sens. 2024, 16, 3001. [Google Scholar] [CrossRef]
- Liu, S.; Li, D.; Wan, J.; Zheng, C.; Su, J.; Liu, H.; Zhu, H. Source-assisted hierarchical semantic calibration method for ship detection across different satellite SAR images. IEEE Trans. Geosci. Remote Sens. 2024, 62, 5215221. [Google Scholar] [CrossRef]
- Yang, Y.; Chen, J.; Sun, L.; Zhou, Z.; Huang, Z.; Wu, B. Unsupervised domain-adaptive SAR ship detection based on cross-domain feature interaction and data contribution balance. Remote Sens. 2024, 16, 420. [Google Scholar] [CrossRef]
- Zhang, R.; Wang, Y.; Li, H.; Huang, P.; Yang, W. Decoupled Multi-Teacher: Cross-Modal Learning Enhanced Object Detection in SAR Imagery. In Proceedings of the IGARSS 2024-2024 IEEE International Geoscience and Remote Sensing Symposium, Athens, Greece, 7–12 July 2024; pp. 7858–7862. [Google Scholar]
- Zou, B.; Qin, J.; Zhang, L. Cross-scene target detection based on feature adaptation and uncertainty-aware pseudo-label learning for high resolution SAR images. ISPRS J. Photogramm. Remote Sens. 2023, 200, 173–190. [Google Scholar] [CrossRef]
- He, Q.; Zhao, L.; Ji, K.; Kuang, G. SAR target recognition based on task-driven domain adaptation using simulated data. IEEE Geosci. Remote Sens. Lett. 2021, 19, 4019205. [Google Scholar] [CrossRef]
- Zhang, C.; Wang, Y.; Liu, H.; Sun, Y.; Wang, S. VSFA: Visual and scattering topological feature fusion and alignment network for unsupervised domain adaptation in SAR target recognition. IEEE Trans. Geosci. Remote Sens. 2023, 61, 5216920. [Google Scholar] [CrossRef]
- Jiao, J.; Zhang, Y.; Sun, H.; Yang, X.; Gao, X.; Hong, W.; Fu, K.; Sun, X. A densely connected end-to-end neural network for multiscale and multiscene SAR ship detection. IEEE Access 2018, 6, 20881–20892. [Google Scholar] [CrossRef]
- Li, Y.; Zhang, S.; Wang, W.Q. A lightweight faster R-CNN for ship detection in SAR images. IEEE Geosci. Remote Sens. Lett. 2020, 19, 4006105. [Google Scholar] [CrossRef]
- Li, J.; Qu, C.; Shao, J. Ship detection in SAR images based on an improved faster R-CNN. In Proceedings of the 2017 SAR in Big Data Era: Models, Methods and Applications (BIGSARDATA), Beijing, China, 13–14 November 2017; pp. 1–6. [Google Scholar]
- Wang, Z.; Hou, G.; Xin, Z.; Liao, G.; Huang, P.; Tai, Y. Detection of SAR image multiscale ship targets in complex inshore scenes based on improved YOLOv5. IEEE J. Sel. Top. Appl. Earth Obs. Remote Sens. 2024, 17, 5804–5823. [Google Scholar] [CrossRef]
- Li, Y.; Zhu, W.; Li, C.; Zeng, C. SAR image near-shore ship target detection method in complex background. Int. J. Remote Sens. 2023, 44, 924–952. [Google Scholar] [CrossRef]
- Yu, C.; Shin, Y. SAR ship detection based on improved YOLOv5 and BiFPN. ICT Express 2024, 10, 28–33. [Google Scholar] [CrossRef]
- Hu, Y.; Li, Y.; Pan, Z. A dual-polarimetric SAR ship detection dataset and a memory-augmented autoencoder-based detection method. Sensors 2021, 21, 8478. [Google Scholar] [CrossRef] [PubMed]
- Zheng, X.; Cui, H.; Xu, C.; Lu, X. Dual teacher: A semisupervised cotraining framework for cross-domain ship detection. IEEE Trans. Geosci. Remote Sens. 2023, 61, 5613312. [Google Scholar] [CrossRef]
- Liao, L. Semi-Supervised SAR Target Detection with Cross-Domain Transfer Learning Based on YOLOv5. In Proceedings of the IGARSS 2024-2024 IEEE International Geoscience and Remote Sensing Symposium, Athens, Greece, 7–12 July 2024; pp. 7401–7404. [Google Scholar]
- Howard, A.; Sandler, M.; Chu, G.; Chen, L.C.; Chen, B.; Tan, M.; Wang, W.; Zhu, Y.; Pang, R.; Vasudevan, V.; et al. Searching for mobilenetv3. In Proceedings of the IEEE/CVF International Conference on Computer Vision, Seoul, Republic of Korea, 7 October–2 November 2019; pp. 1314–1324. [Google Scholar]
- Wei, S.; Zeng, X.; Qu, Q.; Wang, M.; Su, H.; Shi, J. HRSID: A high-resolution SAR images dataset for ship detection and instance segmentation. IEEE Access 2020, 8, 120234–120254. [Google Scholar] [CrossRef]
- Gao, Y.; Lin, K.Y.; Yan, J.; Wang, Y.; Zheng, W.S. Asyfod: An asymmetric adaptation paradigm for few-shot domain adaptive object detection. In Proceedings of the IEEE/CVF Conference on Computer Vision and Pattern Recognition, Vancouver, BC, Canada, 17–24 June 2023; pp. 3261–3271. [Google Scholar]
- Chen, C.; Zheng, Z.; Ding, X.; Huang, Y.; Dou, Q. Harmonizing transferability and discriminability for adapting object detectors. In Proceedings of the IEEE/CVF Conference on Computer Vision and Pattern Recognition, Seattle, WA, USA, 13–19 June 2020; pp. 8869–8878. [Google Scholar]
- Zhou, H.; Jiang, F.; Lu, H. SSDA-YOLO: Semi-supervised domain adaptive YOLO for cross-domain object detection. Comput. Vis. Image Underst. 2023, 229, 103649. [Google Scholar] [CrossRef]
- Gao, Y.; Yang, L.; Huang, Y.; Xie, S.; Li, S.; Zheng, W.S. Acrofod: An adaptive method for cross-domain few-shot object detection. In Proceedings of the European Conference on Computer Vision, Tel Aviv, Israel, 23–27 October 2022; pp. 673–690. [Google Scholar]
- Xiong, W. CD-FSOD: A benchmark for cross-domain few-shot object detection. In Proceedings of the ICASSP 2023-2023 IEEE International Conference on Acoustics, Speech and Signal Processing (ICASSP), Rhodes, Greece, 4–10 June 2023; pp. 1–5. [Google Scholar]
Disclaimer/Publisher’s Note: The statements, opinions and data contained in all publications are solely those of the individual author(s) and contributor(s) and not of MDPI and/or the editor(s). MDPI and/or the editor(s) disclaim responsibility for any injury to people or property resulting from any ideas, methods, instructions or products referred to in the content. |
© 2025 by the authors. Licensee MDPI, Basel, Switzerland. This article is an open access article distributed under the terms and conditions of the Creative Commons Attribution (CC BY) license (https://creativecommons.org/licenses/by/4.0/).