Abstract
Most existing cloud base height (CBH) retrieval algorithms are only applicable for daytime satellite observations due to their dependence on visible observations. This study presents a novel algorithm to retrieve day and night CBH using infrared observations of the geostationary Advanced Himawari Imager (AHI). The algorithm is featured by integrating deep learning techniques with a physical model. The algorithm first utilizes a convolutional neural network-based model to extract cloud top height (CTH) and cloud water path (CWP) from the AHI infrared observations. Then, a physical model is introduced to relate cloud geometric thickness (CGT) to CWP by constructing a look-up table of effective cloud water content (ECWC). Thus, the CBH can be obtained by subtracting CGT from CTH. The results demonstrate good agreement between our AHI CBH retrievals and the spaceborne active remote sensing measurements, with a mean bias of −0.14 ± 1.26 km for CloudSat-CALIPSO observations at daytime and −0.35 ± 1.84 km for EarthCARE measurements at nighttime. Additional validation against ground-based millimeter wave cloud radar (MMCR) measurements further confirms the effectiveness and reliability of the proposed algorithm across varying atmospheric conditions and temporal scales.
1. Introduction
Accurate characterization of cloud base height (CBH) information is essential for cloud parameterization in climate models, which depend on precise observations to simulate atmospheric processes effectively [1]. Additionally, CBH is an important parameter in the radiative balance of the Earth-atmosphere system [2]. Viúdez-Mora et al. [3] demonstrated that a 100-m deviation in CBH can lead to an error of 1.5 W m−2 in downward longwave radiation measurements. Furthermore, CBH is also a critical parameter for ensuring aviation safety because of its value in identifying potential icing hazards and strong convection [4]. Therefore, accurate and continuous CBH measurements are critical for both atmospheric studies and aviation applications.
Satellite remote sensing has become a powerful tool for obtaining global cloud properties. There are various methods for estimating CBH from satellite radiometric observations [5,6]. Hutchison et al. [5] presented a classical CBH retrieval method that classifies clouds into six types, assumes empirical cloud microphysical properties for each type, calculates cloud geometric thickness (CGT) based on these properties, and estimates CBH as the difference between cloud top height (CTH) and CGT. This method was adopted to produce the operational CBH product of the Visible Infrared Imaging Radiometer (VIIRS) onboard the Suomi-National Polar-Orbiting Partnership (SNPP) satellite and the Joint Polar Satellite System (JPSS) [6], making a milestone as one of the first CBH products derived from passive satellite observations. However, there are significant spatial and temporal variations in the microphysical characteristics of clouds in the atmosphere, leading to a large root-mean-square error of 3.7 km for all clouds globally in the CBH estimates derived from the empirical assumptions based on cloud type [7]. Thus, Noh et al. [6] developed a statistical algorithm that utilized a piecewise fitting method to relate CGT with cloud water path (CWP) under varying cloud vertical distribution conditions. The algorithm demonstrated improvement of their CBH retrieval accuracy over the method proposed by Hutchison et al. [5], and thus was adopted to produce the new version of the CBH product of VIIRS. More recently, Tan et al. [8] established the relationship between CWP and CGT via a systematic look-up table (LUT) of effective cloud water content (ECWC). With the ECWC LUT constrained by different cloud properties and environmental conditions (e.g., latitude, surface type, and season), the algorithm achieved high accuracy in CBH retrievals with a mean bias of −0.12 ± 2.34 km for Advanced Himawari Imager (AHI) in single-layer cloud cases. To conclude, these methods have demonstrated the feasibility of retrieving CBH from space using upstream cloud property products (e.g., CTH and CWP) as main inputs. However, current CWP products are typically derived from the observations in visible and near-infrared channels, making the retrieval of CBH at night very challenging. Therefore, a large room exists for further improvement on continuous satellite remote sensing of nighttime CBH.
In recent years, a couple of deep learning (DL) techniques have been introduced into cloud remote sensing studies [9,10,11]. In particular, by capturing the spatial features, Wang et al. [10] developed a convolutional neural network (CNN)-based model to quantify accurate cloud optical and microphysical properties with diurnal continuity from the Moderate Resolution Imaging Spectroradiometer (MODIS) infrared observations. Since the CBH retrieval algorithm proposed by Tan et al. [8] can be performed as well as valid CTH and CWP retrievals are available, the advances in retrieving cloud optical and microphysical properties from satellite infrared observations can provide new possibilities for exploring CBH retrievals in both day and night satellite observations. However, it remains unclear how to combine the physical and deep learning models and whether CBH can be effectively inferred using only infrared observations from geostationary satellites.
To retrieve CBH diurnally from geostationary satellite infrared observations, we propose a hybrid algorithm that synergistically combines deep learning and a physical model. Within this framework, a CNN-based model is first employed to retrieve CTH and CWP from satellite infrared radiances. Subsequently, these intermediate cloud products serve as inputs to the physically based model, which estimates CBH by utilizing an effective cloud water content (ECWC) look-up table (LUT). Finally, the retrieved CBH is validated against active measurements from both space-borne and ground-based cloud radars. The remainder of the paper is organized as follows. Section 2 describes the dataset used in this study and the development of the CBH retrieval algorithm. Section 3 presents the results, and Section 4 provides the discussion. The conclusion and future perspectives are provided in Section 5.
2. Materials and Methods
2.1. Data Source
The AHI aboard the geostationary Himawari-8/9 satellite in geostationary orbit can provide visible, near-infrared, and infrared observations in 16 spectral channels with high spatial and temporal resolutions. Since the objective of this study is to perform continuous remote sensing of CBH, the algorithm is developed based on the infrared observations of the AHI L1 gridded data with a spatial resolution of 5 km. While attenuation of cloud base signals by optically thick clouds poses challenges for imagers, infrared spectral bands retain considerable capability to derive various cloud parameters [12,13,14]. Notably, the solar-independent nature of thermal infrared measurements enables continuous cloud base height estimation throughout diurnal cycles. Therefore, the infrared brightness temperatures in band 8–16 (centering wavelength from 6.2 to 13.3 μm) and satellite zenith angle (SAZ) from AHI L1 gridded data are used as input features to capture the diurnal variation of clouds [15,16].
MODIS, a multispectral imager aboard the Aqua and Terra satellites, observes the Earth at a lower orbit (approximately 705 km). MODIS has 36 visible, near-infrared, and infrared channels, and Terra MODIS collection 6.1 MOD06 products can provide accurate cloud properties with high temporal resolution of 5 min and high spatial resolutions of 5 km for cloud top properties and 1 km for cloud optical properties. It has been demonstrated that MOD06/MYD06 (derived from Aqua MODIS) cloud products have high accuracies in cloud remote sensing retrievals [17,18]. Therefore, CTH and CWP from MOD06 products are used as labels to establish the CNN model for retrieving cloud optical and microphysical properties [19].
The Cloud Profiling Radar (CPR, 94 GHz) on the CloudSat and the Cloud–Aerosol Lidar with Orthogonal Polarization (CALIOP, 532 nm) on the Cloud-Aerosol Lidar and Infrared Pathfinder Satellite Observations (CALIPSOs) operating at distinct wavelengths, enables a comprehensive characterization of cloud vertical profiles through their merged 2B-GEOPROF-LIDAR products [20,21,22]. Therefore, the CGT provided by 2B-GEOPROF-LIDAR will be used for the development of the physical model as well as for algorithm validation. However, due to the battery anomaly in 2011, CloudSat-CPR was limited to daytime conditions, which significantly affected its nighttime observing capability [6].
Launched on 28 May 2024, the Earth Cloud, Aerosol, and Radiation Explorer (EarthCARE) operates in a sun-synchronous orbit (393 km) and carries two active sensors (cloud profiling radar (CPR) and atmospheric lidar (ATLID)) and two passive instruments (multispectral imager and broadband radiometer) [23]. The CPR onboard EarthCARE, with a larger antenna and lower orbit, provided about 7 dBZ higher sensitivity than CloudSat-CPR and is much better at detecting vertical cloud structures [24,25]. Specifically, we used the EarthCARE-CPR Level 2A products CPR_TC_2A (version AC) [26] to validate the accuracy of the retrieved AHI CBH in diurnal cycles. In addition, the measurements from four ground-based Ka-band millimeter-wave radar (MMCR) stations are used to evaluate the performance of our AHI CBH retrievals in diurnal cycles [27]. Details of the instruments and data are provided in Table 1.

Table 1.
The data comparison from various sources.
2.2. Data Preprocessing
Spatial downscaling was first applied to align 1 km MODIS CWP data with 5 km MODIS CTH datasets, and then the AHI observations were collocated with the CTH and CWP retrievals derived from the MOD06 products through spatial and temporal matching. Since the MOD06 CWP retrieval algorithm relies on visible spectrum measurements, only daytime infrared channel observations were selected to ensure physical consistency. Therefore, the collocated AHI-MODIS datasets during different years are used to generate the training (4707 samples from 2016), validation (496 samples from 2018 at 10-day intervals), and testing datasets (524 samples from 2017 and 765 samples from 2022 at 10-day intervals for comparison with CloudSat-CALIPSO, while 336 samples from 2025 for comparison with EarthCARE), respectively. To facilitate fast convergence during training, input features were normalized to the [0, 1] range via min-max transformation (Equation (1)), where and denote the minimum and maximum values observed in the training dataset, respectively. To handle missing values in the MODIS data, we implemented a two-step preprocessing strategy. First, all not-a-number (NaN) values were replaced with a placeholder value of −1, which is critical to ensure numerical stability while preventing NaN propagation during the forward and backward passes of the CNN. The value of −1 was specifically chosen because it lies outside the [0, 1] range of our min-max normalized data. Second, to ensure the model learned only from valid physical measurements, these placeholder locations were masked out and excluded from the loss function calculation during training.
Subsequently, the normalized training, validation, and testing subsets were generated through a patch sampling approach. The data were divided into 128 × 128-pixel patches with an overlap of 4 pixels between adjacent patches, generating 55,635 training subsets and 5922 validation subsets. This patch sampling approach can improve computational efficiency without reducing data features [28]. The summary of the datasets used in this study is presented in Table 2.

Table 2.
The datasets used in this study.
The 2B-GEOPROF-LIDAR products provided by CloudSat-CALIPSO contain cloud vertical boundary information on five layers and served as the foundational dataset for constructing the ECWC LUT. The AHI-retrieved pixels were spatially co-registered with CloudSat-CALIPSO cloud profiles within 2 km ranges and temporally aligned with a 10 min window, which generated 143,019 and 40,320 valid collocated pixels through 2017 and 2022, respectively. In addition, the EarthCARE-CPR provides 1771 cloud profiles during the period 14–31 March 2025.
2.3. Methods
The CBH retrieval algorithm proposed in this study is a two-stage hybrid approach that integrates DL with a physical model. First, we employ a CNN model, trained with MODIS cloud products as labels, to retrieve CTH and CWP from the AHI full-disk infrared observations. Second, we establish a physical ECWC LUT from CloudSat-CALIPSO-detected cloud profiles, which maps the relationship between the CNN-derived AHI (CTH, CWP) pairs and CGT. By synergizing the CNN and the LUT, the algorithm ultimately estimates the target CBH in diurnal cycles from AHI infrared observations.
2.3.1. Deep Learning Model
Figure 1 shows a schematic flowchart of the CBH retrieval algorithm. First, the collocated and preprocessed AHI-MODIS subsets from 2016 and 2018 are fed into a CNN model for training and validation, with the infrared brightness temperature (BT) and SAZ derived from AHI as inputs and CTH and CWP derived from Terra MODIS as labels, which is shown in Figure 1a,b. The CNN model, composed of an encoding-decoding architecture, has shown powerful ability in the cloud remote sensing community [10]. In the encoding part, convolutional filters extract key features from the input data. In the decoding stage, features from the shallow and deep layers are integrated by skip connections, and the final output is generated by a 1 × 1 convolutional layer. The number of features in the encoder path progresses through 32, 64, 128, and finally 256 at the bottleneck, while the decoder path mirrors this structure symmetrically, with the channel count progressively halving from 256 back down to 32. In order to find an optimal retrieval model, we determined the final values through an iterative tuning process, where different configurations were evaluated based on the performance of the validation set, including loss function (e.g., mean square error, mean absolute error), learning rate (e.g., from 0.0001 to 0.001), activation function (e.g., ReLU, LeakyReLU, and sigmoid), and convolutional kernel size (e.g., 3, 5, and 7). Specifically, the final model employs the mean square error as a loss function, a learning rate of 0.001, the LeakyReLU activation function, and a convolutional kernel size of 3 × 3. Additionally, to mitigate overfitting, we employed several regularization techniques. Specifically, we incorporated dropout layers and L2 regularization with a weight decay of 0.001. Furthermore, we utilized an early-stopping strategy, which terminated the training process when the validation loss failed to improve for 14 consecutive epochs [29]. Various optimizers were evaluated, with the adaptive moment estimation (Adam) optimizer selected because of its superior performance [30]. Finally, we obtained an optimized model for retrieving cloud optical and microphysical properties (i.e., CTH and CWP) from AHI infrared observations.
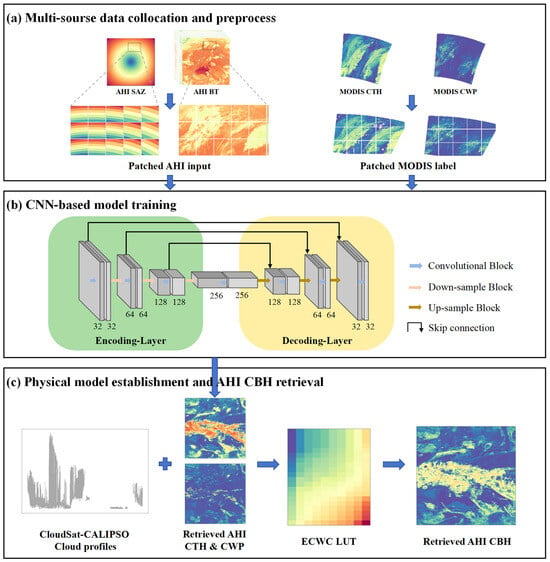
Figure 1.
Schematic flowchart of the research framework. Panel (a) shows the multi-source data collocation and preprocessing. Panel (b) illustrates the training process of the CNN-based retrieval model, with the numbers indicating the kernel size of each layer. Panel (c) represents the construction of the physical model (ECWC LUT) using the CloudSat-CALIPSO cloud profiles, and finally retrieved AHI CBH from AHI infrared observations based on the CNN model and ECWC LUT. In all subplots, warmer colors (e.g., yellow, red) indicate higher values, while cooler colors (e.g., purple, blue) represent lower values.
2.3.2. Physical Model
According to the physical model developed by Tan et al. [8], CGT can be effectively estimated using CWP via a LUT of ECWC constrained by cloud properties and environmental conditions. The definition of ECWC is used to represent the vertical variation of cloud water content. Considering the difference between the CTH and CWP retrieved from AHI infrared observations and those from AHI operational products, the LUT of ECWC needs to be reconstructed using a spatiotemporally collocated AHI-CPR-CALIOP dataset. Specifically, the retrieved AHI CTH and CWP were firstly collocated with CGT detected by CloudSat-CALIPSO, which is shown in Figure 1c. Using the relationship in Equation (2), this dataset allowed us to calculate a large sample of ECWC values. After that, we stratified these ECWC by two cloud properties (i.e., CTH and CWP) and three environmental variables (i.e., surface type, latitude, and season). Specifically, the CTH constraint ranges from 0 to 20 km with an interval of 1 km, and the CWP constraint ranges from 0 to 2 kg/m2 with inhomogeneous intervals due to its highly nonlinear distribution. Among the three environmental variables, surface type constraint includes land and ocean, latitude constraint refers to 60°S–30°S, 30°S–10°S, 10°S–10°N, 10°N–30°N, and 30°N–60°N, and season constraint refers to spring (March–April–May, MAM), summer (June–July–August, JJA), autumn (September–October–November, SON), and winter (December–January–February, DJF). Based on these constraints, the ECWC LUT is composed of 40 sub-tables (2 surface types × 5 latitude zones × 4 seasons), with each sub-table containing 200 pieces of data. Each cell within a sub-table stores the mean ECWC values for that specific set of conditions. Figure S1 provides the established LUT of ECWC, which clearly shows distinction between ocean and land surfaces. This difference arises from the fundamental dissimilarities in their surface radiative properties. The ocean surface acts nearly as a blackbody in the thermal infrared channels, while land surfaces exhibit significantly lower and more spectrally variable emissivity. By developing surface-dependent LUTs, our algorithm can better account for the varying background conditions, leading to a more accurate retrieval of CBH.
Following the physical model developed by Tan et al. [8], CGT is calculated through Equation (3) using the CWP retrievals and ECWC. Here, the ECWC for each AHI pixel is searched from the LUT based on its CTH and CWP as well as corresponding environmental variables (i.e., surface type, latitude, and season). Subsequently, CBH can be inferred using the CTH and CGT estimates via Equation (4).
To conclude, by organically combining a CNN model that retrieves CWP and CTH from infrared observations and a physical model that estimates CBH based on CGT using a LUT of ECWC, a novel algorithm for retrieving CBH based on geostationary satellite infrared observations is developed. Considering the complicated structure of multi-layer clouds and the limited penetration of infrared radiance to clouds, the proposed algorithm applied only to single-layer clouds in this study. The multi-layer cloud detection algorithm developed by Tan et al. [13] is employed to classify the AHI pixels as single-layer clouds or multi-layer clouds. Moreover, previous studies have indicated that it was difficult to estimate CBH of deep convection clouds based on the relationship between CWP and CGT, due to the significant uncertainty in estimation of CWP for such cloud type [6,31]. However, there has been an effective approach that uses convective condensation level and lift condensation level derived from numerical weather forecasting to infer the CBH of deep convection clouds [6]. Therefore, the cloud pixels classified as deep convection clouds (i.e., CTH ≥ 6 km and CWP ≥ 1.2 kg/m2) are also not considered in this study.
3. Results
3.1. Statistical Evaluation of CTH and CWP Retrievals
It is essential to evaluate the accuracy of the CTH and CWP retrievals derived from AHI infrared observations before the estimate of CBH. An example where clouds of various types is first presented in Figure 2. The first row in Figure 2 shows the retrieved AHI CTH and the corresponding MODIS CTH, while the second row presents the retrieved AHI CWP and the corresponding MODIS CWP. The results illustrate that the CNN-based AHI CTH and CWP retrievals have similar spatial distribution with the MODIS products. Although the spatial resolution of AHI (i.e., 5 km) is lower than that of MODIS (i.e., 1 km), our results still capture the high- and low-value regions of CTH and CWP well.
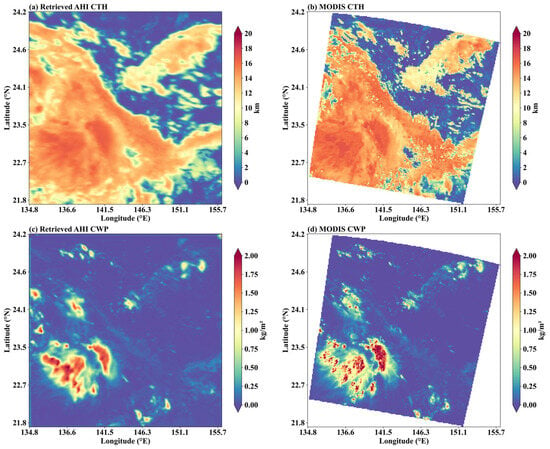
Figure 2.
Comparison of the retrieved AHI CTH and CWP with Terra MODIS Collection 6.1 MOD06 cloud products on 12 October 2017, at 01:00 UTC. Panels (a,c) represent the CNN-based CTH and CWP retrievals, while panels (b,d) correspond to the MODIS-derived CTH and CWP labels.
Moreover, we conduct a statistical evaluation using an independent data set consisting of the AHI-MODIS matchups from 2017. As illustrated in Figure 3a, the CTH retrievals derived from AHI infrared observations agree well with those derived from the MODIS MOD06 products. The correlation coefficient (R), mean deviation (BIAS), and root mean square error (RMSE) are 0.93, −0.10 km, and 1.92 km, respectively. Also, Figure 3c,d show that the CWP retrievals derived from AHI infrared observations are in good agreement with the MODIS data, with a BIAS of 0.003 kg/m2, an RMSE of 0.16 kg/m2, and an R of 0.79. Due to the limited penetration ability of infrared radiance, the AHI CWP retrievals tend to be slightly underestimated for clouds with CWP larger than 1 kg/m2. However, according to Figure S2, which presents the probability density functions of the retrieved AHI CTH and CWP with MODIS cloud products, clouds with CWP larger than 1 kg/m2 only account for less than 1% of the total samples. In addition, to evaluate the retrieval performance across different geopotential regions, we present the bias distribution for the retrieved CTH and CWP across various latitude bands in Figures S3 and S4. The results reveal a consistently negligible bias centered near zero for both CTH and CWP across all examined latitude zones. Consequently, the CNN-based model is capable of effectively retrieving CTH and CWP from AHI infrared observations in the majority of cases, which is crucial for the estimation of CBH.
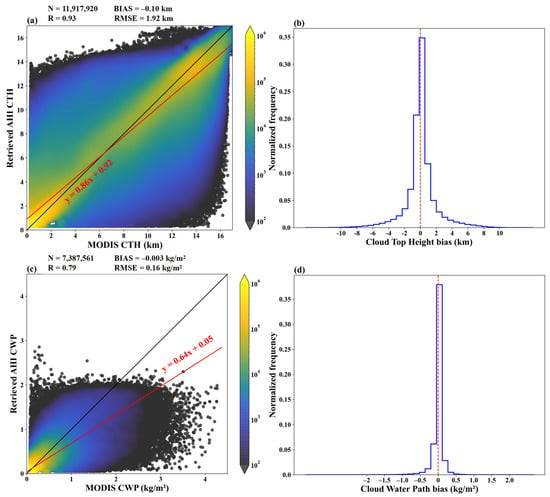
Figure 3.
Pixel-by-pixel comparison of (a) retrieved AHI CTH and (c) retrieved AHI CWP against their corresponding MODIS labels. Panels (b,d) show the corresponding error distributions for CTH and CWP, respectively. In (a,c), the color scale represents the number of matchups on a logarithmic scale. The black solid line is the 1:1 line, and the red solid line represent the linear regression. The vertical red dashed line in (b,d) is the zero-error line. N represents the total number of points, R is the correlation coefficient, BIAS is the mean deviation, and RMSE is the root mean squared error.
3.2. Validation of CBH Using Spaceborne Cloud Radar and Lidar Measurements
With the CTH and CWP retrievals derived from the CNN-based model, the CBH can be estimated from satellite observations using the physical model based on the LUT of ECWC. Here, we extensively evaluate the CBH estimates through comparison with the active measurements of CloudSat-CALIPSO and EarthCARE, which are some of the most powerful means to measure the vertical structures of clouds.
Figure 4 shows an example of CTH, CWP, and CBH retrievals based on the AHI infrared observations, with a comparison to the CloudSat-CALIPSO measurements. To provide a direct comparison, we also include the CTH product from the MODIS instrument aboard the Aqua satellite (MYD06). This choice is due to the fact that the CALIPSO flies in formation with Aqua in the A-Train satellite constellation, lagging by only 1–2 min, which ensures optimal spatiotemporal collocation. It is important to note that while the MYD06 product is used here for synergistic validation with CloudSat-CALIPSO, our model training and other analyses primarily utilized the MOD06 product.
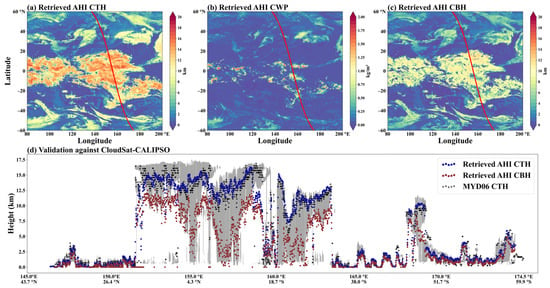
Figure 4.
A daytime example of the (a) CTH, (b) CWP, and (c) CBH retrievals based on the AHI infrared observations at 03:00 UTC on 1 March 2017. The red line in (a–c) is the coincident ground track of CloudSat-CALIPSO. Panel (d) shows a cross-sectional comparison between the AHI-retrieved CTH (blue dots) and CBH (red dots) and the CloudSat-CALIPSO-measured cloud vertical profile (gray shading) from 145°E–175°E. The black crosses represent the collocated MYD06 CTH for additional comparison.
The CTH, CWP, and CBH retrieval results cover a broad region spanning from 60°S to 60°N and 80°E to 200°E. In contrast, the CloudSat-CALIPSO measurements are limited to the nadir pixels, as indicated by the red lines in Figure 4a–c. A cross-section comparison between the AHI CTH (blue circles) and CBH retrievals (red circles) with the MYD06 CTH (black crosses) and the vertical cloud structures detected by CloudSat-CALIPSO (gray shading) at 03:00 UTC on 1 March 2017 is shown in Figure 4d. We selected the specific track segment from 145°E to 175°E for this cross-section because it features a complex cloud system, whereas the preceding section (i.e., 140°E–145°E) was predominantly clear sky and thus less informative for algorithm evaluation. The comparison between AHI-retrieved CTH and the MYD06 CTH product shows that our algorithm shows a relatively high accuracy. Furthermore, the results demonstrate that the AHI CBH retrievals are typically in agreement with those from CloudSat-CALIPSO when the AHI CTHs are reliably retrieved. For optically thin cirrus (e.g., pixels near 159°E), the AHI CTH retrievals are notably underestimated, resulting in an underestimation of the CBH for these pixels. Such significant biases in the CTH retrievals of thin and high clouds have also been observed in the operational cloud property products of both AHI and MODIS through comparison with ground-based cloud radar measurements [27,32].
It should be noted that the retrieval model based on the ECWC LUT can partially reduce the effects introduced by CTH errors. In specific, as shown in Figure S1, the ECWC in the LUT tend to decrease with increasing CTH, leading to overestimated ECWC when the CTH is underestimated. Subsequently, the overestimated ECWC will lead to underestimated CGT, thus reducing the influence of CTH errors on the estimation of CBH. As illustrated in Figure 4d, between 150°E and 160°E, the AHI CTH retrieval values differ from the CloudSat-CALIPSO-detected CTH by 2–4 km. However, the retrieved CBH remains reasonably close to those detected by active remote sensing. This indicates that our algorithm mitigates the potential errors associated with CTH retrievals and effectively characterizes the vertical structures of clouds.
A statistical evaluation of our CBH retrievals is conducted using the collocated AHI-CPR-CALIOP observations in 2017, and the results are presented in Figure 5 and Table 3. Figure 5a shows a pixel-by-pixel comparison between the AHI CBH retrievals and those obtained from CloudSat-CALIPSO, and the results are compiled from all single-layer cloud pixels with CTH biases smaller than 2 km. The bias between the AHI CBH retrievals and the active measurements of CloudSat-CALIPSO is −0.14, and the RMSE is 1.26 km, indicating good consistency between the two results.
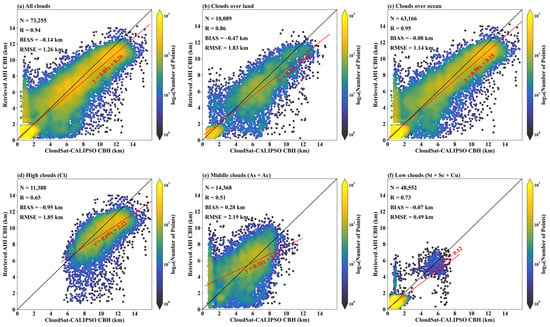
Figure 5.
Pixel-by-pixel comparison between the CBH retrievals derived from the AHI observations and the active measurements derived from the CloudSat-CALIPSO 2B-GEOPROF-LIDAR products for samples from (a) all clouds, (b) clouds over land, (c) clouds over ocean, (d) high clouds (cirrus), (e) middle clouds (altostratus and altocumulus) and (f) low clouds (cumulus, stratocumulus, stratus). In all subplots, the black solid line is the 1:1 line, and the red solid line represent the linear regression.

Table 3.
Statistical comparison of the AHI CBH retrievals and the CloudSat-CALIPSO CBH measurements.
To further evaluate the performance of the proposed algorithm, clouds over land or ocean are considered separately in Figure 5b,c. The results indicate that the accuracy of the CBH retrievals is higher for clouds over the ocean compared to those over land. This discrepancy may be attributed to the higher proportion of low clouds with CBH values smaller than 1.5 km over ocean than over land. Therefore, we further conduct a comparison for clouds at different altitudes. According to the cloud types determined by the 2B-GEOPROF-LIDAR product based on the combined observations of CloudSat-CPR and CALIOP, the samples are divided into low clouds (cumulus, stratocumulus, stratus), middle clouds (altostratus and altocumulus), and high clouds (cirrus). As shown in Figure 5d–f, the algorithm is especially effective for low clouds, with an R as high as 0.73 and a BIAS as small as −0.07 km. The BIAS of −0.95 km for high clouds indicates that the AHI CBH retrievals tend to be underestimated, mainly due to the underestimation of CTH of high and thin clouds. The performance of the CBH retrievals for middle clouds is slightly worse than that of high clouds due to the more complex vertical distribution of altostratus and altocumulus clouds. In addition, there is an overestimation phenomenon for the CBH lower than 2 km, and this mainly stems from the middle clouds over the ocean, which are primarily caused by undetected multilayer clouds. The CloudSat-CALIPSO is able to penetrate the high cirrus and correctly detects the base of the low-level clouds. In contrast, the signal received by the AHI and MODIS is heavily dominated by the cold brightness temperature of the high-level cirrus, which leads to a very high CTH from CNN. This large CTH error propagates directly to the final CBH, leading to its severe overestimation.
Due to a battery issue with CloudSat, there have been no available nighttime observations in the 2B-GEOPROF-LIDAR product since April 2011. To demonstrate the capability of the proposed algorithm to retrieve AHI CBH under both daytime and nighttime conditions, we conducted a comparison using the state-of-the-art EarthCARE-CPR 2A cloud product (i.e., CPR_TC_2A). Figure 6 compares the AHI nighttime retrieval products with EarthCARE-CPR measurements on 19 March 2025, at 13:14 UTC. Consistent with the previous comparisons against CloudSat-CALIPSO, the retrieved AHI CBH effectively mitigates the errors derived from AHI CTH retrievals for pixels between 187°E and 188°E. However, when the thick cloud is situated close to the ground (i.e., between 190°E and 191°E), the retrieved AHI CBH tends to overestimate the cloud base boundary, even when the corresponding AHI CTH retrievals are accurate.
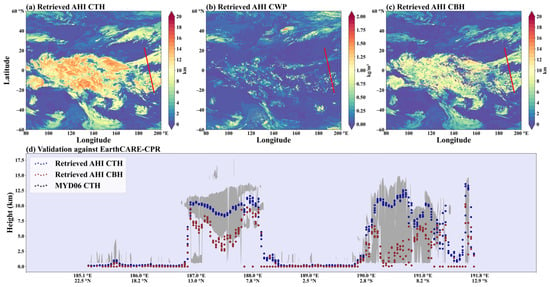
Figure 6.
A nighttime example of the (a) CTH, (b) CWP, and (c) CBH retrievals based on the AHI infrared observations at 13:14 UTC on 19 March 2025. The red line in (a–c) is the coincident ground track of EarthCARE. Panel (d) shows a cross-sectional comparison between the AHI-retrieved CTH (blue dots) and CBH (red dots) and the EarthCARE CPR-measured cloud vertical structures (gray area). The purple shading represents that the case occurred during nighttime.
To reveal the performance of our algorithm in retrieving nighttime CBH, Figure 7 evaluates the AHI CBH retrievals using the EarthCARE-CPR measurements. The pixel-by-pixel comparisons are conducted for clouds at daytime and nighttime, respectively. The results show that the accuracy of the AHI-derived nighttime CBH retrievals (−0.35 ± 1.84 km) is slightly lower than that of the daytime CBH retrievals (−0.21 ± 1.66 km). The difference between daytime and nighttime CBH retrieval accuracies is mainly attributed to the difference between daytime and nighttime cloud vertical characteristics (i.e., CTH, CBH, and CGT).
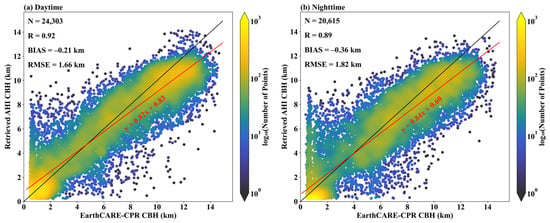
Figure 7.
Pixel-by-pixel comparison of AHI CBH retrievals and the EarthCARE CPR measurements for (a) daytime and (b) nighttime conditions. In all subplots, the black solid line is the 1:1 line, and the red solid line represent the linear regression.
As shown in Figure 8a,b, the EarthCARE measurements indicate that there is a higher proportion of high-level thin clouds and fewer thick clouds at nighttime than at daytime. Furthermore, Figure 8c,d presents a bias distribution heatmap of the retrieved AHI CBH, constrained by the EarthCARE CTH and CGT. The results show that the distribution of the biases of the day and night CBH retrievals is similar. However, the proposed algorithm tends to overestimate CBH for optically thick clouds while underestimating CBH for optically high-level thin clouds. The overestimation for optically thick clouds is mainly caused by the limitations of infrared radiance in penetrating thick clouds, which leads to underestimated CWP retrievals [10]. In addition, some previous studies have found that the MODIS cloud property products tend to underestimate the CTH of high-level thin clouds [32]. As one of the major input variables, the underestimation of the retrieved CTH would result in underestimated AHI CBH retrievals for high-level optically thin clouds. To conclude, the hybrid CBH retrieval algorithm can be effectively applied to nighttime AHI observations, although its performance may be affected by the diurnal variation of the cloud vertical structures.
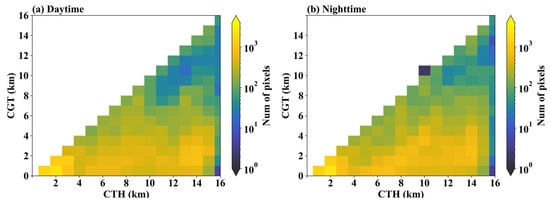
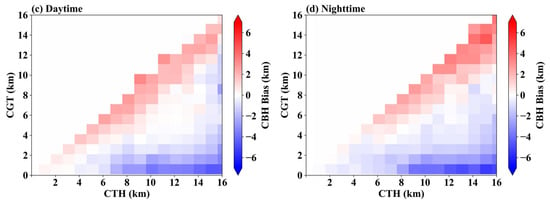
Figure 8.
Panels (a,b) show the pixel number distribution of CTH and CGT detected by the EarthCARE CPR. Panels (c,d) show the bias of the AHI CBH retrievals with constrains of EarthCARE CTH and CGT.
3.3. Validation of CBH Using Ground-Based Ka-Band MMCR Measurements
The ground-based Ka-band MMCR measurements from four stations in China, including Hongyuan, Yichang, Taiyuan, and Jiuquan, are used to evaluate the performance of AHI CBH estimates across the diurnal cycle. The geolocations and elevations of the four stations are provided in Table 4. The MMCR measurements are compared with the average of the AHI CBH estimates of the four pixels closest to the MMCR. Figure 9 shows four examples with diverse cloud types in November 2022. Our CBH estimates typically agree with those determined by MMCR, especially when the CTH differences are small. Moreover, the performance of CBH retrievals varies depending on cloud types and vertical structures. The retrieval algorithm performs better for low clouds compared to high and middle clouds. It should be noted that although MMCR provides high temporal and vertical resolution cloud information for validation, its CBH measurements may still be affected by radar signal attenuation, especially in the presence of precipitation or thick hydrometeors [33]. Compared with the existing algorithms that only apply to daytime satellite observations, the proposed algorithm demonstrates the capability of estimating CBH under both daytime and nighttime conditions. This advancement significantly enhances the temporal continuity of satellite-based CBH products and provides a more comprehensive representation of cloud vertical structures for weather forecasting applications.

Table 4.
Geolocations and elevations of the four ground-based Ka-band millimeter-wave cloud radar stations.


Figure 9.
Four single-layer cloud cases for the intercomparison of the AHI-retrieved CBHs (red dots) and CTHs (blue dots) with Ka-band MMCR measurements (gray shading) at four MMCR stations in November 2022. The white/purple shading indicates the case occurred during daytime/nighttime.
4. Discussion
The performance of our hybrid algorithm was rigorously evaluated. A key strength of the deep learning stage is its ability to achieve retrieval accuracy for CTH and CWP from AHI infrared observations. The performance of the two cloud products is comparable to the Terra MODIS C6.1 MOD06 products, which benefit from both visible and infrared channels. This demonstrates the model’s power in extracting cloud properties even in the absence of solar reflectance data, a capability that is crucial for diurnal estimation. The subsequent physical stage, which uses an ECWC LUT constrained by both cloud properties and environmental variables, allows for the rapid and physically consistent inference of CGT and CBH under real atmospheric conditions.
Validation against spaceborne active sensors confirms the effectiveness of the algorithm. In daytime, our CBH retrievals show good agreement with CloudSat-CALIPSO measurements, achieving a high correlation coefficient of 0.94 and a small bias of −0.14 ± 1.26 km. The algorithm’s capability to capture cloud vertical structures throughout the diurnal cycle was further validated using EarthCARE-CPR measurements, yielding a daytime bias of −0.21 ± 1.66 km and a nighttime bias of −0.35 ± 1.84 km. Furthermore, comparisons with four ground-based MMCRs highlight the algorithm’s capability to estimate CBH continuously and effectively. This capability is vital for studying the diurnal evolution of cloud structures.
While the hybrid algorithm demonstrates promising results, it is crucial to acknowledge its limitations and potential error sources. A primary source of uncertainty originates in the initial CNN stage, stemming from potential inaccuracies in the MODIS training labels and the inherent spatiotemporal mismatches between the geostationary AHI and polar-orbiting MODIS. The subsequent physical calculation introduces further error, as our ECWC LUT represents a climatological average that may not perfectly represent the microphysics of a specific cloud scene. Critically, this two-stage process is subject to significant error propagation, where inaccuracies in the initial CTH retrieval are directly transferred and can be amplified in the final CBH estimation.
5. Conclusions
This study develops a novel hybrid algorithm designed to estimate single-layer CBH from geostationary infrared observations in diurnal cycles. The method successfully integrates a deep learning model to retrieve cloud properties (i.e., CTH and CWP) with a physical model that uses these properties to infer cloud geometric thickness and, ultimately, the CBH.
This study provides an effective approach to obtain large-area and diurnally continuous CBH retrievals from geostationary satellite observations. The results have the potential to improve the estimation of cloud radiative forcing and may also be valuable for aviation guidance. In addition, the algorithm can be applied to other meteorological satellites by retraining the CNN model and reconstructing the ECWC LUT to facilitate the observation of global cloud vertical distributions, which will be important for improving cloud parameterization schemes in general circulation models.
Given the limitations of our algorithm in dealing with multi-layer clouds, improvement of the retrieval of CBH for multi-layer clouds will be a topic of future research. Furthermore, deep learning-based nowcasting of cloud vertical distribution will be a prospective study, as the transformative evolution of the low-altitude economy in recent years opens a diverse range of new application scenarios.
Supplementary Materials
The following supporting information can be downloaded at: https://www.mdpi.com/article/10.3390/rs17142469/s1, Figure S1: The look-up table (LUT) of effective cloud water content (ECWC, g/m3) constrained by cloud top height (CTH, km) and cloud water path (CWP, kg/m2) for clouds (a) over land and (b) over ocean with color scale in log10 units; Figure S2: The probability density functions of the (a) cloud top height and (b) cloud water path for retrieved AHI products and MODIS official measurements; Figure S3: Normalized frequency histograms of cloud top height (CTH) bias (km) for five different latitude bands: (a) 60°S–30°S, (b) 30°S–10°S, (c) 10°S–10°N, (d) 10°N–30°N, and (e) 30°N–60°N. The red dashed line indicates zero bias; Figure S4: Normalized frequency histograms of cloud water path (CWP) bias (kg/m2) for five different latitude bands: (a) 60°S–30°S, (b) 30°S–10°S, (c) 10°S–10°N, (d) 10°N–30°N, and (e) 30°N–60°N. The red dashed line indicates zero bias.
Author Contributions
Conceptualization, Z.T. and T.Y.; methodology, T.Y.; software, T.Y.; validation, T.Y., Z.T. and W.A.; formal analysis, T.Y. and Z.T.; investigation, T.Y. and S.M.; resources, X.Z., S.H. and C.L.; data curation, T.Y.; writing—original draft preparation, T.Y.; writing—review and editing, Z.T., W.A. and J.G.; visualization, T.Y.; supervision, W.A.; project administration, S.H.; funding acquisition, W.A. All authors have read and agreed to the published version of the manuscript.
Funding
This research was funded by the Fengyun Application Pioneering Project (FY-APP) under Grant FY4(02P)-2024007, the National Natural Science Foundation of China, grant numbers 42305150 and 42325501, and the China Postdoctoral Science Foundation (Certificate Number: 2024T170423).
Data Availability Statement
The MODIS Collection 6.1 MOD06 dataset used in this study can be obtained from the Level-1 and Atmosphere Archive and Distribution System DAAC (https://ladsweb.modaps.eosdis.nasa.gov/search/order/2, accessed on 26 July 2024).The AHI data are available from the Japan Aerospace Exploration Agency (JAXA)’s P-Tree system (http://www.eorc.jaxa.jp/ptree/registration_top.html, accessed on 26 July 2024). The CPR-CALIOP 2B-GEOPROF-LIDAR dataset can be accessed in the CloudSat Data Processing Center (https://www.cloudsat.cira.colostate.edu/order/, accessed on 26 July 2024). And the EarthCARE-CPR product CPR_TC_2A is available in the Online Dissemination (https://ec-pdgs-dissemination2.eo.esa.int/oads/access/collection/EarthCAREL2Validated/tree, accessed on 5 April 2025).
Conflicts of Interest
The authors declare no conflicts of interest.
References
- Lenaerts, J.T.M.; Gettelman, A.; Van Tricht, K.; van Kampenhout, L.; Miller, N.B. Impact of Cloud Physics on the Greenland Ice Sheet Near-Surface Climate: A Study With the Community Atmosphere Model. J. Geophys. Res. Atmos. 2020, 125, e2019JD031470. [Google Scholar] [CrossRef]
- Los, S.O.; Street-Perrott, F.A.; Loader, N.J.; Froyd, C.A. Detection of Signals Linked to Climate Change, Land-Cover Change and Climate Oscillators in Tropical Montane Cloud Forests. Remote Sens. Environ. 2021, 260, 112431. [Google Scholar] [CrossRef]
- Viúdez-Mora, A.; Costa-Surós, M.; Calbó, J.; González, J.A. Modeling Atmospheric Longwave Radiation at the Surface during Overcast Skies: The Role of Cloud Base Height. JGR Atmos. 2015, 120, 199–214. [Google Scholar] [CrossRef]
- Jiménez, P.A.; McCandless, T. Exploring the Potential of Statistical Modeling to Retrieve the Cloud Base Height from Geostationary Satellites: Applications to the ABI Sensor on Board of the GOES-R Satellite Series. Remote Sens. 2021, 13, 375. [Google Scholar] [CrossRef] [PubMed]
- Hutchison, K.; Wong, E.; Ou, S.C. Cloud Base Heights Retrieved during Night-time Conditions with MODIS Data. Int. J. Remote Sens. 2006, 27, 2847–2862. [Google Scholar] [CrossRef]
- Noh, Y.-J.; Forsythe, J.M.; Miller, S.D.; Seaman, C.J.; Li, Y.; Heidinger, A.K.; Lindsey, D.T.; Rogers, M.A.; Partain, P.T. Cloud-Base Height Estimation from VIIRS. Part II: A Statistical Algorithm Based on A-Train Satellite Data. J. Atmos. Ocean. Technol. 2017, 34, 585–598. [Google Scholar] [CrossRef]
- Seaman, C.J.; Noh, Y.-J.; Miller, S.D.; Heidinger, A.K.; Lindsey, D.T. Cloud-Base Height Estimation from VIIRS. Part I: Operational Algorithm Validation against CloudSat. J. Atmos. Ocean. Technol. 2017, 34, 567–583. [Google Scholar] [CrossRef]
- Tan, Z.; Ma, S.; Liu, C.; Teng, S.; Letu, H.; Zhang, P.; Ai, W. Retrieving Cloud Base Height from Passive Radiometer Observations via a Systematic Effective Cloud Water Content Table. Remote Sens. Environ. 2023, 294, 113633. [Google Scholar] [CrossRef]
- Lin, H.; Li, Z.; Li, J.; Zhang, F.; Min, M.; Menzel, W.P. Estimate of Daytime Single-Layer Cloud Base Height from Advanced Baseline Imager Measurements. Remote Sens. Environ. 2022, 274, 112970. [Google Scholar] [CrossRef]
- Wang, Q.; Zhou, C.; Zhuge, X.; Liu, C.; Weng, F.; Wang, M. Retrieval of Cloud Properties from Thermal Infrared Radiometry Using Convolutional Neural Network. Remote Sens. Environ. 2022, 278, 113079. [Google Scholar] [CrossRef]
- Li, J.; Zhang, F.; Li, W.; Tong, X.; Pan, B.; Li, J.; Lin, H.; Letu, H.; Mustafa, F. Transfer-Learning-Based Approach to Retrieve the Cloud Properties Using Diverse Remote Sensing Datasets. IEEE Trans. Geosci. Remote Sens. 2023, 61, 1–10. [Google Scholar] [CrossRef]
- Zhuge, X.; Zou, X.; Wang, Y. Determining AHI Cloud-Top Phase and Intercomparisons With MODIS Products Over North Pacific. IEEE Trans. Geosci. Remote Sens. 2021, 59, 436–448. [Google Scholar] [CrossRef]
- Tan, Z.; Liu, C.; Ma, S.; Wang, X.; Shang, J.; Wang, J.; Ai, W.; Yan, W. Detecting Multilayer Clouds From the Geostationary Advanced Himawari Imager Using Machine Learning Techniques. IEEE Trans. Geosci. Remote Sens. 2022, 60, 1–12. [Google Scholar] [CrossRef]
- Wang, Q.; Zhou, C.; Letu, H.; Zhu, Y.; Zhuge, X.; Liu, C.; Weng, F.; Wang, M. Obtaining Cloud Base Height and Phase From Thermal Infrared Radiometry Using a Deep Learning Algorithm. IEEE Trans. Geosci. Remote Sens. 2023, 61, 1–14. [Google Scholar] [CrossRef]
- Iwabuchi, H.; Putri, N.S.; Saito, M.; Tokoro, Y.; Sekiguchi, M.; Yang, P.; Baum, B.A. Cloud Property Retrieval from Multiband Infrared Measurements by Himawari-8. J. Meteorol. Soc. Japan. Ser. II 2018, 96B, 27–42. [Google Scholar] [CrossRef]
- Letu, H.; Nakajima, T.Y.; Wang, T.; Shang, H.; Ma, R.; Yang, K.; Baran, A.J.; Riedi, J.; Ishimoto, H.; Yoshida, M.; et al. A New Benchmark for Surface Radiation Products over the East Asia–Pacific Region Retrieved from the Himawari-8/AHI Next-Generation Geostationary Satellite. Bull. Am. Meteorol. Soc. 2022, 103, E873–E888. [Google Scholar] [CrossRef]
- Letu, H.; Nagao, T.M.; Nakajima, T.Y.; Riedi, J.; Ishimoto, H.; Baran, A.J.; Shang, H.; Sekiguchi, M.; Kikuchi, M. Ice Cloud Properties From Himawari-8/AHI Next-Generation Geostationary Satellite: Capability of the AHI to Monitor the DC Cloud Generation Process. IEEE Trans. Geosci. Remote Sens. 2019, 57, 3229–3239. [Google Scholar] [CrossRef]
- Zhuge, X.; Zou, X.; Wang, Y. AHI-Derived Daytime Cloud Optical/Microphysical Properties and Their Evaluations With the Collection-6.1 MOD06 Product. IEEE Trans. Geosci. Remote Sens. 2021, 59, 6431–6450. [Google Scholar] [CrossRef]
- Platnick, S.; Meyer, K.G.; King, M.D.; Wind, G.; Amarasinghe, N.; Marchant, B.; Arnold, G.T.; Zhang, Z.; Hubanks, P.A.; Holz, R.E.; et al. The MODIS Cloud Optical and Microphysical Products: Collection 6 Updates and Examples From Terra and Aqua. IEEE Trans. Geosci. Remote Sens. 2017, 55, 502–525. [Google Scholar] [CrossRef] [PubMed]
- Stephens, G.L.; Vane, D.G.; Boain, R.J.; Mace, G.G.; Sassen, K.; Wang, Z.; Illingworth, A.J.; O’connor, E.J.; Rossow, W.B.; Durden, S.L.; et al. THE CLOUDSAT MISSION AND THE A-TRAIN: A New Dimension of Space-Based Observations of Clouds and Precipitation. Bull. Am. Meteor. Soc. 2002, 83, 1771–1790. [Google Scholar] [CrossRef]
- Bruno, O.; Hoose, C.; Storelvmo, T.; Coopman, Q.; Stengel, M. Exploring the Cloud Top Phase Partitioning in Different Cloud Types Using Active and Passive Satellite Sensors. Geophys. Res. Lett. 2021, 48, e2020GL089863. [Google Scholar] [CrossRef]
- Li, W.; Zhang, F.; Guo, B.; Fu, H.; Letu, H. Physics-Driven Machine Learning Algorithm Facilitates Multilayer Cloud Property Retrievals From Geostationary Passive Imager Measurements. IEEE Trans. Geosci. Remote Sens. 2024, 62, 1–18. [Google Scholar] [CrossRef]
- Wehr, T.; Kubota, T.; Tzeremes, G.; Wallace, K.; Nakatsuka, H.; Ohno, Y.; Koopman, R.; Rusli, S.; Kikuchi, M.; Eisinger, M.; et al. The EarthCARE Mission—Science and System Overview. Atmos. Meas. Tech. 2023, 16, 3581–3608. [Google Scholar] [CrossRef]
- Burns, D.; Kollias, P.; Tatarevic, A.; Battaglia, A.; Tanelli, S. The Performance of the EarthCARE Cloud Profiling Radar in Marine Stratiform Clouds. J. Geophys. Res.: Atmos. 2016, 121, 14525–14537. [Google Scholar] [CrossRef]
- Irbah, A.; Delanoë, J.; Van Zadelhoff, G.-J.; Donovan, D.P.; Kollias, P.; Puigdomènech Treserras, B.; Mason, S.; Hogan, R.J.; Tatarevic, A. The Classification of Atmospheric Hydrometeors and Aerosols from the EarthCARE Radar and Lidar: The A-TC, C-TC and AC-TC Products. Atmos. Meas. Tech. 2023, 16, 2795–2820. [Google Scholar] [CrossRef]
- European Space Agency. EarthCARE CPR TC Level 2A; Version AC; European Space Agency: Paris, France, 2025. [Google Scholar] [CrossRef]
- Yang, X.; Ge, J.; Hu, X.; Wang, M.; Han, Z. Cloud-Top Height Comparison from Multi-Satellite Sensors and Ground-Based Cloud Radar over SACOL Site. Remote Sens. 2021, 13, 2715. [Google Scholar] [CrossRef]
- Huang, S.-C.; Chen, C.-C.; Lan, J.; Hsieh, T.-Y.; Chuang, H.-C.; Chien, M.-Y.; Ou, T.-S.; Chen, K.-H.; Wu, R.-C.; Liu, Y.-J.; et al. Deep Neural Network Trained on Gigapixel Images Improves Lymph Node Metastasis Detection in Clinical Settings. Nat. Commun. 2022, 13, 3347. [Google Scholar] [CrossRef] [PubMed]
- Bejani, M.M.; Ghatee, M. A Systematic Review on Overfitting Control in Shallow and Deep Neural Networks. Artif. Intell. Rev. 2021, 54, 6391–6438. [Google Scholar] [CrossRef]
- Kingma, D.; Ba, J. Adam: A Method for Stochastic Optimization. In Proceedings of the International Conference on Learning Representations, Banff, AB, Canda, 14–16 April 2014. [Google Scholar]
- Skorokhodov, A.V.; Pustovalov, K.N.; Kharyutkina, E.V.; Astafurov, V.G. Cloud-Base Height Retrieval from MODIS Satellite Data Based on Self-Organizing Neural Networks. Atmos. Ocean. Opt. 2023, 36, 723–734. [Google Scholar] [CrossRef]
- Huo, J.; Lu, D.; Duan, S.; Bi, Y.; Liu, B. Comparison of the Cloud Top Heights Retrieved from MODIS and AHI Satellite Data with Ground-Based Ka-Band Radar. Atmos. Meas. Tech. 2020, 13, 1–11. [Google Scholar] [CrossRef]
- Zhou, R.; Wang, G.; Zhaxi, S. Cloud Vertical Structure Measurements from a Ground-Based Cloud Radar over the Southeastern Tibetan Plateau. Atmos. Res. 2021, 258, 105629. [Google Scholar] [CrossRef]
Disclaimer/Publisher’s Note: The statements, opinions and data contained in all publications are solely those of the individual author(s) and contributor(s) and not of MDPI and/or the editor(s). MDPI and/or the editor(s) disclaim responsibility for any injury to people or property resulting from any ideas, methods, instructions or products referred to in the content. |
© 2025 by the authors. Licensee MDPI, Basel, Switzerland. This article is an open access article distributed under the terms and conditions of the Creative Commons Attribution (CC BY) license (https://creativecommons.org/licenses/by/4.0/).