
Accurate Extraction of Rural Residential Buildings in Alpine Mountainous Areas by Combining Shadow Processing with FF-SwinT

Abstract
1. Introduction
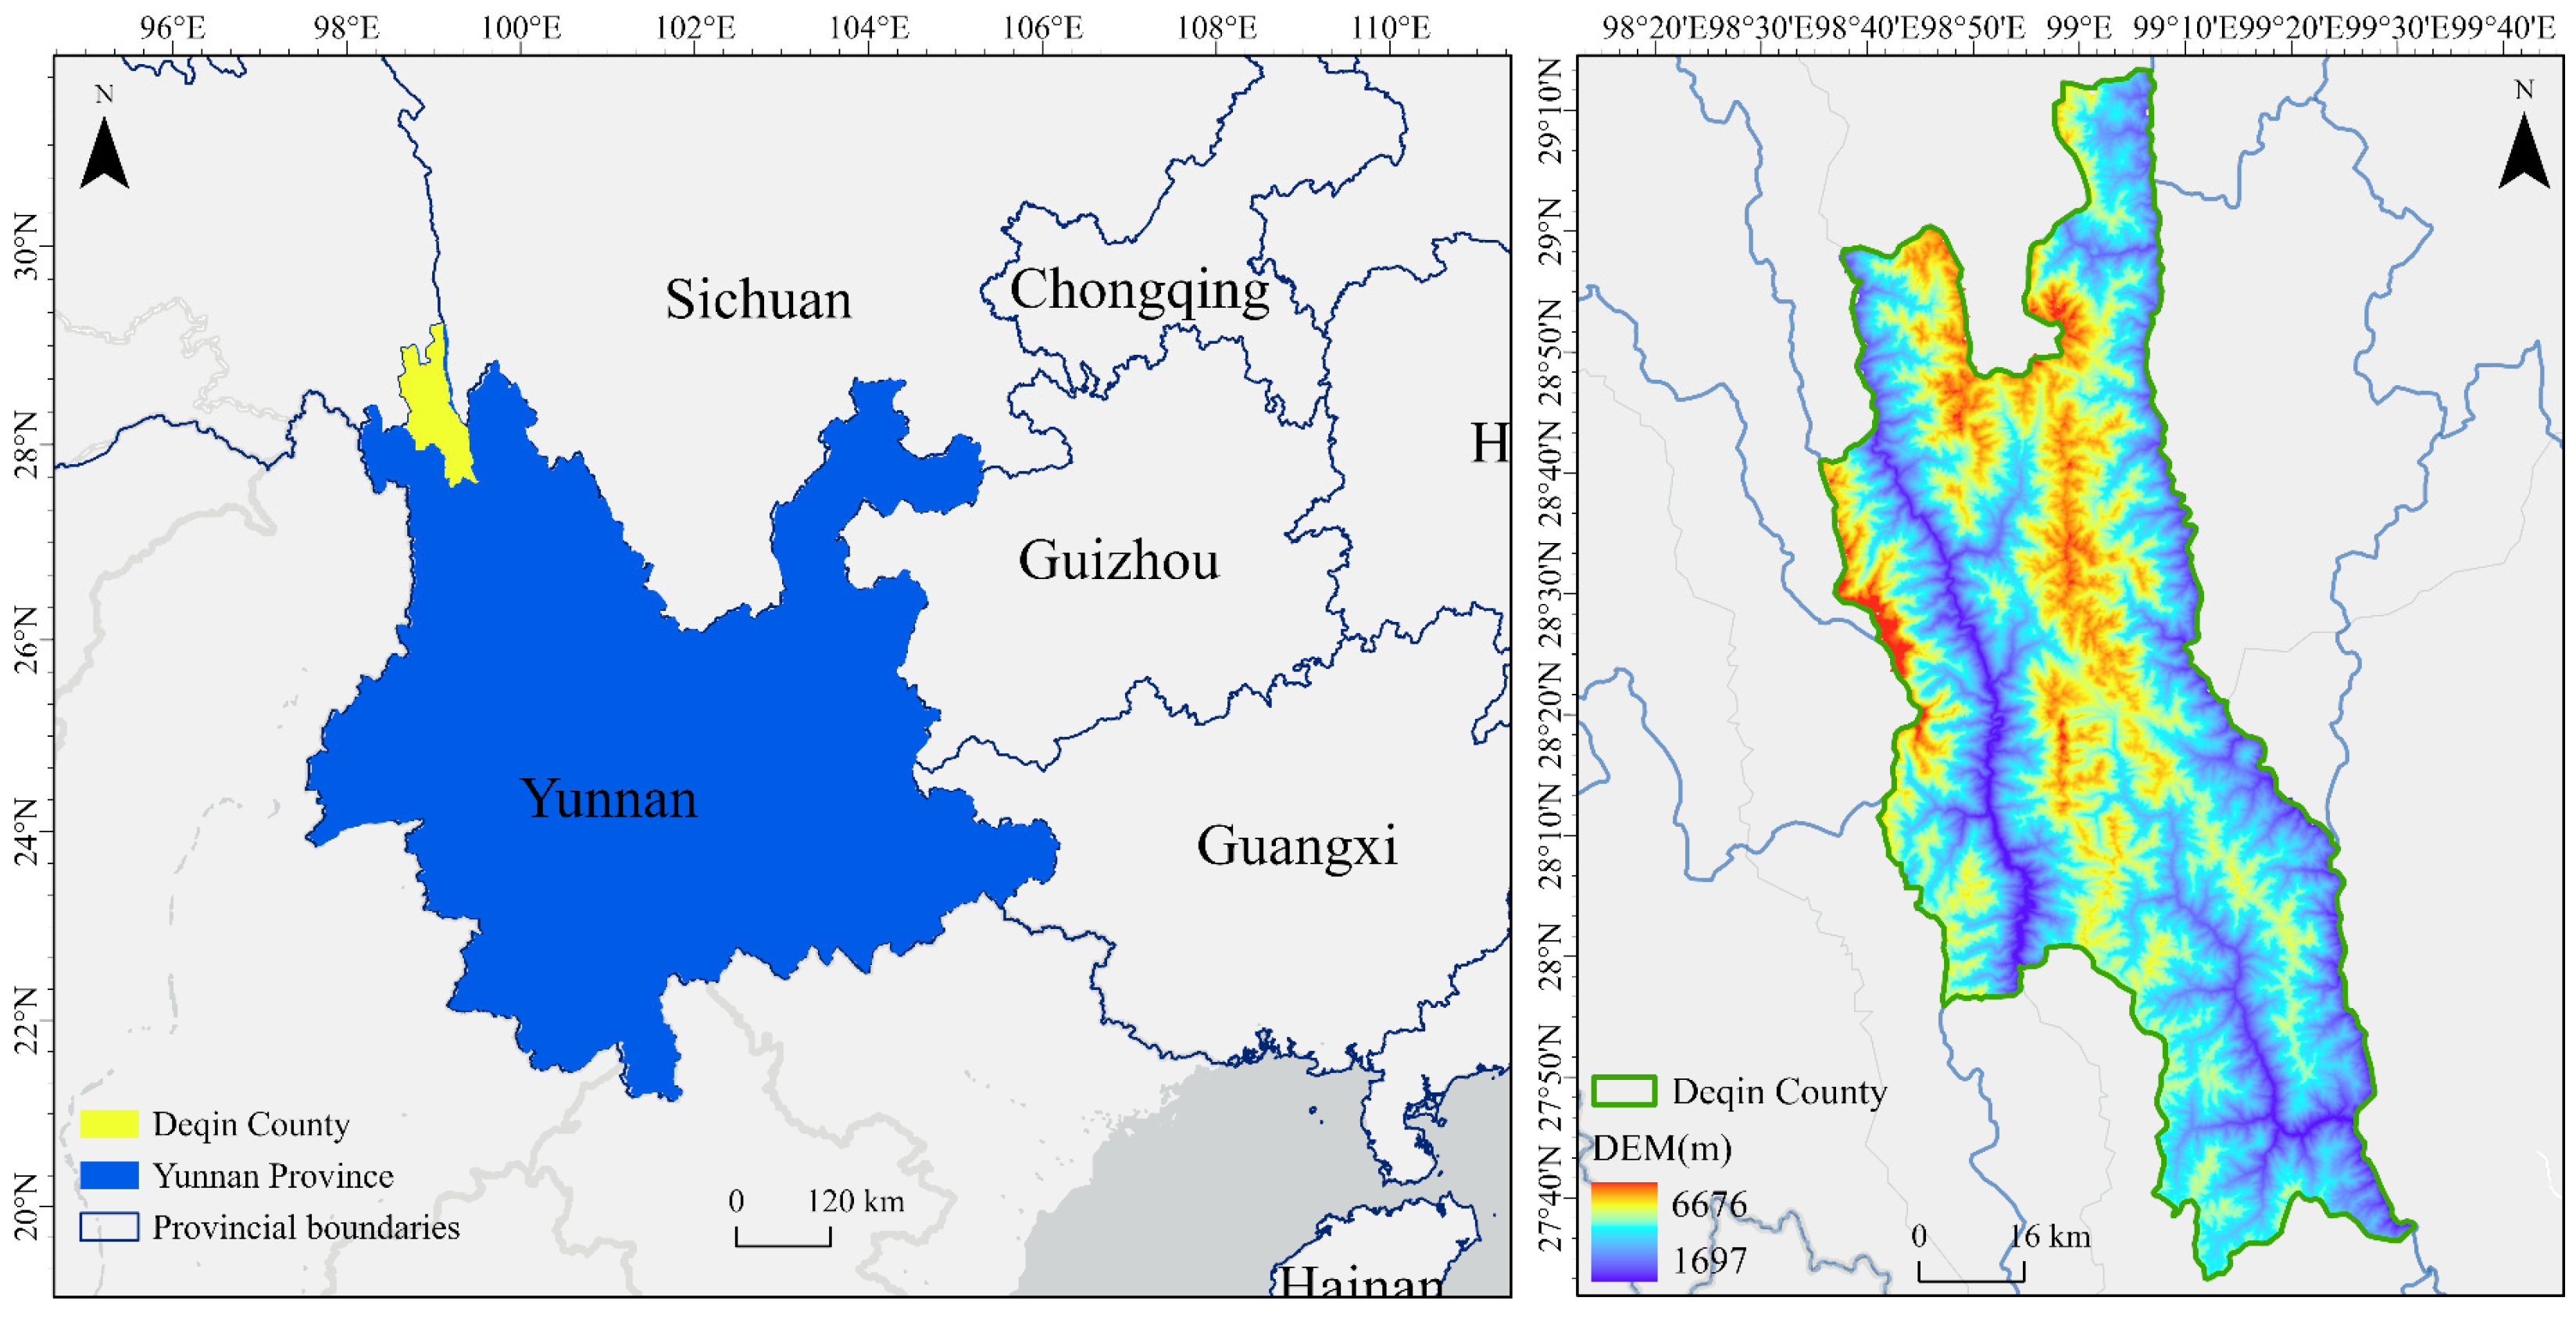
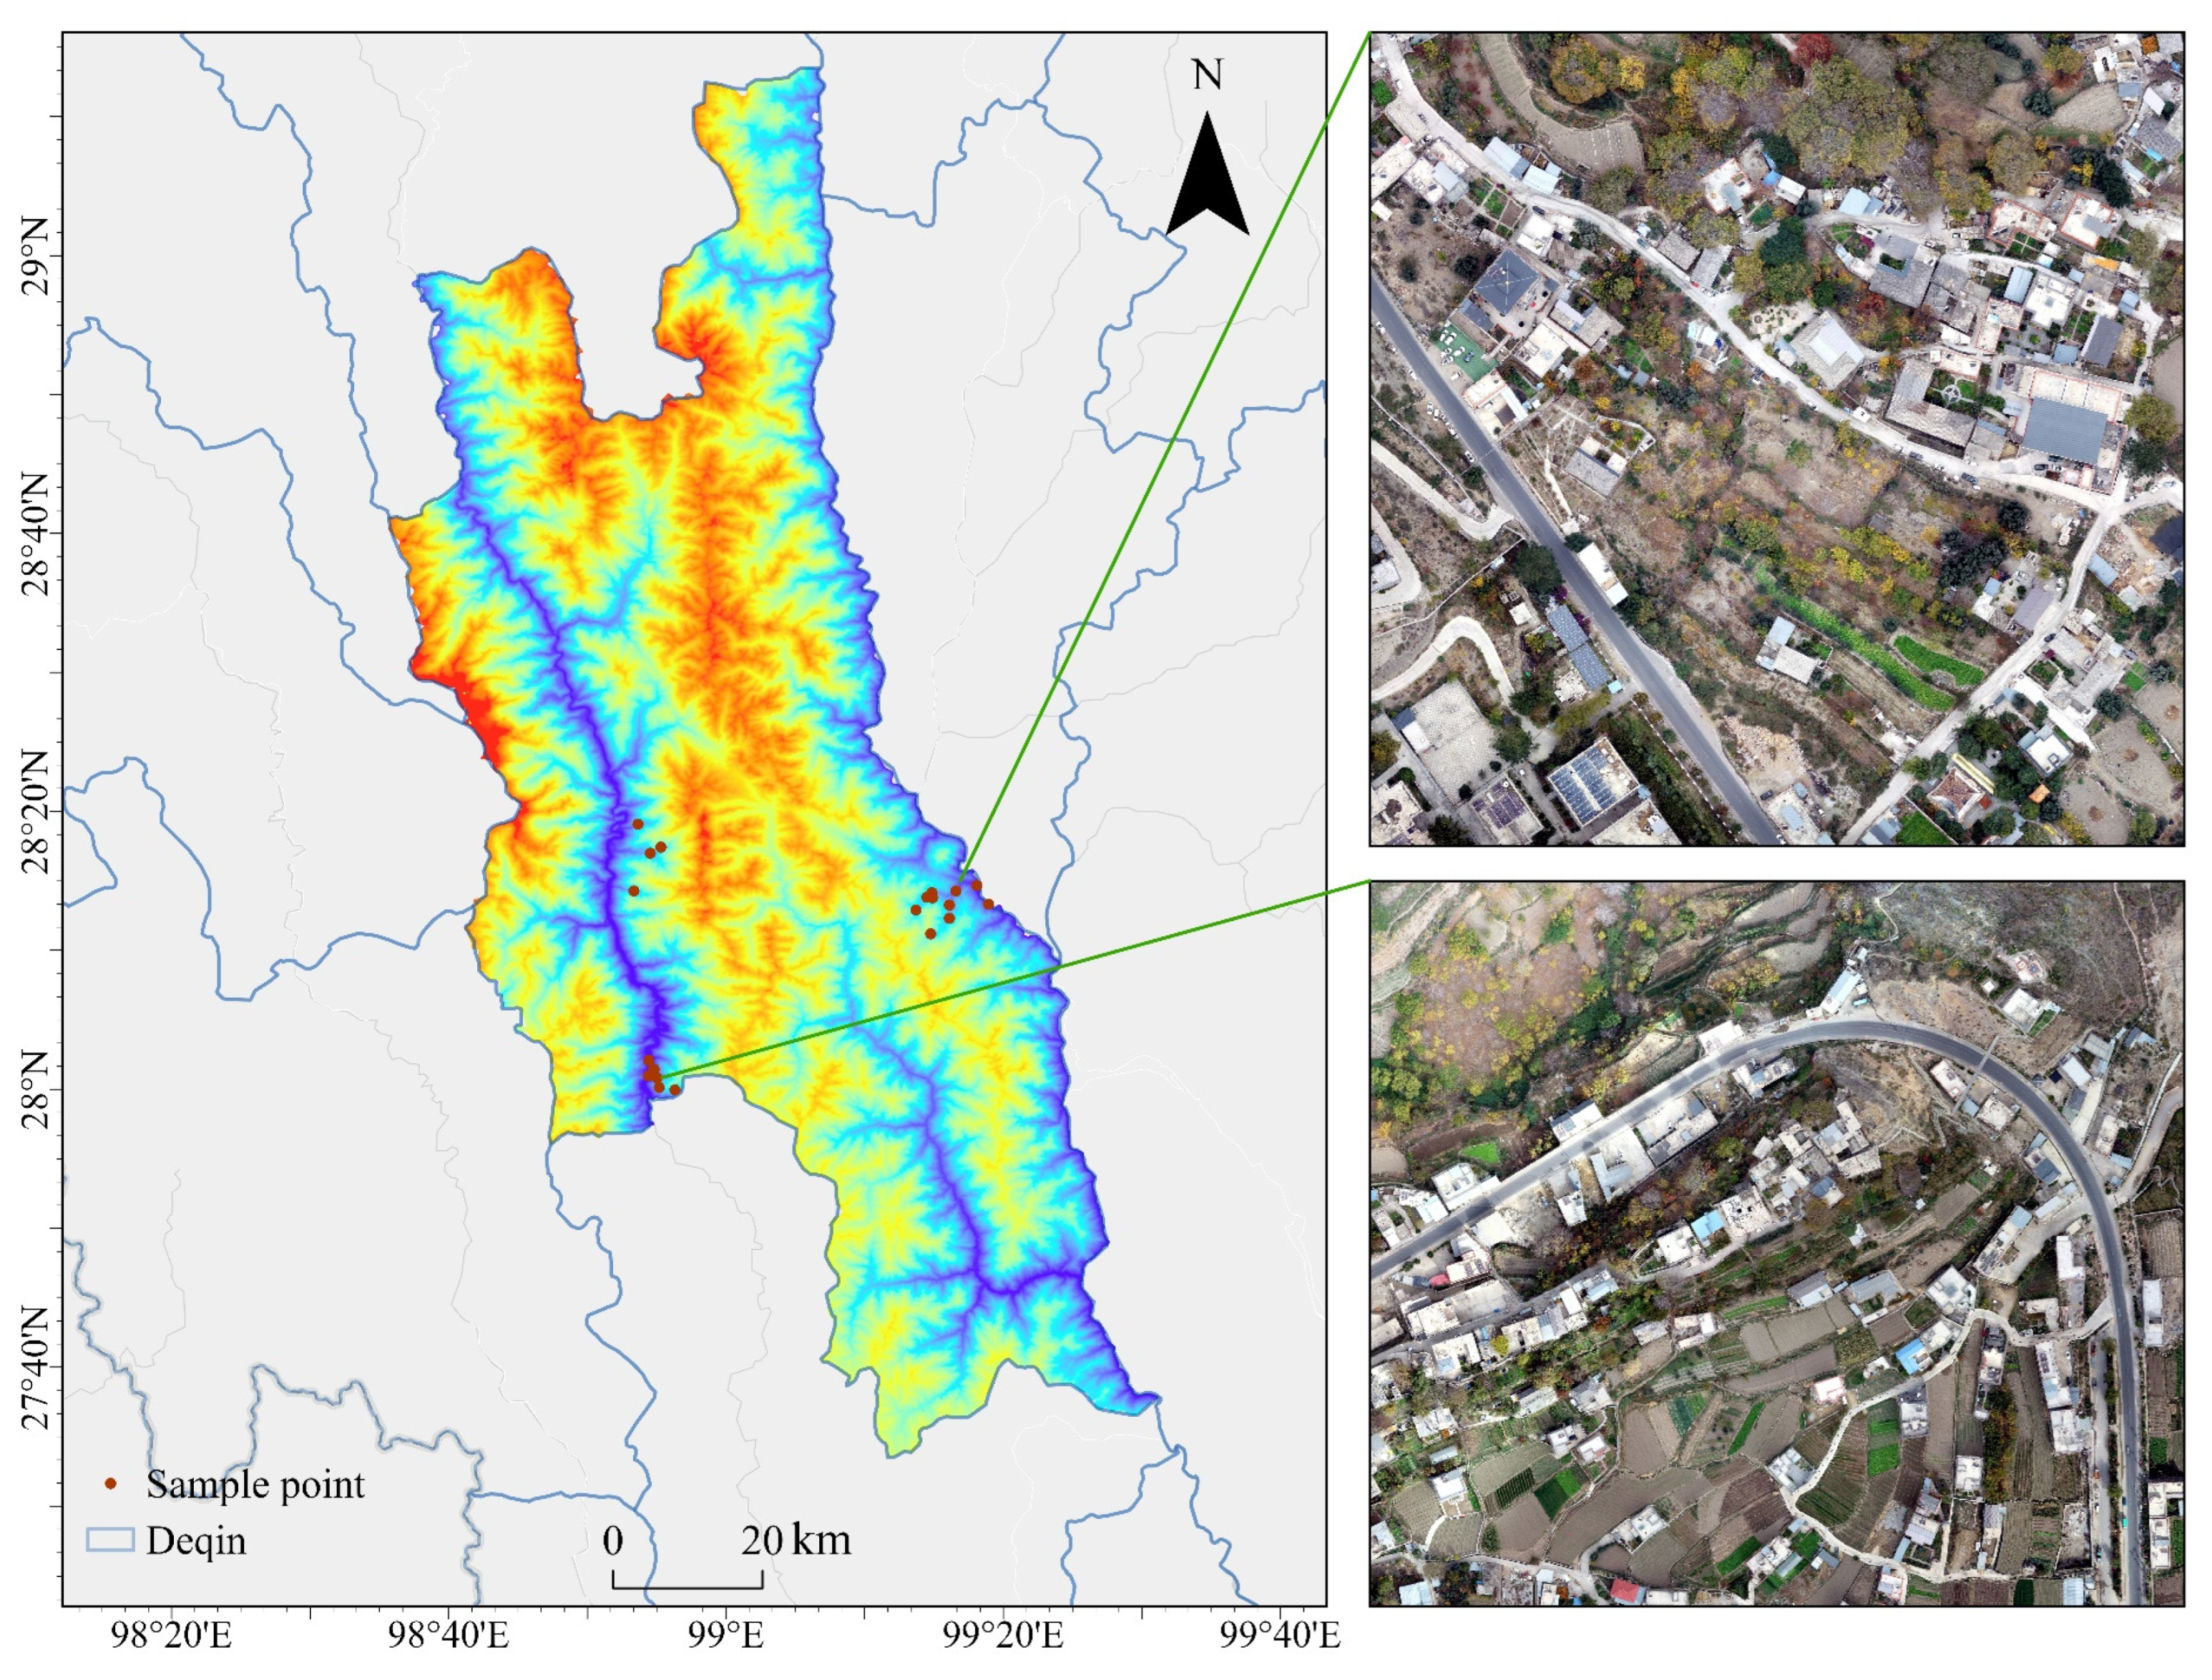
2. Study Area
3. Materials
3.1. Data Acquisition and Processing
3.1.1. UAV Remote Sensing Data Acquisition
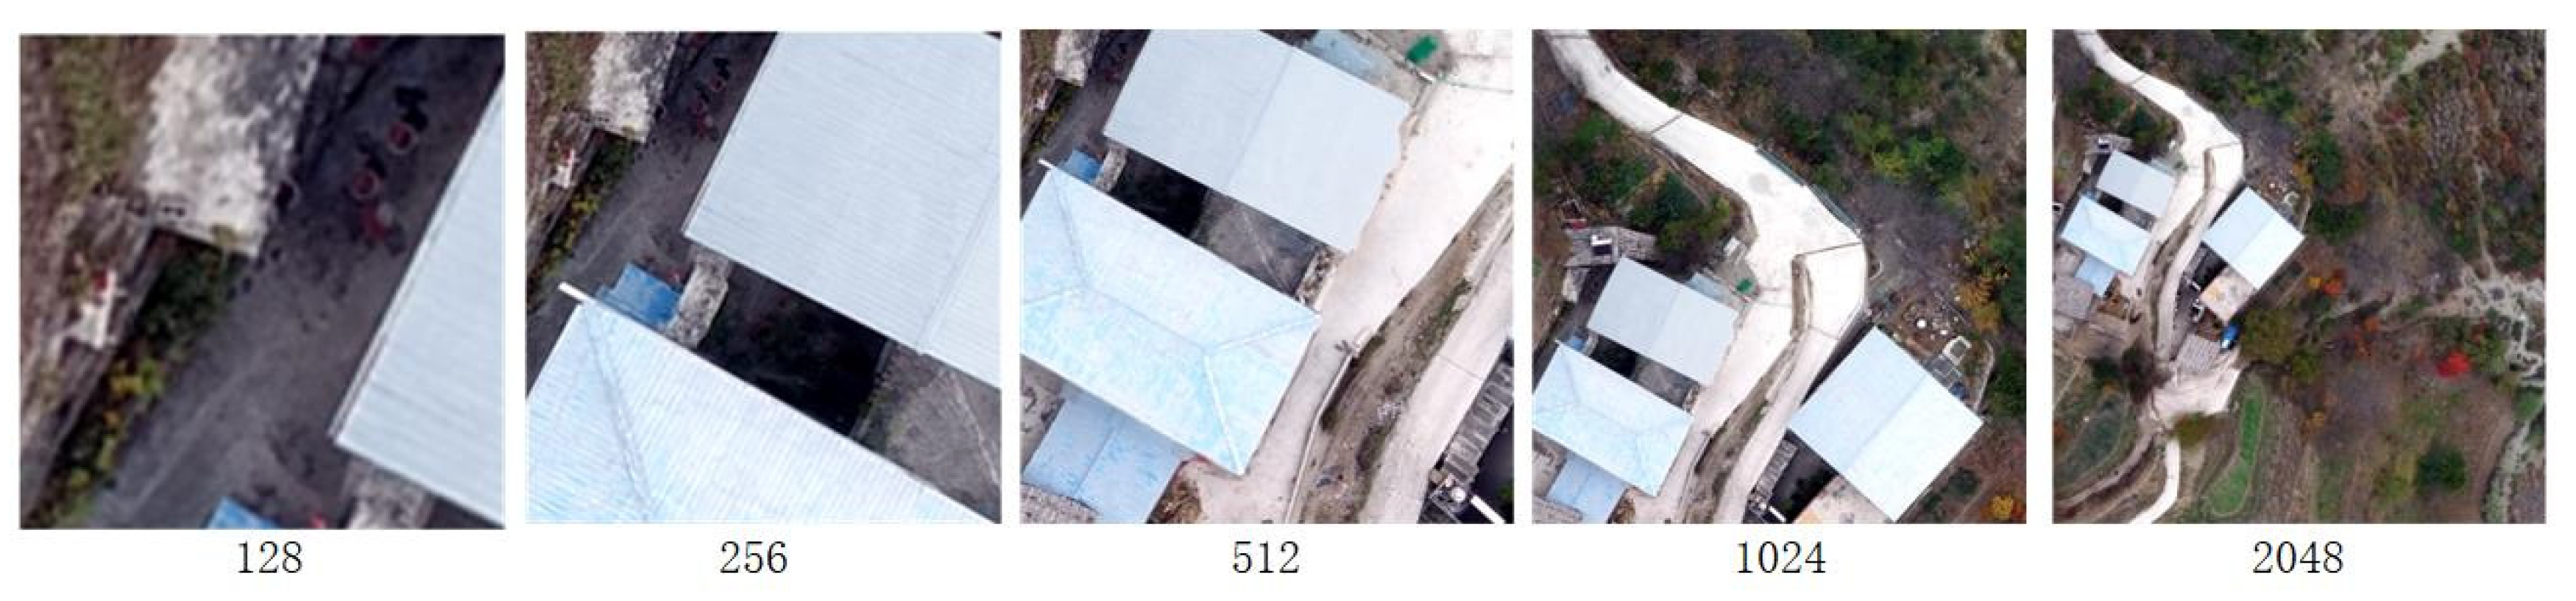
3.1.2. UAV Remote Sensing Data Preprocessing
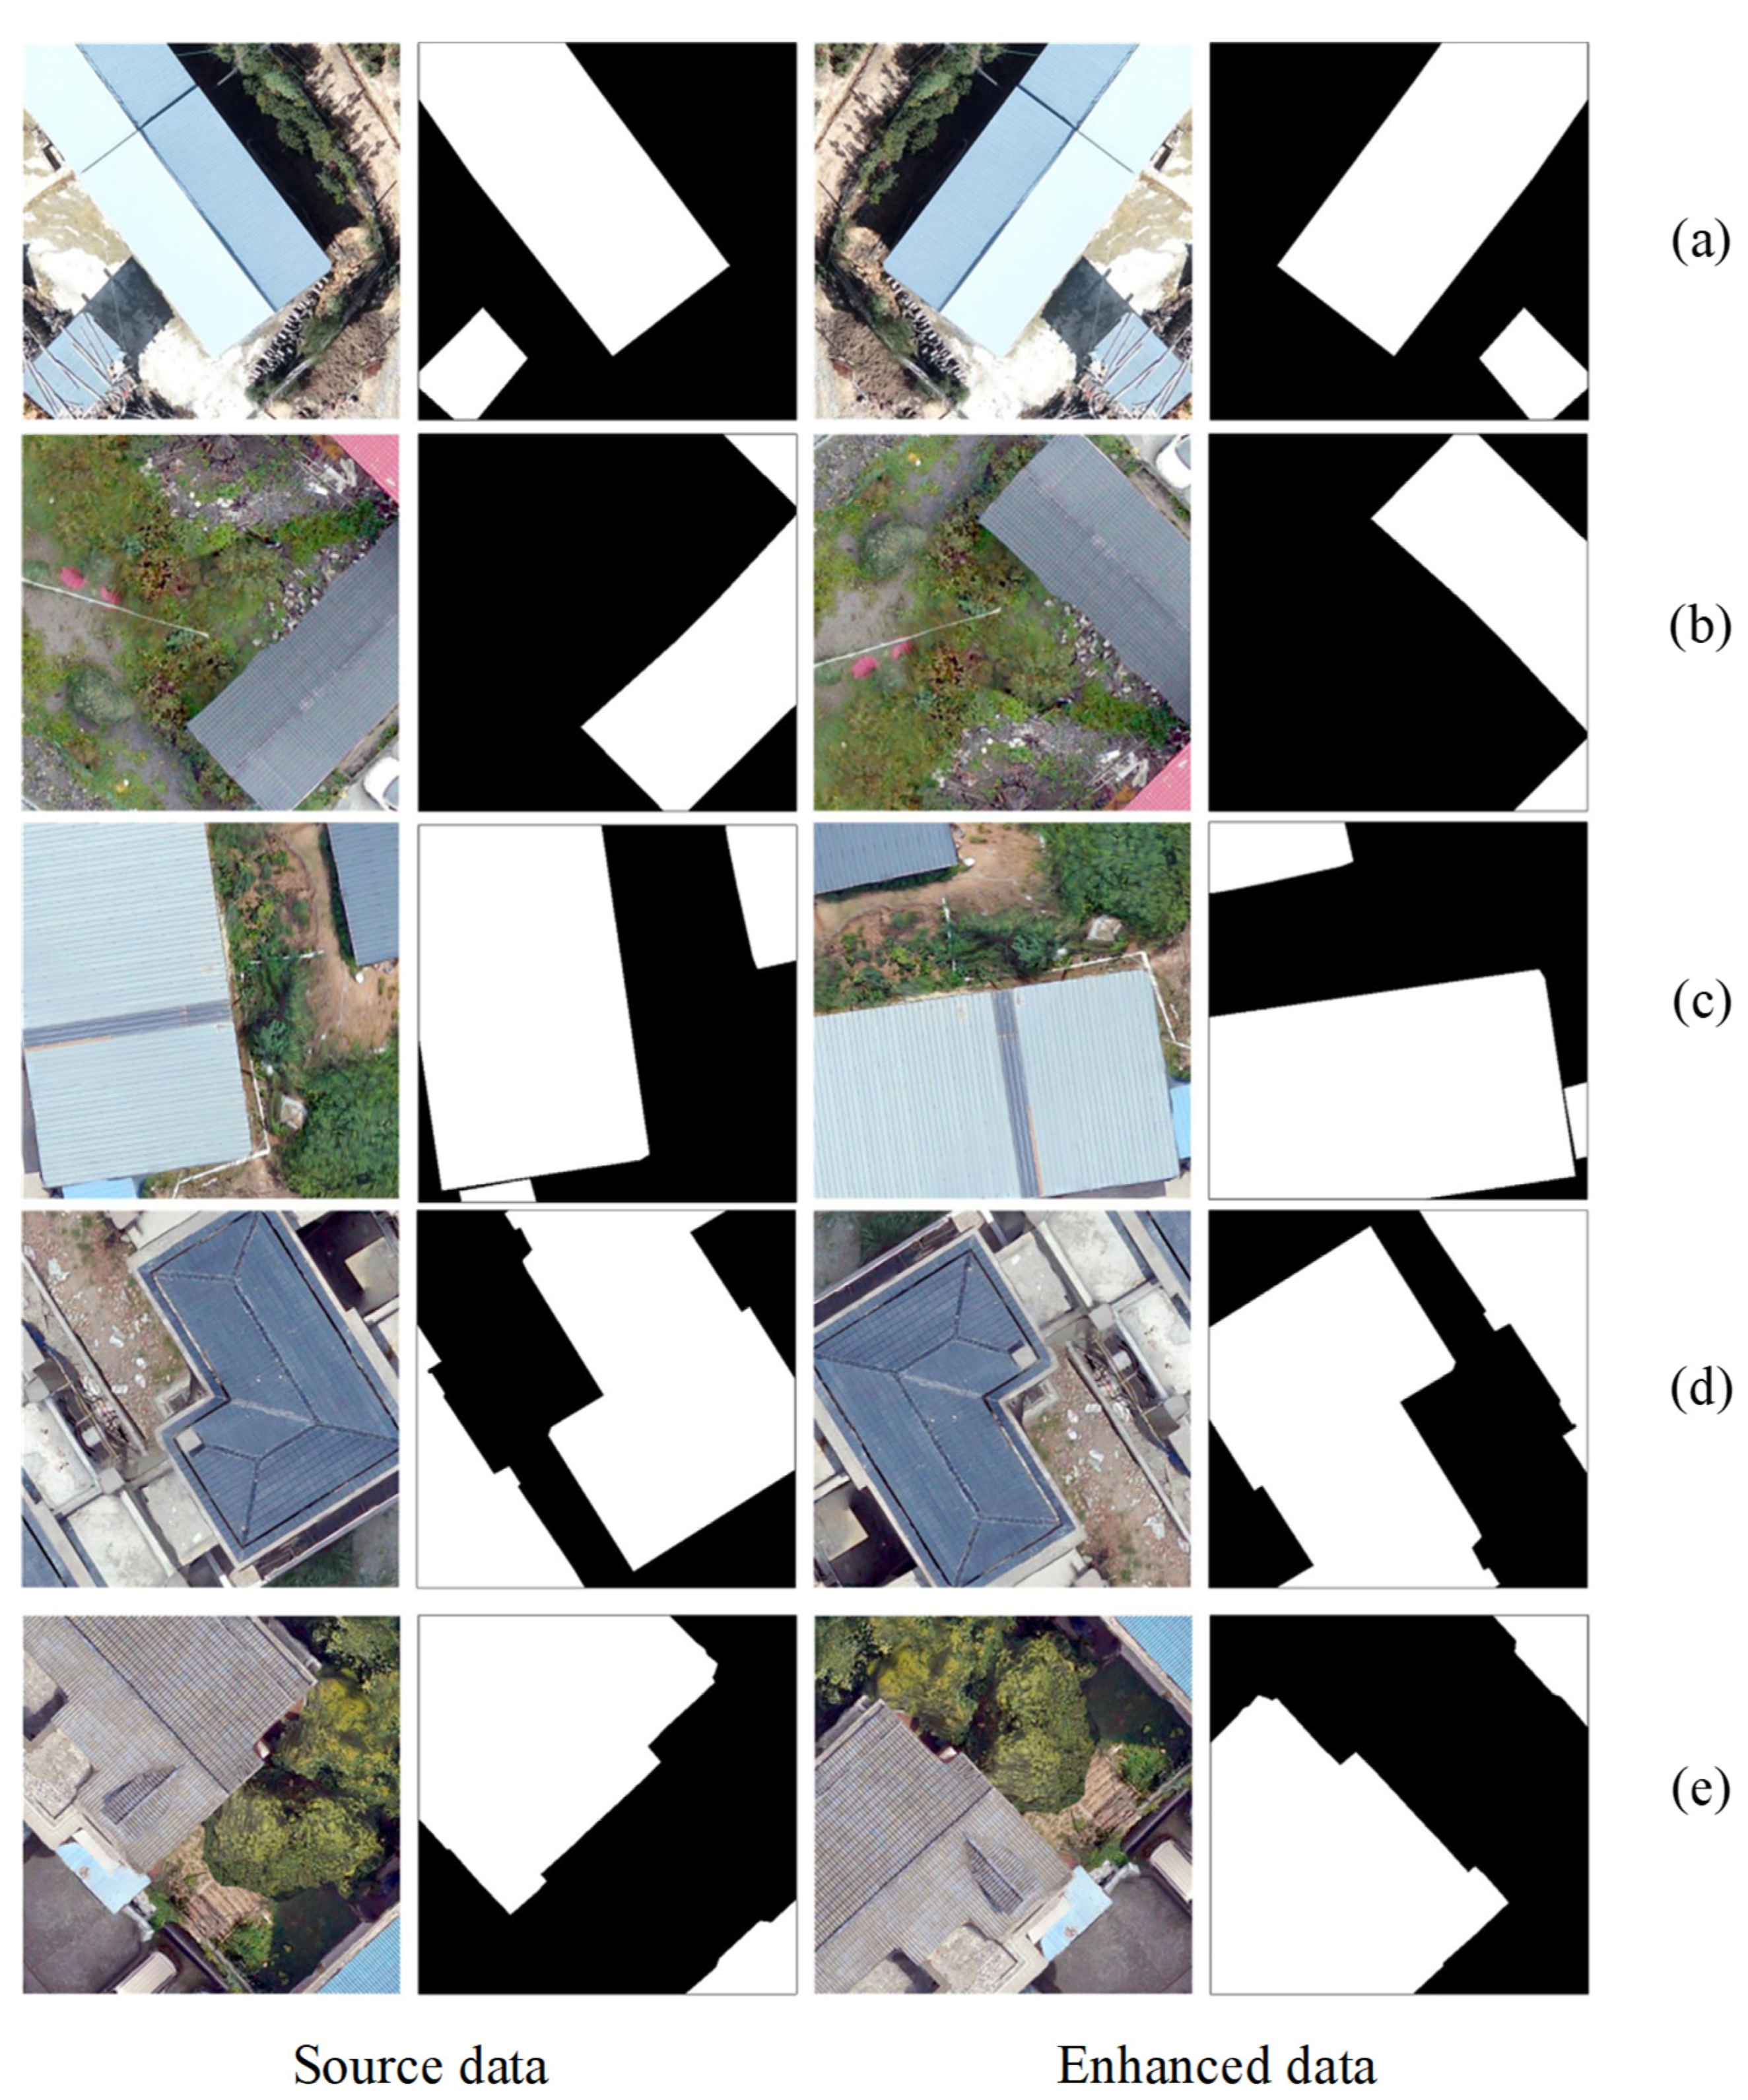
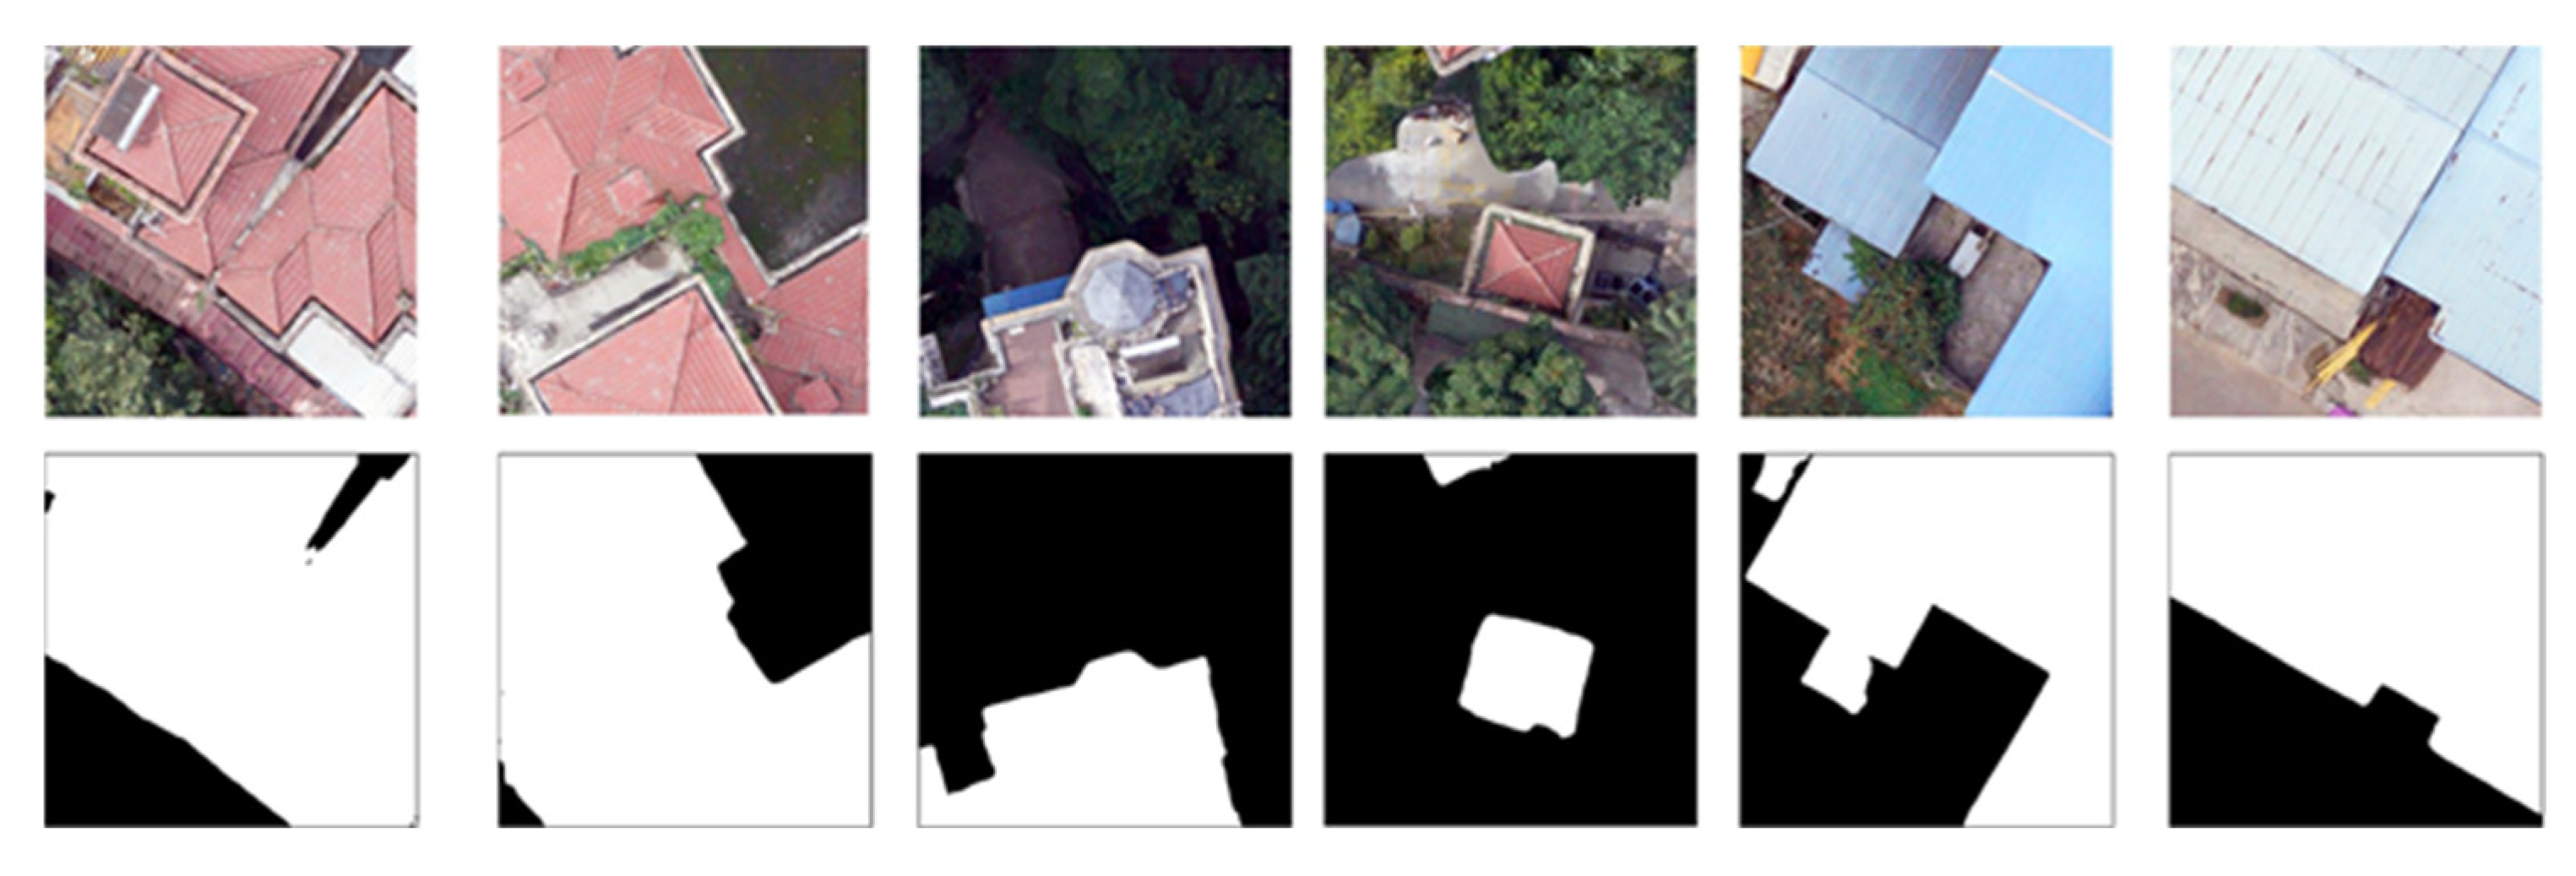
3.2. Create Deep Learning Datasets
4. Methods
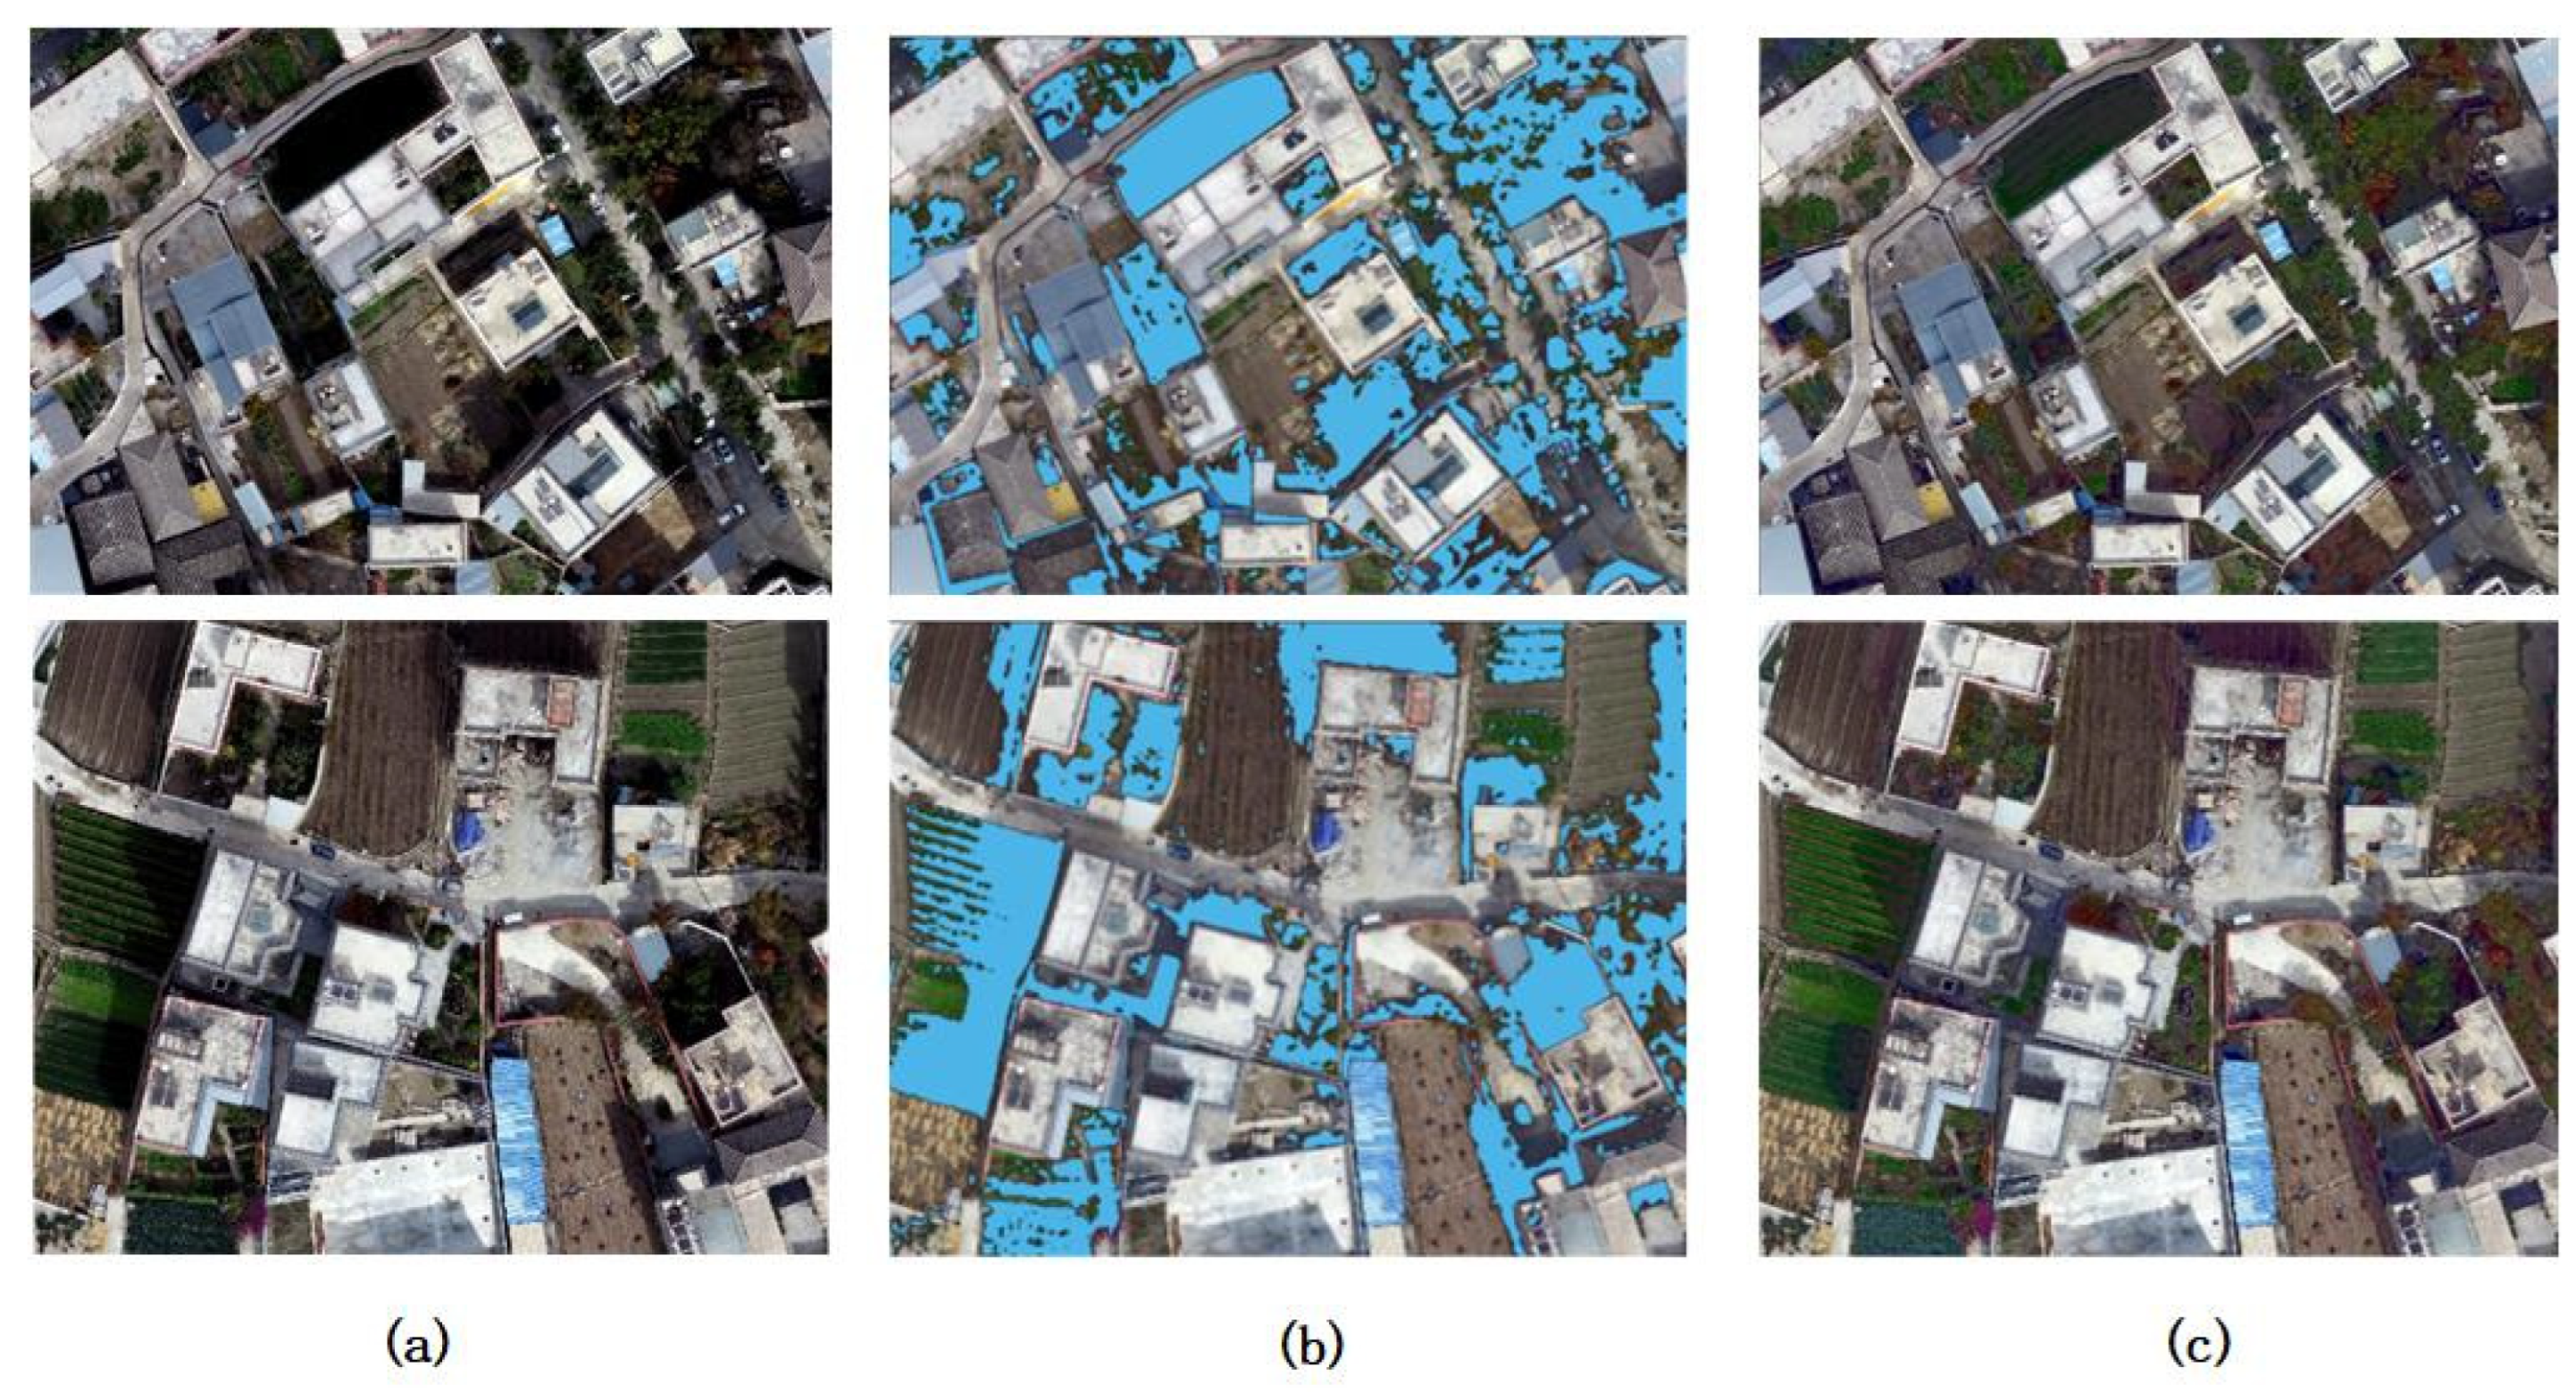
4.1. Shadow Processing of Remote Sensing Image Based on Multi-Feature Fusion
4.2. Segmentation Model
4.2.1. FNC
4.2.2. UNet
4.2.3. DANet
4.2.4. Deeplabv3-Plus
4.2.5. UPerNet
4.2.6. Transformer
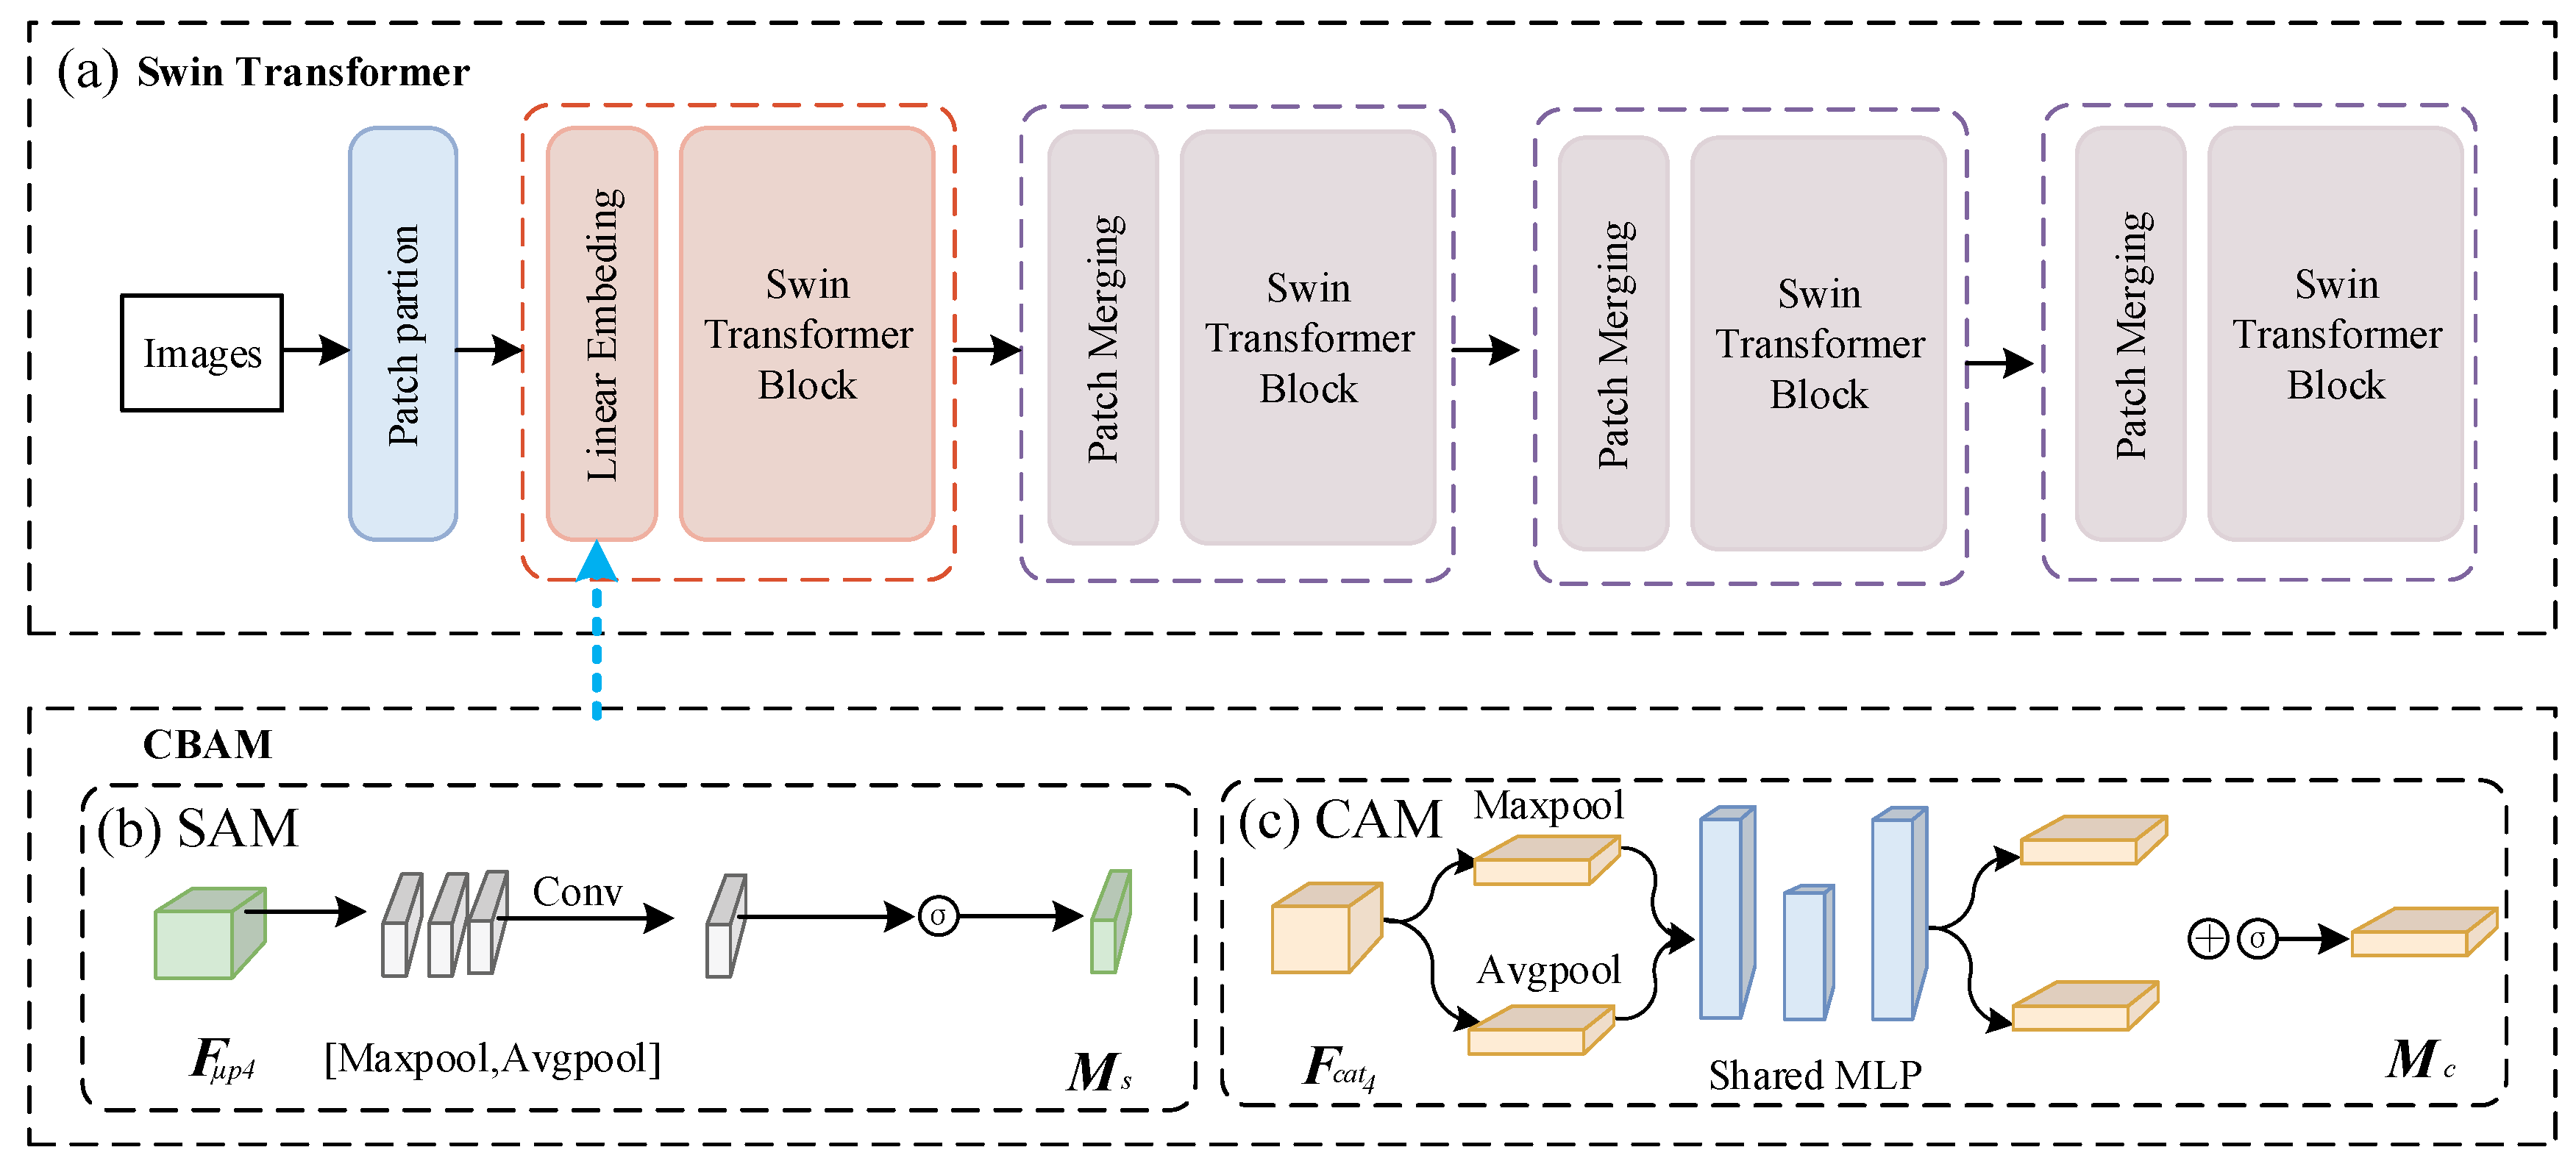
4.2.7. Swin Transformer
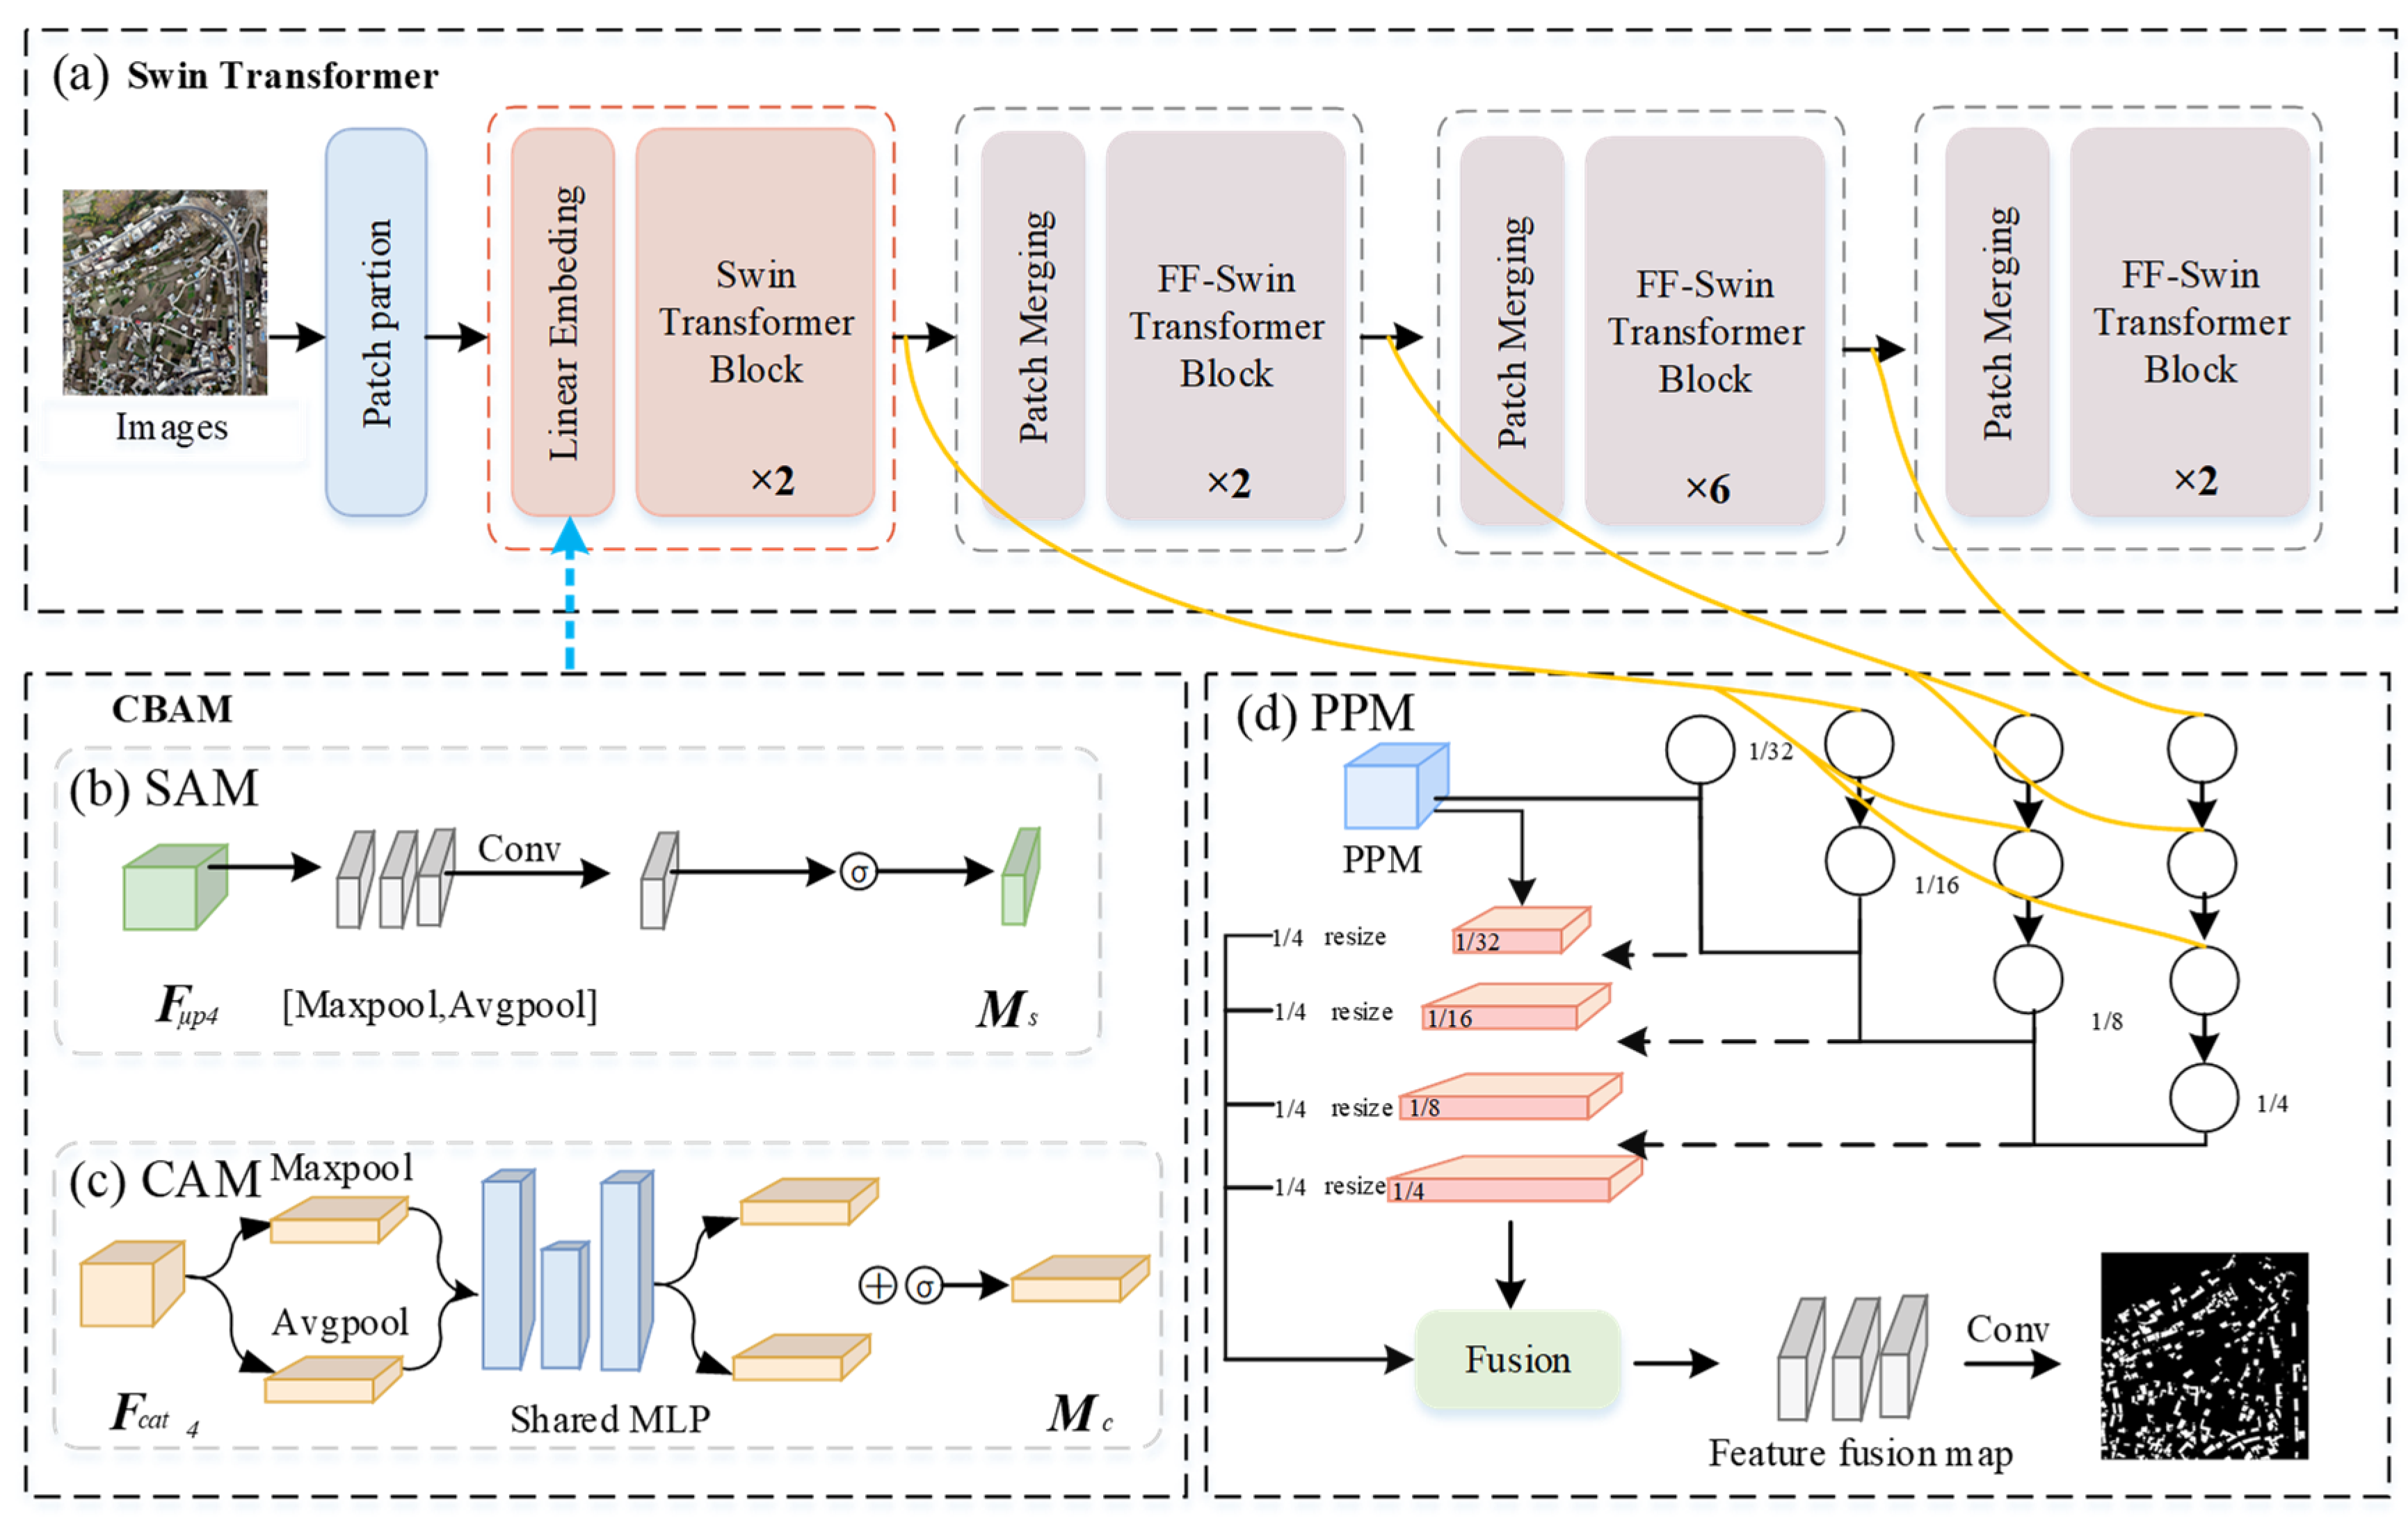
4.3. Improved Swin Transformer
4.3.1. Optimization Loss Function
4.3.2. Adaptive Cross-Dimensional Feature Fusion Improved Swin Transformer
4.3.3. Model Structure Based on Multi-Resolution Feature Fusion
5. Experimental Setup and Results Discussion
5.1. Experimental Environment and Parameters
5.2. Experimental Result
5.2.1. Image Shadow Extraction and Processing
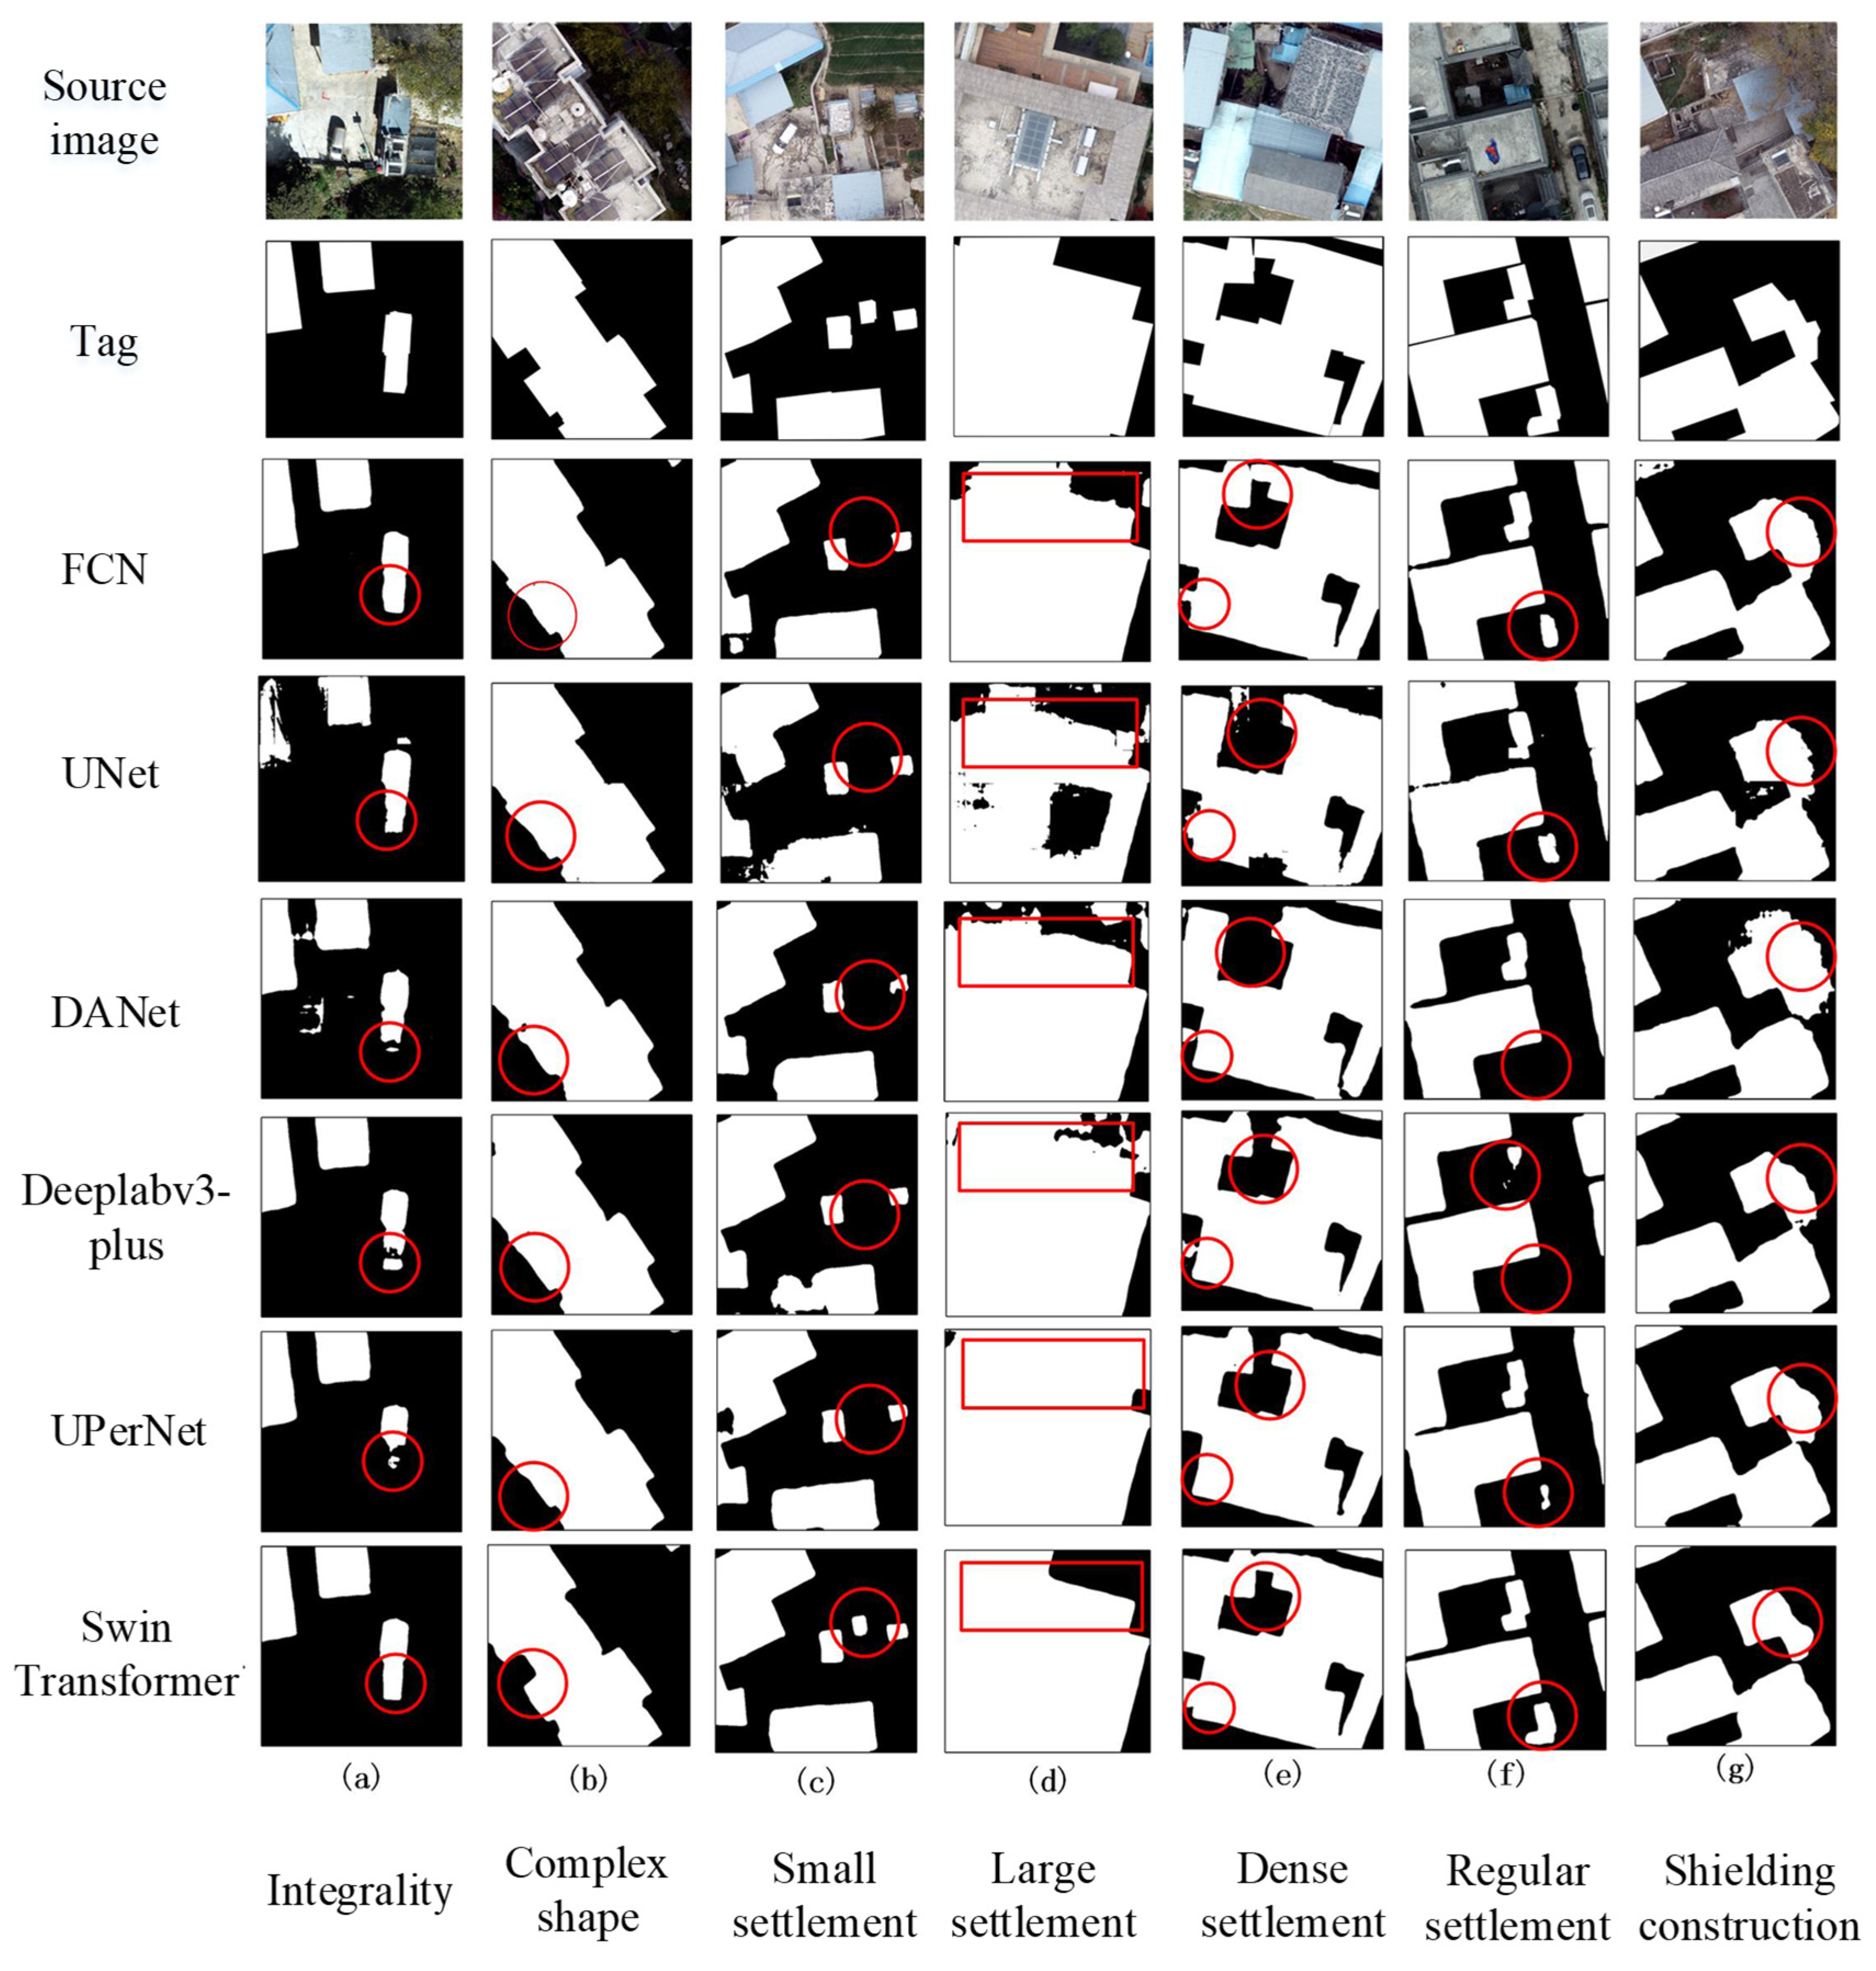
5.2.2. Evaluation of Semantic Segmentation Performance of Settlement Based on Multiple Models
5.2.3. Improved FF-SwinT Model Based on Ablation Experiment
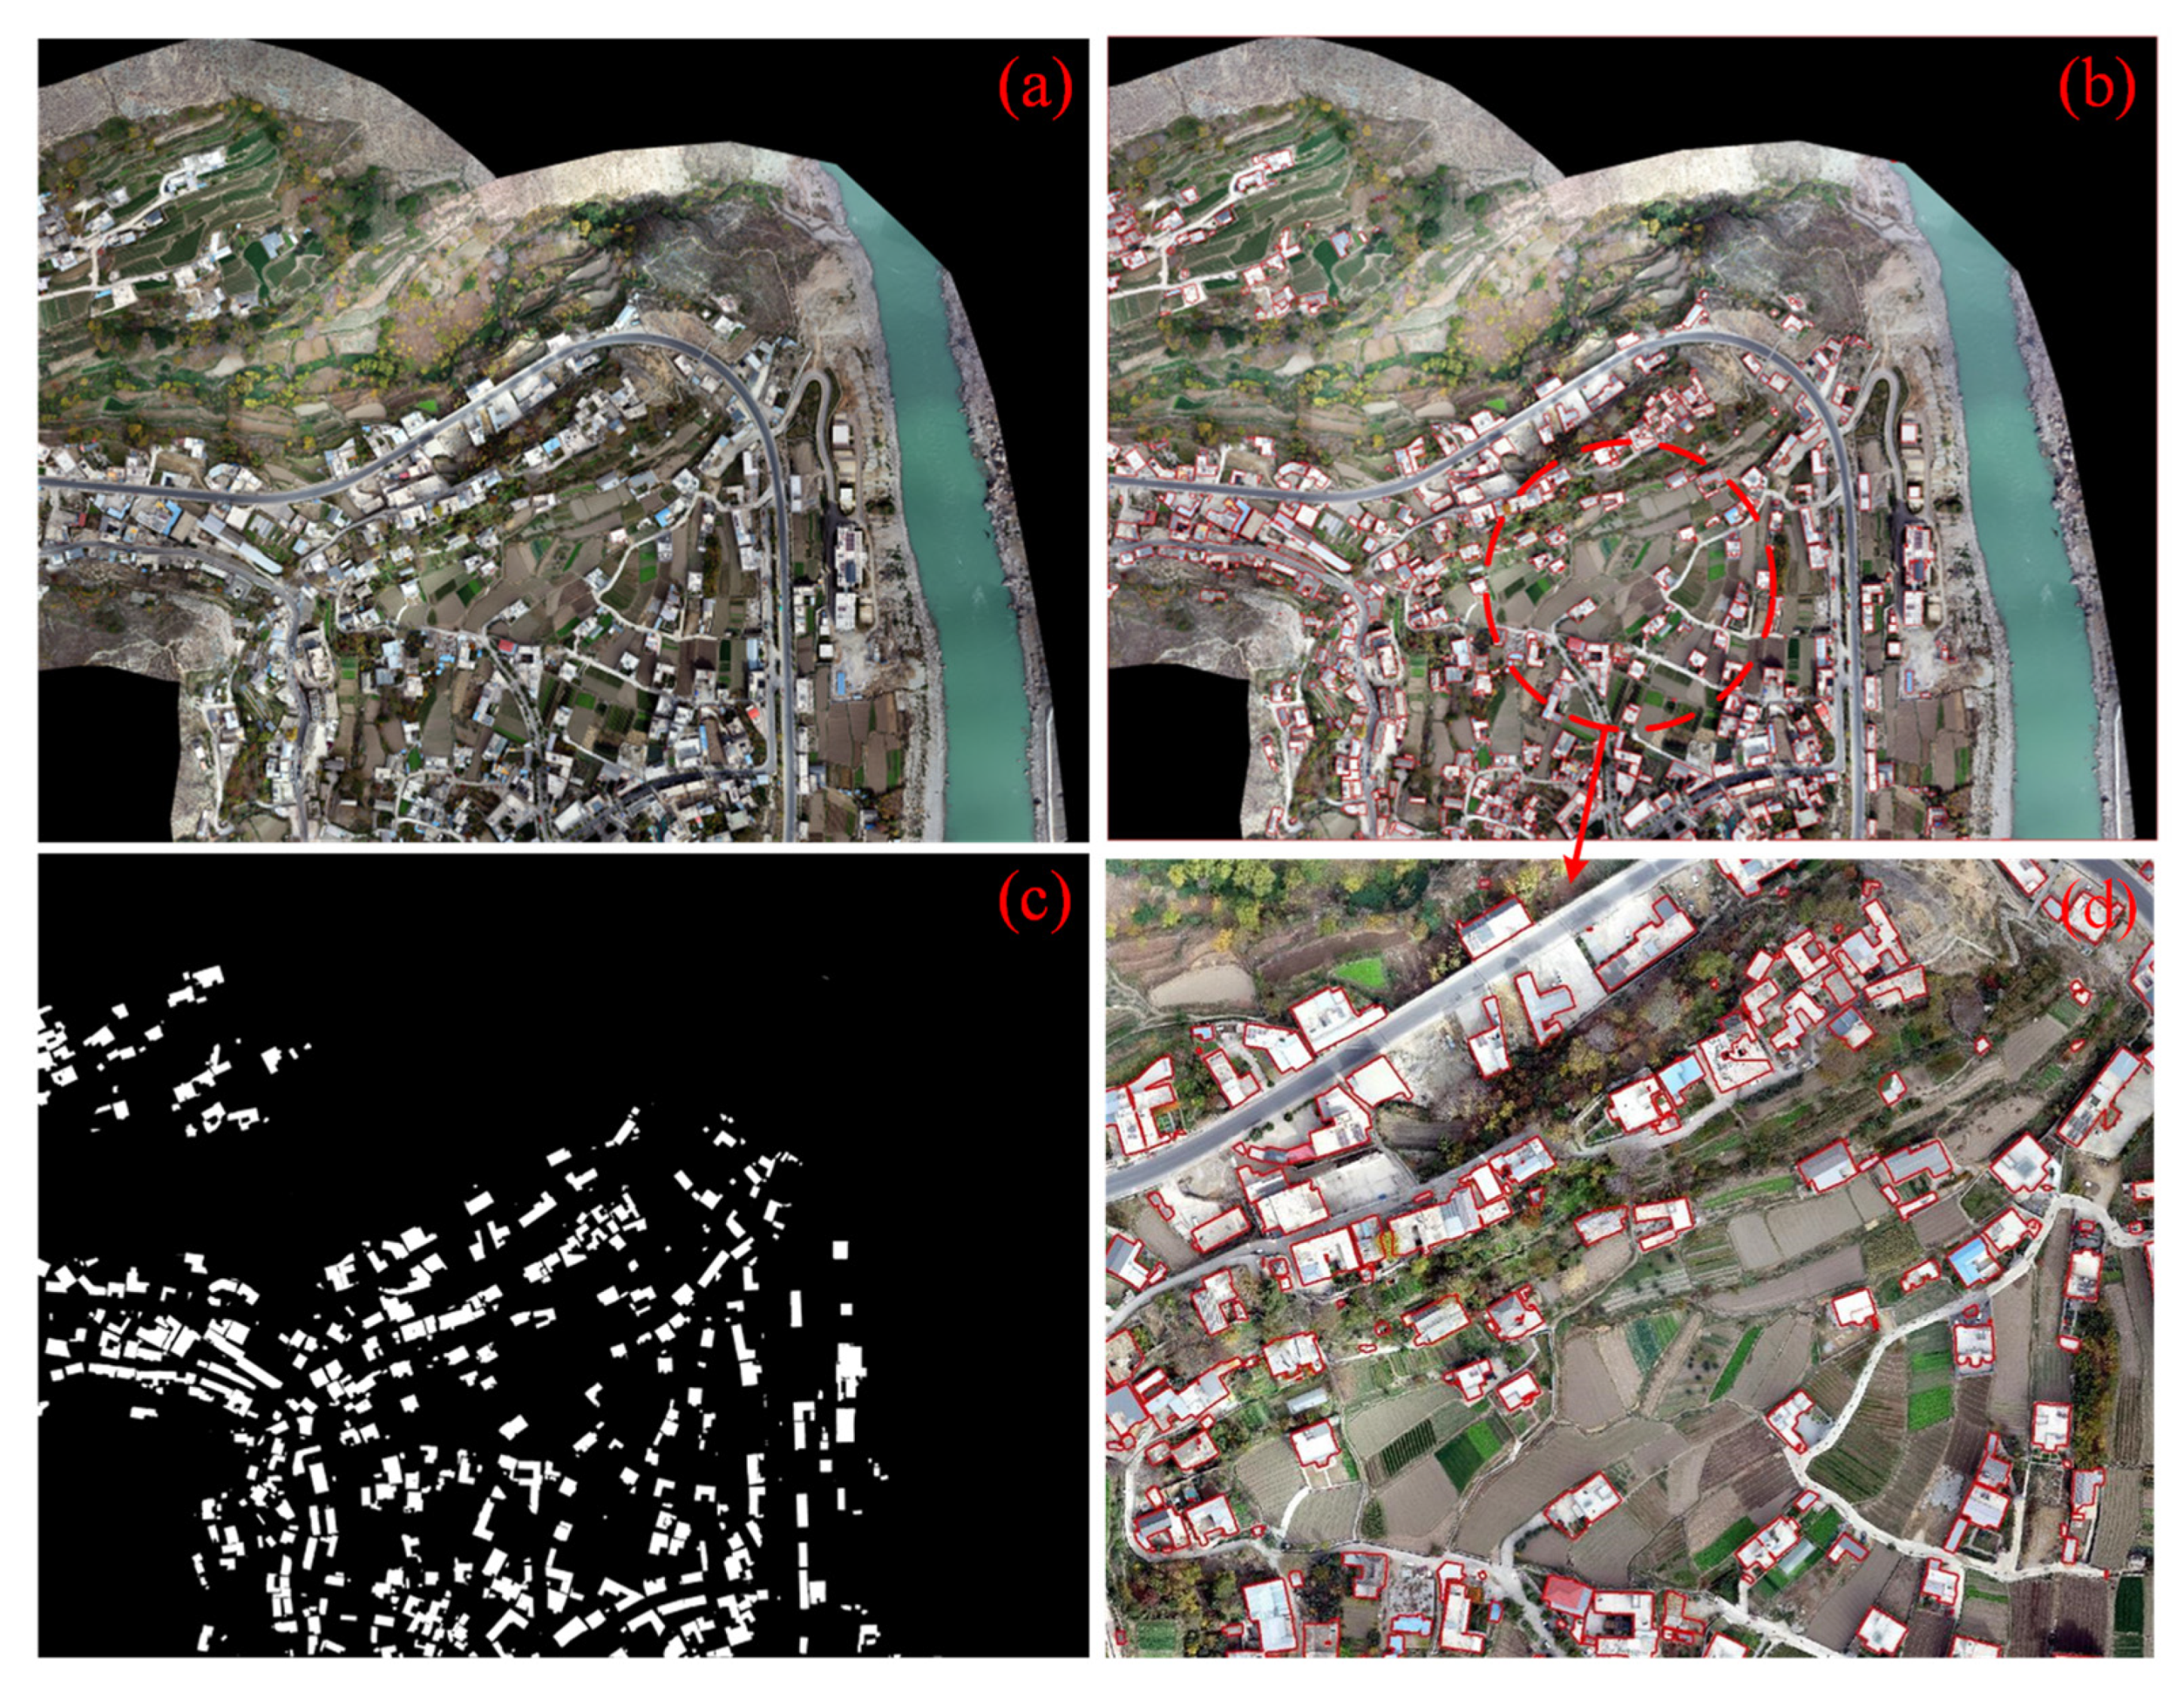
5.2.4. Cross-Regional Model Generalization Ability Verification
6. Discussion
7. Conclusions
Author Contributions
Funding
Data Availability Statement
Conflicts of Interest
References
- Macqueen, J. Some methods for classification and analysis of multivariate observations. In Proceedings of the Fifth Berkeley Symposium on Mathematical Statistics and Probability, Volume 1: Statistics, 21 June–18 July 1965 and 27 December 1965–7 January 1966; University of California Press: Berkeley, CA, USA, 1967; pp. 281–298. [Google Scholar]
- Dadashpoor, H.; Azizi, P.; Moghadasi, M. Land use change, urbanization, and change in landscape pattern in a metropolitan area. Sci. Total Environ. 2019, 655, 707–719. [Google Scholar] [CrossRef] [PubMed]
- Ispir, D.A.; Yildiz, F. Using deep learning algorithms for built-up area extraction from high-resolution GÖKTÜRK-1 satellite imagery. Earth Sci. Inform. 2025, 18, 1–18. [Google Scholar]
- Yin, Q.; Sui, X.; Ye, B.; Zhou, Y.; Li, C.; Zou, M.; Zhou, S. What role does land consolidation play in the multi-dimensional rural revitalization in China? A research synthesis. Land Use Policy 2022, 120, 106261. [Google Scholar] [CrossRef]
- Luo, F.; Huang, Z. Large area house measurement based on the UAV tilt photogrammetry: Take the survey of houses in the west of Guangzhou finance city as an example. Geotech. Investig. Surv. 2019, 47, 55–58. [Google Scholar]
- Yu, M.; Zhou, F.; Xu, H.; Xu, S. Advancing Rural Building Extraction via Diverse Dataset Construction and Model Innovation with Attention and Context Learning. Appl. Sci. 2023, 13, 13149. [Google Scholar] [CrossRef]
- Huang, X.; Yuan, W.; Li, J.; Zhang, L. A new building extraction postprocessing framework for high-spatial-resolution remote-sensing imagery. IEEE J. Sel. Top. Appl. Earth Obs. Remote Sens. 2016, 10, 654–668. [Google Scholar] [CrossRef]
- Guo, Z.; Du, S. Mining parameter information for building extraction and change detection with very high-resolution imagery and GIS data. GIScience Remote Sens. 2017, 54, 38–63. [Google Scholar] [CrossRef]
- Lee, D.H.; Lee, K.M.; Lee, S.U. Fusion of lidar and imagery for reliable building extraction. Photogramm. Eng. Remote Sens. 2008, 74, 215–225. [Google Scholar] [CrossRef]
- Toth, C.; Jóźków, G. Remote sensing platforms and sensors: A survey. ISPRS J. Photogramm. Remote Sens. 2016, 115, 22–36. [Google Scholar] [CrossRef]
- Ma, Y.; Wu, H.; Wang, L.; Huang, B.; Ranjan, R.; Zomaya, A.; Jie, W. Remote sensing big data computing: Challenges and opportunities. Future Gener. Comput. Syst. 2015, 51, 47–60. [Google Scholar] [CrossRef]
- Hoeser, T.; Kuenzer, C. Object detection and image segmentation with deep learning on earth observation data: A review-part i: Evolution and recent trends. Remote Sens. 2020, 12, 1667. [Google Scholar] [CrossRef]
- Krizhevsky, A.; Sutskever, I.; Hinton, G.E. Imagenet classification with deep convolutional neural networks. Commun. ACM 2017, 60, 84–90. [Google Scholar] [CrossRef]
- Szegedy, C.; Liu, W.; Jia, Y.; Sermanet, P.; Reed, S.; Anguelov, D. Going deeper with convolutions. In Proceedings of the IEEE Conference on Computer Vision and Pattern Recognition, Boston, MA, USA, 7–12 June 2015; pp. 1–9. [Google Scholar]
- He, K.; Zhang, X.; Ren, S.; Sun, J. Deep residual learning for image recognition. In Proceedings of the IEEE Conference on Computer Vision and Pattern Recognition, Las Vegas, NV, USA, 27–30 June 2016; pp. 770–778. [Google Scholar]
- Zhao, W.; Du, S.; Wang, Q.; Emery, W.J. Contextually guided very-high-resolution imagery classification with semantic segments. ISPRS J. Photogramm. Remote Sens. 2017, 132, 48–60. [Google Scholar] [CrossRef]
- Hamaguchi, R.; Fujita, A.; Nemoto, K.; Imaizumi, T.; Hikosaka, S. Effective use of dilated convolutions for segmenting small object instances in remote sensing imagery. In Proceedings of the 2018 IEEE Winter Conference on Applications of Computer Vision (WACV), Lake Tahoe, NV, USA, 12–15 March 2018; pp. 1442–1450. [Google Scholar]
- Fu, G.; Liu, C.; Zhou, R.; Sun, T.; Zhang, Q. Classification for high resolution remote sensing imagery using a fully convolutional network. Remote Sens. 2017, 9, 498. [Google Scholar] [CrossRef]
- Long, J.; Shelhamer, E.; Darrell, T. Fully convolutional networks for semantic segmentation. In Proceedings of the IEEE Conference on Computer Vision and Pattern Recognition, Boston, MA, USA, 7–12 June 2015; pp. 3431–3440. [Google Scholar]
- Ronneberger, O.; Fischer, P.; Brox, T. U-net: Convolutional networks for biomedical image segmentation. In Proceedings of the Medical Image Computing and Computer-Assisted Intervention–MICCAI 2015: 18th International Conference, Munich, Germany, 5–9 October 2015; Part III 18. pp. 234–241. [Google Scholar]
- Chen, L.-C.; Zhu, Y.; Papandreou, G.; Schroff, F.; Adam, H. Encoder-decoder with atrous separable convolution for semantic image segmentation. In Proceedings of the European Conference on Computer Vision (ECCV), Munich, Germany, 8–14 September 2018; pp. 801–818. [Google Scholar]
- Wang, R.; Jiang, H.; Li, Y. UPerNet with ConvNeXt for Semantic Segmentation. In Proceedings of the 2023 IEEE 3rd International Conference on Electronic Technology, Communication and Information (ICETCI), Changchun, China, 26–28 May 2023; pp. 764–769. [Google Scholar]
- Chen, P.; Lin, J.; Zhao, Q.; Zhou, L.; Yang, T.; Huang, X.; Wu, J. ADF-Net: An Attention-Guided Dual-Branch Fusion Network for Building Change Detection near the Shanghai Metro Line Using Sequences of TerraSAR-X Images. Remote Sens. 2024, 16, 1070. [Google Scholar] [CrossRef]
- Liu, Z.; Lin, Y.; Cao, Y.; Hu, H.; Wei, Y.; Zhang, Z.; Lin, S.; Guo, B. Swin transformer: Hierarchical vision transformer using shifted windows. In Proceedings of the IEEE/CVF International Conference on Computer Vision, Montreal, QC, Canada, 10–17 October 2021; pp. 10012–10022. [Google Scholar]
- Landabaso, J.; Pardas, M.; Xu, L. Shadow removal with blob-based morphological reconstruction for error correction. In Proceedings of the (ICASSP ’05), IEEE International Conference on Acoustics, Speech, and Signal Processing, Philadelphia, PA, USA, 23–23 March 2005. [Google Scholar]
- Ashourloo, D.; Nematollahi, H.; Huete, A.; Aghighi, H.; Azadbakht, M.; Shahrabi, H.S.; Goodarzdashti, S. A new phenology-based method for mapping wheat and barley using time-series of Sentinel-2 images. Remote Sens. Environ. 2022, 280, 113206. [Google Scholar] [CrossRef]
- Cao, H.; Wang, Y.; Chen, J.; Jiang, D.; Zhang, X.; Tian, Q.; Wang, M. In Swin-unet: Unet-like pure transformer for medical image segmentation. In Proceedings of the European Conference on Computer Vision, Tel Aviv, Israel, 23–27 October 2022; pp. 205–218. [Google Scholar]
- Fu, J.; Liu, J.; Tian, H.; Li, Y.; Bao, Y.; Fang, Z.; Lu, H. Dual attention network for scene segmentation. In Proceedings of the IEEE/CVF Conference on Computer Vision and Pattern Recognition, Long Beach, CA, USA, 16–17 June 2019; pp. 3146–3154. [Google Scholar]
- Dai, J.; Qi, H.; Xiong, Y.; Li, Y.; Zhang, G.; Hu, H.; Wei, Y. Deformable convolutional networks. In Proceedings of the IEEE International Conference on Computer Vision, Venice, Italy, 22–29 October 2017; pp. 764–773. [Google Scholar]
- Xiao, T.; Liu, Y.; Zhou, B.; Jiang, Y.; Sun, J. Unified perceptual parsing for scene understanding. In Proceedings of the European Conference on Computer Vision (ECCV), Munich, Germany, 8–14 September 2018; pp. 418–434. [Google Scholar]
- Lin, T.-Y.; Dollár, P.; Girshick, R.; He, K.; Hariharan, B.; Belongie, S. Feature pyramid networks for object detection. In Proceedings of the IEEE Conference on Computer Vision and Pattern Recognition, Honolulu, HI, USA, 21–26 July 2017; pp. 2117–2125. [Google Scholar]
- Vaswani, A.; Shazeer, N.; Parmar, N.; Parmar, N.; Uszkoreit, J.; Jones, L.; Gomez, A.N.; Kaiser, L.; Polosukhin, I. Attention is all you need. Adv. Neural Inf. Process. Syst. 2017, 30, 5998–6008. [Google Scholar]
- Guo, Q.; Wang, C.; Xiao, D.; Huang, Q. A novel multi-label pest image classifier using the modified Swin Transformer and soft binary cross entropy loss. Eng. Appl. Artif. Intell. 2023, 126, 107060. [Google Scholar] [CrossRef]
- Yuan, W.; Xu, W. MSST-Net: A multi-scale adaptive network for building extraction from remote sensing images based on swin transformer. Remote Sens. 2021, 13, 4743. [Google Scholar] [CrossRef]

| Experiment Environment | Configuration Details |
|---|---|
| Operating System | Windows 10 Professional Workstation 64-bit |
| Central Processor (CPU) | Intel Core i7-10700, 3.9 GHz (16 cores) |
| Graphics Processor (GPU) | NVIDIA GeForce RTX 2080 Super |
| RAM | 64 GB |
| Programming Language | Python 3.8 |
| Deep Learning Framework and Computing Platform | PyTorch 1.8.1 + CUDA 10.2 |
| Segmentation Models | Backbone | MIOU | mAccuracy | F1-Score |
|---|---|---|---|---|
| FCN | ResNet-101 | 88.42 | 93.66 | 90.73 |
| UNet | -- | 84.66 | 90.67 | 85.02 |
| DANet | ResNet-101 | 87.05 | 92.75 | 89.14 |
| Deeplabv3-plus | ResNet-101 | 88.35 | 93.78 | 91.11 |
| UPerNet | ResNet-101 | 88.16 | 93.26 | 89.81 |
| Swin Transformer | Swin Transformer | 91.16 | 95.06 | 94.91 |
| Segmentation Models | Class | IOU | Accuracy |
|---|---|---|---|
| FCN | Settlement | 81.68 | 89.76 |
| Background | 95.16 | 97.56 | |
| UNet | Settlement | 75.72 | 84.05 |
| Background | 93.61 | 97.29 | |
| DaNet | Settlement | 79.54 | 94.57 |
| Background | 88.17 | 97.32 | |
| Deeplabv3-plus | Settlement | 81.60 | 90.14 |
| Background | 95.11 | 97.42 | |
| UPerNet | Settlement | 81.24 | 88.83 |
| Background | 95.08 | 97.70 | |
| Swin Transformer | Settlement | 86.97 | 92.21 |
| Background | 95.35 | 97.92 |
| Experiment Group | MIOU | mAccuracy | F1 |
|---|---|---|---|
| Swin Transformer | 91.16 | 95.06 | 94.91 |
| Swin Transformer + A | 91.30 | 95.89 | 95.98 |
| Swin Transformer + A + B | 91.83 | 96.01 | 95.96 |
| Swin Transformer + A + B + C | 92.66 | 96.22 | 96.17 |
| FF-SwinT | 93.30 | 96.72 | 96.68 |
| Experiment Group | Class | IOU | Accuracy |
|---|---|---|---|
| Swin Transformer | Settlement | 86.97 | 92.21 |
| Background | 95.35 | 97.92 | |
| Swin Transformer + A | Settlement | 87.28 | 94.73 |
| Background | 95.31 | 97.05 | |
| Swin Transformer + A + B | Settlement | 88.05 | 94.75 |
| Background | 95.62 | 97.28 | |
| Swin Transformer + A + B + C | Settlement | 89.2 | 94.8 |
| Background | 96.12 | 97.64 | |
| FF-SwinT | Settlement | 90.15 | 95.5 |
| Background | 96.45 | 97.95 |
Disclaimer/Publisher’s Note: The statements, opinions and data contained in all publications are solely those of the individual author(s) and contributor(s) and not of MDPI and/or the editor(s). MDPI and/or the editor(s) disclaim responsibility for any injury to people or property resulting from any ideas, methods, instructions or products referred to in the content. |
© 2025 by the authors. Licensee MDPI, Basel, Switzerland. This article is an open access article distributed under the terms and conditions of the Creative Commons Attribution (CC BY) license (https://creativecommons.org/licenses/by/4.0/).
Share and Cite
Luan, G.; Luo, J.; Gao, Z.; Zhao, F. Accurate Extraction of Rural Residential Buildings in Alpine Mountainous Areas by Combining Shadow Processing with FF-SwinT. Remote Sens. 2025, 17, 2463. https://doi.org/10.3390/rs17142463
Luan G, Luo J, Gao Z, Zhao F. Accurate Extraction of Rural Residential Buildings in Alpine Mountainous Areas by Combining Shadow Processing with FF-SwinT. Remote Sensing. 2025; 17(14):2463. https://doi.org/10.3390/rs17142463
Chicago/Turabian StyleLuan, Guize, Jinxuan Luo, Zuyu Gao, and Fei Zhao. 2025. "Accurate Extraction of Rural Residential Buildings in Alpine Mountainous Areas by Combining Shadow Processing with FF-SwinT" Remote Sensing 17, no. 14: 2463. https://doi.org/10.3390/rs17142463
APA StyleLuan, G., Luo, J., Gao, Z., & Zhao, F. (2025). Accurate Extraction of Rural Residential Buildings in Alpine Mountainous Areas by Combining Shadow Processing with FF-SwinT. Remote Sensing, 17(14), 2463. https://doi.org/10.3390/rs17142463