Abstract
Infrared small target detection (IRSTD) aims to locate and separate targets from complex backgrounds. The challenges in IRSTD primarily come from extremely sparse target features and strong background clutter interference. However, existing methods typically perform discrimination directly on the features extracted by deep networks, neglecting the distinct characteristics of weak and small targets in the frequency domain, thereby limiting the improvement of detection capability. In this paper, we propose a frequency-aware masked-attention network (FM-Net) that leverages multi-scale frequency clues to assist in representing global context and suppressing noise interference. Specifically, we design the wavelet residual block (WRB) to extract multi-scale spatial and frequency features, which introduces a wavelet pyramid as the intermediate layer of the residual block. Then, to perceive global information on the long-range skip connections, a frequency-modulation masked-attention module (FMM) is used to interact with multi-layer features from the encoder. FMM contains two crucial elements: (a) a mask attention (MA) mechanism for injecting broad contextual feature efficiently to promote full-level semantic correlation and focus on salient regions, and (b) a channel-wise frequency modulation module (CFM) for enhancing the most informative frequency components and suppressing useless ones. Extensive experiments on three benchmark datasets (e.g., SIRST, NUDT-SIRST, IRSTD-1k) demonstrate that FM-Net achieves superior detection performance.
1. Introduction
Infrared small target detection (IRSTD) is an advanced technology in civil and military applications, such as early warning system [1], anti-drone [2], traffic monitoring [3], remote sensing [4] and so on. Since the detection platform is far away from targets and the imaging mechanism of infrared sensors is special, there are some difficulties that need to be addressed due to the following target characteristics.
- Sparse intrinsic features. Infrared targets typically occupy an extremely small number of pixels and thus lack shape and texture features.
- Low contrast. Infrared imaging relies on radiation energy of scenes, resulting in lacking color information. The boundary between targets and background is highly indistinct, so the saliency is unobvious.
- Dense clutter in complex scenes. There is heavy clutter and noise in the scenes with similar energy and structure as targets, which makes it difficult for high-precision separation.
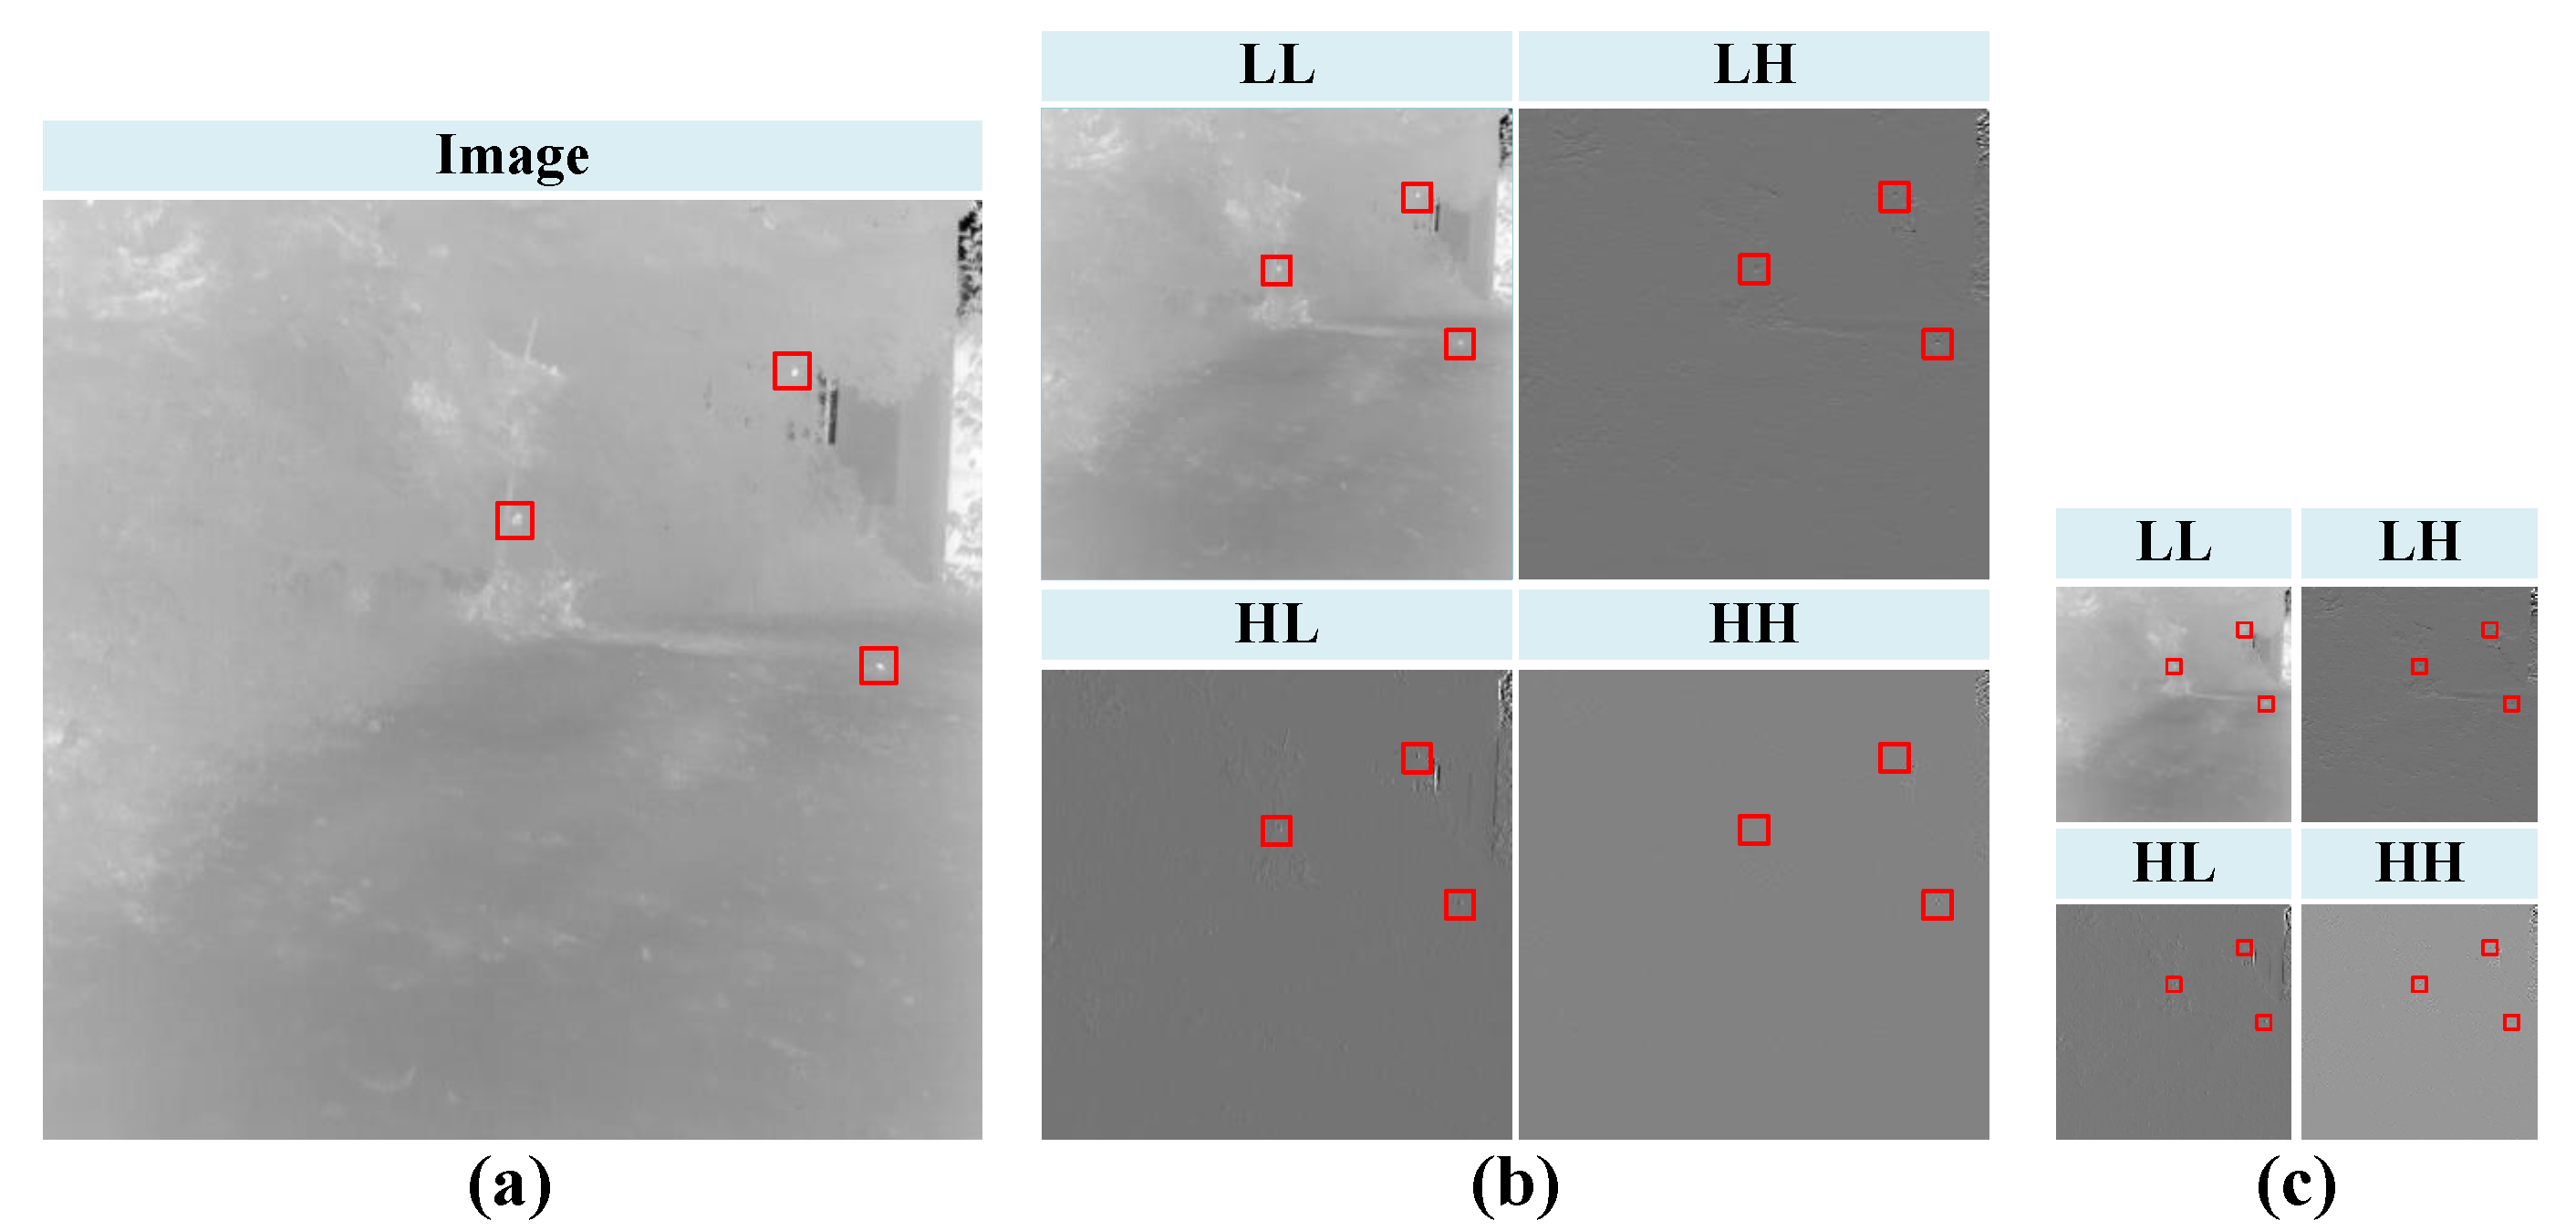
Traditional IRSTD methods are model-driven and include three categories: filter-based methods [5,6], local-contrast-based methods [7,8] and low-rank-based methods [9,10,11]. Traditional detection methods rely heavily on prior knowledge and fine-tuned hyper-parameter. They lack flexibility and generalization when processing complex real scenes with changeable targets. In recent years, deep learning-based methods have been widely studied in IRSTD, which has promoted the rapid development of detection technology [12,13]. The convolutional neural network is the mainstream method and plays an important role [14,15,16]. Leveraging the advantage of feature fusion strategies and nested structure, Li et al. [17] proposed the dense nested attention network (DNANet) to extract and maintain target features in deep layers. Further, UIU-Net [18] built a powerful backbone through embedding a tiny UNet into a larger UNet, which implemented multi-level and multi-scale representation learning. Despite achieving promising performance, CNN-based methods have an attention bias in processing infrared images. In order to encode global and local information, Wu et al. [19] designed a multi-level transformer–CNN hybrid structure to fully exploit the long-range dependency of tiny targets. Then, Yuan et al. [20] deeply analyzed features and found that false alarms were usually caused by inaccurate estimation of backgrounds in deep layers. So, they designed a spatial-channel cross-transformer block (SCTB) to predict the context difference between targets and backgrounds, which could achieve highly robust detection [21]. However, the methods mentioned above only extract and enhance features from the spatial domain, with additional consideration given to the channel dimension. In fact, there are many valuable clues in the frequency domain that can be utilized to improve detection performance [22,23,24,25,26]. As shown in Figure 1, edges and boundaries are distinct in high-frequency components after applying WT to an infrared image. At the same time, the low-frequency component still retains lots of spatial details of targets and background. However, the gaps between global and local features, as well as spatial and frequency features, remain inadequately addressed. It is necessary to handle the above issues for better detection performance.
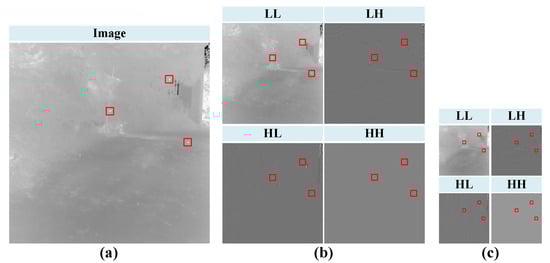
Figure 1.
Visualization of detailed structures that are salient through wavelet transform (WT). LL is approximation subband, which indicates low-frequency component. LH, HL and HH are, respectively, horizontal detail subband, vertical detail subband and diagonal detail subband. The three indicate high-frequency components. (a) Infrared image with high similarity between targets and background. (b) Apply WT to image and obtain the low-frequency and high-frequency components. (c) Apply WT again to the low-frequency component (LL) in (b) and obtain the low-frequency and high-frequency components.
In order to exploit multi-scale frequency information to solve challenges in IRSTD, we propose frequency-aware masked-attention network (FM-Net) to strengthen the complementary advantages of spatial and frequency features. Specifically, we re-design residual block by embedding wavelet transform layer in the middle, which is called wavelet residual block (WRB). WRB combines multi-layer feature extraction and attention augmentation to effectively enhance target response. WRB also has varying receptive fields to deal with changeable targets. Subsequently, we propose the frequency-modulation masked-attention module (FMM) to aggregate full scale spatial and frequency feature. The masked-attention mechanism selectively highlights salient region and introduces long-range contextual perception. The following channel-wise frequency modulation module decouples features into distinguished low-frequency and high-frequency components, which are enhanced by modulated attention. The main contributions of this paper are outlined as follows:
- This paper proposes FM-Net, which effectively integrates frequency information to promote infrared small target detection. Wavelet residual blocks (WRBs) in encoders extract multi-level frequency details in feature maps, which have larger receptive fields to perceive local contexts.
- Instead of skip connection, a frequency-modulation masked-attention module (FMM) is proposed to facilitate semantic fusion across full-scale feature and learn long-range context association of infrared images.
- Experimental results on three benchmark datasets (e.g., SIRST, IRSTD-1k, NUDT-SIRST) demonstrate that our FM-Net achieves superior detection performance.
The architecture of this paper is as follows. Section 2 mainly introduces the related works on IRSTD, frequency learning and mask attention. Section 3 analyzes our FM-Net in detail. Experimental results in sing-frame datasets are showed in Section 4. In Section 5, we discuss our work and feature studies. Lastly, Section 6 presents our conclusion.
2. Related Works
2.1. Infrared Small Target Detection
IRSTD plays a significant role in infrared search and tracking system. At the beginning of related studies, scholars have proposed many traditional methods. Top-Hat [5] and Max-Median [6] are typical filter-based methods, which adopt a specific filter to suppress background noise interference. Local-contrast-based methods, such as WSLCM [7], TLLCM [8], obtain visual saliency regions and segment pixels by threshold. Then, low-rank-based methods [9,10,11] model target detection as a mathematical optimization problem for recovering low-rank and sparse tensors. However, traditional methods depend heavily on expert knowledge and manual parameter tuning. This impairs the ability to deal with complex scenes.
Recently, deep learning-based methods are rapidly evolving in IRSTD, which can learn target representation from large amounts of data. CNNs are popular detection methods and U-Net [27] is a widely adopted framework. On this basis, many useful techniques in computer vision have been applied to design excellent detection network [14,15,16,17,18], including dense connection, nested structure, specific attention and so on. Next, considering the significance of global context, researchers add a transformer block to the CNN backbone or replace skip connections, which well suppresses background clutters [19,20,21]. Lately, some new paradigms of neural networks have also been verified on IRSTD. For example, Zhang et al. [28] redesigned the general SAM to learn better feature representation of infrared targets, addressing the low-SNR issue. From a novel perspective of the pixel movement mechanism, the computational fluid dynamic network (CFD-Net) [29] facilitates robust feature learning and improves detection performance.
Despite existing detection methods having showcased promising performance, these methods primarily extract spatial features and enhance information in the channel dimension. Direct and simple processes from the spatial domain is insufficient and easily causes false alarms. To further introduce more useful information, researchers add frequency-domain processing. Zhu et al. [22] extracted local features in image patches and adopted multi-head attention to improve low-frequency and high-frequency information. He et al. [23] firstly presented the EE module to enrich features, then frequency information was retained through downsampling and fusion with wavelet transformer. Huang at al. [24] utilized two learnable masks to extract target-specific spectra and removed background clutter by maximizing the difference in frequency characteristics. Next, to suppress high-frequency disturbances, FreqODEs [25] proposed a set of ODE convolutional modules, which contained coefficient learning to lower the risk of gradient vanishing. FACFPNet [26] used multi-head self-attention to capture multi-scale frequency features and enhance global context representation.
As we considered, existing methods still struggle to perceive multi-scale context and exploit multiple-frequency feature. Inspired by frequency learning [30,31,32,33], effective information from frequent domains can help network improve performance in vision tasks. Therefore, we explore how frequency features can effectively empower IRSTD.
2.2. Mask Attention
Mask attention is firstly proposed in Mask2Former [34], which can address universal image segmentation through a single model. Mask attention is a variant of multi-head self-attention, which is a key component that helps Mask2Former converge faster and extract localized features. Then, researchers adopted it to many tasks and its cross-domain applicability has been validated. Cheng et al. [35] integrated mask attention module in U-Net, achieving robust low-resolution image segmentation. The advantage of mask attention is that it dynamically adjusts attention maps, increasing focus on target regions. Furthermore, the attention facilitates awareness of global context while effectively fusing multi-scale features. However, the lone spatial attention mechanism leads to the loss of feature details that is crucial for IRSTD. Therefore, we design a frequency-modulation masked-attention module (FMM) by combining attention with frequency augmentation, refining fine-grained information. A detailed introduction is given in Section 3.3.
2.3. Frequency Learning on Vision Tasks
Frequency-domain analyses have been a significant tool for signal processing [36]. The technology has recently been applied in deep learning and demonstrates potential in natural image processing [30,31,32,33]. It is generally believed that detailed structures and boundaries mainly lie in high-frequency components and high-level semantic information is abundant in low-frequency components [31,37]. For feature fusion, FreqFusion [32] applied different frequency filters to increase feature consistency and make object boundary clearer. This provides a robust feature fusion scheme for dense image prediction. For feature extraction, FDConv [30] improved the frequency adaptability and diversity of parallel weights, enabling better feature capture. WTConv [33] was a new method that used wavelet transform to effectively expand the receptive field of CNN. Meanwhile, the convolutions were performed on different frequency subbands to obtain a better low-frequency response. FADC [38] adjusted dilation based on local frequency components, balancing effective bandwidth and receptive field. On the other hand, frequency learning empowers multiple tasks. For image restoration, FSNet [31] dynamically decoupled features into different subbands and selected the most useful one to recover. Then, multi-scale pooling operations performed calibration to obtain a large receptive field. For pansharpening, WFANet [39] utilized the wavelet pyramid for progressive fusion, where frequency attention triplets were designed to enhance precision and reduce information confusion. For object detection, SFS-Conv [40] employed a shunt–perceive–select frequency convolution to enhance distinctiveness. In summary, frequency learning can bring gains to solving problems in vision tasks.
In this work, we insert a wavelet pyramid into the residual block, extracting multi-scale spatial and frequency features. Furthermore, channel and spatial attention modules are further joined to capture detailed structures. Subsequently, to integrate multi-scale features across levels, we design the cascaded masked-attention and frequency-modulation module, where masked attention extracts global spatial context and the frequency-modulation module adaptively selects and enhances informational frequency features.
3. Methodology
In this section, we introduce our FM-Net in detail.
3.1. Overall Architecture
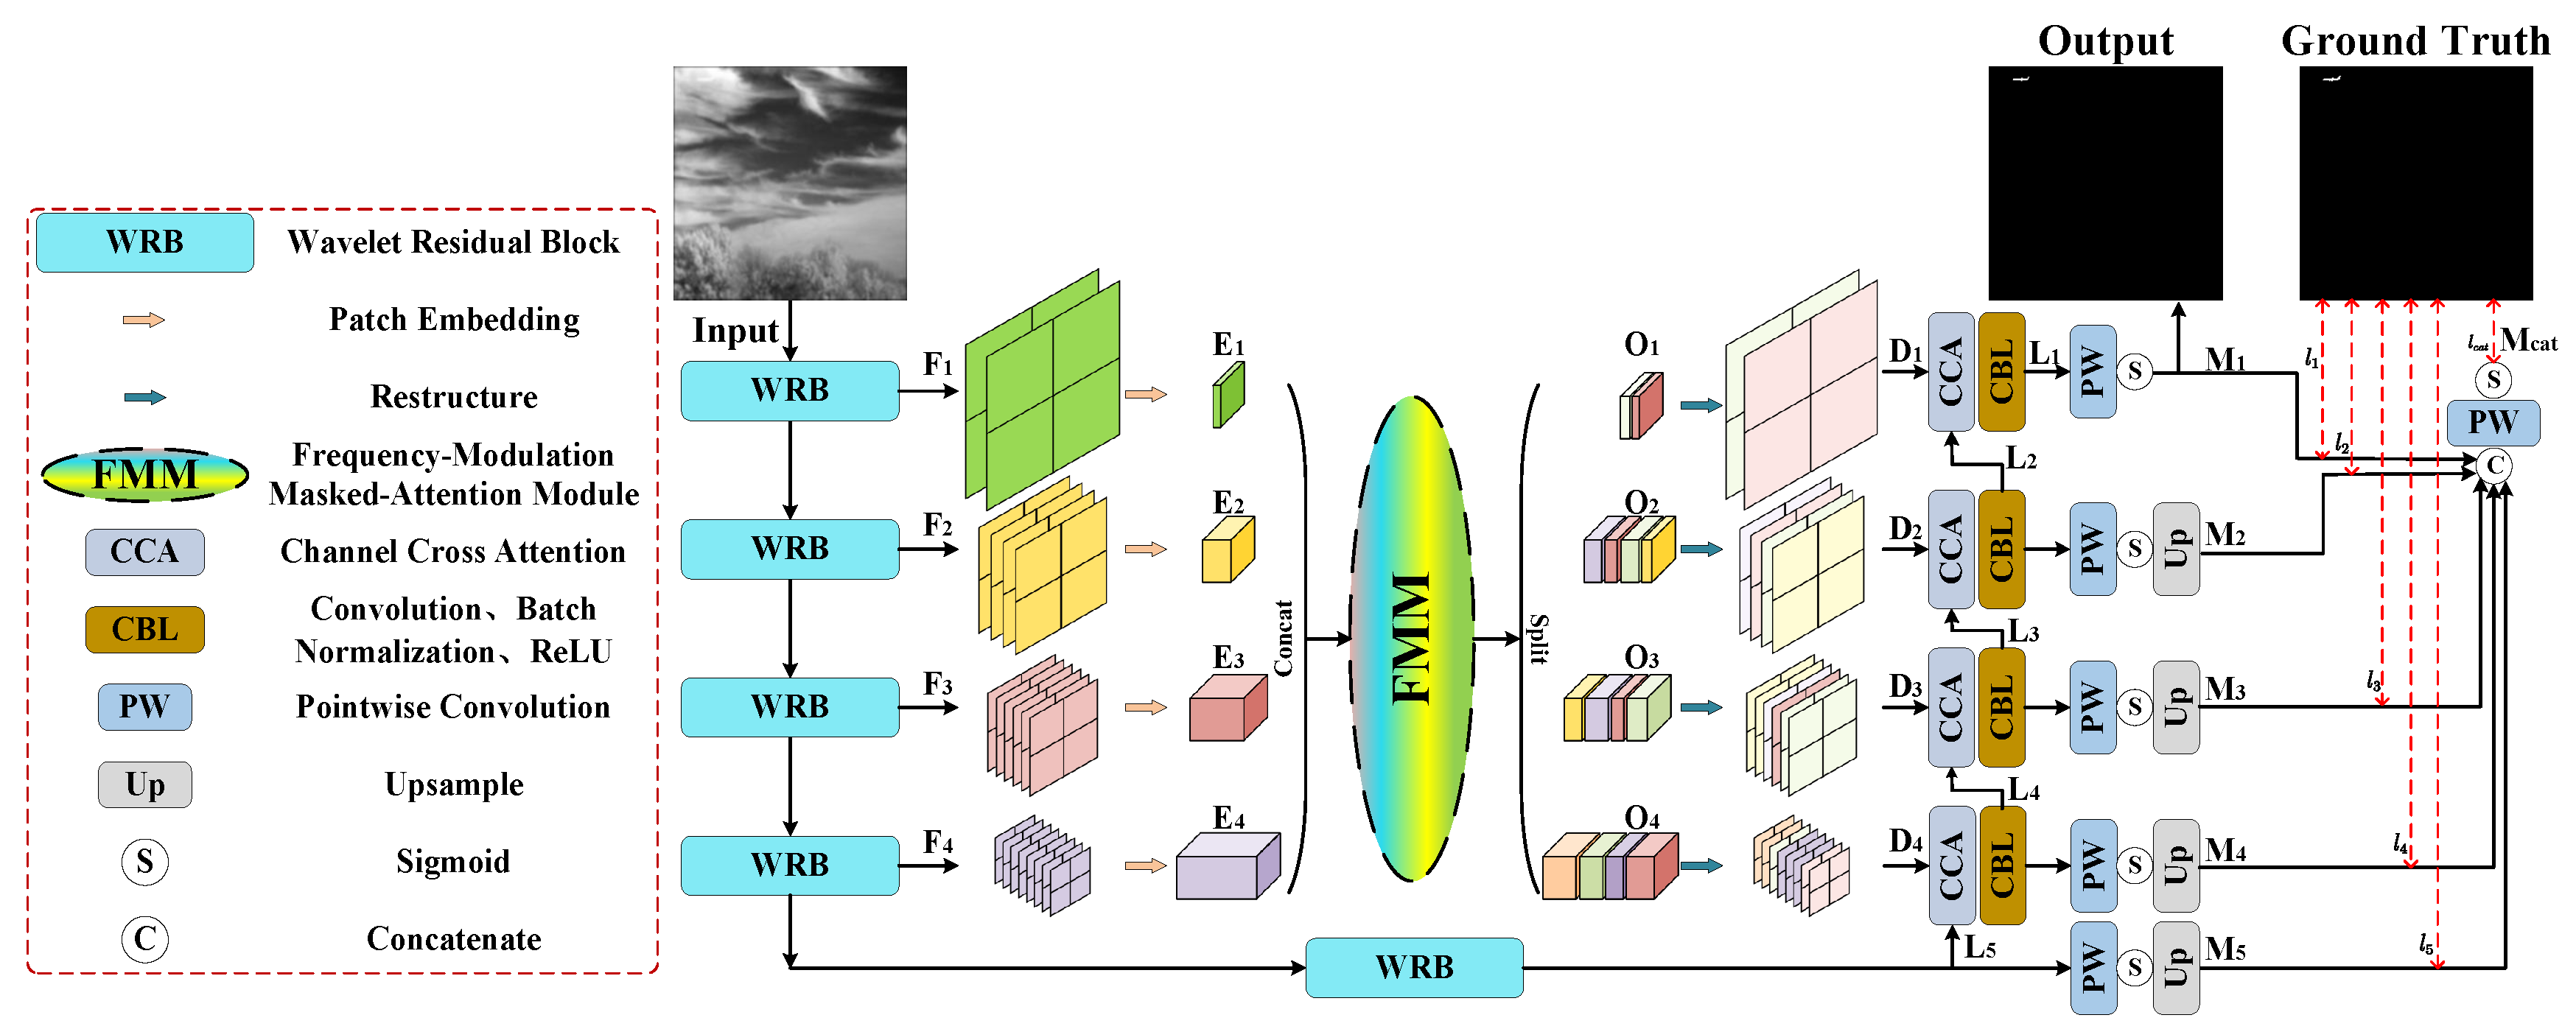
Figure 2 shows the specific architecture of FM-Net. First, the input is a single frame infrared small target image. Then, it is sequentially processed by the encoder composed of a wavelet residual block (Section 3.2) to extract deep features. Encoded features are progressively fused and recover resolution through decoder and frequency-modulation masked-attention module (Section 3.3). Last, the pixel-level prediction is generated.

Figure 2.
Illustration of frequency-aware masked-attention network (FM-Net). As a whole, FM-Net adopts the classic U-shaped structure and a novel wavelet residual block (WRB) in the encoder, extracting multi-scale and spatial–frequency features. Acting as the long-range skip connections, FM-Net utilizes the frequency-modulation masked-attention module (FMM) to gain multiple frequency features, which enhance details. During training, a multi-level deep supervision strategy is used to optimize.
FM-Net employs the ResNet-18 [41] with our proposed WRB as the backbone, which obtains deep features . is the channel dimension of features at each layer, where . We separately explain the fifth layer in the encoder, which has 128 channels with a resolution of 32 × 32. Subsequently, encoded features are processed into patch embedding through convolutions with kernel size and stride size of . The embedding across layers are inputted into FMM for full-level features perceiving and blending. The outputs of FMM keep the same size of . Skip connections are used to add and to maintain multi-granularity semantics. Then, at each layer are restructured (Rt) and recovered to the size of original , using bilinear upsample. Furthermore, convolution blocks are used to obtain decoded features . Skip connections are employed to merge the features between encoder and decoder. The above process can be mathematically expressed in the following formula.
Finally, following the paradigm of the decoder in UNet, we utilize channel cross-attention (CCA) [42] to assist in integrating the high-level and low-level features. The high-level feature is first upsampled to recover the resolution. CCA is used to fuse the features from upsampling and skipping. Then, the attention-enhanced and upsampled features are concatenated together and decoded by two CBL blocks. The progress can be expressed mathematically as
where indicates the decoded feature of layer. indicates the upsample operation. indicates the concatenate operation. The CBL block consists of convolution, batch normalization and ReLU.
To help the network converge efficiently and adapt to multi-granularity predictions, we utilize a multi-level deep supervision strategy to optimize the training of FM-Net. Specifically, each output of decoder is processed by point-wise convolution (PW) and sigmoid activation to generate a predicted mask . The process can be mathematically expressed as
Then, multi-scale masks are upsampled to the original image resolution. Furthermore, these masks are concatenated together and fused to acquire .
Finally, we calculate the total loss between , and ground truth (GT). As below, we use the DiceTopK loss (DT) [43] as our optimization loss:
where indicates the DiceTopK loss, which combines Dice loss [44] and Top-K loss [45]. Dice loss can describe regional overlap and is sensitive to target contour. Top-K loss is a variant of cross-entropy (CE) loss. It retains the top k% of the worst predicted pixel to calculate loss values, which aims to focus on hard samples. In other words, the ranking criterion is the values of CE between predicted pixels and groundtruth pixels. The composite loss, DiceTopK, combines the advantages of two functions, obtaining shape and location sensitivity. The definition is as follows.
where and , respectively, denote the values of pixel i in mask, GT. V is the number of pixels in image. C is the number of classes, and since IRSTD is a binary classification problem. is the set of worst predicted pixels. In this paper, .
3.2. Wavelet Residual Block
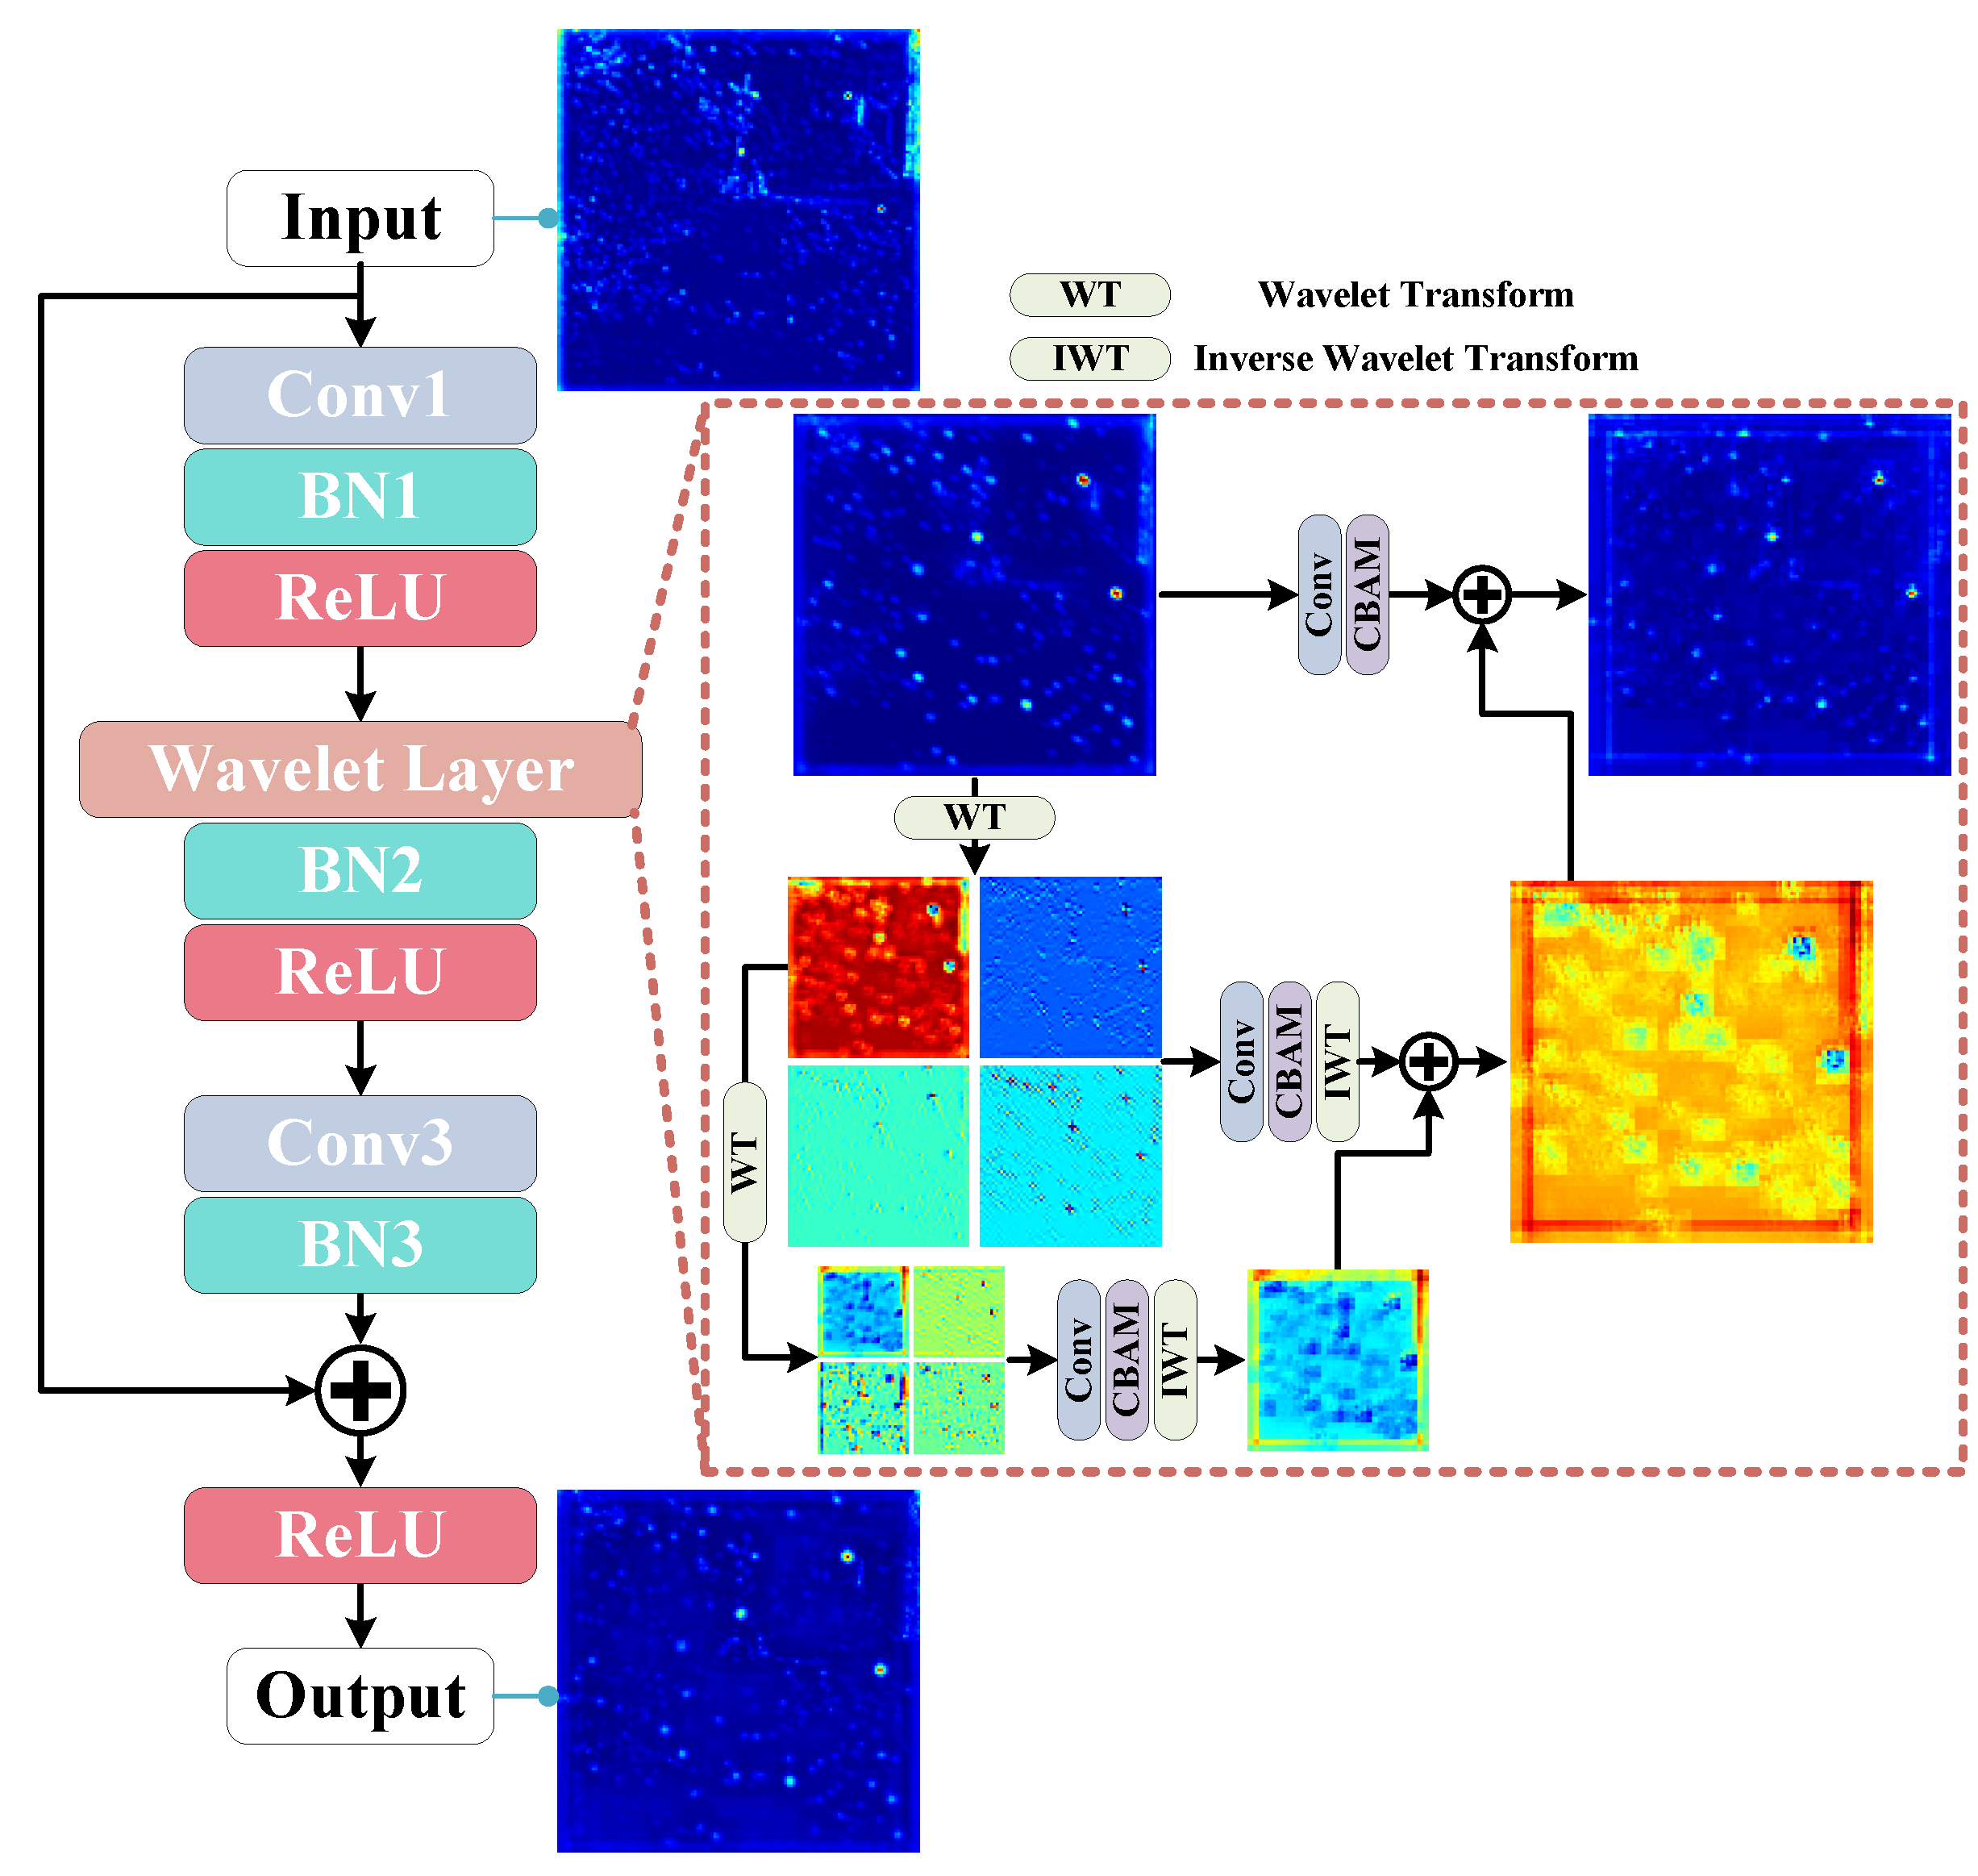
To distinguish targets from complex background, the network needs to make full use of comprehensive information hidden in semantic features. As analyzed in Section 2, we introduce the frequency-domain process to obtain feature information from multiple bands of spectrum. It is generally believed that CNN can employ many convolution operations of multiple sizes and branches to perceive different frequency information, which leads to a lot of computation cost. In contrast, wavelet transform dose not introduce additional parameters. Our wavelet layer can efficiently extract multi-scale features. Figure 3 shows our designed wavelet residual block (WRB), which employs simple operations to make the spatial–frequency feature extraction more direct and complete. Overall, a wavelet layer is inserted into a residual block. The wavelet layer initially employs WT on feature maps and obtains low-frequency and high-frequency components. Multiple frequency components are concatenated together and enhanced by the convolution and spatial attention module (CBAM) [17]. This promotes an increased fine-grained frequency information and a reduced spatial resolution for the lower frequencies. Subsequently, inverse wavelet transform (IWT) is used to construct the output completely.

Figure 3.
Illustration of wavelet residual block (WRB). A wavelet layer is inserted into the middle of the residual block. The wavelet layer forms a pyramid structure for extracting and aggregating spatial–frequency features, which effectively enhance target response and suppress interference.
Further, we utilize WT multiple times. According to Figure 1 and Figure 3, it is found that LH, HL and HH components have more high-frequency feature details, which can be utilized to enhance target response. More processing may harm these valuable components, while the low-frequency component (LL) still has similar features as the original image; it is considered that deep features can be extracted further to perceive multi-scale frequency information. Therefore, the low-frequency component is again employed in WT to obtain different frequency components. Repeating the above steps, the same operations can be performed to extract deeper features. After extracting multiple WTs, IWT is adopted to fuse multi-level feature and recover size. The enhanced in the deeper level are summed with low-frequency in the lower level. Furthermore, a new convolution and CBAM are employed to extract and enhance spatial–frequency details. The process is given by
where represents the input features of wavelet layer. represents all high-frequency maps of level. denotes the intermediate processing result in the level. is the aggregated output in the level. For the deepest level, there is no . In this paper, . We adopt Haar wavelet transform. represents convolution operation.
3.3. Frequency-Modulation Masked-Attention Module
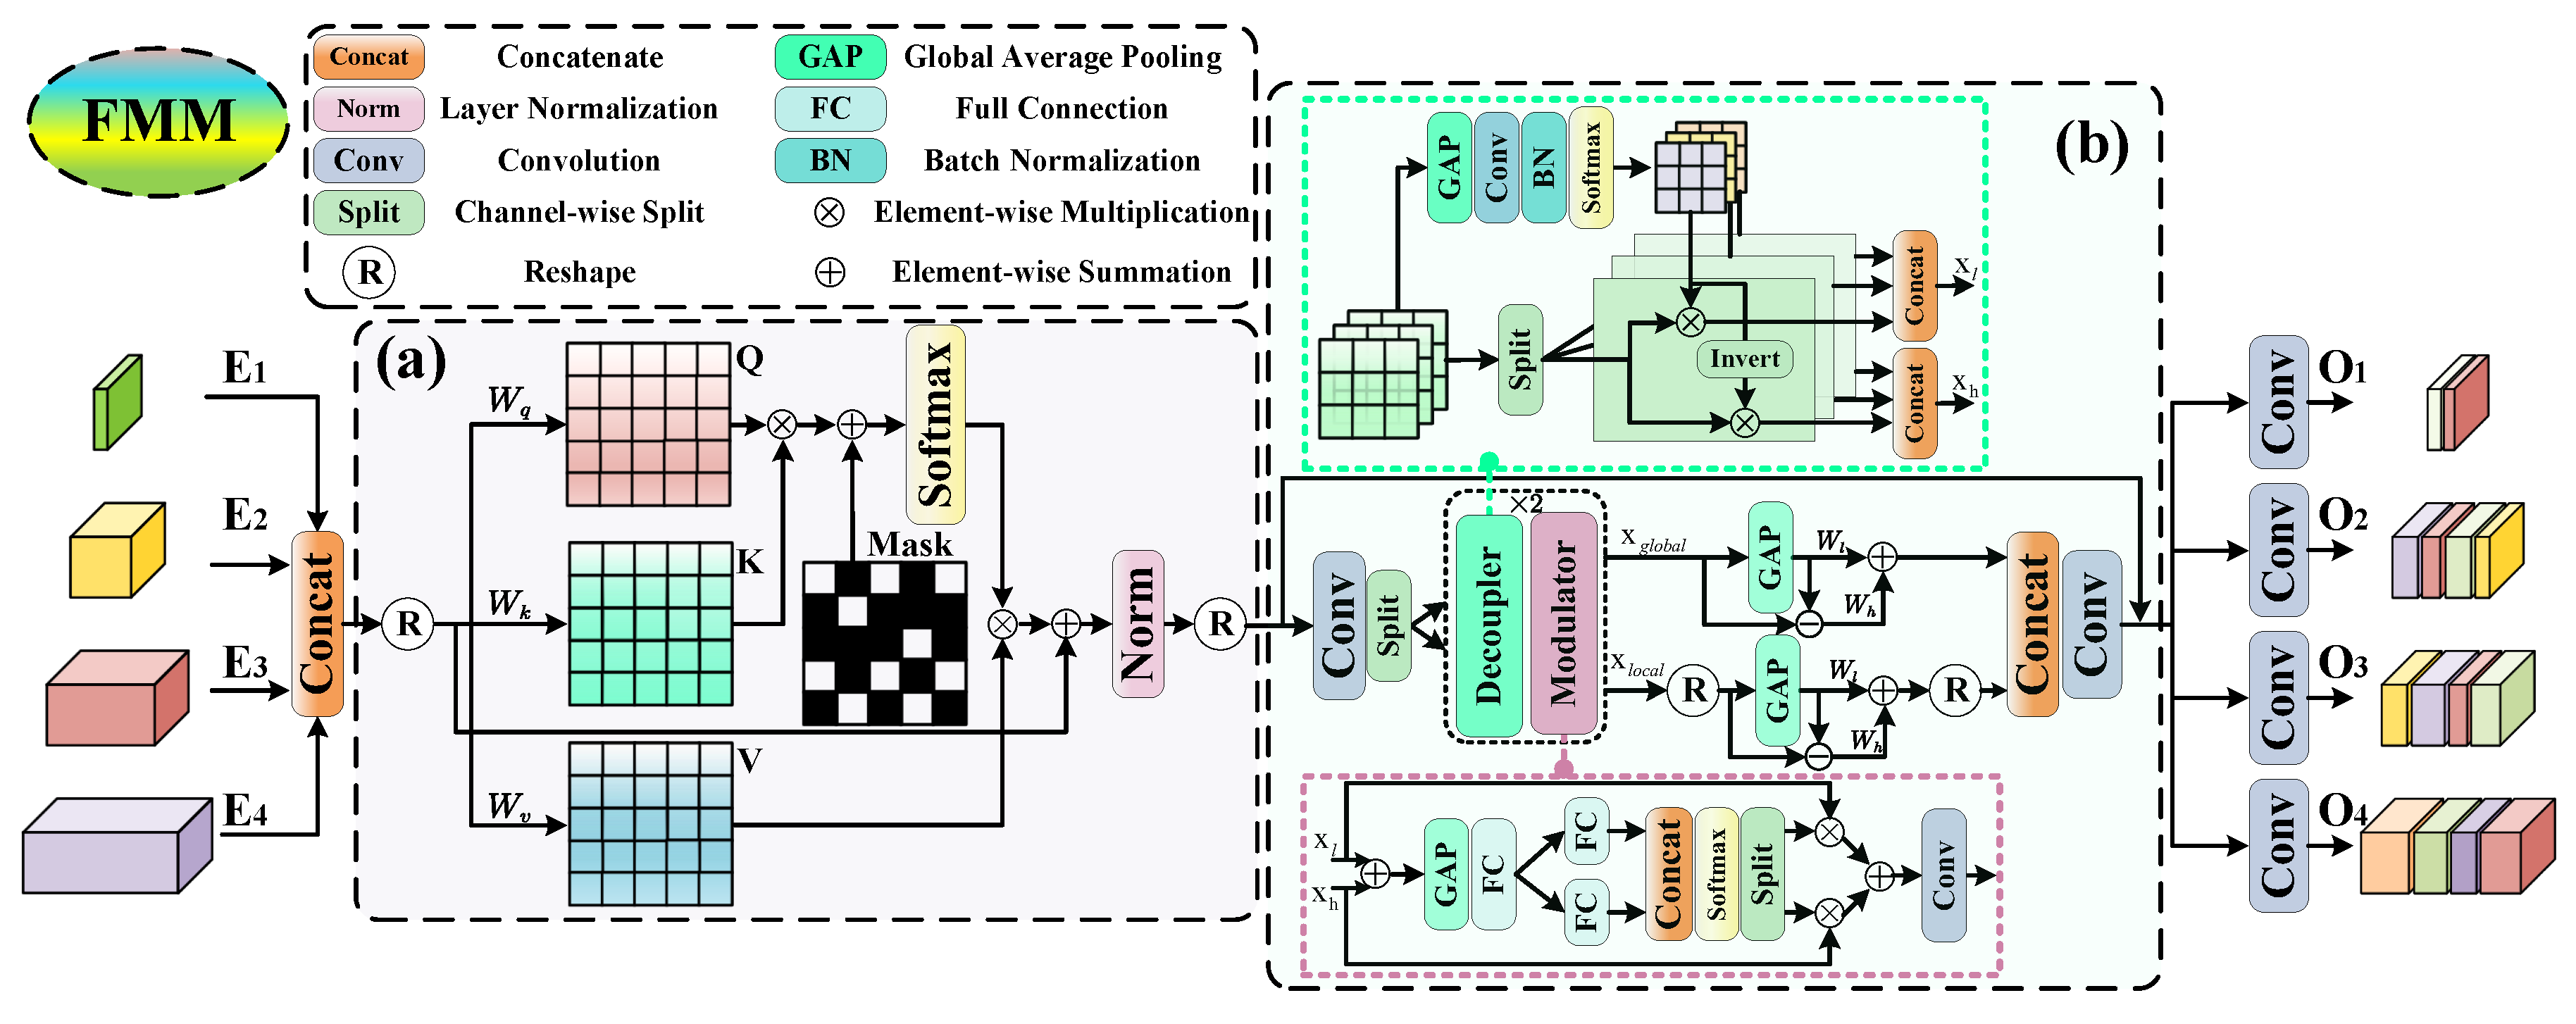
Successful architecture such as SCTB [20] has considered the interaction of spatial and channel information in constructing context. The method heavily focuses on the spatial domain but neglects the crucial effect of the frequency domain in context modeling. To solve it, we develop a frequency-modulation masked-attention module (FMM) as a spatial–frequency modulator to integrate full-level encoded features. As shown in Figure 4, given the layer embedding feature , the procedure of FMM can be organized as
where indicates the point-wise convolution used to fuse the modulated features and adjust the number of channels.
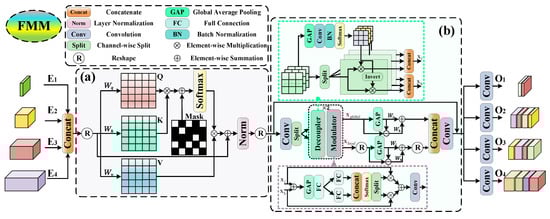
Figure 4.
Illustration of frequency-modulation masked-attention module (FMM), which consists of the mask attention mechanism (MA) and channel-wise frequency modulation module (CFM). (a) MA interacts with the semantics of all encoded features, exploring the correlation at full level and full scale. (b) CFM dynamically deconstructs multi-frequency features and enhances informational components, highlighting the semantics of targets and suppressing hard interference.
3.3.1. Mask Attention Mechanism
Mask attention is improved from multi-head self-attention, which introduces a learnable mask to adjust the attention matrix. It is considered that local features are enough to update query features [34]. Furthermore, adding an adaptive mask promotes the network to focus more on interesting regions. Assuming the input feature , it is firstly reshaped to , where , , . Then, the features are transformed linearly to obtain query Q, key K, value V. The attention matrix with an additional mask is generated by
where , , . is the corresponding weight. indicates the reshape operation. represents the layer normalization. is the activation function. M is the learnable mask, which is computed dynamically. It helps to reduce the contribution of weakly informative regions and focus on relevant space.
3.3.2. Channel-Wise Frequency Modulation Module
MA efficiently extracts the long-range association in the spatial domain, and the clues in the frequency domain are not utilized adequately. To distinguish targets and background from the fine point, we design a channel-wise frequency modulation module (CFM) to widen the semantic gap between target and clutter. In general, input features are split into two parts in channel dimension. Then, two cascaded decoupling–modulation modules extract frequency details. The decoupler dynamically filters and selects separate frequency components. The modulator adopts the effective strategy, including disassemble, enhance and fuse, to process features. It enriches informative frequency components. Specifically, given the input X, the decoupler generates the low-pass and high-pass filters, formulated as
where is the batch normalization. represents the global average pooling. High-pass filters are obtained through subtracting the from the identity kernel I. Then, low-frequency and high-frequency components are acquired by
After decoupling, modulation uses channel-wise attention to enhance the informative components, formulated as
where represents the channel-wise split operation. In Formula (21), we divide the feature maps into two parts from the middle, where is the first half of a small channel index and is the second half of a large channel index. In Formula (22), we apply the decoupler and modulator modules twice with varying kernel sizes and concatenate the output features. Then, split operation divides the output features into two parts, where is the first half of a small index and is the second half of a large index.
Next, the low-frequency and high-frequency features are enhanced and aggregated from local and global perspectives. is firstly used to obtain low-frequency part, and the features subtract the low-frequency part to obtain the corresponding high-frequency part. To enhance two frequency subbands, the learnable scaled weights are introduced to emphasize contributions. Addition is used to fuse two frequency parts. The global and local components are concatenated together and fused by convolution. CFM decomposes, improves and reaggregates full-level features to gain multi-frequency information, which highlights target semantics.
Finally, convolutions are used to fuse full-level splicing features and adjust the channel dimension in each layer, generating the output of FMM.
4. Experiments
In this section, we introduce evaluation metrics, experiment setting, comparison with the state-of-art-art (SOTA) methods and ablation study.
4.1. Evaluation Metrics
In this paper, we compare FM-Net with several state-of-the-art (SOTA) methods on common metrics.
(1) Intersection over Union. is a pixel-level metric, which reflects the profile description ability.
where and , respectively, indicate the intersection and union area between prediction and ground truth.
(2) Probability of Detection. is a target-level metric, which reflects the localization accuracy.
where represents the number of correctly predicted targets. represents the number of total targets. When the centroid deviation between prediction results and ground truths is less than a predefined threshold, we believe those targets are correctly detected. The threshold is 3 in this paper.
(3) False Alarm Rate. is a target-level metric, which reflects the wrong detection of false objects.
where represents the number of falsely predicted pixels. represents the number of total pixels. When the centroid deviation is larger than the threshold, the prediction is considered as false pixels.
(4) Receiver Operation Characteristics. The ROC curve describes the general trend of as varies. Furthermore, it indicates the total effect under a sliding threshold.
(5) Parameters. #Params reflects the number of learnable parameters in model, which is related to the size of convolution kernel. Given 2D convolution , the input feature is F
where and represent the number of input and output channels. and represent the kernel height and width of 2D convolution.
4.2. Experiment Setting
We used three benchmark datasets, including SIRST [14], NUDT-SIRST [17] and IRSTD-1k [16], which, respectively, contain 427, 1327 and 1001 images. We followed the standard method in [17] to split the train and test sets for three datasets. During training, input images are firstly normalized and randomly flipped for data augmentation. Furthermore, all input images have a resolution of by filling or cropping. Note that a resize operation easily causes position shift and deformation for small targets, which should be avoided. The model is trained using the AdaGrad optimizer. We set the learning rate, batch size and epoch number as 0.05, 8 and 1000, respectively. Networks are implemented by PyTorch 2.3.0 on a single Nvidia GeForce RTX 3090 GPU. Traditional detection methods are implemented and tested in MATLAB R2023b on an Intel Core i9-13900HX CPU.
To evaluate the performance of FM-Net, we compare our FM-Net to some SOTA IRSTD methods. Traditional methods include filter-based Top-Hat [5] and Max-Median [6], local-contrast-based WSLCM [7] and TLLCM [8], low-rank-based IPI [9] and MSLSTIPT [4]. Deep learning methods include ACM [14], DNANet [17], UIUNet [18], MTU-Net [19], SCTransNet [20], WTAPNet [23]. In order to ensure a fair comparison, we collect and implement the official codes of the above methods. At the same time, we keep the consistent training settings and hyper-parameters of their original papers. Our code will be available at https://github.com/yongxianLiu/ (accessed on 25 May 2025).
4.3. Quantitative Results
Quantitative results are shown in Table 1. It is clear that deep learning-based methods are significantly superior to traditional ones in terms of detection accuracy and contour prediction. Those traditional methods are model-driven and heavily rely on tuning hyper-parameters, resulting in poor robustness to complex scenes. Meanwhile, our proposed FM-Net achieves excellent performance on three benchmark datasets. In particular, on the IRSTD-1k dataset, FM-Net achieves the best results on all metrics. On the SIRST dataset, our method achieves superior results in and , with overall performance close to that of SCTransNet. Although FM-Net does not perform as well as UIUNet on , our method achieves balanced and outstanding performance at an acceptable computational cost. On the NUDT-SIRST dataset, FM-Net achieves 99.15% in terms of , which is lower than the of DNANet, but with an increase in and a significant decrease in terms of . In summary, FM-Net effectively extracts the spatial–frequency information to detect infrared small targets in a dense clutter. It employs frequency decoupling and modulation to amplify the difference between targets and background in the frequency domain, greatly reducing the occurrence of false alarms. At the same time, FM-Net maintains target feature in deep layers and refines semantic details through enhancing multi-frequency components. Therefore, FM-Net can not only locate targets accurately but also finely contour them.

Table 1.
Result comparison of detection performance and model size with the SOTA methods on three datasets, where , , , #Params, FLOPs. The best results are in red and the second best results are in blue. Spatial and Freq refer to spatial-based and frequency-based methods, respectively.
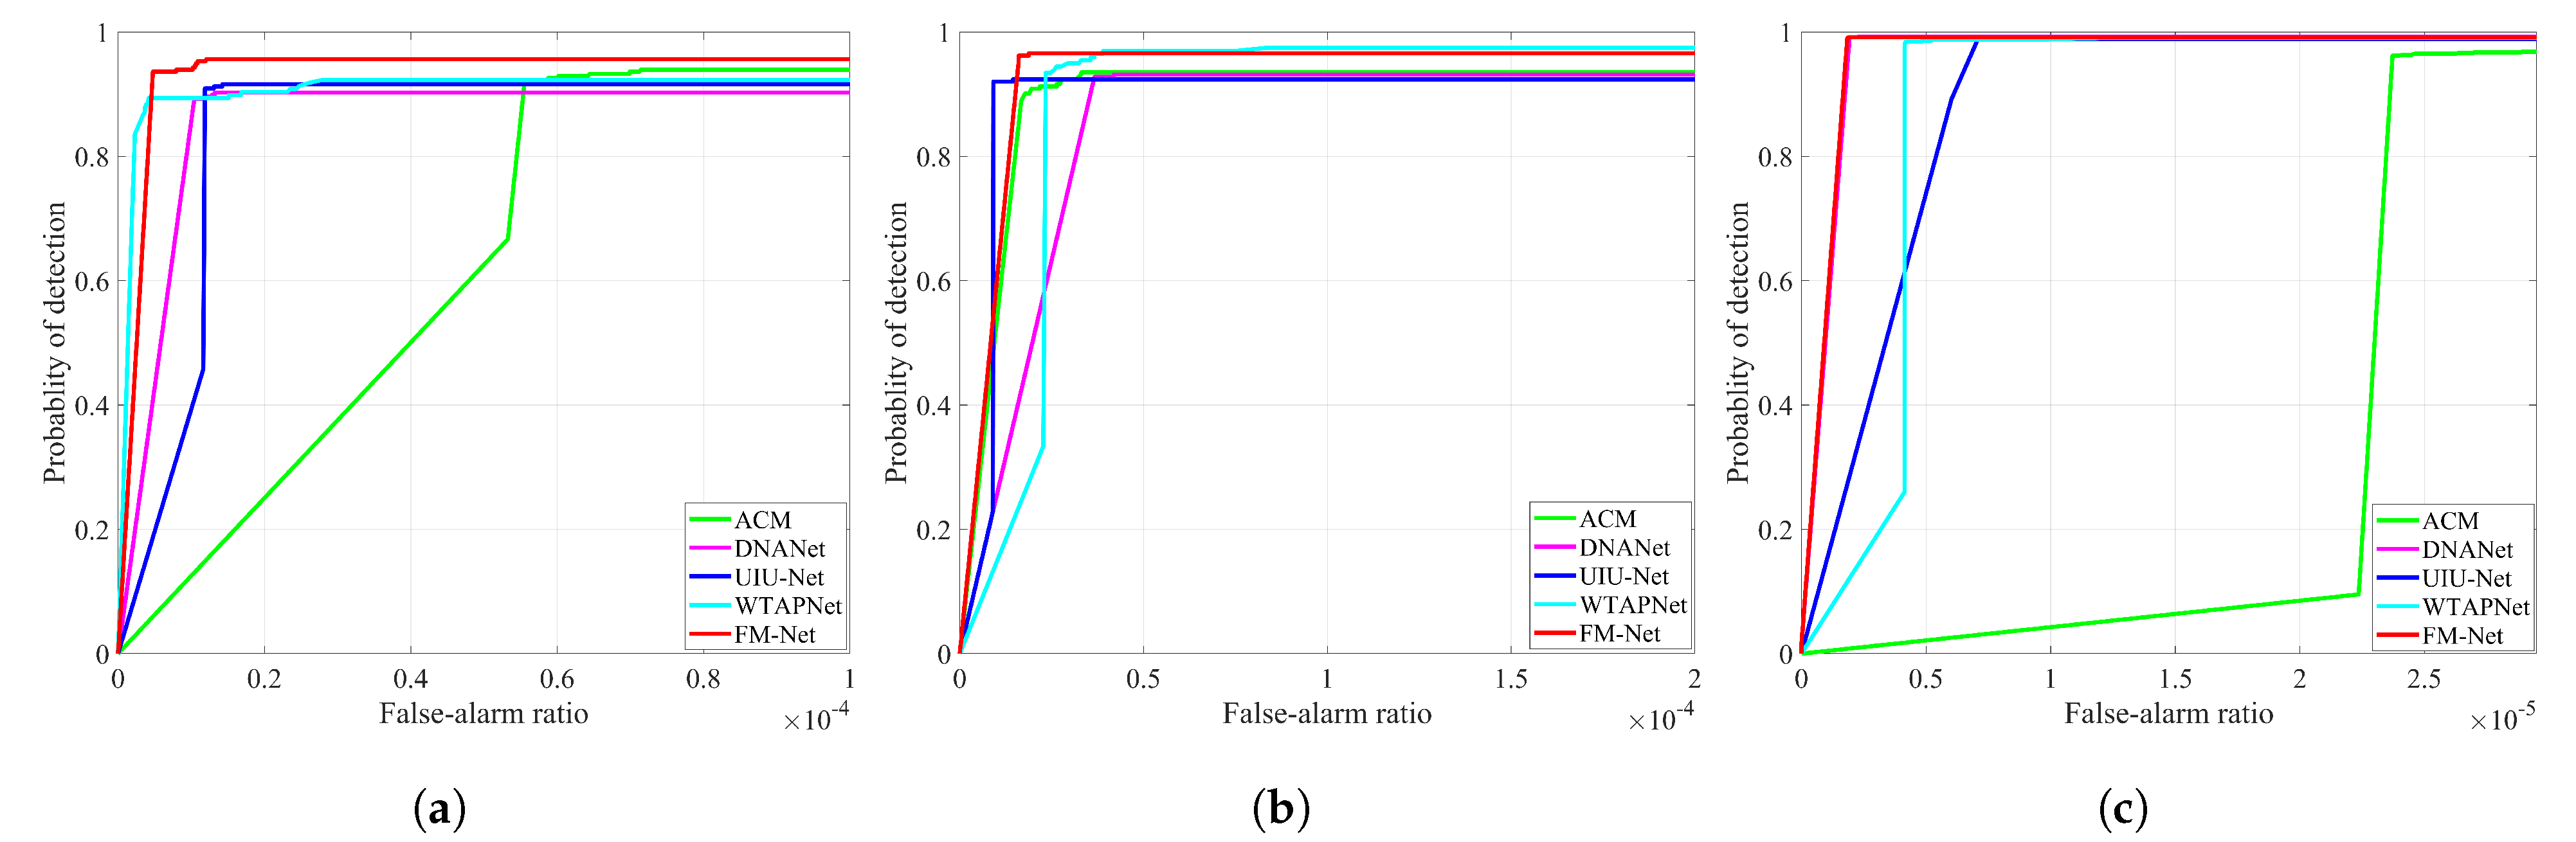
As shown in Figure 5, we plot the ROC curves of deep learning-based methods on three datasets. Our FM-Net achieves the optimal win–win situation with regard to and . It is evident that FM-Net can deal with different complex scenes and changeable targets. On the IRSTD-1k dataset, FM-Net achieves the highest under low , and the curve is at the top. On the NUDT-SIRST dataset, FM-Net obtains a curve similar to that of DNANet; both demonstrate a distinct advantage over other methods.
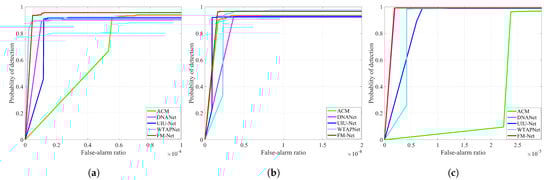
Figure 5.
ROC curves of different methods on (a) IRSTD-1k, (b) SIRST and (c) NUDT-SIRST datasets, respectively. FM-Net achieves consistent superior performance under varying thresholds.
4.4. Qualitative Results
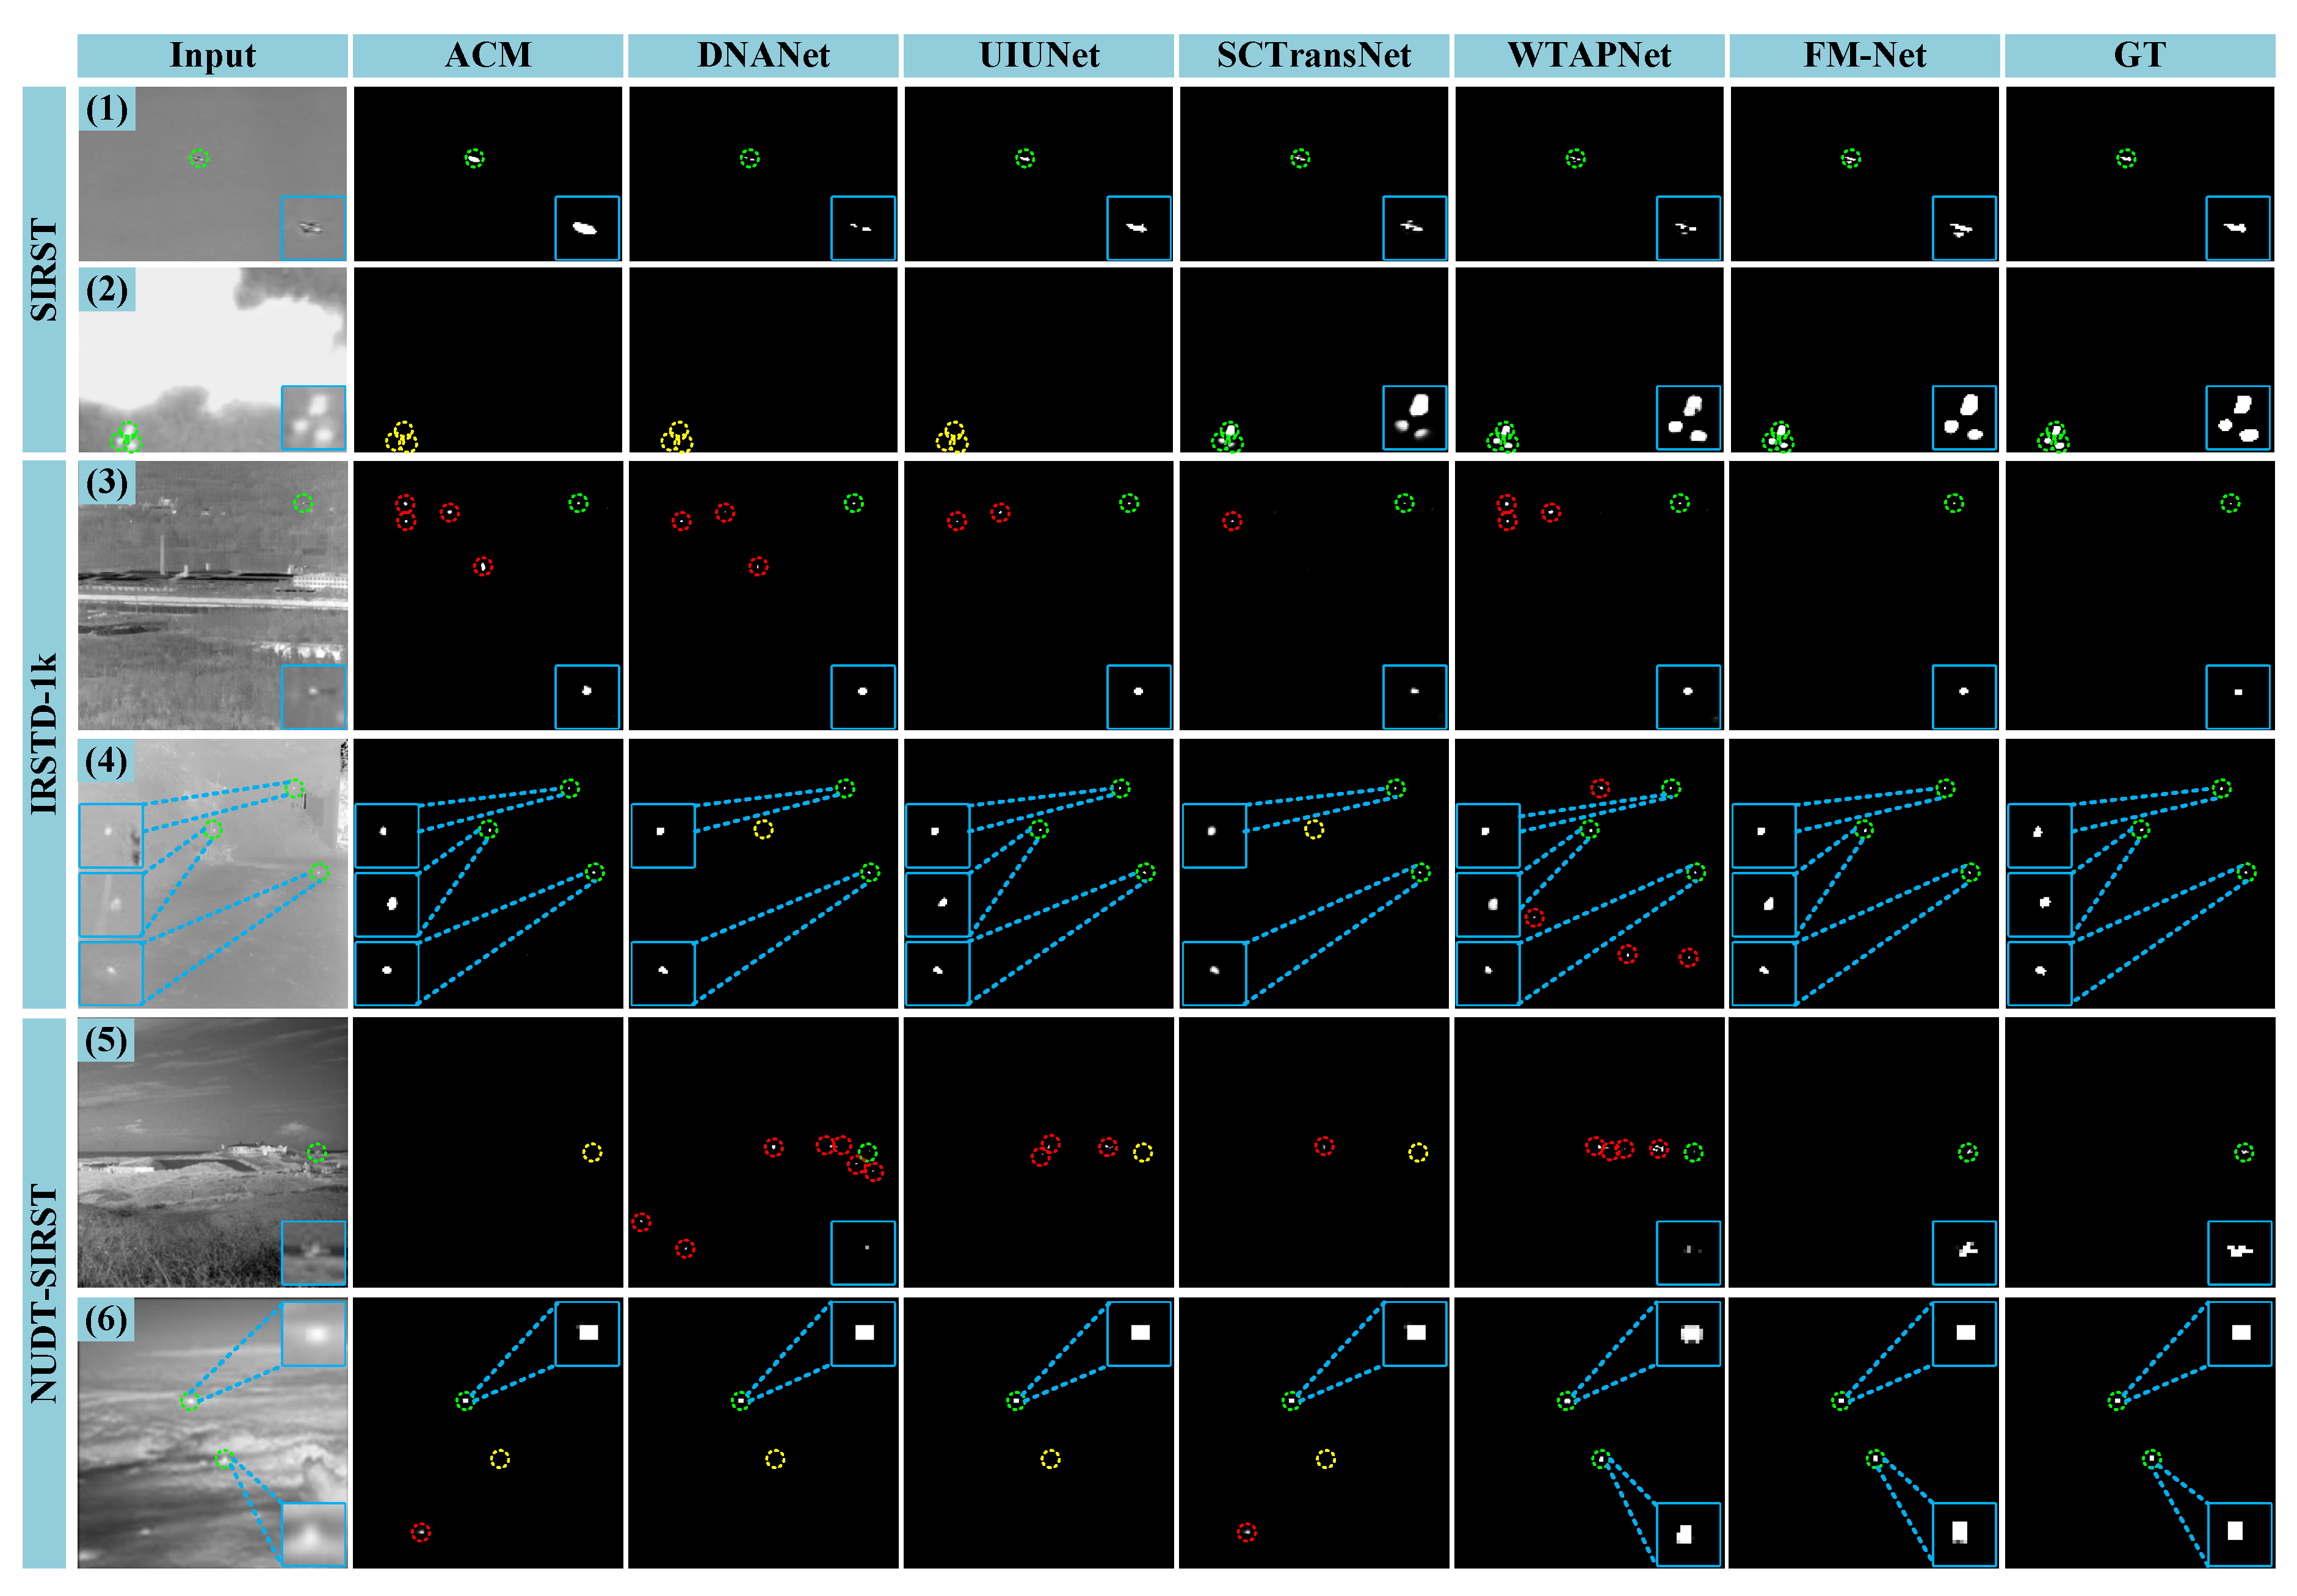
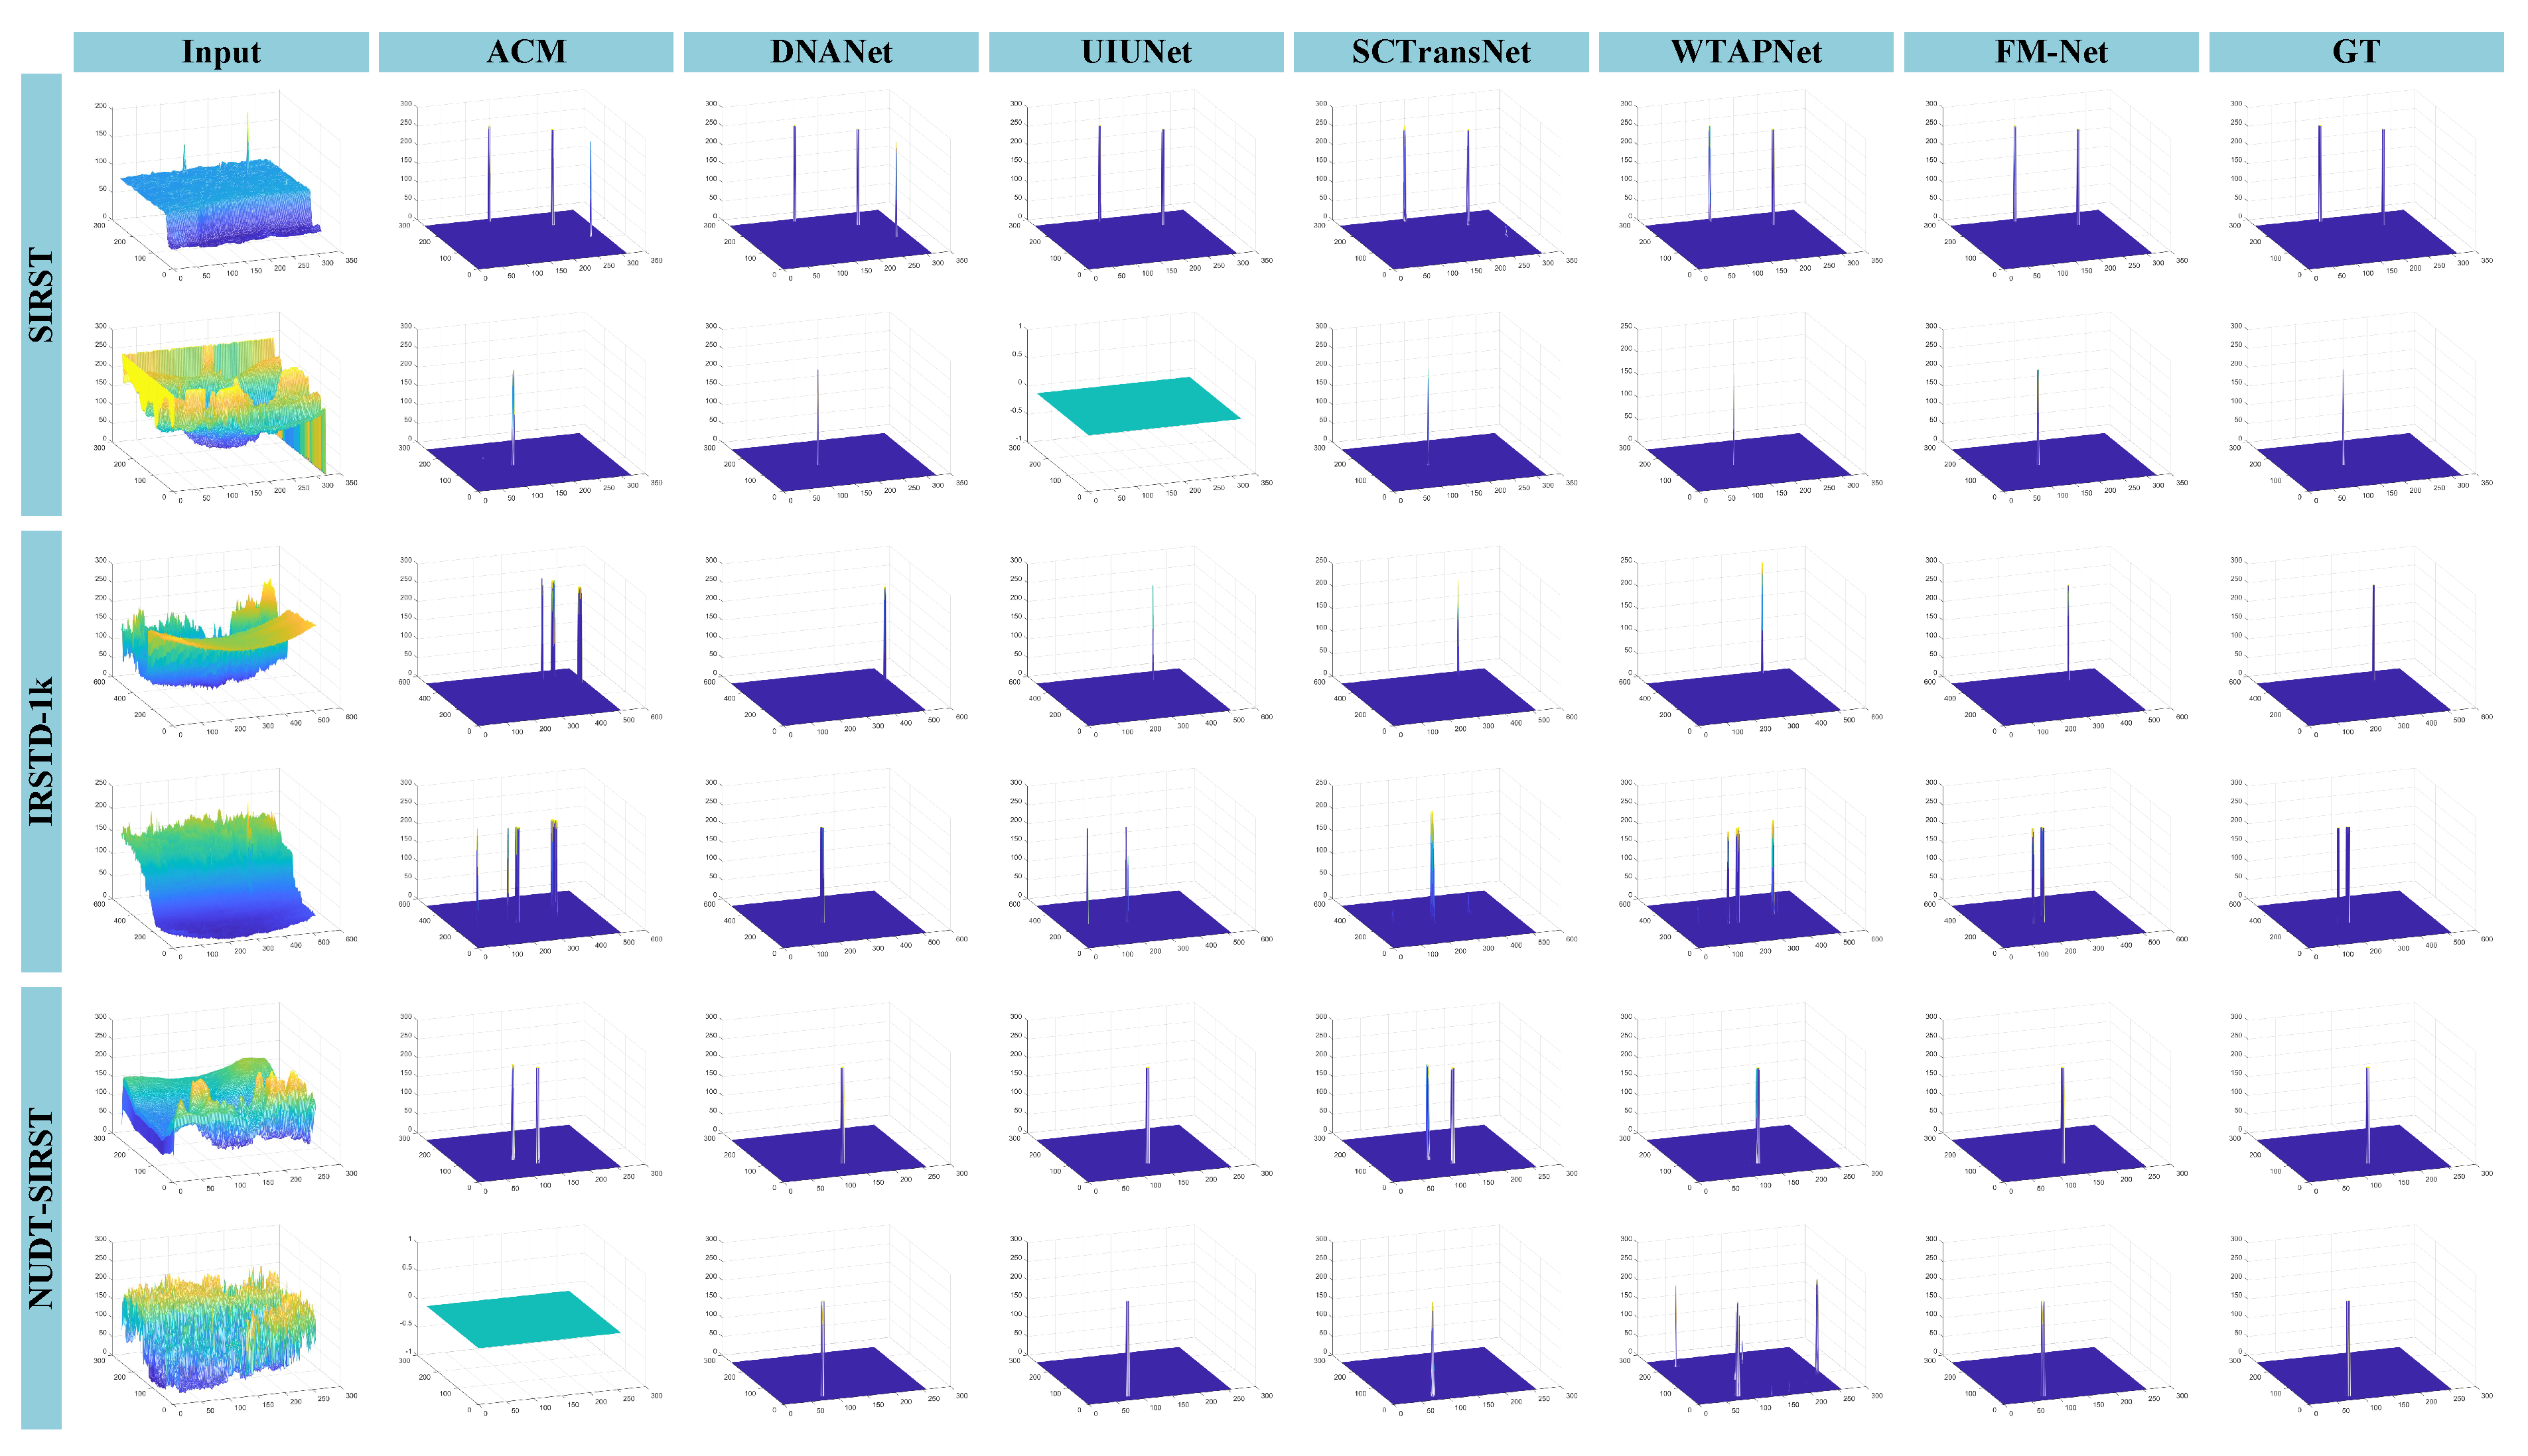
Qualitative results of six detection methods are shown in Figure 6 and Figure 7. We can observe that targets are in a wide variety of sizes and they are similar to the background with complex clutter. Our FM-Net can segment targets with precise localization and depict the dedicate contour. In Figure 6(1), FM-Net and UIUNet can match target shape, but other methods just segment partial targets or the expanded area. Moreover, for background highlights with similar characteristics to targets, FM-Net can accurately eliminate false alarms and locate targets drowned in dense clutter. However, other methods result in poor detection performance, as shown in Figure 6(2–6). In Figure 7, we present the detection results of an additional six scenes. The brightness of the background area is usually similar to or even exceeds that of targets, making separation exceptionally difficult. In visualization comparison, FM-Net exhibits robust performance to different complex scenes, which suppresses background interference and detects targets precisely. This is due to the fact that FM-Net effectively utilizes frequency information to model global and local features, extracting and maintaining detailed target semantics. Furthermore, the processing in the frequency domain helps to distinguish differential semantic features between targets and background.

Figure 6.
Qualitative results obtained by different IRSTD methods on SIRST, IRSTD-1k and NUDT-SIRST datasets. The numbers (1–6) are used to distinguish the different images. To be more intuitive, target areas and detection results are enlarged in the corner of images. Dotted circles in green, red and yellow, respectively, represent correctly detected targets, false alarms and missing detections.

Figure 7.
Three-dimensional visualization results obtained by different IRSTD methods on SIRST, IRSTD-1k and NUDT-SIRST datasets.
4.5. Ablation Study
In this section, we modify FM-Net and evaluate the performance of several variants to demonstrate the practical benefits of our designed modules and tricks.
4.5.1. Network Framework
To obtain the best performance and corresponding network, we change network framework, including channel numbers and feature size. As shown in Table 2, we change the channel number of the encoder in FM-Net. In comparison, FM-Net with C = 16, 32, 64, 128, 128 achieves the highest performance metrics. An insufficient number of channels makes it difficult to acquire lots of divisive features. However, redundant channels bring interference information and model complexity. According to Formula (26), the change of channel numbers dramatically affects model parameters. Although the model with fewer channel has fewer parameters, the detection performance is poor. All things considered, C = 16, 32, 64, 128, 128 is the most appropriate configuration.
Table 2.
Results achieved by FM-Net’s variants with changed channel numbers on IRSTD-1k dataset, where C indicates all channel numbers of features at each level. Bold indicates the optimal values.
During extraction in FM-Net, encoded features are processed into patch embeddings. To explore the effect of patch size on detection performance, we change the size of embedding and display experimental results in Table 3. FM-Net with 32 × 32 patch obtains the best performance and has a moderate number of parameters. A larger patch will introduce lots of computational complexity, making training slow. A small patch loses feature information and semantic details, leading to performance degradation.
Table 3.
Results achieved by FM-Net’s variants with different patch size on IRSTD-1k dataset. P indicates the uniform scale of embeddings. Bold indicates the optimal values.
Then, we evaluate the gain brought to FM-Net by the multi-level deep supervision strategy. In Table 4, FM-Net w/o DS represents network trained without deep supervision. The deep supervision strategy can help FM-Net achieve performance improvements across the board. Focusing on different levels of prediction results can facilitate network training. This is because the strategy can mitigate gradient disappearance and promote hierarchical feature learning.
Table 4.
Results achieved by FM-Net with different train strategy on IRSTD-1k dataset. Bold indicates the optimal values.
4.5.2. Impact of WRB
Wavelet residual block (WRB) in the encoder employs wavelet transform to acquire multi-scale and multi-level spatial–frequency information. The block helps enhance target responses through adaptively fusing multi-frequency information, which also serves to suppress interference. To verify the effectiveness of WRB, we compare the detection performance of FM-Net with several variants of WRB.
- FM-Net w/o WL. We remove the wavelet layer and only use the residual block to extract features in the encoder.
- FM-Net w/o CBAM. We remove all CBAMs in WRB and only use convolution operation to process frequency maps.
- FM-Net w j = 1. We change the deepest level of wavelet layer, only performing feature extraction and enhancement once.
- FM-Net w j = 3. We change the deepest level of wavelet layer and the wavelet pyramid has three levels.
- FM-Net w db2. We change the type of wavelet transform, using Daubechies wavelet of order 2.
- FM-Net w coif1. We change the type of wavelet transform, using Coiflets wavelet of order 1.
Table 5 shows the results achieved by FM-Net with different variants of WRB. If a wave layer is removed, the detection performance suffers a significant reduction, especially in terms of . As shown in Figure 8, WRB helps FM-Net to obtain more specific and distinct semantic features. Removing WRB significantly reduces the network’s ability to localize targets and suppress background clutters. That is also verified in Figure 3: when feature maps pass through WRB, target semantics are clearer and some background interferences are eliminated. Then, CBAM can enhance semantic information, greatly bringing an increase in terms of IoU, and . Next, is the optimum level of WRB. Larger levels cannot obtain more details and lead to more computation. As for types of wavelet transform, FM-Net adopts Haar wavelet and achieve the highest performance metrics.
Table 5.
Results achieved by main variants of WRB on IRSTD-1k dataset. Bold indicates the optimal values.
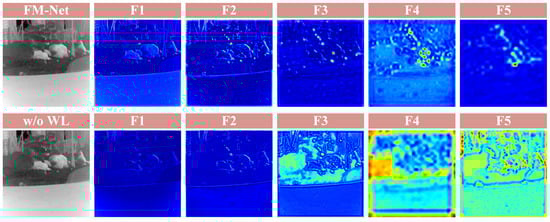
Figure 8.
Visualization maps of FM-Net (first row) and FM-Net w/o WL (second row). The maps come from encoded features . The feature maps of FM-Net w/o WL in the deep layer are chaotic and diffuse, resulting in poor performance.
4.5.3. Impact of FMM
The frequency-modulation masked-attention module (FMM) plays an equivalent role of skip connections, which perceives long-range semantic association and enhances target response through global attention and multi-frequency enhancement. FMM can effectively bridge the semantic gap between encoder and decoder features. To investigate the benefits of FMM, we compare FM-Net with several variants which adopt other connection methods. Experimental results are in Table 6.
Table 6.
Results achieved by main variants of FMM on IRSTD-1k dataset. Bold indicates the optimal values.
- FM-Net w/o FMM. Removing FMM, we use the plain skip connection to pass encoded features to decoder.
- FM-Net w cat. We remove the FMM in this variant and still utilize convolutions to aggregate the encoded features, which are concatenated together
- FM-Net w/o MA. In this variant, we remove the MA module in FMM to investigate the benefit of MA.
- FM-Net w MA2. We change the number of MA in FMM. This variant has two cascaded MA modules to extract feature.
- FM-Net w MA3. This variant has three cascaded MA modules in FMM.
- FM-Net w/o CFM. We remove the CFM in FMM in this variant to investigate the benefit of CFM.
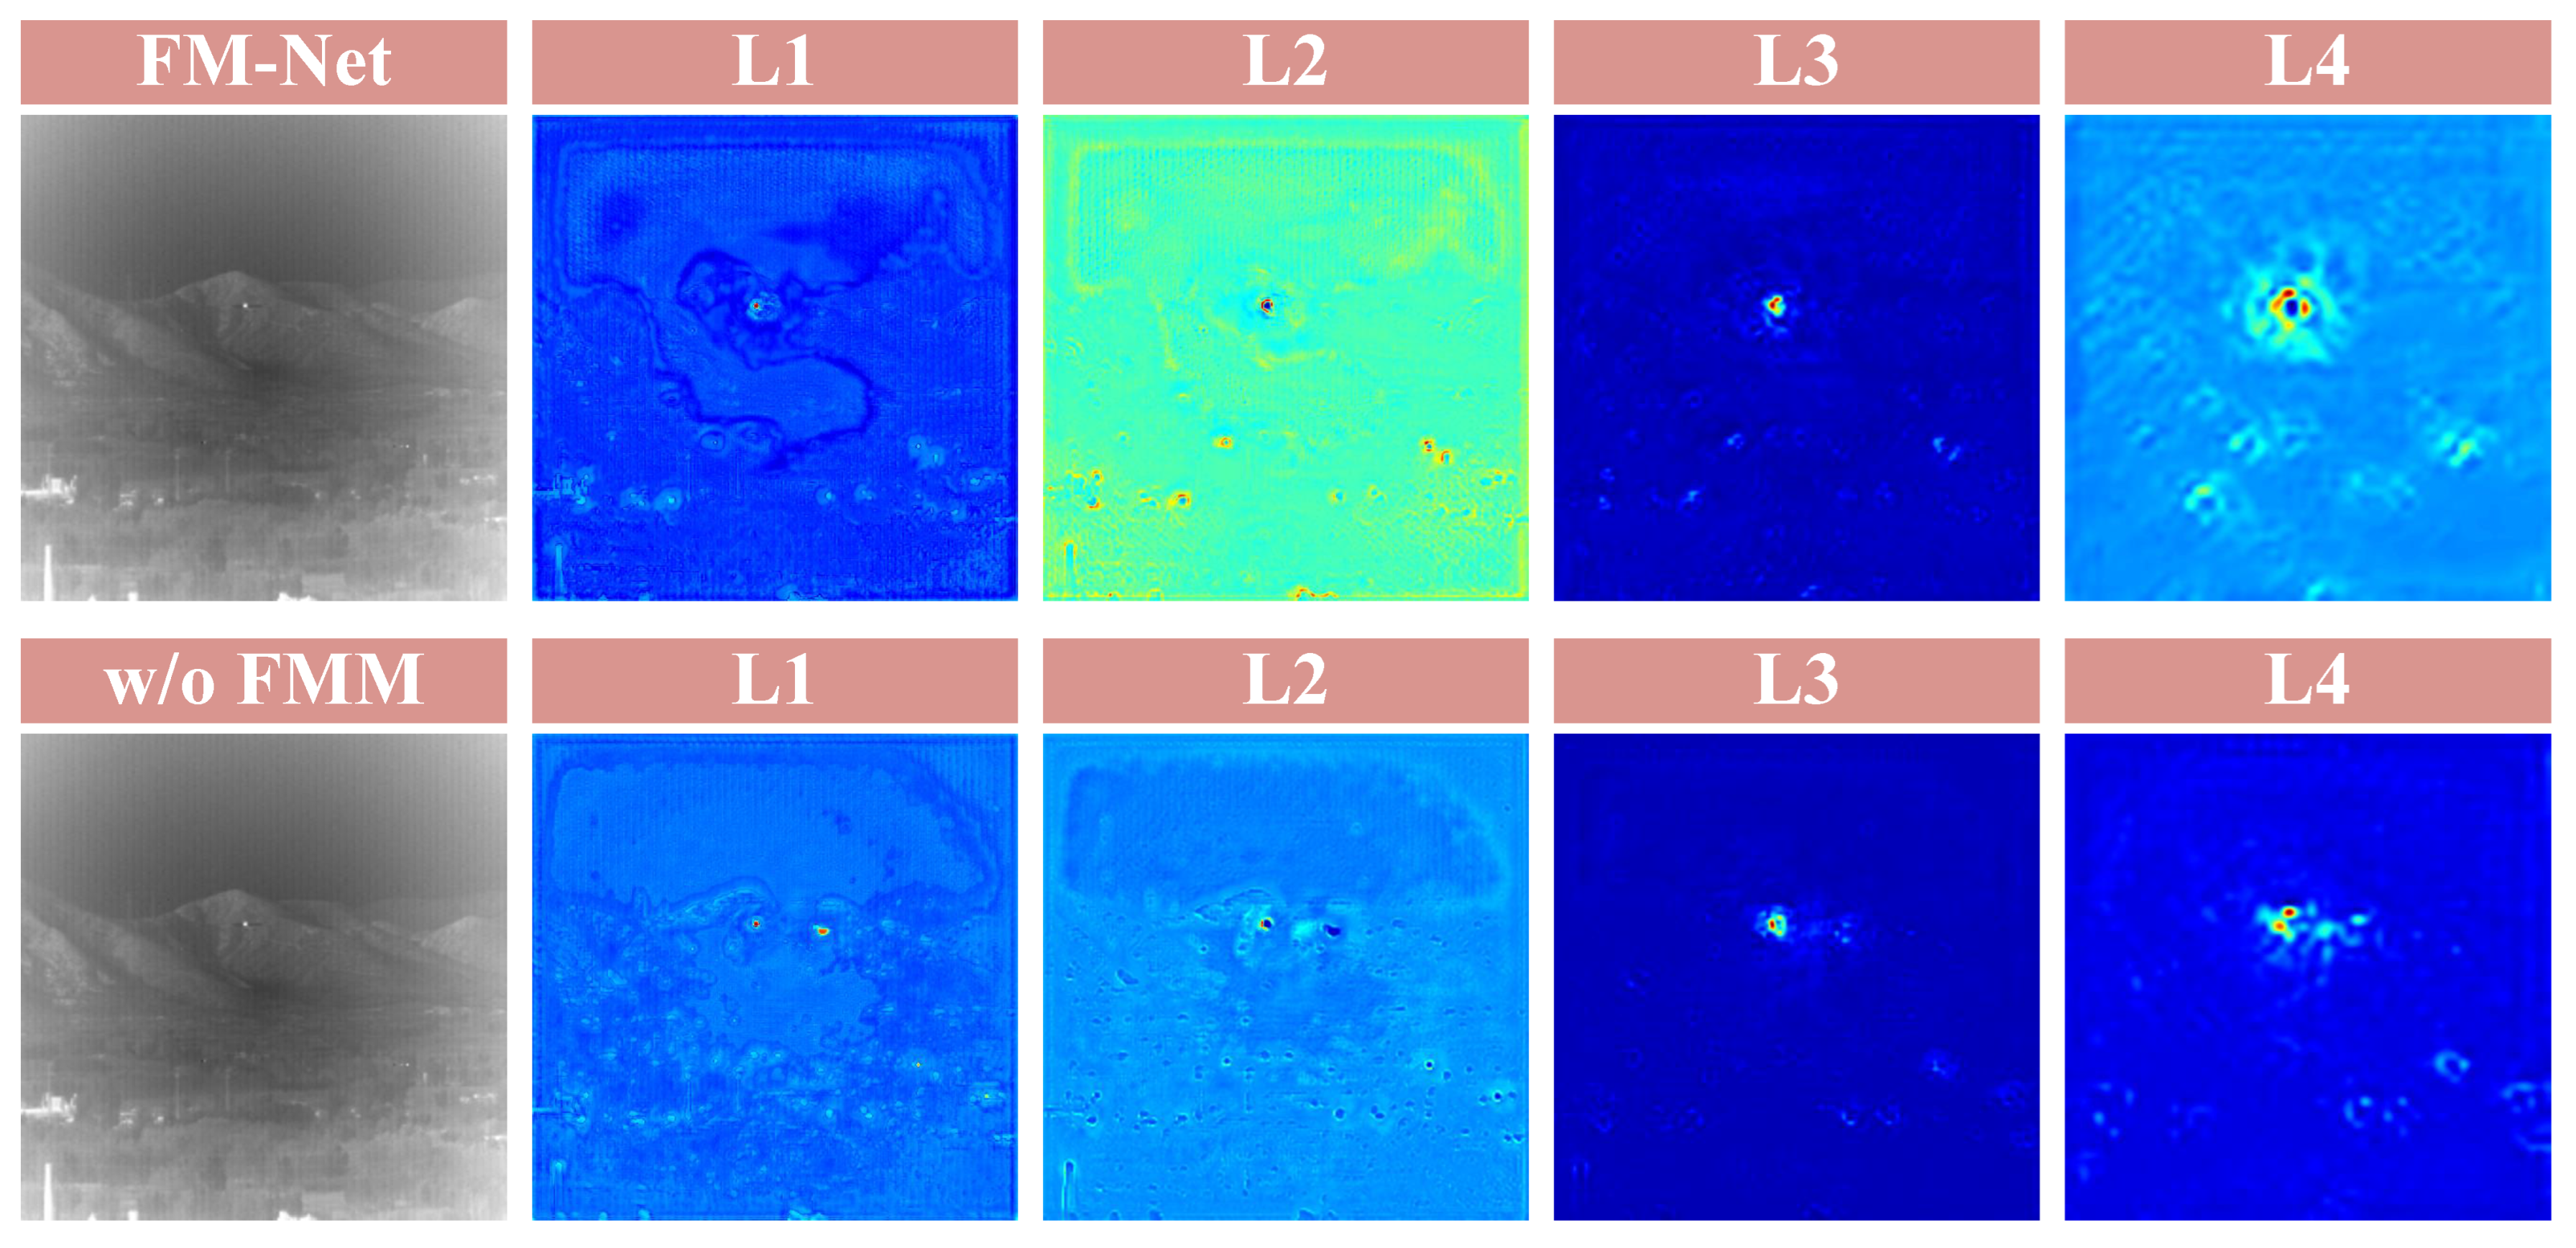
FM-Net w/o FMM suffers decreases of 0.28%, 2.69% and an increase of 17.365 in terms of IoU, and . This is because FMM models global correlation and enhances target response by modulating multi-frequency components. Visualization maps in Figure 9 demonstrate the effectiveness of FMM. In the L1 maps of FM-Net w/o FMM, there is a highly responsive region which does not contain targets. This easily causes false alarm. Moreover, comparing the corresponding feature maps, such as L2 and L4, we can also find that FM-Net predicts the global context better, which can facilitate the separation of targets and background. In L3, the target region of FM-Net has higher response and is more focused. It demonstrates that FMM contributes to refining semantic information in the deep layer.

Figure 9.
Visualization maps of FM-Net (first row) and FM-Net w/o FMM (second row). The maps come from decoded features . The feature maps obtained by FM-Net w/o FMM contain highly responsive background clutter.
The detection performance of FM-Net w cat is poor. Plain aggregation using convolution cannot bridge the semantic gap as FMM does. Comparing the results of different numbers of MA, a single attention head can obtain the optimal results.
FM-Net w/o MA suffers decreases of 1.18%, 2.02% and an increase of 8.977 in terms of IoU, and . This is because MA can model global spatial context and focus on targets’ region. FM-Net w/o CFM suffers decreases of 0.26%, 1.34% and an increase of 1.29 in terms of IoU, and . This is because CFM decouples multiple frequency components of features and exploits adaptive channel attention to enhance the informative ones. The subsection proves that FMM is valid for IRSTD.
5. Discussion
Nowadays, there is a growing number of IRSTD methods based on deep learning, yet most of them only rely on spatial features to detect targets. Studies have shown that this is not enough. In this paper, we consider that it is important to model global context and utilize frequency information for IRSTD. The study introduces the frequency-aware masked-attention network, which contains a novel extraction module containing wavelet transform and a novel aggregation module utilizing frequency modulation. The network structures are detailed and extensive comparison experiments are conducted. Furthermore, the ablation study demonstrates the effectiveness of designed modules. Feature research can further explore some processing in the frequency domain to improve detection performance. For example, some traditional frequency-domain filtering techniques in signal processing can be devised into learnable modules. On the other hand, it is also a research direction that utilizing frequency processing fully exploits the prior characteristic information of infrared targets. Current datasets have a small capacity and are not well organized. There are actually some significant differences in target types, target numbers, imaging scenes, image resolutions and motion states across different tasks. This places high demands on the robustness of detection models. To improve model adaptability to diverse data, future studies include constructing large-scale specialized data clusters and exploring common feature extraction of infrared small target images. With unified feature extraction and specialized decoding, this approach will drive algorithms to solve practical downstream tasks.
6. Conclusions
This paper proposes a frequency-aware masked-attention network (FM-Net) for IRSTD. Our FM-Net distinguishes semantic differences between targets and background well, utilizing the gain of frequency information. We design a wavelet residual block in backbone, which extracts detailed semantic features supplemented with multi-scale spatial–frequency information through forming a multi-level wavelet pyramid inside. Meanwhile, we introduce a frequency-modulation masked-attention module as the long-range connection between encoder and decoder. The module adopts spatial masked-attention to model global background and channel-wise frequency modulation to selectively enhance informative components while suppressing interference ones. On the whole, FM-Net incorporates local and global frequency information into spatial features, making it do well in getting rid of clutters and reducing false alarms. Comprehensive experiments on three benchmark datasets demonstrate the superiority of our FM-Net. However, there are some aspects of FM-Net that need to be optimized, including computational efficiency and physical interpretation. In the future, we will further explore the basic principles of frequency-domain features to reliably improve detection ability. Furthermore, we want to achieve a wavelet transform with learnable parameters, which can adaptively extract semantic details.
Author Contributions
Conceptualization, Y.L. and B.L.; methodology, Y.L. and B.L.; software, Y.L.; validation, Y.L.; formal analysis, B.L. and T.L.; investigation, W.A.; resources, Z.L. and W.A.; writing—original draft preparation, Y.L.; writing—review and editing, Y.L., B.L. and T.L.; visualization, Y.L.; supervision, Z.L. and W.A.; project administration, Z.L. and W.A. All authors have read and agreed to the published version of the manuscript.
Funding
This research received no external funding.
Data Availability Statement
The data adopted in this study are public and cited in Section 4.2.
Conflicts of Interest
The authors declare no conflicts of interest.
References
- Fu, J.; Li, F.; Zhao, J.; Wang, Y.; Zhang, H. Maritime Infrared Ship Detection in UAV Imagery Based on Two-Stage Region-Segmentation-Guided Learning Network. IEEE Trans. Instrum. Meas. 2025, 74, 5028516. [Google Scholar] [CrossRef]
- Huang, B.; Li, J.; Chen, J.; Wang, G.; Zhao, J.; Xu, T. Anti-UAV410: A thermal infrared benchmark and customized scheme for tracking drones in the wild. IEEE Trans. Pattern Anal. Mach. Intell. 2023, 46, 2852–2865. [Google Scholar] [CrossRef] [PubMed]
- Aibibu, T.; Lan, J.; Zeng, Y.; Lu, W.; Gu, N. Feature-enhanced attention and dual-gelan net (feadg-net) for uav infrared small object detection in traffic surveillance. Drones 2024, 8, 304. [Google Scholar] [CrossRef]
- Sun, Y.; Yang, J.; An, W. Infrared dim and small target detection via multiple subspace learning and spatial-temporal patch-tensor model. IEEE Trans. Geosci. Remote Sens. 2020, 59, 3737–3752. [Google Scholar] [CrossRef]
- Rivest, J.F.; Fortin, R. Detection of dim targets in digital infrared imagery by morphological image processing. Opt. Eng. 1996, 35, 1886–1893. [Google Scholar] [CrossRef]
- Deshpande, S.D.; Er, M.H.; Venkateswarlu, R.; Chan, P. Max-mean and max-median filters for detection of small targets. In Signal and Data Processing of Small Targets 1999; SPIE: Bellingham, DC, USA, 1999; Volume 3809, pp. 74–83. [Google Scholar]
- Han, J.; Moradi, S.; Faramarzi, I.; Zhang, H.; Zhao, Q.; Zhang, X.; Li, N. Infrared small target detection based on the weighted strengthened local contrast measure. IEEE Geosci. Remote Sens. Lett. 2020, 18, 1670–1674. [Google Scholar] [CrossRef]
- Han, J.; Moradi, S.; Faramarzi, I.; Liu, C.; Zhang, H.; Zhao, Q. A local contrast method for infrared small-target detection utilizing a tri-layer window. IEEE Geosci. Remote Sens. Lett. 2019, 17, 1822–1826. [Google Scholar] [CrossRef]
- Gao, C.; Meng, D.; Yang, Y.; Wang, Y.; Zhou, X.; Hauptmann, A.G. Infrared patch-image model for small target detection in a single image. IEEE Trans. Image Process. 2013, 22, 4996–5009. [Google Scholar] [CrossRef]
- Liu, T.; Liu, Y.; Yang, J.; Li, B.; Wang, Y.; An, W. Graph Laplacian regularization for fast infrared small target detection. Pattern Recognit. 2025, 158, 111077. [Google Scholar] [CrossRef]
- Liu, T.; Yang, J.; Li, B.; Wang, Y.; An, W. Representative coefficient total variation for efficient infrared small target detection. IEEE Trans. Geosci. Remote Sens. 2023, 61, 1–18. [Google Scholar] [CrossRef]
- Kou, R.; Wang, C.; Peng, Z.; Zhao, Z.; Chen, Y.; Han, J.; Huang, F.; Yu, Y.; Fu, Q. Infrared small target segmentation networks: A survey. Pattern Recognit. 2023, 143, 109788. [Google Scholar] [CrossRef]
- Liu, Q.; Liu, R.; Zheng, B.; Wang, H.; Fu, Y. Infrared small target detection with scale and location sensitivity. In Proceedings of the IEEE/CVF Conference on Computer Vision and Pattern Recognition, Seattle, WA, USA, 16–22 June 2024; pp. 17490–17499. [Google Scholar]
- Dai, Y.; Wu, Y.; Zhou, F.; Barnard, K. Asymmetric contextual modulation for infrared small target detection. In Proceedings of the IEEE/CVF Winter Conference on Applications of Computer Vision, Virtual, 5–9 January 2021; pp. 950–959. [Google Scholar]
- Dai, Y.; Wu, Y.; Zhou, F.; Barnard, K. Attentional local contrast networks for infrared small target detection. IEEE Trans. Geosci. Remote Sens. 2021, 59, 9813–9824. [Google Scholar] [CrossRef]
- Zhang, M.; Zhang, R.; Yang, Y.; Bai, H.; Zhang, J.; Guo, J. ISNet: Shape matters for infrared small target detection. In Proceedings of the IEEE/CVF Conference on Computer Vision and Pattern Recognition, New Orleans, LA, USA, 18–24 June 18 2022; pp. 877–886. [Google Scholar]
- Li, B.; Xiao, C.; Wang, L.; Wang, Y.; Lin, Z.; Li, M.; An, W.; Guo, Y. Dense nested attention network for infrared small target detection. IEEE Trans. Image Process. 2022, 32, 1745–1758. [Google Scholar] [CrossRef]
- Wu, X.; Hong, D.; Chanussot, J. UIU-Net: U-Net in U-Net for infrared small object detection. IEEE Trans. Image Process. 2022, 32, 364–376. [Google Scholar] [CrossRef] [PubMed]
- Wu, T.; Li, B.; Luo, Y.; Wang, Y.; Xiao, C.; Liu, T.; Yang, J.; An, W.; Guo, Y. MTU-Net: Multilevel TransUNet for space-based infrared tiny ship detection. IEEE Trans. Geosci. Remote Sens. 2023, 61, 1–15. [Google Scholar] [CrossRef]
- Yuan, S.; Qin, H.; Yan, X.; Akhtar, N.; Mian, A. Sctransnet: Spatial-channel cross transformer network for infrared small target detection. IEEE Trans. Geosci. Remote Sens. 2024, 62, 5002615. [Google Scholar] [CrossRef]
- Li, B.; Ying, X.; Li, R.; Liu, Y.; Shi, Y.; Li, M.; Zhang, X.; Hu, M.; Wu, C.; Zhang, Y.; et al. ICPR 2024 Competition on Resource-Limited Infrared Small Target Detection Challenge: Methods and Results. In Proceedings of the International Conference on Pattern Recognition, Kolkata, India, 1–5 December 2024; pp. 62–77. [Google Scholar]
- Zhu, Y.; Ma, Y.; Fan, F.; Huang, J.; Yao, Y.; Zhou, X.; Huang, R. Towards Robust Infrared Small Target Detection via Frequency and Spatial Feature Fusion. IEEE Trans. Geosci. Remote Sens. 2025, 63, 2001115. [Google Scholar] [CrossRef]
- He, H.; Wan, M.; Xu, Y.; Kong, X.; Liu, Z.; Chen, Q.; Gu, G. WTAPNet: Wavelet Transform-based Augmented Perception Network for Infrared Small Target Detection. IEEE Trans. Instrum. Meas. 2024, 73, 5037217. [Google Scholar] [CrossRef]
- Huang, Y.; Zhi, X.; Hu, J.; Yu, L.; Han, Q.; Chen, W.; Zhang, W. FDDBA-NET: Frequency domain decoupling bidirectional interactive attention network for infrared small target detection. IEEE Trans. Geosci. Remote Sens. 2024, 62, 5004416. [Google Scholar] [CrossRef]
- Chen, T.; Ye, Z. FreqODEs: Frequency neural ODE networks for infrared small target detection. IEEE Trans. Geosci. Remote Sens. 2024, 62, 5005912. [Google Scholar] [CrossRef]
- Cai, S.; Yang, J.; Xiang, T.; Bai, J. Frequency-Aware Contextual Feature Pyramid Network for Infrared Small Target Detection. IEEE Geosci. Remote Sens. Lett. 2025, 22, 6501205. [Google Scholar] [CrossRef]
- Ronneberger, O.; Fischer, P.; Brox, T. U-net: Convolutional networks for biomedical image segmentation. In Proceedings of the Medical Image Computing and Computer-Assisted Intervention—MICCAI 2015: 18th International Conference, Munich, Germany, 5–9 October 2015; pp. 234–241. [Google Scholar]
- Zhang, M.; Wang, Y.; Guo, J.; Li, Y.; Gao, X.; Zhang, J. IRSAM: Advancing segment anything model for infrared small target detection. In Proceedings of the European Conference on Computer Vision, Milan, Italy, 29 September–4 October 2024; pp. 233–249. [Google Scholar]
- Zhang, M.; Yue, K.; Guo, J.; Zhang, Q.; Zhang, J.; Gao, X. Computational Fluid Dynamic Network for Infrared Small Target Detection. IEEE Trans. Neural Netw. Learn. Syst. 2025, 1–13. [Google Scholar] [CrossRef] [PubMed]
- Chen, L.; Gu, L.; Li, L.; Yan, C.; Fu, Y. Frequency Dynamic Convolution for Dense Image Prediction. arXiv 2025, arXiv:2503.18783. [Google Scholar]
- Cui, Y.; Ren, W.; Cao, X.; Knoll, A. Image restoration via frequency selection. IEEE Trans. Pattern Anal. Mach. Intell. 2023, 46, 1093–1108. [Google Scholar] [CrossRef]
- Chen, L.; Fu, Y.; Gu, L.; Yan, C.; Harada, T.; Huang, G. Frequency-aware feature fusion for dense image prediction. IEEE Trans. Pattern Anal. Mach. Intell. 2024, 46, 10763–10780. [Google Scholar] [CrossRef] [PubMed]
- Finder, S.E.; Amoyal, R.; Treister, E.; Freifeld, O. Wavelet convolutions for large receptive fields. In Proceedings of the European Conference on Computer Vision, Milan, Italy, 29 September–4 October 2024; pp. 363–380. [Google Scholar]
- Cheng, B.; Misra, I.; Schwing, A.G.; Kirillov, A.; Girdhar, R. Masked-attention mask transformer for universal image segmentation. In Proceedings of the IEEE/CVF Conference on Computer Vision and Pattern Recognition, New Orleans, LA, USA, 18–22 June 2022; pp. 1290–1299. [Google Scholar]
- Cheng, A.; Yin, C.; Chang, Y.; Ping, H.; Li, S.; Nazarian, S.; Bogdan, P. MaskAttn-UNet: A Mask Attention-Driven Framework for Universal Low-Resolution Image Segmentation. arXiv 2025, arXiv:2503.10686. [Google Scholar]
- Pitas, I. Digital Image Processing Algorithms and Applications; John Wiley & Sons: Hoboken, NJ, USA, 2000. [Google Scholar]
- Wang, H.; Wu, X.; Huang, Z.; Xing, E.P. High-frequency component helps explain the generalization of convolutional neural networks. In Proceedings of the IEEE/CVF Conference on Computer Vision and Pattern Recognition, Seattle, WA, USA, 13–19 June 2020; pp. 8684–8694. [Google Scholar]
- Chen, L.; Gu, L.; Zheng, D.; Fu, Y. Frequency-adaptive dilated convolution for semantic segmentation. In Proceedings of the IEEE/CVF Conference on Computer Vision and Pattern Recognition, Seattle, WA, USA, 16–22 June 2024; pp. 3414–3425. [Google Scholar]
- Huang, J.; Huang, R.; Xu, J.; Peng, S.; Duan, Y.; Deng, L.J. Wavelet-Assisted Multi-Frequency Attention Network for Pansharpening. In Proceedings of the AAAI Conference on Artificial Intelligence, Philadelphia, PA, USA, 25 February–4 March 2025; Volume 39, pp. 3662–3670. [Google Scholar]
- Li, K.; Wang, D.; Hu, Z.; Zhu, W.; Li, S.; Wang, Q. Unleashing channel potential: Space-frequency selection convolution for SAR object detection. In Proceedings of the IEEE/CVF Conference on Computer Vision and Pattern Recognition, Seattle, WA, USA, 16–22 June 2024; pp. 17323–17332. [Google Scholar]
- He, K.; Zhang, X.; Ren, S.; Sun, J. Deep residual learning for image recognition. In Proceedings of the IEEE Conference on Computer Vision and Pattern Recognition, Las Vegas, NV, USA, 27–30 June 2016; pp. 770–778. [Google Scholar]
- Wang, H.; Cao, P.; Wang, J.; Zaiane, O.R. Uctransnet: Rethinking the skip connections in u-net from a channel-wise perspective with transformer. In Proceedings of the AAAI Conference on Artificial Intelligence, Online, 22 February–1 March 2022; Volume 36, pp. 2441–2449. [Google Scholar]
- Ma, J.; Chen, J.; Ng, M.; Huang, R.; Li, Y.; Li, C.; Yang, X.; Martel, A.L. Loss odyssey in medical image segmentation. Med. Image Anal. 2021, 71, 102035. [Google Scholar] [CrossRef]
- Sudre, C.H.; Li, W.; Vercauteren, T.; Ourselin, S.; Jorge Cardoso, M. Generalised dice overlap as a deep learning loss function for highly unbalanced segmentations. In Deep Learning in Medical Image Analysis and Multimodal Learning for Clinical Decision Support: Third International Workshop, DLMIA 2017, and 7th International Workshop, ML-CDS 2017, Held in Conjunction with MICCAI 2017, Québec City, QC, Canada, September 14, Proceedings 3; Springer: Berlin/Heidelberg, Germany, 2017; pp. 240–248. [Google Scholar]
- Fan, Y.; Lyu, S.; Ying, Y.; Hu, B. Learning with average top-k loss. Adv. Neural Inf. Process. Syst. 2017, 30, 497–505. [Google Scholar] [CrossRef]

Disclaimer/Publisher’s Note: The statements, opinions and data contained in all publications are solely those of the individual author(s) and contributor(s) and not of MDPI and/or the editor(s). MDPI and/or the editor(s) disclaim responsibility for any injury to people or property resulting from any ideas, methods, instructions or products referred to in the content. |
© 2025 by the authors. Licensee MDPI, Basel, Switzerland. This article is an open access article distributed under the terms and conditions of the Creative Commons Attribution (CC BY) license (https://creativecommons.org/licenses/by/4.0/).