1. Introduction
Succulent plants are a unique type of drought-resistant vegetation that can store large amounts of water in their leaves, stems, or roots, making them highly adaptable to various environments [
1]. Globally, succulents have diverse purposes—from ornamental uses to food sources, fibers, beverages, and natural products [
2]. Studies have shown that they also have potential in the field of bioenergy [
3]. Due to their resilience in the face of global climate change, succulents are highly valued for their role in habitat protection, urban environments, and ecosystem services [
2]. Particularly in ecological agriculture, succulents play a crucial role in arid and semi-arid regions, which contributes to water conservation, soil erosion control, and ecosystem stability [
4].
The research on succulent plant classification holds significant ecological and economic value. Accurate classification benefits biodiversity conservation and plant resource management and deepens our understanding of different species [
2]. Moreover, it supports the horticultural industry, enabling hobbyists and businesses to identify and select varieties effectively, thereby optimizing cultivation and sales [
5]. Given the diversity of succulent species and the challenges in their identification, particularly for non-experts, large-scale classification studies are essential [
6]. Such studies facilitate precision agriculture and sustainable ecological practices, which can boost farmer incomes and promote agricultural technology.
In recent years, computer vision (CV) technology has been widely applied for agriculture, which uses advanced image acquisition tools and intelligent algorithms to obtain accurate monitoring of crop growth conditions [
7,
8]. For example, CV has been used to detect grape clusters [
9], assist in palm oil plantation management [
10], and determine wheat growth stages [
11]. CV also plays a key role in succulent plant detection. By analyzing succulent images, CV can identify plant varieties, offering valuable management insights to optimize growing conditions and enhance both the quality and ornamental value of succulents [
12].
The combination of CV and unmanned aerial vehicles (UAVs) has become a leading method in precision agriculture since it has high detection accuracy, cost-efficiency, full-field coverage, ease of use, and the ability to support decision-making [
13,
14,
15,
16]. CV and UAV-based techniques have been used to study farmland–soil temperature relationships [
17], evaluate agronomic parameters in winter wheat [
18], and estimate cabbage biomass [
19]. However, traditional digital image processing (DIP) methods such as color, texture, and shape feature extraction can be influenced by observer subjectivity, reducing classification accuracy [
20]. Furthermore, succulents have very little morphological variation, making them difficult to classify by traditional methods [
21].
Deep learning-based image processing, especially convolutional neural networks (CNNs), has gained attention for its ability to extract high-level features from images automatically, improving object detection and classification accuracy [
22]. CNN-based models have been used in various crop detection tasks, including disease detection [
23] and crop classification optimization [
24]. CNNs have evolved from simple plant recognition [
25] to more complex tasks such as fruit detection using Faster Region-based Convolutional Neural Network (Faster R-CNN) [
26]. However, the fine-grained classification of succulent plants remains challenging due to minimal differences between classes and significant variability within the same class, which are further compounded by limited datasets and suboptimal image quality [
21].
Data augmentation (DA) can help address the problem of limited datasets by generating more training samples, although it may sometimes impact model accuracy if the augmented data fails to preserve the original characteristics [
27]. At the same time, UAVs as a data collection tool can provide real and diverse data sources to further supplement the actual scene information that cannot be generated by DA. UAV-based remote sensing, combined with deep learning, has facilitated precise crop classification, yield estimation, and water stress monitoring [
28,
29,
30]. However, due to vibrations and altitude constraints, UAVs face limitations in image resolution and quality, which compromises detection efficiency [
31,
32].
Super-resolution reconstruction (SRR) techniques, especially deep learning-based models, offer potential solutions to the UAV low-resolution problem [
33]. SRR can enhance image resolution and restore or enhance detailed information in an image by transforming low-resolution (LR) images to high-resolution (HR) images. SRR algorithms can also improve model performance [
34]. Traditional approaches contain interpolation, reconstruction-based methods, and more recently, learning-based techniques [
35]. Among them, deep learning-based SRR algorithms have demonstrated superior performance by learning complex image patterns through deep learning models [
36,
37].
The SRR model based on MambaIR integrates state-space modeling, balancing global receptive fields and efficient computation while restoring image details [
38]. These models have been applied in fields like medical image reconstruction, but their potential for enhancing succulent plant classification remains largely untapped.
This study introduces an innovative approach that combines SRR with an object detection model to improve succulent plant detection and classification. By integrating MambaIR-based SRR with YOLOv10, this approach enhances detection accuracy in low-resolution images. Additionally, we utilize the contrastive language-image pre-training (CLIP) image-text encoder [
39] to enhance feature extraction and classification capabilities. We further analyzed the effects of scaling factors, Gaussian blur, and noise on image degradation and reconstruction and evaluated the robustness of the proposed detection model using these newly generated test sets.
The structure of this paper is outlined below:
Section 2 outlines the research area, details regarding data acquisition, preprocessing procedures, and the algorithms utilized for both SRR and object detection.
Section 3 presents experimental outcomes and compares multiple SRR methods.
Section 4 explores the effects of magnification scale, various detection architectures, Gaussian blur, and noise on detection performance. Finally,
Section 5 concludes the paper.
The outline of the current study is organized as follows:
Section 2 introduces the survey site, image acquisition and preprocessing procedures, as well as the reconstruction and identification algorithms employed.
Section 3 presents the experimental results, including a comparative analysis of different SRR algorithms.
Section 4 discusses the degradation of the test datasets and evaluates the robustness of the proposed detection model.
Section 5 concludes the study.
2. Materials and Methods
The workflow of the current research is shown in
Figure 1:
Step 1: High-definition images are captured using UAVs for data collection. As a data preprocessing step, the Scale-Invariant Feature Transform (SIFT) [
40] algorithm is applied to process these images and generate panoramic images for mapping the distribution of succulent plants.
Step 2: For image SRR, the panoramic images of succulent plants are cropped into 600 × 600 pixel blocks to construct the HR dataset. The HR dataset is then downsampled to generate an LR dataset of 150 × 150 pixels. Several deep learning-based SRR methods, including MambaIR, are utilized on the LR dataset to enhance the resolution to 600 × 600 pixels. Additionally, various augmentation strategies are applied to enrich the dataset and enhance its variability.
Step 3: In the object detection stage, the HR dataset is divided into training and validation subsets. Various detectors, including Faster R-CNN, DEtection Transformer (DETR), Ghost Network (GhostNet), the You Only Look Once (YOLO) series, and the Succulent-YOLO model, are applied. These models are then used on the SRR dataset to produce prediction results.
Step 4: The visualization stage primarily involves result visualization and further analysis. First, Gradient-weighted Class Activation Mapping (Grad-CAM) technology is employed to generate heatmaps that highlight the key parts within the images that the detector focuses on. The subsequent analysis centers on several points: the impact of the SRR scaling ratio, the performance of different detectors on degraded test sets, and the robustness of the proposed model. The workflow of this study is shown in
Figure 1. The entire process is divided into four main stages: data collection, super-resolution reconstruction, object detection, and quantification.
2.1. Survey Site
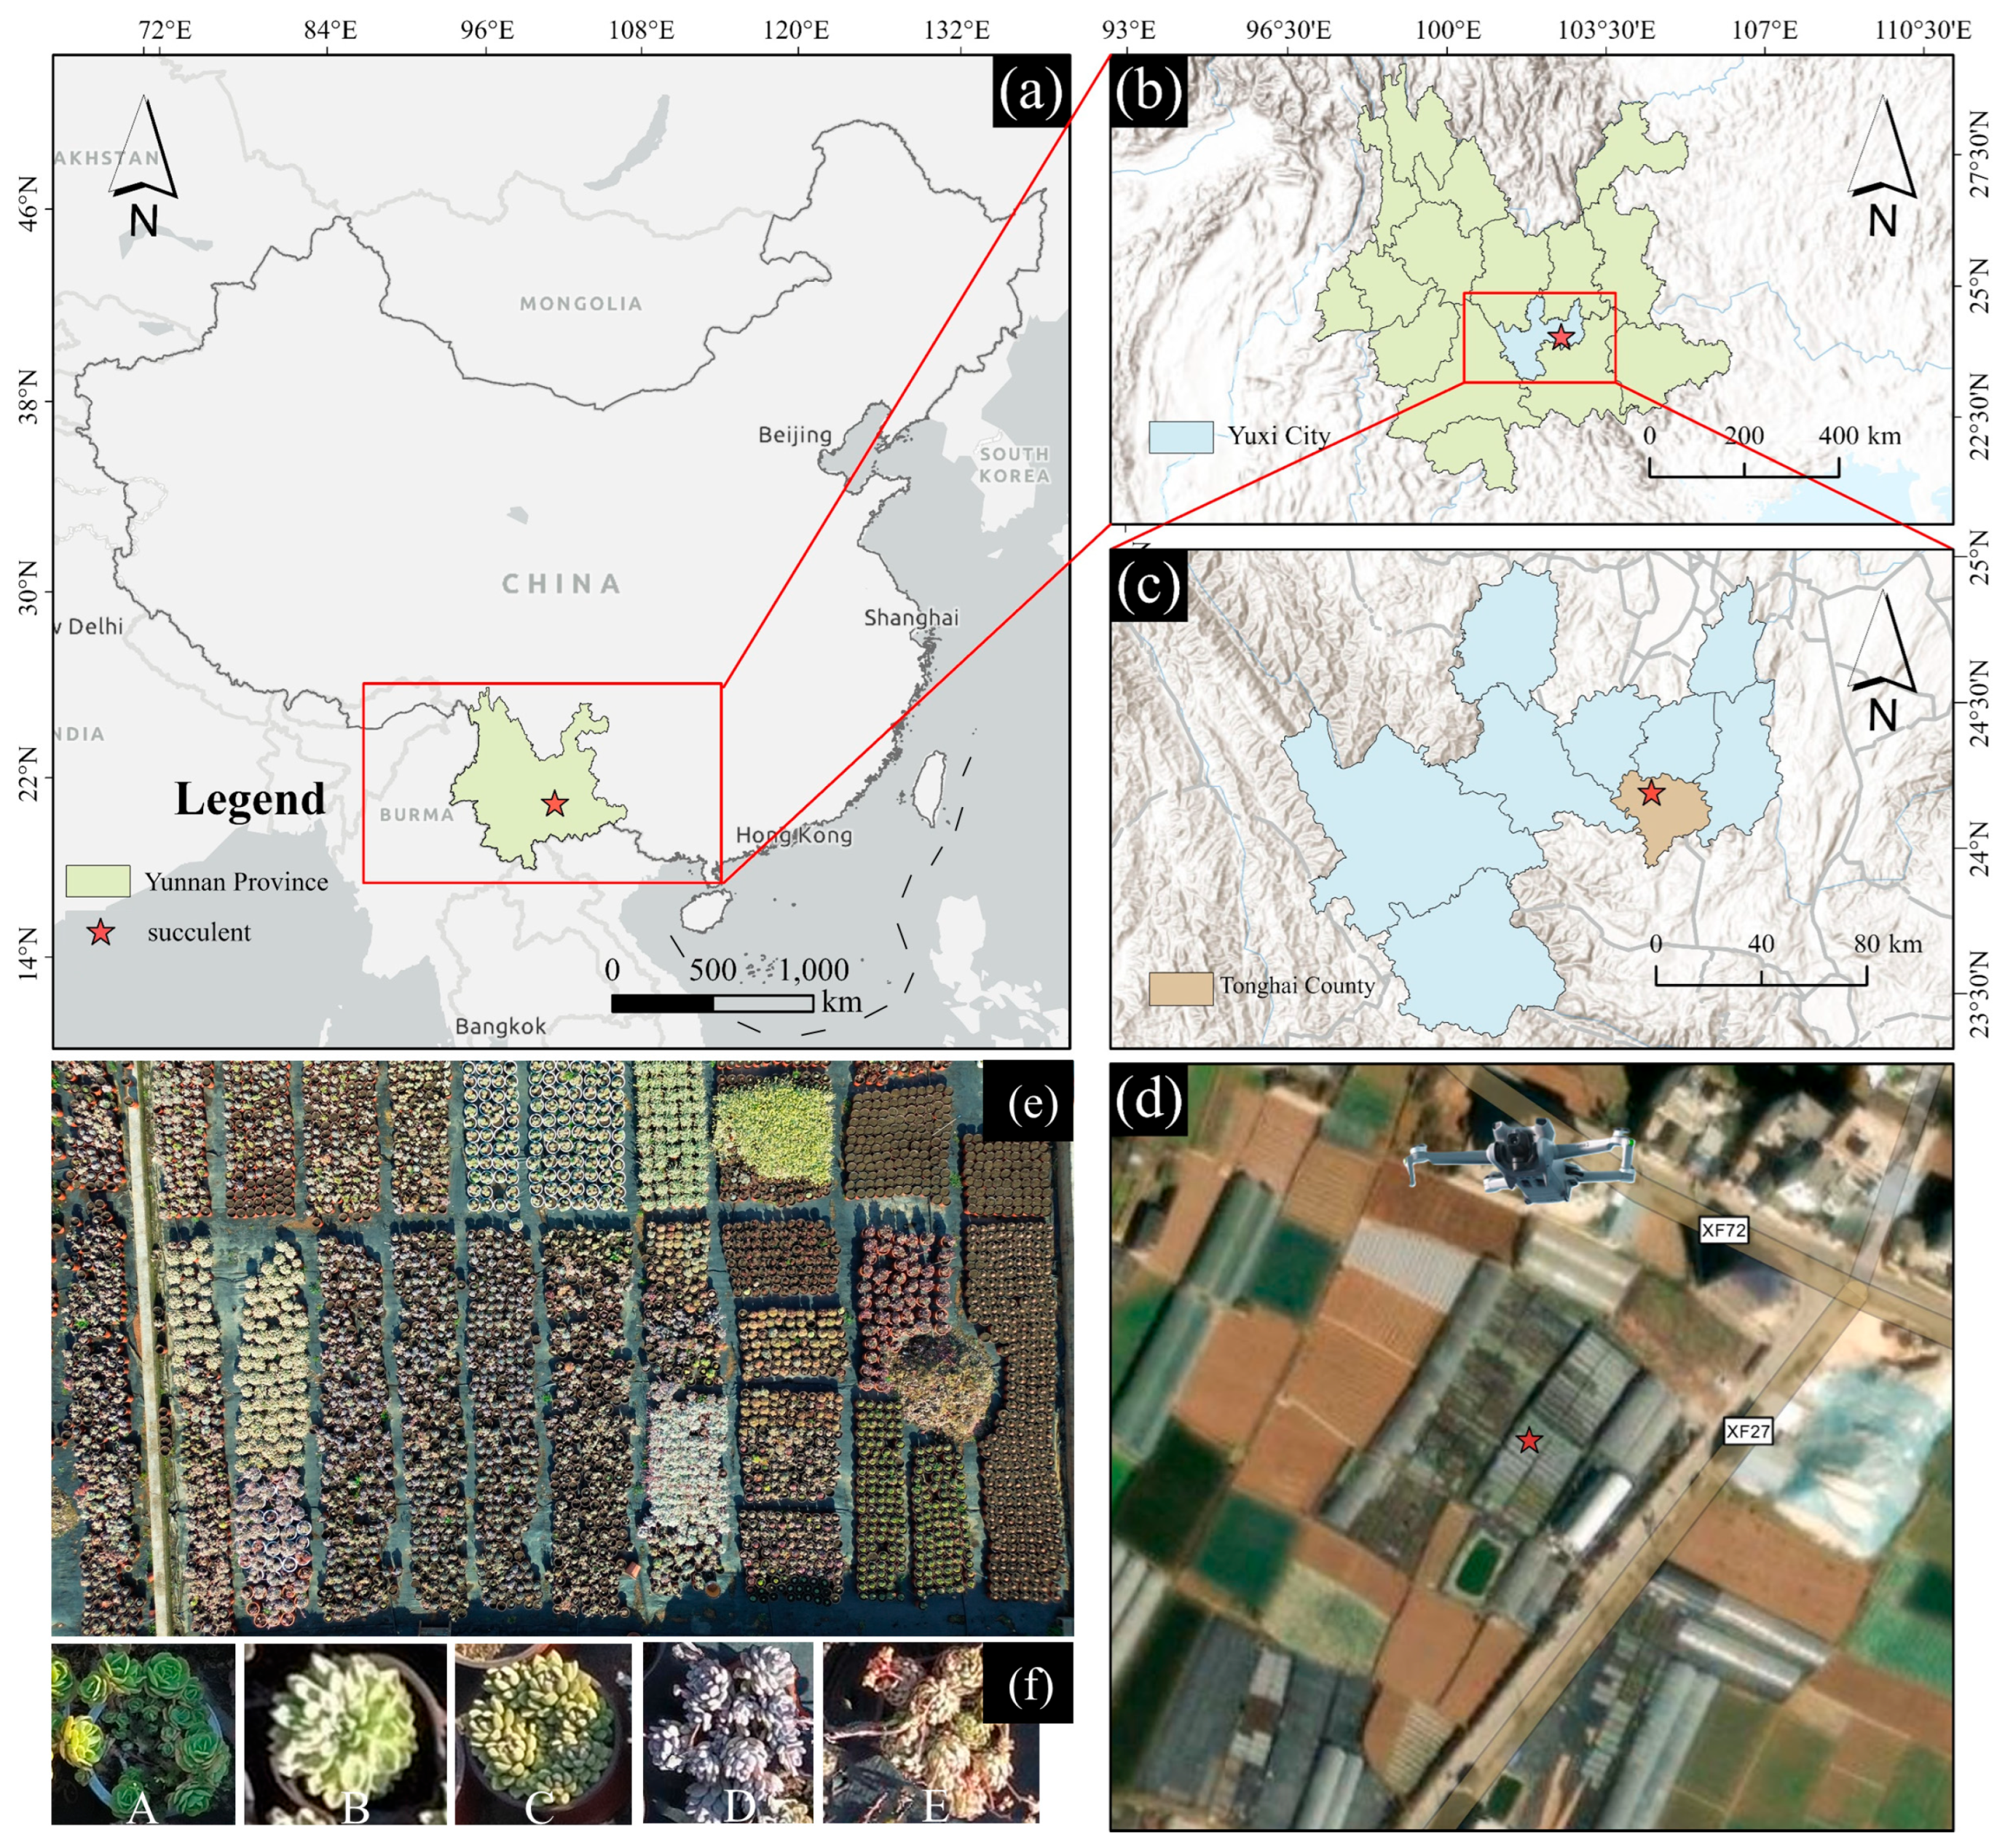
A field survey was conducted at a succulent plant cultivation base in Yuxi City, China, as shown in
Figure 2. The city’s unique geographic and climatic conditions make it a key production area for succulent plants. As an important flower planting base in Yunnan Province, Tonghai County has shown a good development trend in succulent planting driven by policy support and market demand. In 2024, the planting area of succulent plants in Tonghai County was 9600 acres, and the output was 81.58 million pots. The floral industry makes a significant contribution to agricultural output, with both planting area and yield showing an upward trend.
2.2. Data Collection and Preprocessing
In recent years, UAVs have become essential tools for agricultural surveys since they offer efficiency, precision, and flexibility in crop image collection [
41,
42,
43,
44]. This study employed the DJI Mini 3 UAV for data collection. The device features a compact structure, high-resolution imaging capabilities, and longer working hours, which contribute to the accurate capture of succulent plant images. The compact structure and intelligent navigation further enhance its operability in confined environments, optimizing work efficiency. To ensure comprehensive coverage of the collected data, the Mini 3 follows a curved flight path, allowing it to capture multi-angle images without the need to adjust the camera angle. This minimized redundant data, stabilized the camera to prevent blurring, and ultimately improved image quality. The full data collection procedure is completed within approximately 30 min.
The UAV acquired high-resolution images at 600 × 600 pixels. The captured images were subsequently used to generate a panoramic visualization covering the full succulent planting region. To achieve this, the SIFT algorithm was adopted for stitching multiple image frames, as depicted in
Figure 2d,e.
Figure 2d is intended to show the orthophoto image of the target area obtained by the drone. Geometric distortion was corrected by using tie points generated through SIFT-like feature matching, followed by iterative bundle block adjustment (BBA), which refined internal and external camera parameters and distortion coefficients to minimize reprojection error. Orthorectification was performed using DEM or point cloud-based terrain elevation references to project corrected images onto a planar map, applying a parallel (orthogonal) projection into the WGS 84/UTM Zone 47N coordinate system. The integration process included identifying shared regions across successive frames, aligning consistent visual features, and combining them to form a seamless panoramic image of the succulent area. As shown in
Figure 2f and
Figure 3, the Labeling 1.8.1 tool was employed to manually annotate each plant type, with the annotated instances categorized into six categories. The annotated sections were subsequently cropped into high-resolution patches with dimensions of 600 × 600 pixels.
2.3. Super-Resolution Reconstruction Using Deep Learning Techniques
Driven by advancements in computational power, SRR methods based on deep learning have witnessed substantial progress in recent years [
45,
46]. These approaches utilize neural networks, typically taking LR images—obtained via downsampling or synthetic degradation—as input and reconstructing HR outputs [
36]. The LR images are processed through convolutional layers for feature extraction, followed by upsampling stages to produce HR results. The selection of loss functions plays a pivotal role in determining SRR performance, as lower loss values generally reflect better model generalization. Frequently employed loss functions include pixel-level losses (L1, L2, Charbonnier), mean squared error (MSE), perceptual loss, content loss, and adversarial loss. A well-chosen loss function can not only enhance reconstruction quality but also facilitate faster convergence during training [
36].
2.3.1. Architectures of SRR Models
Deep learning-based SRR utilizes various network architectures, including CNN-based models (e.g., Super-Resolution Convolutional Neural Network, Very Deep Super-Resolution, Enhanced Super-Resolution Generative Adversarial Network), Transformer-based models, and state-space models like MambaIR, each offering distinct advantages in their respective domains. These models have accelerated the rapid development of deep learning, driving its application across various fields.
Early SRR models, such as Super-resolution convolutional neural network (SRCNN) and Deeply-recursive convolutional network (DRCN), used CNNs to learn mappings from LR to HR images. While these models are simple and easy to implement, SRCNN struggles with complex image content and fine details. With the increasing demand for higher-quality image reconstruction, CNN-based models face challenges in preserving image details and quality. To address these challenges, new architectures like GANs, Transformers, and MambaIR introduce innovative solutions, significantly improving image quality. Enhanced super-resolution generative adversarial network (ESRGAN) and Super-Resolution Generative Adversarial Network (SRGAN) employ adversarial training to enhance image quality, improve textures and details, thereby generating more realistic HR images. Transformers, with their self-attention mechanisms, excel at capturing global information and handling long-range dependencies, which makes them ideal for large-scale image reconstruction. MambaIR employs lightweight attention modules and hierarchical design to improve both efficiency and performance.
As shown in
Figure 4, this paper evaluates traditional bicubic interpolation and SRR models based on deep learning, emphasizing their improvements in detail preservation, computational efficiency, and structural complexity. SRCNN, the first to use a shallow network for LR-to-HR mapping, lays the foundation for future work. Enhanced deep residual network (EDSR) improves deep feature extraction by removing batch normalization in ResBlocks. Very deep residual channel attention network (RCAN) introduces channel attention to better restore fine details. Real-world blind super-resolution with pure synthetic data (Real-ESRGAN) refines the degradation model and produces higher-quality images. Swin Transformer for Image Restoration (SwinIR) and Transformer-based models combine convolution and self-attention for high-quality restoration with fewer parameters, reducing noise and artifacts. MambaIR integrates state-space modeling, further enhancing global perception and significantly improving restoration performance.
2.3.2. Network Optimization and Training Process
Training SRR networks involves inputting paired LR and HR images into the model. Next, the model evaluates the difference between the predicted and true HR images through a loss function. By iteratively adjusting the model parameters, the model gradually learns how to transform LR images into SR images that closely match the real HR images. Over time, this optimization process enhances the model’s performance, ultimately generating clearer and more detailed HR images. For CNN-based models (e.g., SRCNN, Very Deep Super Resolution), L1 loss is commonly used. For GAN-based models (e.g., Super-Resolution Generative Adversarial Network, ESRGAN), optimization includes perceptual and adversarial losses. For MambaIR-based models, L1 and Charbonnier losses are employed.
2.3.3. SRR Evaluation Metrics
With the growing use of super-resolution (SR) techniques, assessing the fidelity of reconstructed images has become increasingly significant. As noted by Sara et al. [
47], the evaluation of image quality often involves measuring how closely the generated HR image resembles the original HR version. To evaluate the impact of SRR methods, this paper adopts two widely recognized quantitative evaluation indicators: Peak Signal-to-Noise Ratio (PSNR) and Structural Similarity Index (SSIM).
is a commonly used objective metric in super-resolution tasks, which reflects the difference between the reconstructed image and the original high-resolution image. A greater
value indicates superior image quality. The formula for calculation is as follows:
where
indicates the highest possible pixel intensity in the image, and
denotes the mean of the squared differences between corresponding pixel values.
is another widely used image quality metric that considers not only pixel differences but also brightness, contrast, and structural information. The formula for calculation is as follows:
where
and
are the mean values of the images,
and
are the variances,
is the covariance, and
and
are constants.
2.4. Object Detection
2.4.1. Network Architectures for Object Recognition
Object detection methods based on deep learning are classified into two types: two-stage and one-stage. Two-stage methods start by generating candidate regions, then classify and regress them to determine the object’s category and location. Algorithms like the RCNN series (e.g., RCNN, Fast-RCNN) fall under this category. While they offer high accuracy, they are slower. In contrast, one-stage methods directly detect objects across the entire image without generating candidate regions, making them faster. Notable examples include the YOLO series and Single Shot Multibox Detector (SSD). The YOLO series is favored for its efficiency, accuracy, and lightweight design. By adopting a one-stage approach, YOLO achieves a simpler architecture and easier training and deployment, making it ideal for devices with limited computational resources. YOLO was originally proposed by Joseph Redmon as a single-stage regression problem [
48]. In 2024, Wang et al. proposed YOLOv10, which incorporates a unified dual-assignment training strategy, removing the requirement for non-maximum suppression (NMS), reducing latency, and enhancing deployment efficiency. It also optimizes component design to maintain accuracy while minimizing computational overhead [
49]. Saving computational resources is crucial for succulent plant detection, which can improve the real-time system, reduce hardware requirements, and significantly reduce the consumption of computational resources while guaranteeing detection accuracy and promote the practical application and promotion of succulent plant detection technology.
However, succulent plants exhibit significant diversity in shape, color, and texture, which makes accurate recognition challenging. The varying leaf structures—some tightly clustered, others loosely spread—further complicate image detection. To overcome these difficulties, this study presents the Succulent-YOLO model, which is based on YOLOv10 and incorporates three improvements: (1) a text-image encoder: contrastive language-image pre-training (CLIP); (2) a dynamic group convolution structure (DGCST); and (3) a multi-scale fusion neck network: semantics and detail infusion (SDI). These improvements enable Succulent-YOLO to achieve high-precision, fast classification in complex environments, making it ideal for succulent plant detection tasks. The YOLOv10 improved model is shown in
Figure 5.
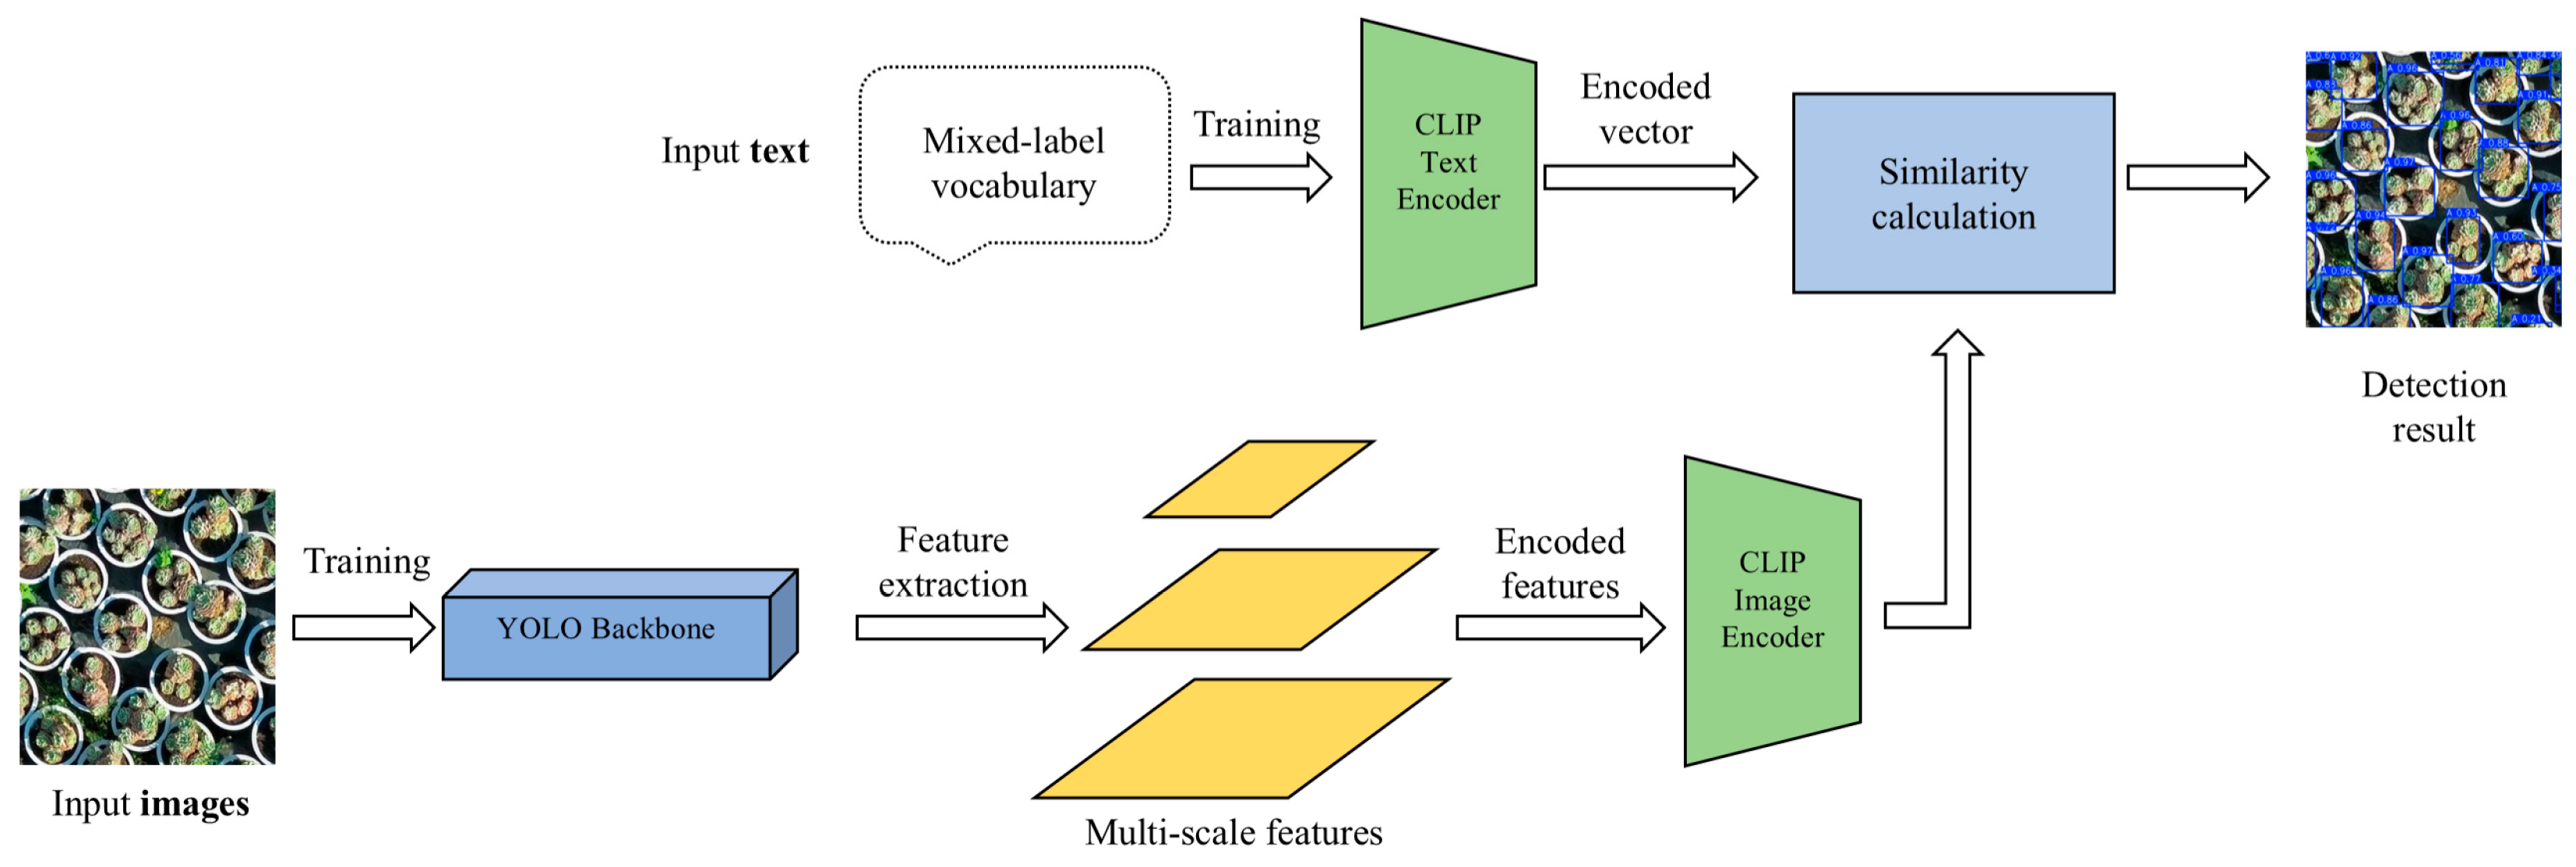
This study uses manually annotated label data and image features as input, employing YOLOv10 to extract features and obtain target region images. These images and labels are input into an optimisation module, where NMS operations are performed to select key target feature regions using CLIP image and text matching non-maximum suppression. The selected target features are then combined to form the final training data. The enhanced dataset using Mosaic is used to train the optimised model. During the training phase, as shown in
Figure 6, images and data labels are input into the YOLOv10 backbone and CLIP text encoder, respectively. The backbone is then used as the main embedding, constrained by CLIP-based semantic information, along with the embedded category label text. CLIP text matching is used to achieve dual embedding, and the CLIP-based classification branch aligns with the zero-shot detection (ZSD) of the CLIP model for classification transfer learning. The YOLOv10 backbone network is enhanced with the proposed DGCST structure to improve its ability to detect unknown object features. The enhanced features are then input into the neck network for feature fusion. During the inference phase, images of size 600 × 600 are processed through the backbone and neck feature pyramid networks for feature extraction. The generated features are input into the detection head, where they undergo regression and classification branches to obtain the bounding box positions of detected objects and the semantic information of embedded image regions, respectively. The object categories are obtained through similarity matching with the text generated from the data labels.
2.4.2. Model Training and Refinement
At the initial stage of training, the model uses its backbone network to capture critical features from the input images. Subsequently, to further enhance detection accuracy, Succulent-YOLO employs a dual-part loss function consisting of classification and regression losses. Specifically, the classification loss is determined using the Binary Cross-Entropy (
BCE) method, effectively measuring discrepancies between the predicted outcomes and corresponding ground truth annotations, thereby guiding the model toward improved classification performance. The formula for calculation is as follows:
Here,
refers to the total count of predictions made,
indicates the true label for the
instance, and
corresponds to the probability estimated by the model. The output of this loss function reflects the difference between the predicted probability distribution and the ground truth labels, acting as an indicator of the model’s prediction accuracy. A smaller
BCE loss value implies that the predicted probabilities are closer to the actual labels, indicating better model performance.
The regression loss combines Distribution Focal Loss (
) and Complete IoU (
) loss.
addresses the issue of sample imbalance by accounting for the distribution of the object, directing more attention to hard-to-classify samples and thereby improving detection performance.
considers the overlapping area between bounding boxes while incorporating additional factors to further enhance detection accuracy. Their calculation formulas are as follows:
Here,
represents the ground truth label,
is the predicted probability by the model,
is a coefficient for balancing positive and non-positive samples, and
is a hyperparameter that adjusts the weight of easy and hard samples.
Here,
represents the intersection-over-union between the predicted bounding box and the ground truth bounding box.
denotes the center coordinates of the predicted bounding box, while
represents the center coordinates of the ground truth bounding box.
indicates the Euclidean distance between the center points of the predicted and ground truth bounding boxes.
represents the diagonal length of the smallest enclosing box covering both the predicted bounding box and the corresponding ground truth. Additionally,
denotes the loss associated with aspect ratio differences, quantifying how closely the predicted bounding box matches the ground truth in terms of width-to-height proportion.
By combining
BCE,
, and
loss functions, the Succulent-YOLO model can be trained in a balanced manner. The total loss is calculated as follows:
Here,
,
, and
are the weights used to balance the
BCE,
, and
loss functions. The Adam optimizer is used to optimize this combined loss function, significantly boosting the training effectiveness and final performance in succulent plant detection, which is characterized by small inter-class differences and large intra-class variations.
2.4.3. Metrics for Evaluating Object Detection
The following evaluation metrics are used: Precision, Recall, Average Precision (), Mean Average Precision (), and Intersection over Union (). Precision measures the proportion of correctly identified positive instances relative to the total number of predicted positives (). Recall evaluates the proportion of correctly detected true positives () relative to all actual objects (). AP evaluates performance by averaging precision across various recall levels. mAP represents the mean AP across all categories in multi-class detection. measures the extent of intersection between predicted bounding boxes and their corresponding ground truth annotations.
The corresponding formulas are as follows:
Here,
,
, and
refer to True Positives, False Negatives, and False Positives, respectively.
refers to the number of succulent plant samples correctly identified as belonging to a specific category.
refers to the count of succulent plant samples that should be in a certain category but are misclassified as different ones.
denotes the count of instances that are incorrectly assigned to a specific class. A model with high precision indicates strong capability in identifying true positive cases while minimizing incorrect positive predictions. A high recall indicates that the model can detect most actual positive samples, with fewer missed detections. A higher
value signifies strong precision performance across different recall levels, demonstrating overall robustness. The higher the
, the better the model performs across all categories.
evaluates the accuracy of predicted bounding boxes—by setting a threshold (e.g., 0.5), a prediction is considered a true positive if the
exceeds the threshold. A higher
value reflects increased overlap between the predicted and ground truth boxes, resulting in improved localization accuracy.
3. Results
3.1. Dataset Details
This study utilized a dataset collected by a drone to train each succulent plant detection model. The dataset consists of 597 succulent plant images with a resolution of 600 × 600 pixels. To enhance diversity and improve the model’s generalization ability and robustness, geometric transformations such as flipping, rotation, and cropping were applied [
27]. By applying image augmentation techniques, the training set contains 30 times more images than before, resulting in a training dataset of 18,000 images, ultimately producing HR images.
To train the super-resolution reconstruction model, a composite degradation model was used to generate LR images from HR images, enabling the model to learn image degradation patterns that closely resemble real-world scenarios [
36]. The downsampling model is formulated as:
Let
and
denote the low-resolution and high-resolution images, respectively. The variable
indicates the point spread function (PSF) corresponding to uniform linear motion, while the symbol
denotes the convolution operation. The operator
signifies bicubic downsampling with a scaling factor of
.
is additive Gaussian white noise, employed to replicate the randomness found in real-world imaging conditions.
LR sub-images of size pixels are generated from the LR images by cropping method, so that it can increase the diversity of the dataset and improve the training efficiency. Then, to ensure accurate alignment, HR sub-images with dimensions of pixels are extracted from identical coordinates within the HR images. These sub-images are then paired with their corresponding LR counterparts to construct the training dataset. After preprocessing, 18,000 high-resolution images are separated into training, validation, and testing subsets according to a 7:1:2 distribution.
3.2. Experiment Design
In this work, seven SRR models were investigated for their effectiveness in enhancing images of succulent plants. Initially, various SRR architectures were trained and subsequently applied to restore high-resolution (SR) images from their LR counterparts. The reconstructed image quality was quantitatively evaluated using PSNR and SSIM. Following this, the enhanced Succulent-YOLO model was developed using both the training and test partitions of the original succulent plant image dataset. The detection performance of the trained model was then measured using standard evaluation metrics, including precision, recall, and mAP, across datasets such as HR, Bicubic, and SR. To further analyze the impact of SRR techniques on plant detection performance, Grad-CAM was employed to produce visual explanations via heatmaps, thereby enhancing the interpretability of the detection outcomes.
The experiment environment parameters are shown in
Table 1. Input images for this experiment are of size 600 × 600, with an initial learning rate of 0.01. The learning rate was optimized through the stochastic gradient descent (SGD) algorithm, set with a momentum factor of 0.937 and a weight decay of 0.0005. Additionally, Mosaic data augmentation was implemented during the training phase, randomly selecting four images per batch and applying transformations such as flipping, scaling, and rotation before merging them, thus significantly diversifying the training set and enhancing the robustness of detection. To prevent overfitting and boost generalization, label smoothing is applied with a value of 0.01. Model training was conducted over 500 epochs using a batch size of 32, with 32 worker threads allocated for data loading.
3.3. Assessment of Super-Resolution Techniques
To analyze the capability of various SRR approaches in improving the resolution of succulent plant imagery, eight models were implemented and their outputs were quantitatively evaluated using PSNR and SSIM metrics, as presented in
Table 2.
Table 3 shows comparison of SRR architectures by parameters, training time, and inference time. The experimental results indicate that SRR models based on deep learning architectures consistently outperform the traditional bicubic interpolation approach in terms of both PSNR and SSIM, thereby demonstrating superior performance in high-fidelity image restoration. Nevertheless, the SRR images generated by the Real-ESRGAN method show lower PSNR and SSIM values, likely due to its use of perceptual loss, which focuses on high-level feature similarity between generated and real images, enhancing details and textures [
50]. Among all methods, MambaIR achieved the highest performance, with PSNR and SSIM values of 23.83 dB and 79.6%, respectively. MambaIR has a higher SSIM but lower PSNR for two main reasons. On the one hand, the higher SSIM of MambaIR in terms of the structural features of the model indicates that it can identify fine features such as leaf edges, vein patterns, and surface irregularities. In addition, since the features of MambaIR and SwinIR are different, it is more appropriate to use MambaIR for fine textures, thus distinguishing similar succulent species based on surface structure. For smoother images, it is better to use SwinIR. On the other hand, there are slight differences in the curvature and edges of the leaves of different species as seen in the features of the images, and the surface pattern and vein distribution may not be captured in the low-resolution images, which may also lead to such differences in MambaIR.
From a technical perspective, unlike SwinIR, which relies on hierarchical shifted window attention, MambaIR employs the state-space model, enabling it to effectively model global context with a linear computational complexity. This architectural advantage translates to reduced computational cost and enhanced performance on our specific task, especially when handling larger image patches or scenarios requiring extensive spatial correlation modeling. While SwinIR performs well through localized attention, its reliance on window-based operations can limit its effectiveness for tasks demanding global coherence across extensive image regions. In contrast, MambaIR’s global-context approach aligns closely with our task objectives—precisely reconstructing high-resolution features from images with subtle yet significant details. Therefore, considering computational efficiency, accuracy, and suitability for our super-resolution reconstruction task, MambaIR was deemed the more appropriate choice.
Figure 7 illustrates the super-resolution processing applied to the input images, which are already pre-processed through object detection. The Bicubic method generates a blurry image, failing to capture the complex textures of succulent plants. Conversely, deep learning-based methods produce sharper images with more precise textures and edges, closely matching the original HR image. However, CNN-based methods, due to the locality of convolution operations, tend to generate blurry edges and struggle with high-frequency details [
51]. While generative adversarial network (GAN)-based methods provide sharper details, they may overemphasize certain features or create unnatural textures, particularly in succulent plants, which have soft, natural textures. Transformer-based methods improve clarity and texture but still fall short of MambaIR. MambaIR excels in preserving high-frequency details, maintaining the complex textures and edges of succulent images. Its unique reconstruction mechanism avoids the blurriness common in CNNs and the unrealistic detail generation seen in GANs.
Despite significant improvements in image clarity and detail restoration, deep learning methods still face challenges, such as excessive edge smoothing that can result in unnatural textures. This is particularly important in succulent plant texture detection, where leaf structures and surface details are crucial for accurate identification. Nevertheless, SRR approaches powered by deep learning have demonstrated notable advancements compared to conventional techniques, underscoring their effectiveness in achieving high-fidelity image reconstruction.
3.4. Grad-CAM Visualization of Object Detection Results
A performance assessment was carried out on the Bicubic approach alongside six deep learning-driven SRR models by employing the Succulent-YOLO network.
Table 4 lists the mAP values for the HR test set and other methods (Bicubic and SRR), reflecting the detection effectiveness and overall performance of the different methods. Significantly, the mAP value for the HR test set stands at the highest, 87.8, indicating that Succulent-YOLO achieves very high accuracy in succulent plant detection. Among the deep learning-based SRR methods, MambaIR achieved an mAP of 85.1, the highest among the methods, which is 24.4% higher than the Bicubic method and only 3.1% lower than the HR test set. This shows that deep learning-based SRR methods lead to a substantial improvement in target detection performance, demonstrating their effectiveness and feasibility in both image reconstruction and target detection. Additionally, it suggests the potential for precise target detection in scenarios with lower computational costs, limited data collection, and more flexible applications, thus reducing the requirements for data acquisition.
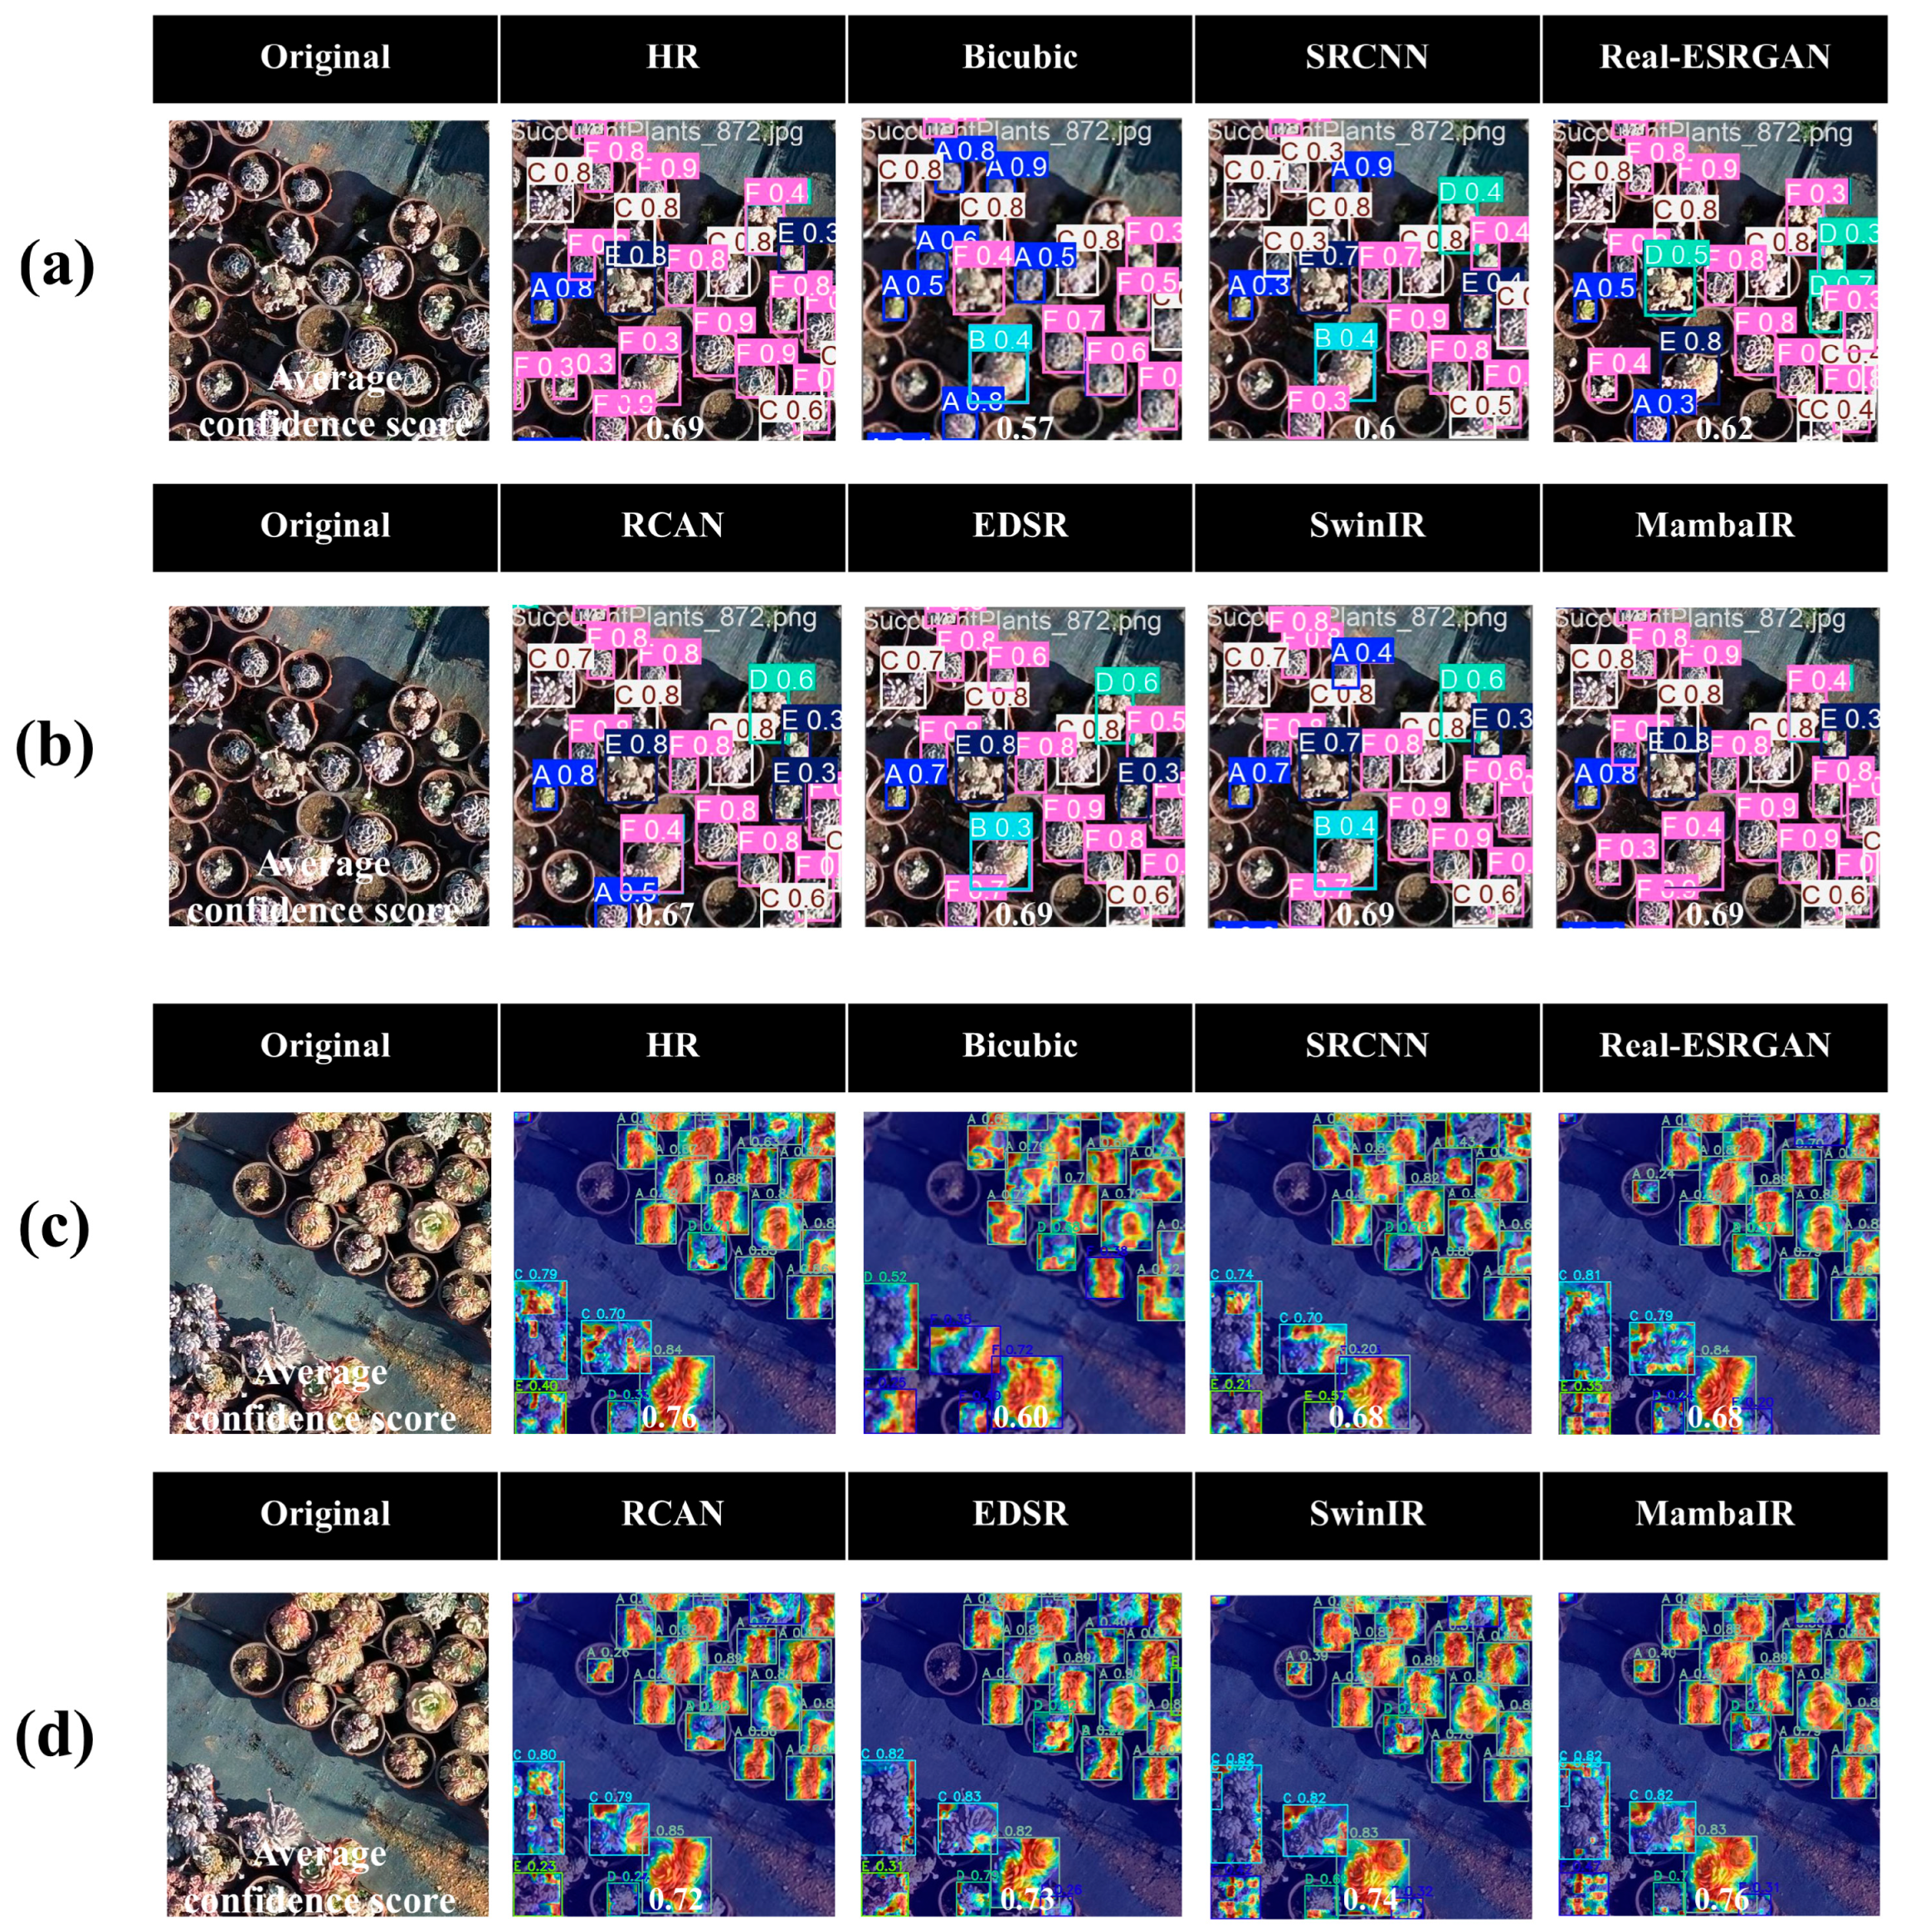
However, the detection performance of the Real-ESRGAN method is the lowest, with an mAP value of 72.4%. This may result from the generation of unnatural textures during the reconstruction, which compromised the image’s authenticity and detection accuracy. The mAP values of the other SRR methods are fairly similar and greatly exceed the Bicubic method, showing an average improvement of about 13.5%. As shown in
Figure 8a,b, the improvements in SRR methods are accompanied by higher confidence scores, indicating a correlation between the enhancements in SRR methods and the improvement in image quality.
To assess the performance of different SRR algorithms in succulent plant image detection and their impact on the Succulent-YOLO model, we applied the Grad-CAM technique [
52]. Grad-CAM visualizes the decision-making process of CNNs by generating class activation maps (heatmaps), which highlight areas of the image the model focuses on. These maps improve model interpretability and provide insights for further optimization.
Figure 8c,d present the heatmaps superimposed on the object detection results. The Grad-CAM results reveal that the model’s focus extends beyond the bounding boxes, covering the entire image. The Succulent-YOLO model obtained the highest score of 0.84 for the HR test set, with heatmaps highlighting the intricate leaf textures of succulent plants. In contrast, the Bicubic method, with a confidence score of 0.46, displayed highlighted areas deviating from the actual location of the plants, indicating significant differences between reconstruction algorithms.
SRR models based on deep learning exhibited superior performance compared to the Bicubic method, with confidence scores ranging from 0.46 to 0.84. However, their heatmaps varied, reflecting differences in detail restoration and overall structure. For instance, the heatmap for Real-ESRGAN displayed multiple red zones, indicating the presence of unrealistic textures and false detections, caused by the model’s attention being drawn to background elements such as soil and pots.
CNN-based algorithms also exhibited similar issues. Although their heatmaps emphasized succulent plant leaves, the convolution operation’s local receptive field caused the model to focus on irrelevant background areas, reducing detection accuracy. Interestingly, SRCNN, as an early SRR model, displayed a more stable performance. Its heatmap showed fewer red highlights, suggesting the model focused more on relevant regions rather than background noise. While SRCNN’s simpler structure had limitations in resolution improvement, it laid the foundation for subsequent SRR advancements.
The Transformer-based SwinIR algorithm excelled in the Succulent-YOLO model, surpassing CNNs in terms of image reconstruction. However, akin to SRCNN, SwinIR’s attention was partially diverted to the background, indicating its challenge in capturing global information.
Finally, MambaIR demonstrated significant advantages in succulent plant image reconstruction, achieving a confidence score equivalent to the HR test set, reaching 0.84. MambaIR effectively utilized a wider receptive field to preserve rich textures, optimizing image quality through lighting and color adjustments. Its heatmap showed fewer red highlights, indicating the model successfully removed irrelevant details and focused on key succulent features. This balance between global and local features provides valuable insights for future SRR algorithm improvements in succulent plant detection.
3.5. Ablation Experiment for Succulent-YOLO
Detection of succulent plants using drone-captured images is challenging due to environmental interference, the diversity of plant morphologies, individual variations, and image quality issues. To address these challenges, we enhanced the original YOLOv10 [
49] model to improve succulent plant detection.
Table 5 summarizes the incremental improvements made to YOLOv10. By cumulatively adding the CLIP, DGCST, and SDI modules, we calculated the corresponding metrics.
In the updated model, the text-image encoder CLIP was incorporated, resulting in the YOLOv10-S1 model. This enhancement boosts feature extraction and classification by leveraging CLIP’s image-text matching [
39]. NMS is used to identify key target areas, ensuring precise feature extraction. The dual embedding of image and text further strengthens the model’s semantic alignment, and integrating a CLIP-based classification branch through transfer learning improves detection performance, particularly for unknown objects and complex features. These modifications enhance YOLOv10’s ability to generate richer and more accurate feature representations, resulting in improved detection accuracy. The model achieved precision, recall, and mAP values of 79.0%, 76.9%, and 83.0%, respectively.
Additionally, a new prediction layer was added for small objects (150 × 150 pixels) to improve detection accuracy. This new layer incorporates the SDI module, which utilizes layered feature maps and attention mechanisms to preserve positional information and details of small objects. The module enables more accurate detection, especially in occlusion and multi-object scenarios. The neck network enhances small object feature expression by upsampling low-resolution maps to align with high-resolution maps, further improving detection accuracy. These improvements led to the creation of the YOLOv10-S1-2-3 model, also known as the Succulent-YOLO model, which achieved a mAP improvement of 87.8% compared to the original YOLOv10.
By progressively optimizing the YOLOv10 model, its performance has been significantly enhanced, overcoming the challenges in drone-based succulent plant detection, and laying the foundation for precise and efficient agricultural detection applications.
3.6. Effects of the Super-Resolution Scaling Parameter
Many studies have highlighted the importance of the magnification factor in determining the final reconstruction quality of SR images [
53,
54,
55]. This parameter dictates how much the low-resolution input image needs to be expanded and how many new pixels must be generated to restore image details. A larger magnification factor increases the reconstruction difficulty, often leading to blurring or distortion, as the model must generate more details from limited information. In contrast, a smaller magnification factor better preserves the original texture and details. To determine the ideal magnification factor for succulent plant detection, we adopted the following experimental procedure: first, the HR images were preprocessed and subsequently split into training and validation subsets in a 4:1 ratio. Then, we applied four-fold downsampling to the HR images to create the LR dataset. Finally, we applied deep learning-based SRR methods to the LR dataset. Based on previous findings, we selected the top-performing MambaIR model and evaluated the effect of different magnification factors (2–5) on SRR performance.
Initially, the
2_SR model is trained using the LR training data alongside its corresponding HR counterparts. Subsequently, this trained model is applied to the
1_LR test samples (150
150 pixels) to produce the
2_SR test images with a resolution of 300
300 pixels. Similarly, the same process is used to create the
3_SR (450
450),
4_SR (600
600), and
5_SR (750
750) test sets. Next, the Succulent-YOLO model is trained using the training and validation sets of the succulent plant HR dataset and applied to the SR images reconstructed at different magnification factors. Finally, mAP and confidence scores are used to evaluate the detection performance of these SRR-reconstructed images.
Table 6 shows the recognition accuracy of the Succulent-YOLO model for succulent plant images at different magnification factors.
Figure 9 shows the detection results of succulent plant images at different magnification factors. As the magnification factor grows, the detection outcomes more accurately reflect the ground truth labels, leading to higher recognition accuracy. However, higher magnification factors also increase computational complexity and processing time, impacting the model’s efficiency. For instance, the computation times for magnification factors of
4 are 24% longer than for
1. The results indicate that the recommended magnification of SRR for succulent target detection is 4. Furthermore, this finding generally aligns with the results of other target detection studies using SRR, supporting its validity.
4. Discussion
4.1. Influence of Different Object Detection Architectures on SRR
To investigate how various object detection approaches affect succulent plant identification under SRR settings, we trained a total of 12 detection models on a high-resolution succulent plant dataset captured via UAVs. The evaluated models include Faster R-CNN and multiple YOLO-based variants.
Table 7 provides these models’ detection performance for three test sets: HR, Bicubic, and MambaIR.
Our results show that Succulent-YOLO performs the best across all test sets. Succulent-YOLO achieves an mAP 5.7% higher than the second-best model on the HR test set, showcasing its superior performance with high-resolution images. In the Bicubic test set, although all models experienced a decline in performance due to reduced image resolution, Succulent-YOLO still attained the top mAP score, highlighting its strong capability for handling low-resolution images. Equally, in the MambaIR test set, Succulent-YOLO’s mAP is 6.5% higher than YOLOv7, showcasing its superiority in super-resolution reconstruction.
The results indicate that for images reconstructed by MambaIR, two-stage detectors like Faster R-CNN cannot surpass certain single-stage models such as the YOLO series. Despite its larger model size, Faster R-CNN is less efficient than Succulent-YOLO in all metrics, primarily due to architectural differences. Being a two-stage detection framework, Faster R-CNN first generates region proposals, which are subsequently classified and refined, resulting in a relatively complex and computationally intensive pipeline [
56]. This structure limits its applicability in real-time scenarios. Conversely, single-stage detectors eliminate the proposal generation phase by directly performing dense predictions across the entire image, thereby significantly enhancing inference speed and computational efficiency [
48].
Within the Bicubic test set, Faster R-CNN exhibited the lowest mAP score, highlighting its limitations when processing images with reduced resolution. Several YOLO-based models, such as YOLOX-s and YOLOv7, similarly demonstrated decreased detection performance. YOLOX improved upon the YOLOv3 and YOLOv4 backbone but replaced the anchor-based design with an anchor-free detection paradigm, which can blur targets and cause localization errors [
57]. Therefore, it can lead to the emergence of problems such as missed detection, false detection and degradation of localization accuracy in UAV image detection of succulents. Similarly, YOLOv7’s complex deep feature aggregation strategy (E-ELAN structure) enhances local information extraction but performs poorly on Bicubic images, as it only interpolates neighborhood pixels without restoring high-frequency details [
58]. In contrast, Succulent-YOLO combines high accuracy and robustness with a compact model size and minimal parameters, making it ideal for high-performance detection tasks, particularly in resource-constrained environments. Its lightweight design enables efficient operation, expanding its potential for real-time crop monitoring when deployed on platforms like UAVs or smart agricultural machinery. Currently, applications of real-time monitoring of succulent plants include intelligent succulent plant management systems based on wireless networks [
59], mobile monitoring systems with cameras [
60], and so on. Real-time monitoring technology provides intelligent and refined management tools for succulent plant cultivation, promoting agricultural modernization and sustainable development.
Figure 10 illustrates the interpretive analysis of the detection results of the various networks on the high-resolution images using Grad-CAM. Succulent-YOLO shows a clear advantage, obtaining the highest confidence score of 0.84 on the test images and showing the widest range of highlighted areas in the heatmap.
4.2. Robustness Against Degraded Input Data
Gaussian blur is a smoothing technique that applies a Gaussian kernel to image pixels, where the kernel size is crucial for the super-resolution effect. This method is typically used to reduce image details and create a softer image. Gaussian noise refers to the introduction of random noise that follows a Gaussian distribution, used to test the model’s stability in noisy environments. Gaussian blur is mainly used to generate realistic low-resolution data, while Gaussian noise enhances the model’s noise resistance and robustness. The integration of both factors strengthens the model’s ability to process low-quality data, leading to better performance in various situations.
To evaluate the robustness of the proposed model under realistic imaging conditions, we introduced varying levels of Gaussian blur and Gaussian noise to the input data and analyzed the impact on model performance. These perturbations simulate common challenges in UAV-based image acquisition, such as vibration, motion blur, sensor noise, and atmospheric interference.
As shown in
Figure 11a, we applied Gaussian blur with increasing standard deviation (σ = 0 to 2) across 12 different detection models. CNN-based architectures exhibited significant performance degradation under blurring, with their mAP scores declining sharply as blur intensity increased. In contrast, models employing the GhostNet-P6 backbone demonstrated greater robustness, maintaining relatively stable detection accuracy. Notably, our proposed Succulent-YOLO model achieved a minimal performance drop of only 4.32%, indicating its strong tolerance to visual degradation caused by blur.
Figure 11b illustrates the impact of additive Gaussian noise (standard deviation ranging from 0 to 20) on model performance. The results show that Succulent-YOLO maintains high resilience, with only a 7.73% reduction in mAP under the most severe noise level. This highlights the model’s ability to generalize well in noisy environments commonly encountered in precision agriculture UAV deployments.
These findings confirm that the architectural choices—such as the integration of CLIP embeddings and super-resolved inputs via MambaIR—contribute not only to improved baseline accuracy but also to enhanced robustness under adverse visual conditions. The model’s relatively compact parameter count further ensures that this robustness is achieved without incurring excessive computational overhead, making it suitable for real-world UAV platforms.
4.3. Proposals for Future Work
While the Succulent-YOLO approach demonstrates significant advantages in succulent farmland monitoring through the integration of CLIP-based YOLOv10 and Mamba computer vision methods, several limitations must be acknowledged.
First, our dataset, although sufficiently diverse for this initial validation, remains limited in size and variability. The images were collected under relatively controlled environmental conditions, which may limit the model’s performance when generalized to broader field scenarios characterized by variable illumination, seasonal changes, shadows, and weather conditions. Future studies could enrich the dataset with more extensive sampling across diverse environments and conditions to enhance robustness and generalizability. Second, the computational complexity of combining super-resolution reconstruction (SRR) and deep learning-based detection models may pose challenges for real-time processing on typical UAV onboard hardware or mobile devices. Future work should explore model optimization strategies, such as quantization, pruning, lightweight architectures, and edge-computing deployment, enabling practical, real-time implementation on resource-constrained platforms common in precision agriculture. Third, although the model shows strong performance specifically for succulent species, its adaptability and scalability to other plant species or agricultural crops were not explicitly evaluated. Further research is necessary to assess the transferability of the Succulent-YOLO pipeline to broader agricultural contexts, ensuring applicability and wider adoption across diverse agricultural scenarios. Finally, integrating the Succulent-YOLO system with real-time decision-support tools or agricultural management platforms represents a promising avenue for future development. Such integration could significantly enhance farmer decision-making capabilities, facilitate proactive crop monitoring, and streamline precision agriculture workflows.
Addressing these limitations and exploring these potential directions in future research will further advance the practicality, efficiency, and robustness of Succulent-YOLO, contributing to sustainable agricultural practices and technological advancements in UAV-assisted farmland monitoring.
5. Conclusions
This study presents a practical and integrated strategy for large-scale classification of succulent plant imagery by combining UAV-based data acquisition with advanced deep learning techniques. We introduced a super-resolution reconstruction (SRR) module, MambaIR, which enhances the clarity of low-resolution UAV images. Compared to several baseline SRR models, MambaIR achieved competitive performance, with a PSNR of 23.83 dB and SSIM of 79.60%, enabling better downstream detection results.
Additionally, we developed a customized detection architecture, Succulent-YOLO, based on YOLOv10 and tailored for the fine-grained recognition of succulent species. The model achieved an mAP of 87.8% on high-resolution inputs and maintained strong performance (85.1%) even when applied to images reconstructed via MambaIR, indicating the robustness and synergy of the integrated pipeline.
Grad-CAM visualizations further demonstrated the model’s ability to focus on key morphological features of succulents, supporting its interpretability and potential for precision agriculture applications. Moreover, an appropriate SR scaling factor was determined to balance image quality with computational efficiency, which is essential for real-world UAV deployment scenarios.
Despite these promising results, several limitations remain. The dataset was limited in species diversity and environmental variation, which may affect generalization to other crop types or conditions. Additionlly, the current model’s computational demands may restrict deployment on lightweight UAV platforms without further optimization. Future work will focus on extending the dataset across more plant species and phenological stages, evaluating cross-domain transferability, and optimizing the model for real-time, on-board inference. These efforts aim to enhance the system’s scalability and practical value in supporting data-driven precision agriculture.


 ,
, 


