Article

Rubber Plantation Expansion Leads to Increase in Soil Erosion in the Middle Lancang-Mekong River Basin During the Period 2003–2022

1
School of Geographical Sciences, Fujian Normal University, Fuzhou 350117, China
2
Fujian Provincial Engineering Research Center for Monitoring and Accessing Terrestrial Disasters, Fujian Normal University, Fuzhou 350117, China
3
Hawkesbury Institute for the Environment, Western Sydney University, Locked Bag 1797, Penrith, NSW 2751, Australia
4
Fujian Soil and Water Conservation Experimental Station, Fuzhou 350003, China
*
Author to whom correspondence should be addressed.
Remote Sens. 2025, 17(13), 2220; https://doi.org/10.3390/rs17132220 (registering DOI)
Submission received: 15 May 2025 / Revised: 19 June 2025 / Accepted: 26 June 2025 / Published: 28 June 2025
(This article belongs to the Special Issue Advances in Remote Sensing for Soil Property Mapping)

Abstract

The booming nature rubber industry has contributed to the extensive expansion of rubber plantations in the Lancang-Mekong River Basin over recent decades. To date, limited research has focused on the assessment of soil erosion caused by this expansion, resulting in a knowledge gap in the systematic and quantitative understanding of its ecological and hydrological impacts. This study evaluates soil erosion within rubber plantations and changes associated with their expansion by modifying the Revised Universal Soil Loss Equation (RUSLE) model in the middle section of the Lancang-Mekong River Basin from 2003 to 2022. The results show that: (1) rubber plantations have expanded rapidly, reaching a total area of 70.391 × 10⁴ ha; (2) over the 20-year period, soil erosion trends within rubber plantations show both slight aggravation (affecting 45.377% of the area) and slight mitigation (affecting 35.859% of the area); (3) soil erosion in rubber plantations shows a pattern of decreasing, then increasing, and then decreasing again with stand age, with the lowest erosion (0.693 t·ha−1·yr−1) observed in plantations aged 10–15 years and the highest (1.017 t·ha−1·yr−1) in those aged 15–20 years; (4) rubber plantation expansion led to a fivefold increase in soil erosion with an average soil loss of 0.148 t·ha−1·yr−1 in the non-expansion areas and 0.902 t·ha−1·yr−1 in expansion areas; and (5) slope had the most significant impact on soil erosion. Interactions between slope and other factors —especially slope and soil type (Q > 0.777)—consistently demonstrated strong explanatory power. This research provides valuable insights for the assessment and management of soil erosion in rubber plantations.

1. Introduction

Soil erosion is a major form of land degradation [1]. Soil erosion is a complex process influenced by multiple factors, including changes in land cover and climatic conditions such as heavy rainfall and drought, both of which can pose significant erosion risks [2]. The impacts of soil erosion are equally multifaceted. It not only reduces soil fertility and leads to thinner soil layers, but also severely threatens the stability of agriculture, forestry, and ecosystems [3]. Consequently, controlling and preventing soil erosion plays a crucial role in sustainably conserving soil and managing land [4]. Quantifying soil erosion and risk analysis are essential for prevention, soil protection, and informed policy development [5].
Rubber plantations hold an irreplaceable strategic position globally, as they offer natural rubber—a key raw material for automobile and airplane tires [6]. Over the past thirty years, driven by rising demand from the rubber industry, rubber plantations have expanded significantly, particularly in Southeast Asia and China [7]. Although rubber cultivation has brought significant economic benefits, its rapid expansion has exerted tremendous pressure on the local ecological environment, particularly by exacerbating soil erosion [8]. The establishment of rubber plantations often involves large-scale deforestation of tropical forests. Although practices of intercropping can mitigate soil erosion [9], compared to tropical forests, rubber plantations have a relatively simplified ecosystem structure, making them more susceptible to soil and water erosion [10]. Terracing can help reduce soil erosion in rubber plantations to some extent [11]; however, frequent management and tapping activities can lead to unstable soil structures. Exposed soils are more susceptible to splash erosion than soils under natural vegetation cover [12]. Moreover, the use of fertilizers, pesticides, and herbicides in rubber plantation management can pollute the soil, damage soil aggregates, increase compaction, and reduce the infiltration capacity of rainfall [13]. In Southeast Asia and China, the expansion of rubber plantations has continued for many years, making it crucial to quantitatively assess the long-term impacts of this expansion on regional soil erosion in order to support the sustainable development of the rubber industry. However, existing research has mostly focused on small-scale areas, and large-scale, long-term studies on soil erosion in rubber plantation remain limited.
Traditionally, soil erosion can be estimated through field surveys using experimental plots [14]. Although this approach can achieve accurate assessments, it requires huge financial and labor costs for assessing large regions. Semi-empirical mechanistic models, such as the Universal Soil Loss Equation (USLE) [15] and the Revised Universal Soil Loss Equation (RUSLE) [16], have been widely applied for regional-scale soil erosion assessments due to their computational simplicity, efficiency, and suitability for large-area applications. However, the accuracy of these models heavily depends on the appropriateness of empirical parameters—particularly the cover and management (C) and support practice (P) factors—for the region under study. Due to the spatial heterogeneity of geographic conditions, many studies have lacked reliable parameterization at the grid level across regions, resulting in considerable uncertainties in soil erosion estimates [17]. With the advancement of remote sensing technology, access to input data for soil erosion models has improved significantly. Landsat time-series data, in particular, offer a valuable source of spatiotemporally continuous images due to their long-term archive (since 1987), free and open access, and relatively high spatial resolution. These features make these data especially useful for improving the accuracy of C and P factor estimations in soil erosion models [18].
Numerous studies have demonstrated that the establishment of eucalyptus [19,20,21], oil palm [22,23], and rubber plantations [24,25] has exacerbated soil erosion, as evidenced by applications of the USLE and RUSLE models [26,27]. However, regional quantification of soil loss in rubber plantations remains limited, largely due to difficulties in accurately determining the C and P factors specific to these landscapes [28]. Additionally, the long-term, large-scale impacts of rubber plantation expansion on soil erosion are still not well understood. Most existing studies focus only on the spatial distribution of soil erosion or compare erosion rates before and after land-use conversion to rubber plantations [29,30,31]. without fully accounting for annual variations in rainfall, which can introduce substantial uncertainty. In this study, we aim to address the existing research gap by quantifying the impact of rubber plantation expansion on soil erosion in the middle section of the Lancang-Mekong River Basin by enhancing the RUSLE model through the development of appropriate C and P factor estimates tailored to rubber plantations. The specific objectives are: (1) to develop an appropriate RUSLE model for assessing soil erosion in rubber plantations; (2) to explore the soil erosion in rubber plantations, its spatiotemporal pattern, and the main driving factors; and (3) to quantify the soil erosion caused by the expansion of rubber plantations over the past 20 years through scenario-based modeling.

2. Study Area and Data Source
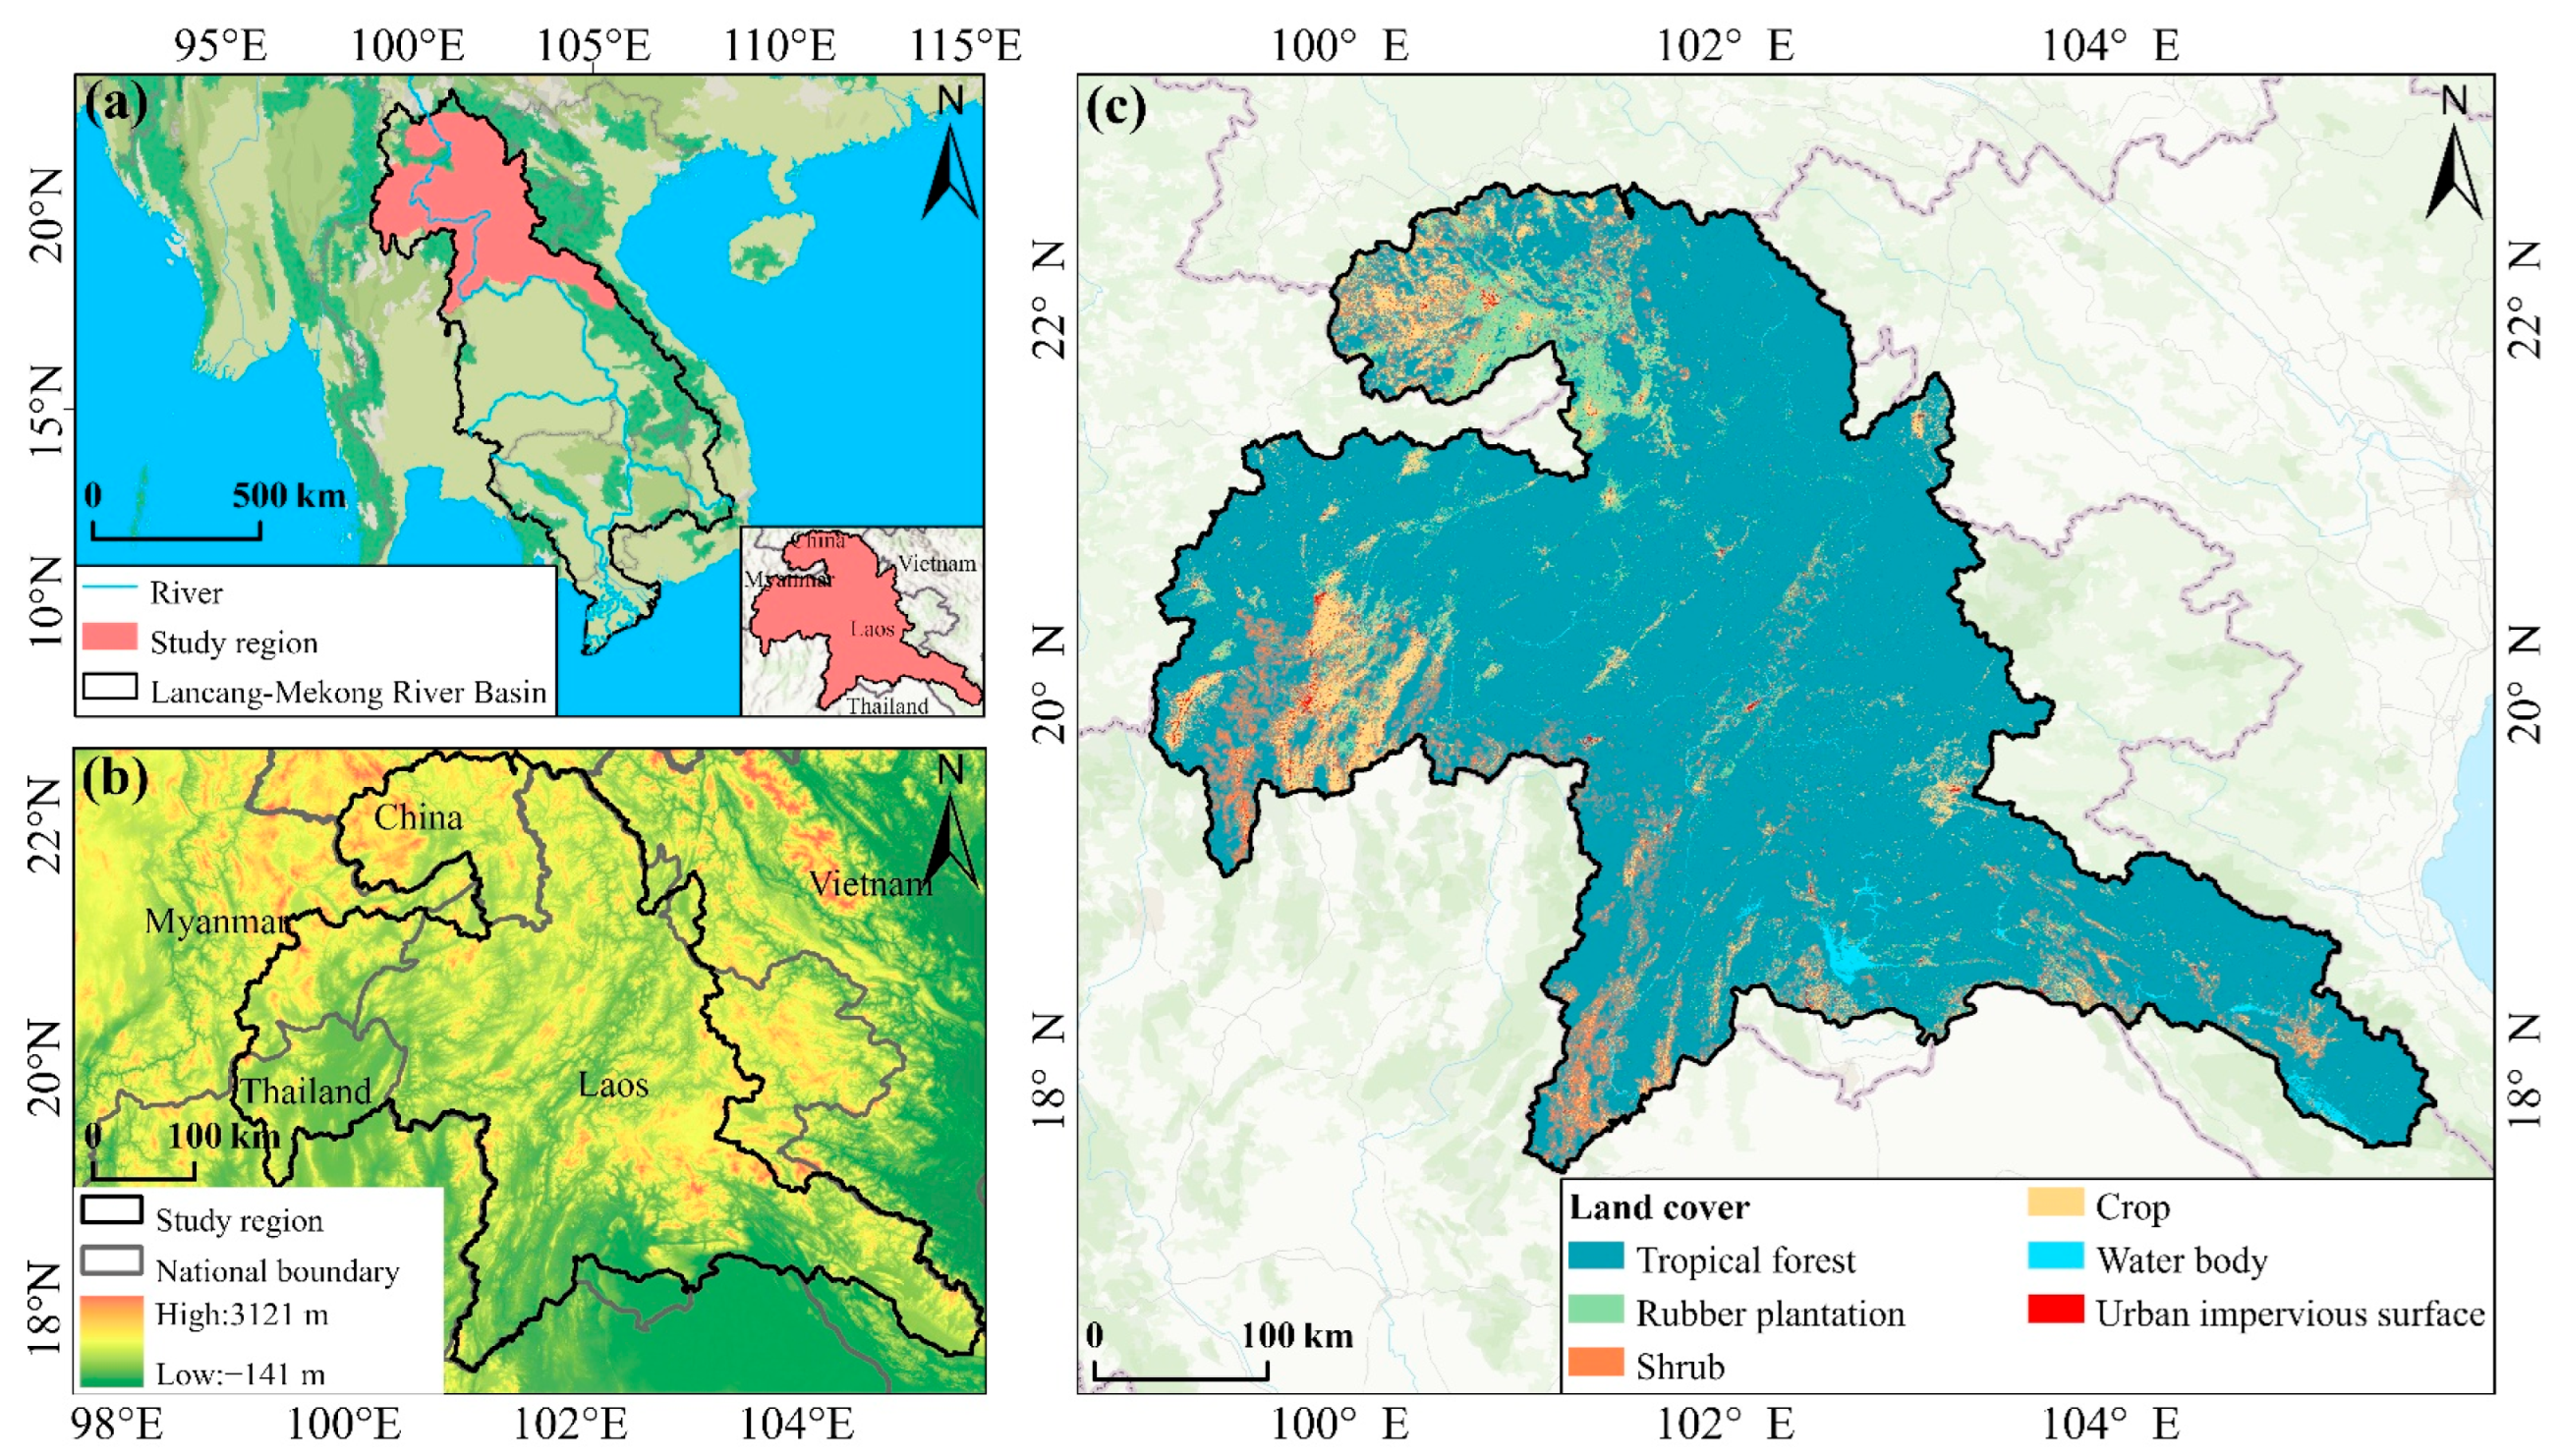
2.1. Study Area

The study region is located in the central section of the Lancang-Mekong River Basin, covering parts of Xishuangbanna Dai Autonomous Prefecture in Yunnan Province, China, as well as northwest Laos, eastern Myanmar, northern Thailand, and areas along the borders of Vietnam, located between 17.4°N–22.6°N and 99.0°E–105.7°E (Figure 1). The soil texture in the study area is predominantly composed of sand and silt fractions. The region features a complex and diverse topography, mainly consisting of high mountains, hills, and river valleys, with elevations generally ranging from 500 to 3000 m. The area experiences a typical tropical monsoon climate, characterized by high temperatures and abundant rainfall. The annual average temperature is approximately 20–25 °C, with significant seasonal variation. The average annual precipitation ranges from 1500 to 2500 mm, with about 80% falling during the rainy season from May to October [32]. The humid climate provides favorable conditions for both biodiversity in the ecosystem and agricultural activities. Vegetation types exhibit significant vertical distribution patterns in response to the topography, spanning from tropical monsoon forest to tropical shrub and cultivated crops. The study area hosts various artificial economic forests, with rubber plantations being the largest, providing an important source of income for the local communities [33].

2.2. Data Source

2.2.1. Input Parameters for the RUSLE Model

The Climate Hazards Group InfraRed Precipitation with Station (CHIRPS) Version 2 daily precipitation dataset is used to calculate the rainfall-runoff factor [34]. This dataset is produced by combining high-resolution precipitation infrared satellite imagery and in-situ observations. It provides precipitation data from 1981 to present, covering the area between 50°S to 50°N, with a spatial resolution of 0.05°. The Harmonized World Soil Database version 2.0 (HWSD v2.0) is used to calculate the soil erodibility [35], offering detailed descriptions of soil morphological, chemical, and physical characteristics, at a spatial resolution of 1 km. Precipitation and soil datasets are reprojected to the WGS_1984_UTM_Zone_47N coordinate system and resampled to a spatial resolution of 30 m using the nearest-neighbor interpolation method. The Shuttle Radar Topography Mission (SRTM) Digital Elevation Model (DEM), produced by the National Aeronautics and Space Administration (NASA), is obtained from (https://earthexplorer.usgs.gov/) (accessed on 1 February 2025) at a spatial resolution of 30 m and is used to calculate the slope length and steepness factors. The Normalized Difference Vegetation Index (NDVI) is derived from Landsat-5 TM and Landsat-8 OLI Level 2 Surface Reflectance (SR) products, using necessary preprocessing steps such as cloud filtering, cloud removal, annual median synthesis, and clipping.

2.2.2. Data for Driving Factor Analysis

Slope and elevation are calculated using the SRTM DEM data. Annual precipitation is obtained from the CHIRPS v2 daily precipitation dataset. The annual average temperature is derived from the MOD11A2.061 8-day mean surface temperature product, with a spatial resolution of 1 km. Soil type data are sourced from the Harmonized World Soil Database version (HWSD v2.0). Gross Domestic Product (GDP) data are obtained from the electricity consumption revised GDP dataset [36], which is calibrated using machine learning algorithms based on nighttime light data, with a spatial resolution of 1 km. As the dataset does not include data for 2022, data from 2019 are used as a substitute. Population distribution data are sourced from the WorldPop global population dataset [37], covering the years 2000–2020, with a spatial resolution of 100 m. Data from 2020 are used as a proxy for 2022. All datasets are reprojected to the WGS_1984_UTM_Zone_47N coordinate system and resampled to a spatial resolution of 30 m using the nearest-neighbor interpolation method.

3. Methods

3.1. Rubber Plantation Mapping Framework

Six land cover types, including tropical forest, rubber plantation, shrub, crop, water body, and urban impervious surface, are classified using an algorithm framework based on the time series Landsat imagery on the Google Earth Engine (GEE) platform developed by Xu et al. (2025, in submission) [38]. Specifically, preprocessing steps such as cloud filtering, cloud removal, and feature calculation are first conducted for the Landsat-5 TM and Landsat-8 OLI images. Then, an automated sample transfer algorithm is employed to obtain historical samples based on all the samples from 2022. Finally, a random forest classifier is applied to extract the spatiotemporal distribution of 2003, 2008, 2013, 2018, and 2022 rubber plantations using textures, dynamic phenology, and change detection variables. Land cover transition matrices are then applied to quantify the main source types for rubber plantation expansion and its converted source types.

3.2. Soil Erosion Calculation by Revising the Universal Soil Loss Equation

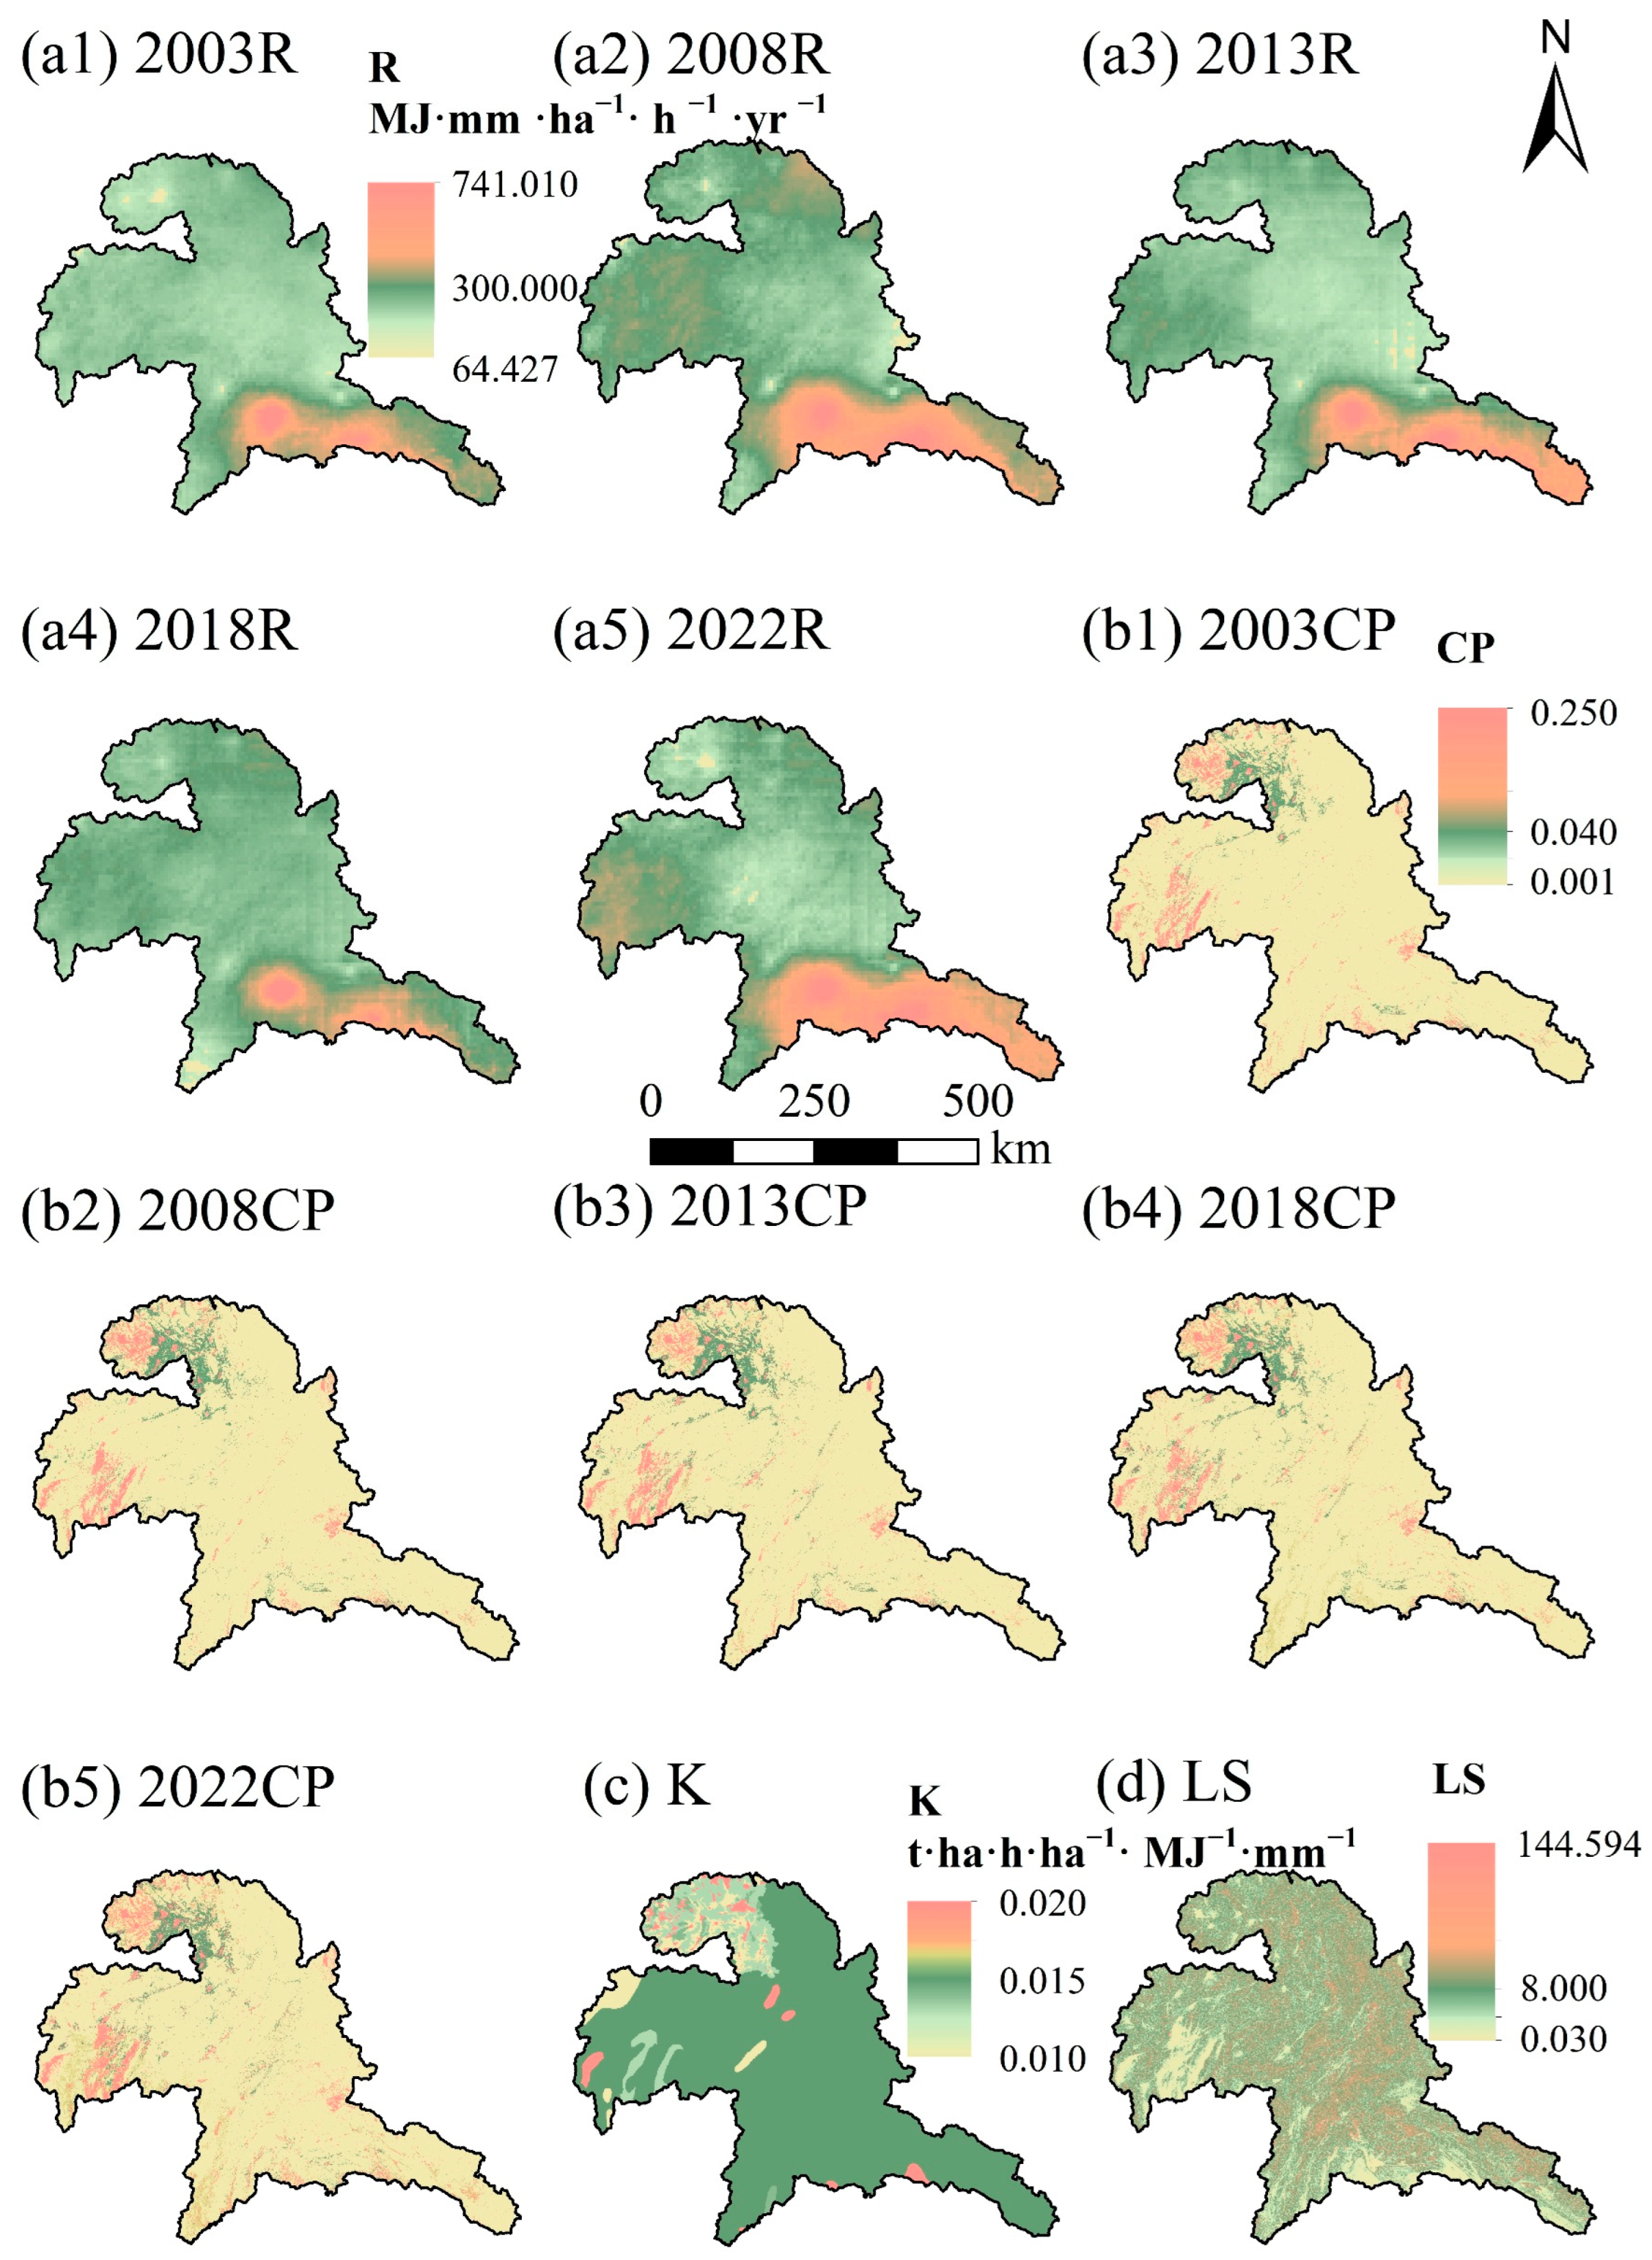
3.2.1. Modifying the Universal Soil Loss Equation

The study quantifies soil erosion using the Revised Universal Soil Loss Equation (RUSLE) [16]. RUSLE is an improved version of the Universal Soil Loss Equation (USLE) and is one of the most widely used soil erosion assessment models. The calculation of soil erosion is expressed as Equation (1):
SE = R × K × LS × CP
where SE (t·ha−1·yr−1) represents the average annual soil erosion per unit area, R represents the rainfall-runoff factor (MJ·mm·ha−1·h−1·yr−1), K represents the soil erodibility factor (t·ha·h·ha−1·MJ−1·mm−1), LS represents the dimensionless topographic factor that combines the slope length factor (L) and slope steepness (S), and CP represents the dimensionless product of the cover management factor and support practice factor.
(1)
Rainfall-runoff (R) factor
The R factor indicates the impact of rainfall intensity and runoff on soil erosion. It is related to regional climatic conditions and is usually calculated based on precipitation and rainfall intensity. The R factor is calculated using an empirical formula proposed by Zhou et al. (1995) [39], which has been successfully applied in the Lancang-Mekong River Basin [40]. The calculation of the rainfall-runoff (R) factor is expressed as Equation (2):
R = i = 1 12 ( 1.5527 + 0.1792 P i )
where Pi represents the rainfall (mm) of the ith month during the year. If the monthly component of R is less than zero, we assign it a value of 0.
(2)
Soil erodibility (K) factor
The K factor reflects the soil’s erodibility. Its calculation follows the formula proposed by Wu et al. (2022) [41], who applied it in their study of the middle and lower reaches of the Lancang River. The calculation of soil erodibility (K) factor is expressed as Equations (3) and (4):
K = 0.01383 + 0.51575 K epic × 0.1317
K epic = 0.2 + 0.3 exp 0.0256 m s 1 m silt 100 × m silt m c + m silt 0.3 × 1 0.25 orgC orgC + exp 3.72 2.95 orgC × 1 0.7 1 m S 100 1 m S 100 + exp 5.51 + 22.9 1 m S   100
where Kepic is the uncorrected soil erodibility factor (K); mc is the clay content (%); msilt is the silt content (%); ms is the sand content (%); and orgC is the total organic carbon content in the soil (%).
(3)
Slope length and steepness (LS) factor
LS includes the effects of slope length and steepness on soil erosion. Generally, the longer and steeper the slope, the greater the potential for soil erosion. The calculation of LS refers to the method proposed by Zhang et al. (2013) [42] and Li et al. (2014) [43] for calculating topographic factors. The calculation of the slope length and steepness (LS) factor is expressed as Equations (5)–(9):
LS = L × S
L = λ / 22.13 m
m = β / 1 + β
β = ( sin θ ) / [ 3 × ( sin θ ) 0.8 + 0.56 ]
S = 10.8 sin θ + 0.03 θ < 9 ° 16.8 sin θ 0.5 9 ° θ < 18 ° 21.9 sin θ 0.96 θ 18 °
where λ represents the length of the slope, m represents a variable length-slope exponent, β represents the factor that varies with slope gradient, and θ represents the slope angle.
(4)
Cover management (C) factor and support practice (P) factor
The vegetation cover factor (C) is a quantitative indicator of the ability of surface vegetation (such as forest, crop, etc.) to prevent soil erosion. The support practice factor (P) is defined as the reduction in soil erosion due to the implementation of soil protection policies or erosion control measures (such as terracing, water barriers, etc.). Considering the applicability of the C and P factors in the Lancang-Mekong River Basin, we use the recommended C and P values for all the land cover types except rubber plantations [40] (Table 1).
(5)
Cover management and support practice (CP) factor for rubber plantations
In order to accurately present the management and practice characteristics of rubber plantations, it is necessary to use C and P factors, which are applicable to the rubber plantation ecosystem, for an accurate estimation of soil erosion. Liu et al. (2016) [28] proposed a CP factor based on vegetation cover (FVC) that considered multiple factors, including herbicide treatment, surface and plant coverage, and root density based on field experiments in Xishuangbanna, China. In this study, we introduce this CP factor. The calculation of the cover management and support practice (CP) factor for rubber plantations is expressed as Equations (10)–(12):
CP = 0.04 e 0.028 FVC
FVC = NDVI NDVI soil NDVI veg NDVI soil
NDVI = ρ Nir ρ Red ρ Nir + ρ Red
where FVC represents vegetation cover (%), NDVI represents the Normalized Difference Vegetation Index, NDVIsoil represents pure bare soil pixels, NDVIveg represents pure vegetation pixels, and ρNir and ρRed represent surface reflectance in the near-infrared and red band, respectively. NDVIsoil and NDVIveg are the NDVI values at the 5% and 95% cumulative frequency, respectively [44,45].

3.2.2. Calculation of Total Soil Erosion

We calculate the total annual soil erosion of rubber plantations in the study area based on the regional mean SE. The formulas are given by Equation (13):
SE t o t a l = SE m e a n × A
where SEtotal (t) represents the annual soil erosion of rubber plantations, SEmean (t·ha−1·yr−1) represents the average annual soil erosion per unit area in rubber plantations, and A (ha) represents the rubber plantation area, respectively.

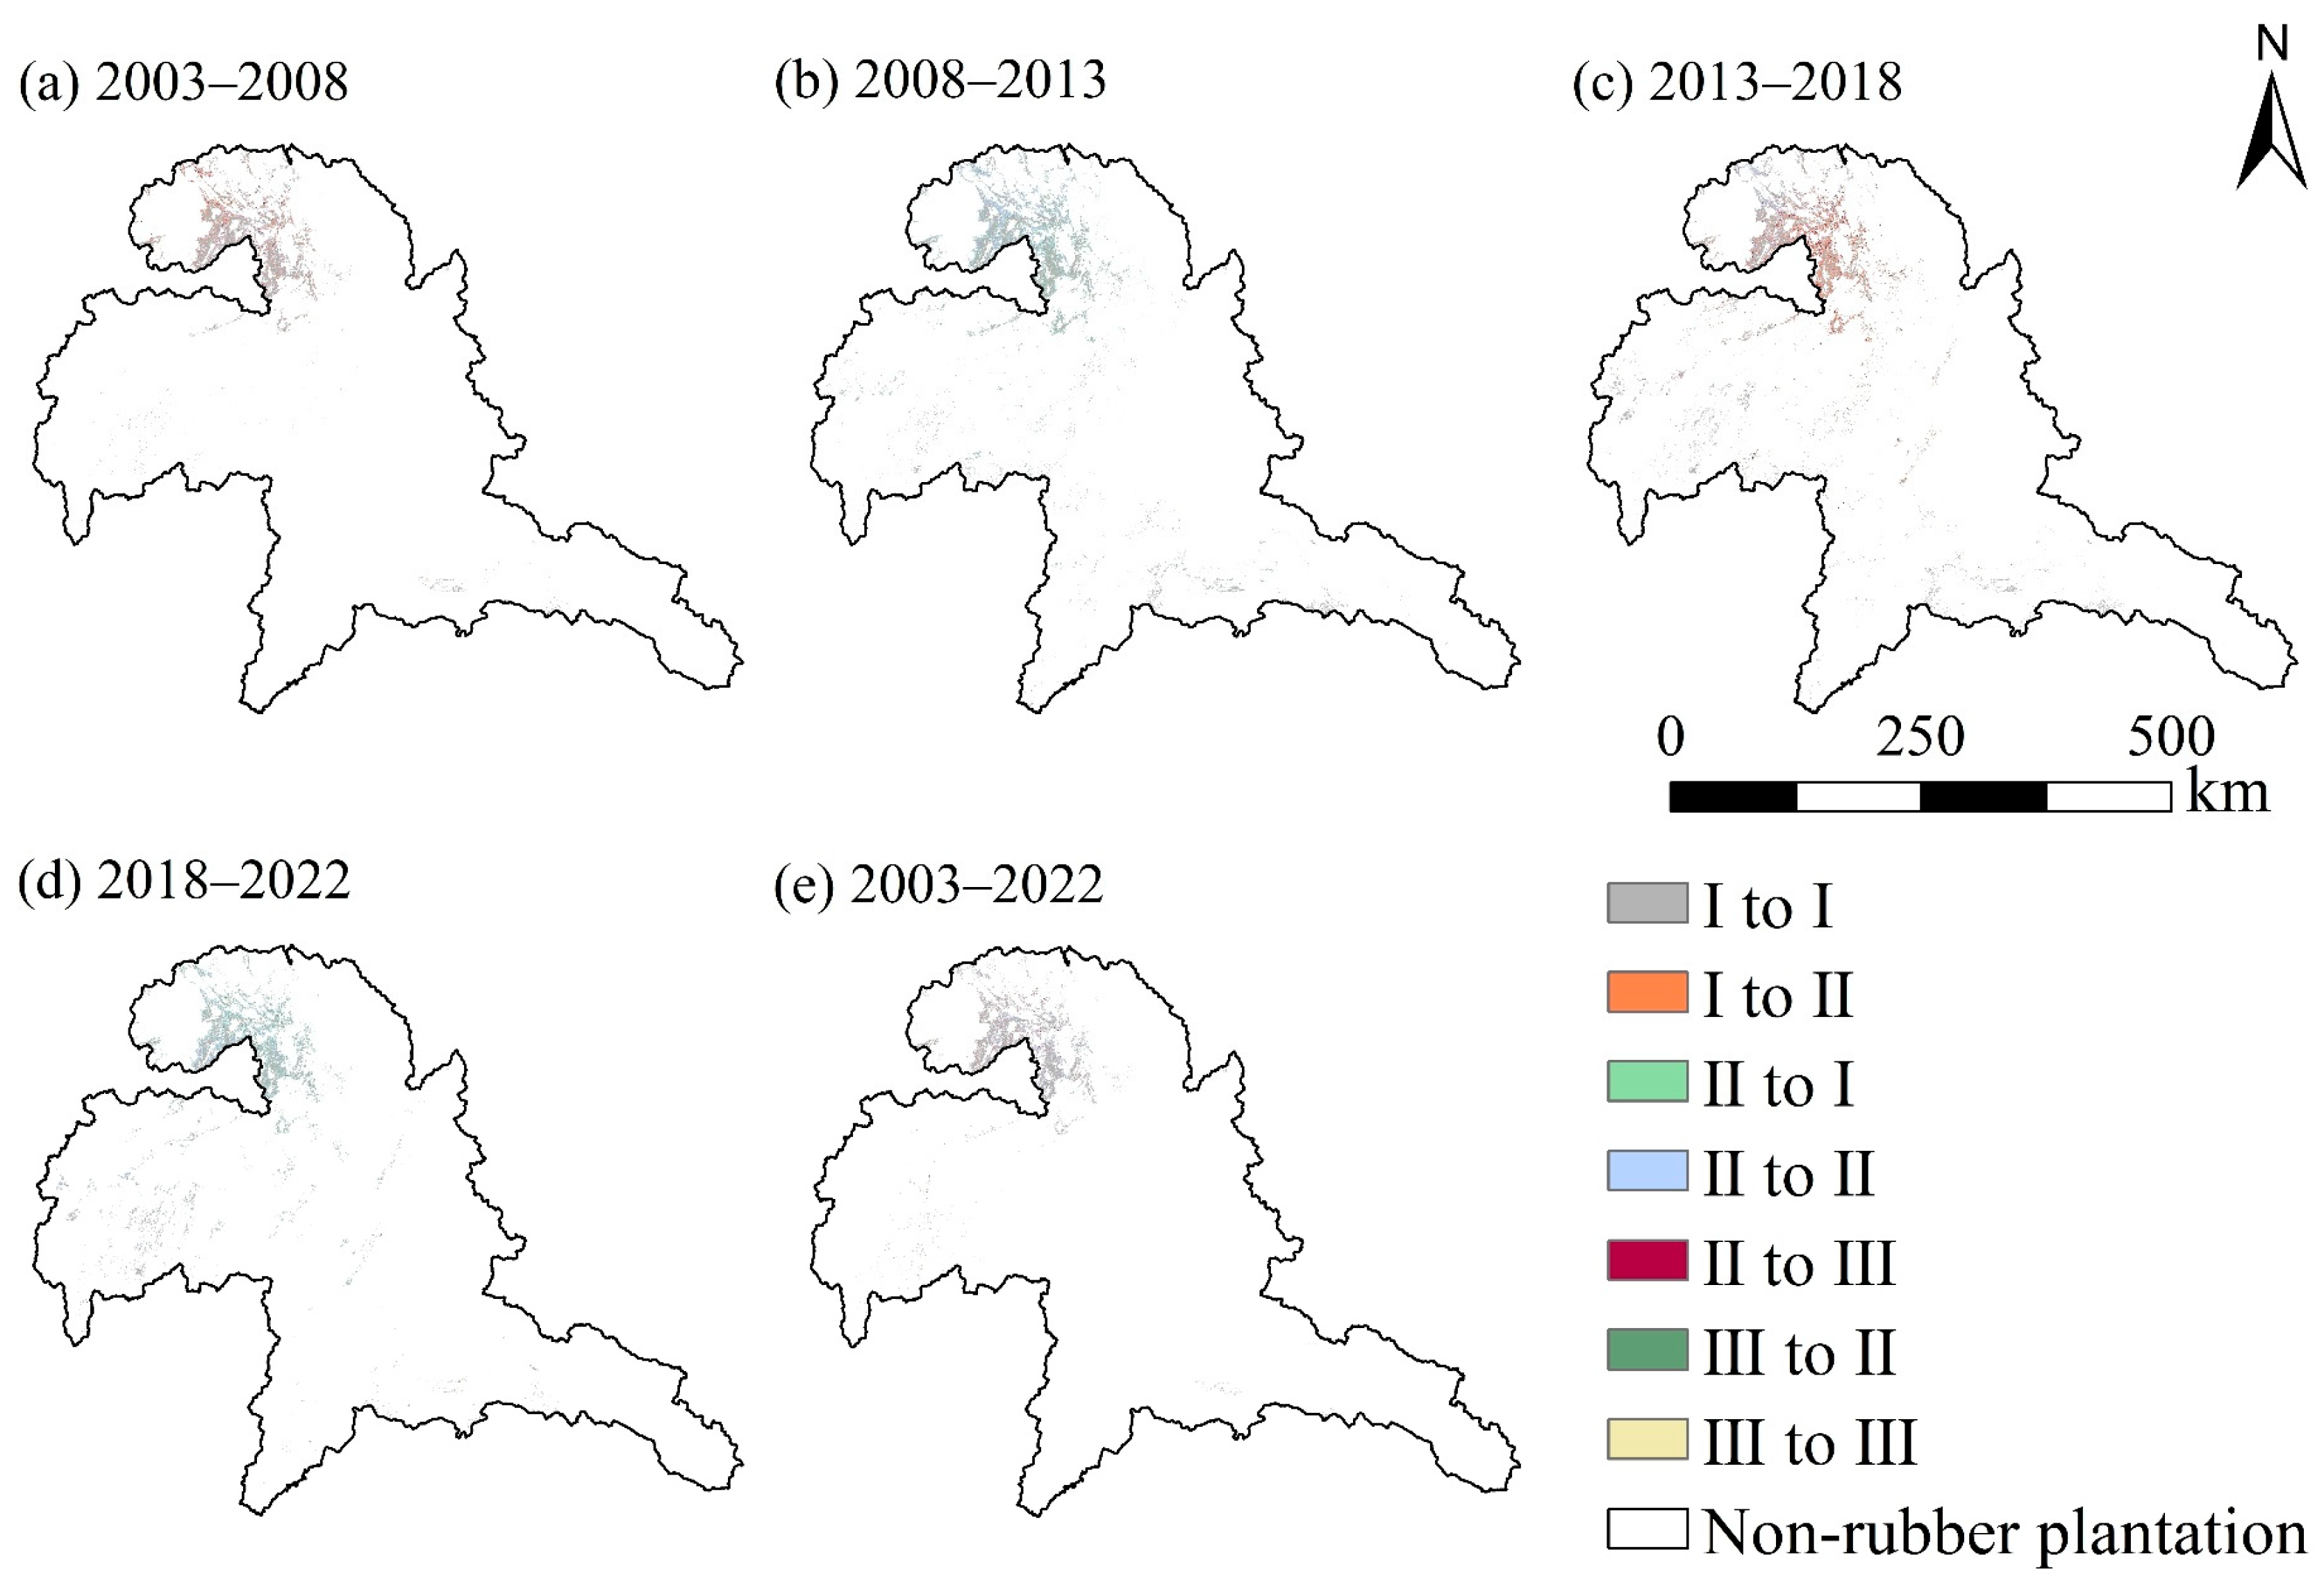
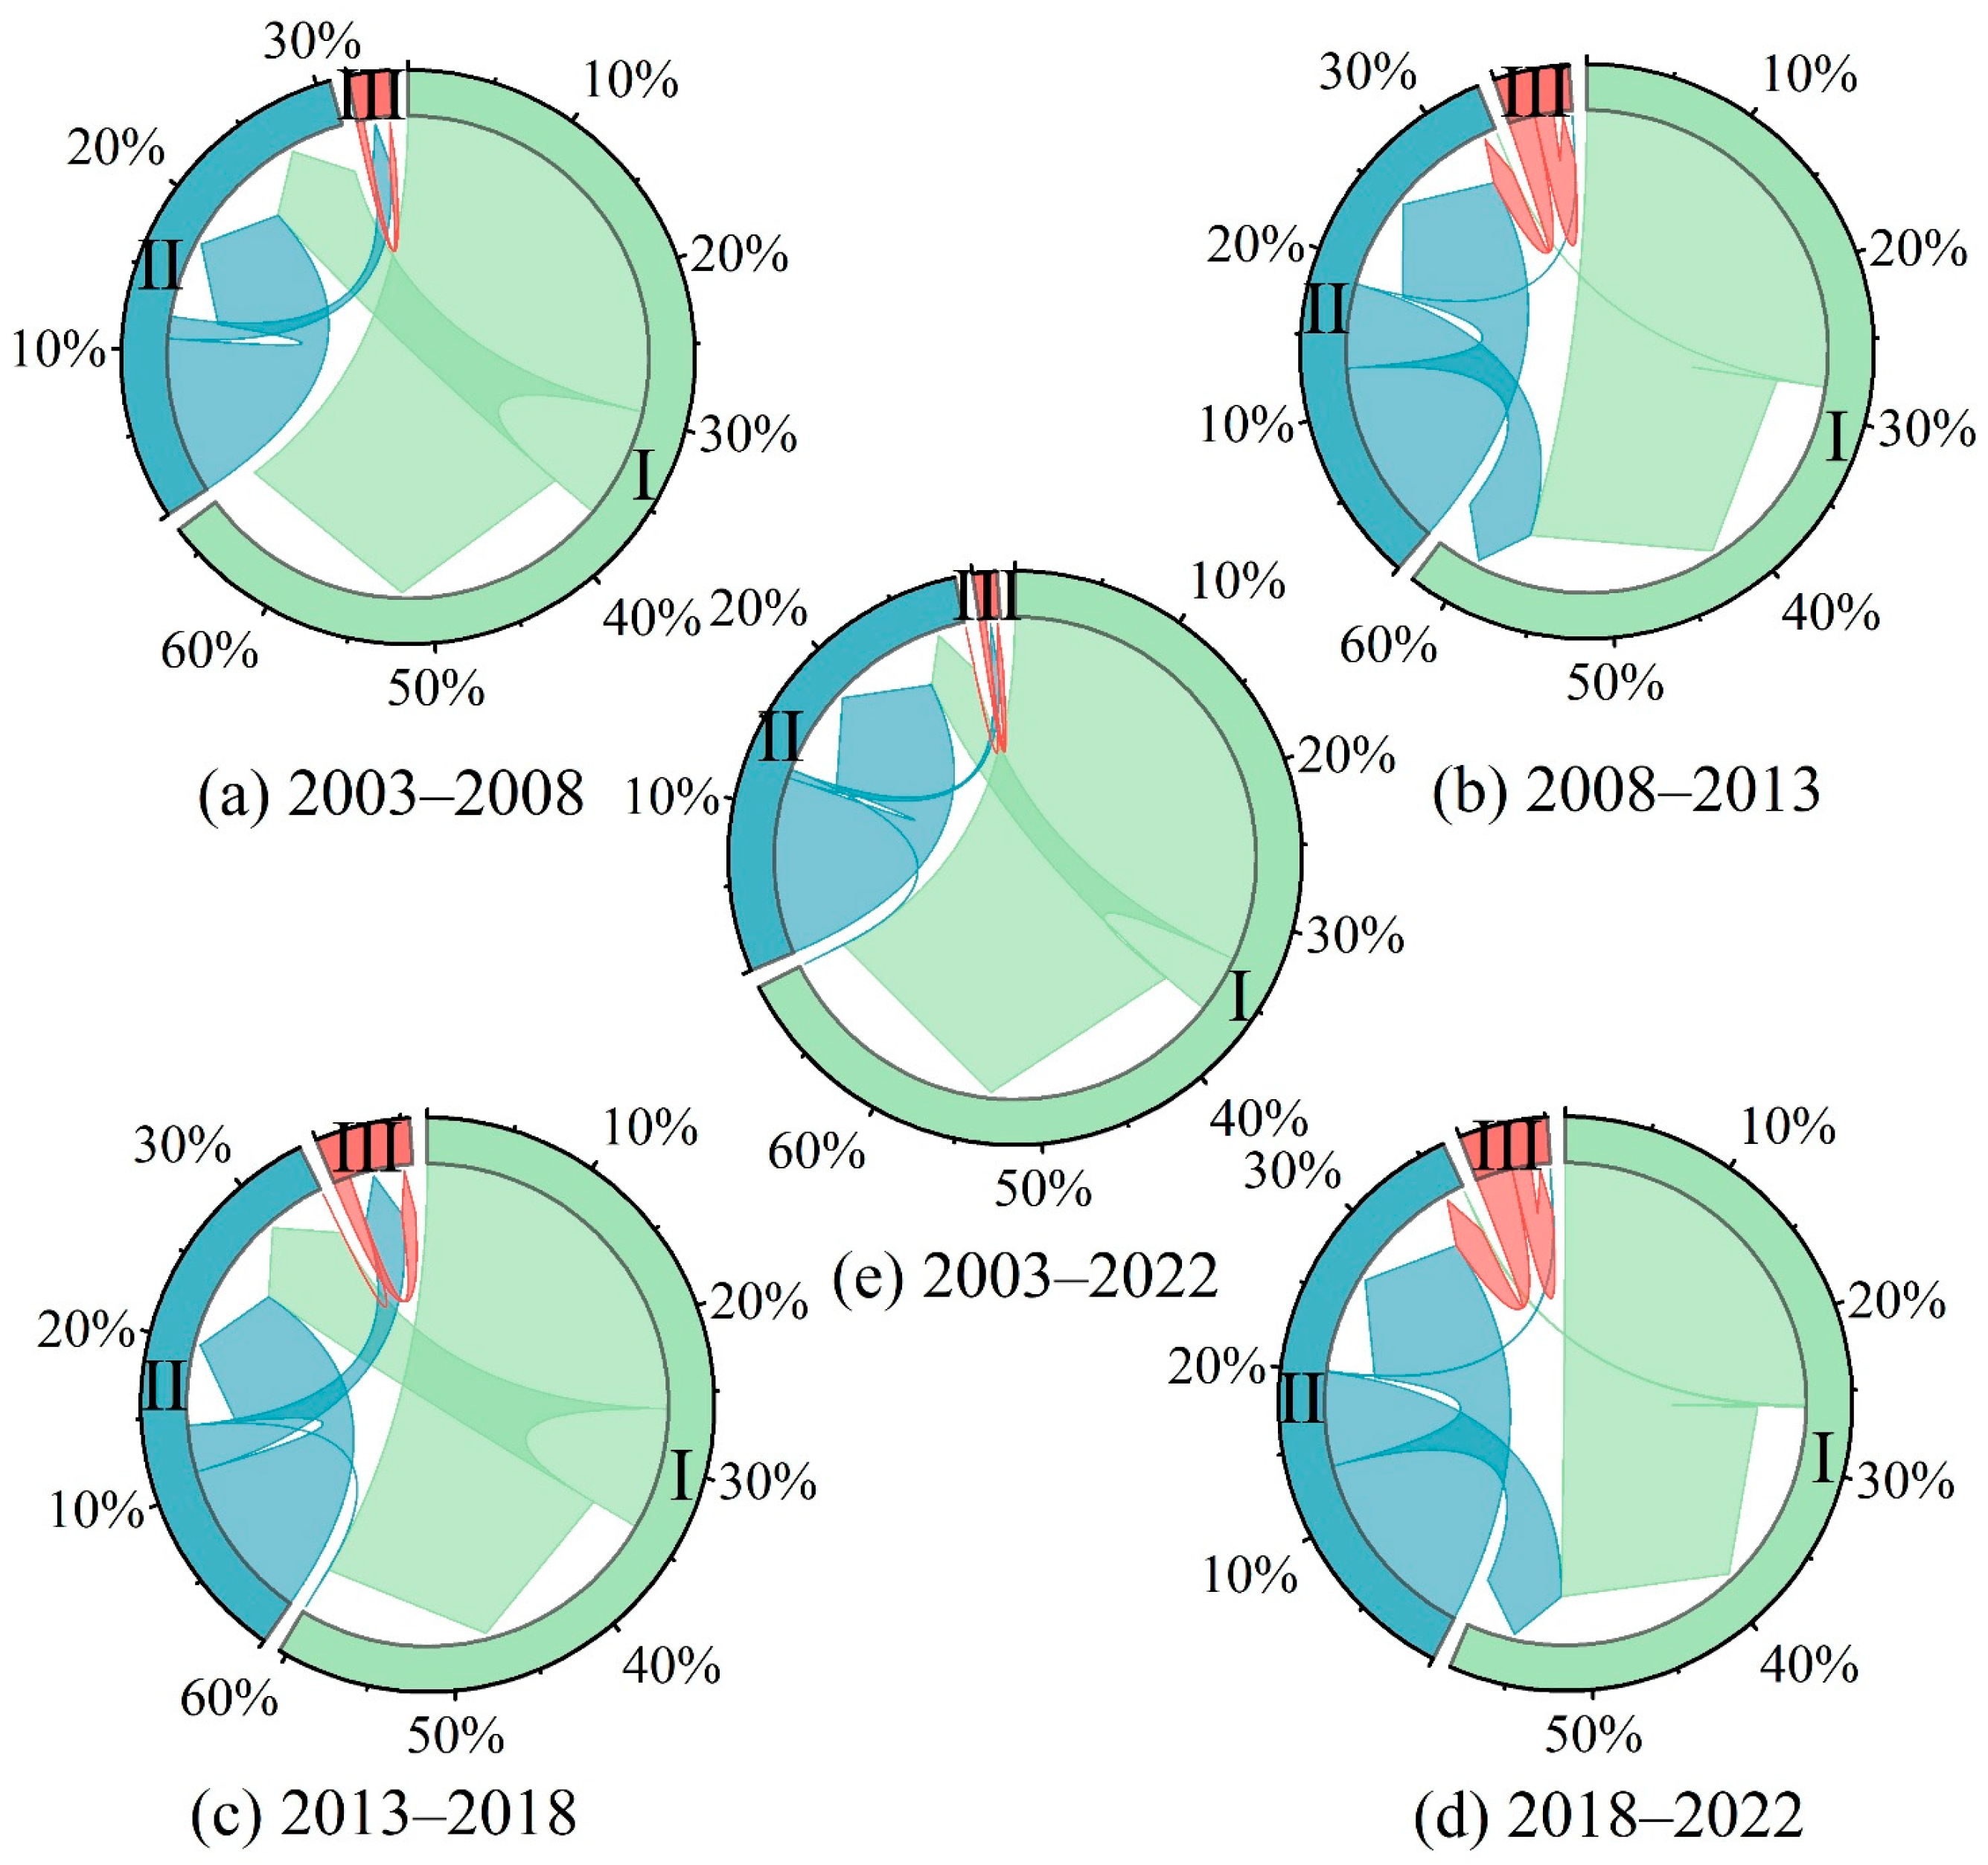
3.2.3. Analysis on the Expansion of Rubber Plantations and Changes in Their Soil Erosion Levels

Land cover transition matrices are widely used in spatial analysis to quantify the changes in various land cover types over a time series. Multi-temporal land cover maps are used to calculate land cover transition matrices to clarify the main sources of rubber plantation expansion. We divide rubber plantation soil erosion into three levels—Level I (<1 t·ha−1·yr−1), Level II (1–2 t·ha−1·yr−1), and Level III (≥2 t·ha−1·yr−1)—to analyze the conversion of rubber plantation SE at various levels across different years. Transition matrices of different levels are also calculated.

3.3. Analysis on Soil Erosion in Rubber Plantations

3.3.1. Methods of Soil Erosion Trend in Rubber Plantations

Mann–Kendall (MK) is a non-parametric statistical method used to examine long-term trends in data, which is particularly useful for remote sensing time-series data [46,47]. The MK trend test is advantageous in that it does not require data to follow a specific distribution and is insensitive to missing values and outliers. Hence, this study applies the Sen–MK method, using Sen’s slope [48], to evaluate the trend of soil erosion changes in rubber plantation areas (areas planted with rubber trees from 2003 to 2022). The calculation of the trend term for soil erosion (SSE) is expressed as Equation (16):
S SE = Median SE j SE i j i     j > i
where i and j denote the soil erosion values for the i-th and j-th year. SSE is the trend term for soil erosion; SSE > 0 indicates that soil erosion is increasing, while SSE < 0 indicates that soil erosion is decreasing.
The calculation of the trend direction and intensity of time series of soil erosion (ZSE) is expressed as Equation (17):
Z S E = S 1 n ( n 1 ) ( 2 n + 5 ) 18 S > 0 0 S = 0 S + 1 n ( n 1 ) ( 2 n + 5 ) 18 S < 0
The ZSE value determines the significance of trend analysis. If the ZSE value exceeds 1.96, the trend is significant at the 95% confidence level. n represents the number of data points in the sequence, and S is the test statistic when |z| < μ 1 − α/2, indicating the trend significance change in soil erosion at a given significance level α. S is given by Equation (18):
S = i = 1 n 1 j = i + 1 n s g n SE j SE i
where sgn(SEjSEi) represents the sign function. When SEjSEi > 0, sgn = 1; when SEjSEi = 0, sgn = 0; and when SEjSEi < 0, sgn = − 1.
Based on the results of the Sen–MK analysis, we divided the soil erosion trend of rubber plantations into five levels [49]: namely, significant aggravation, slight aggravation, stable trend, slight mitigation, and significant mitigation (Table 2).

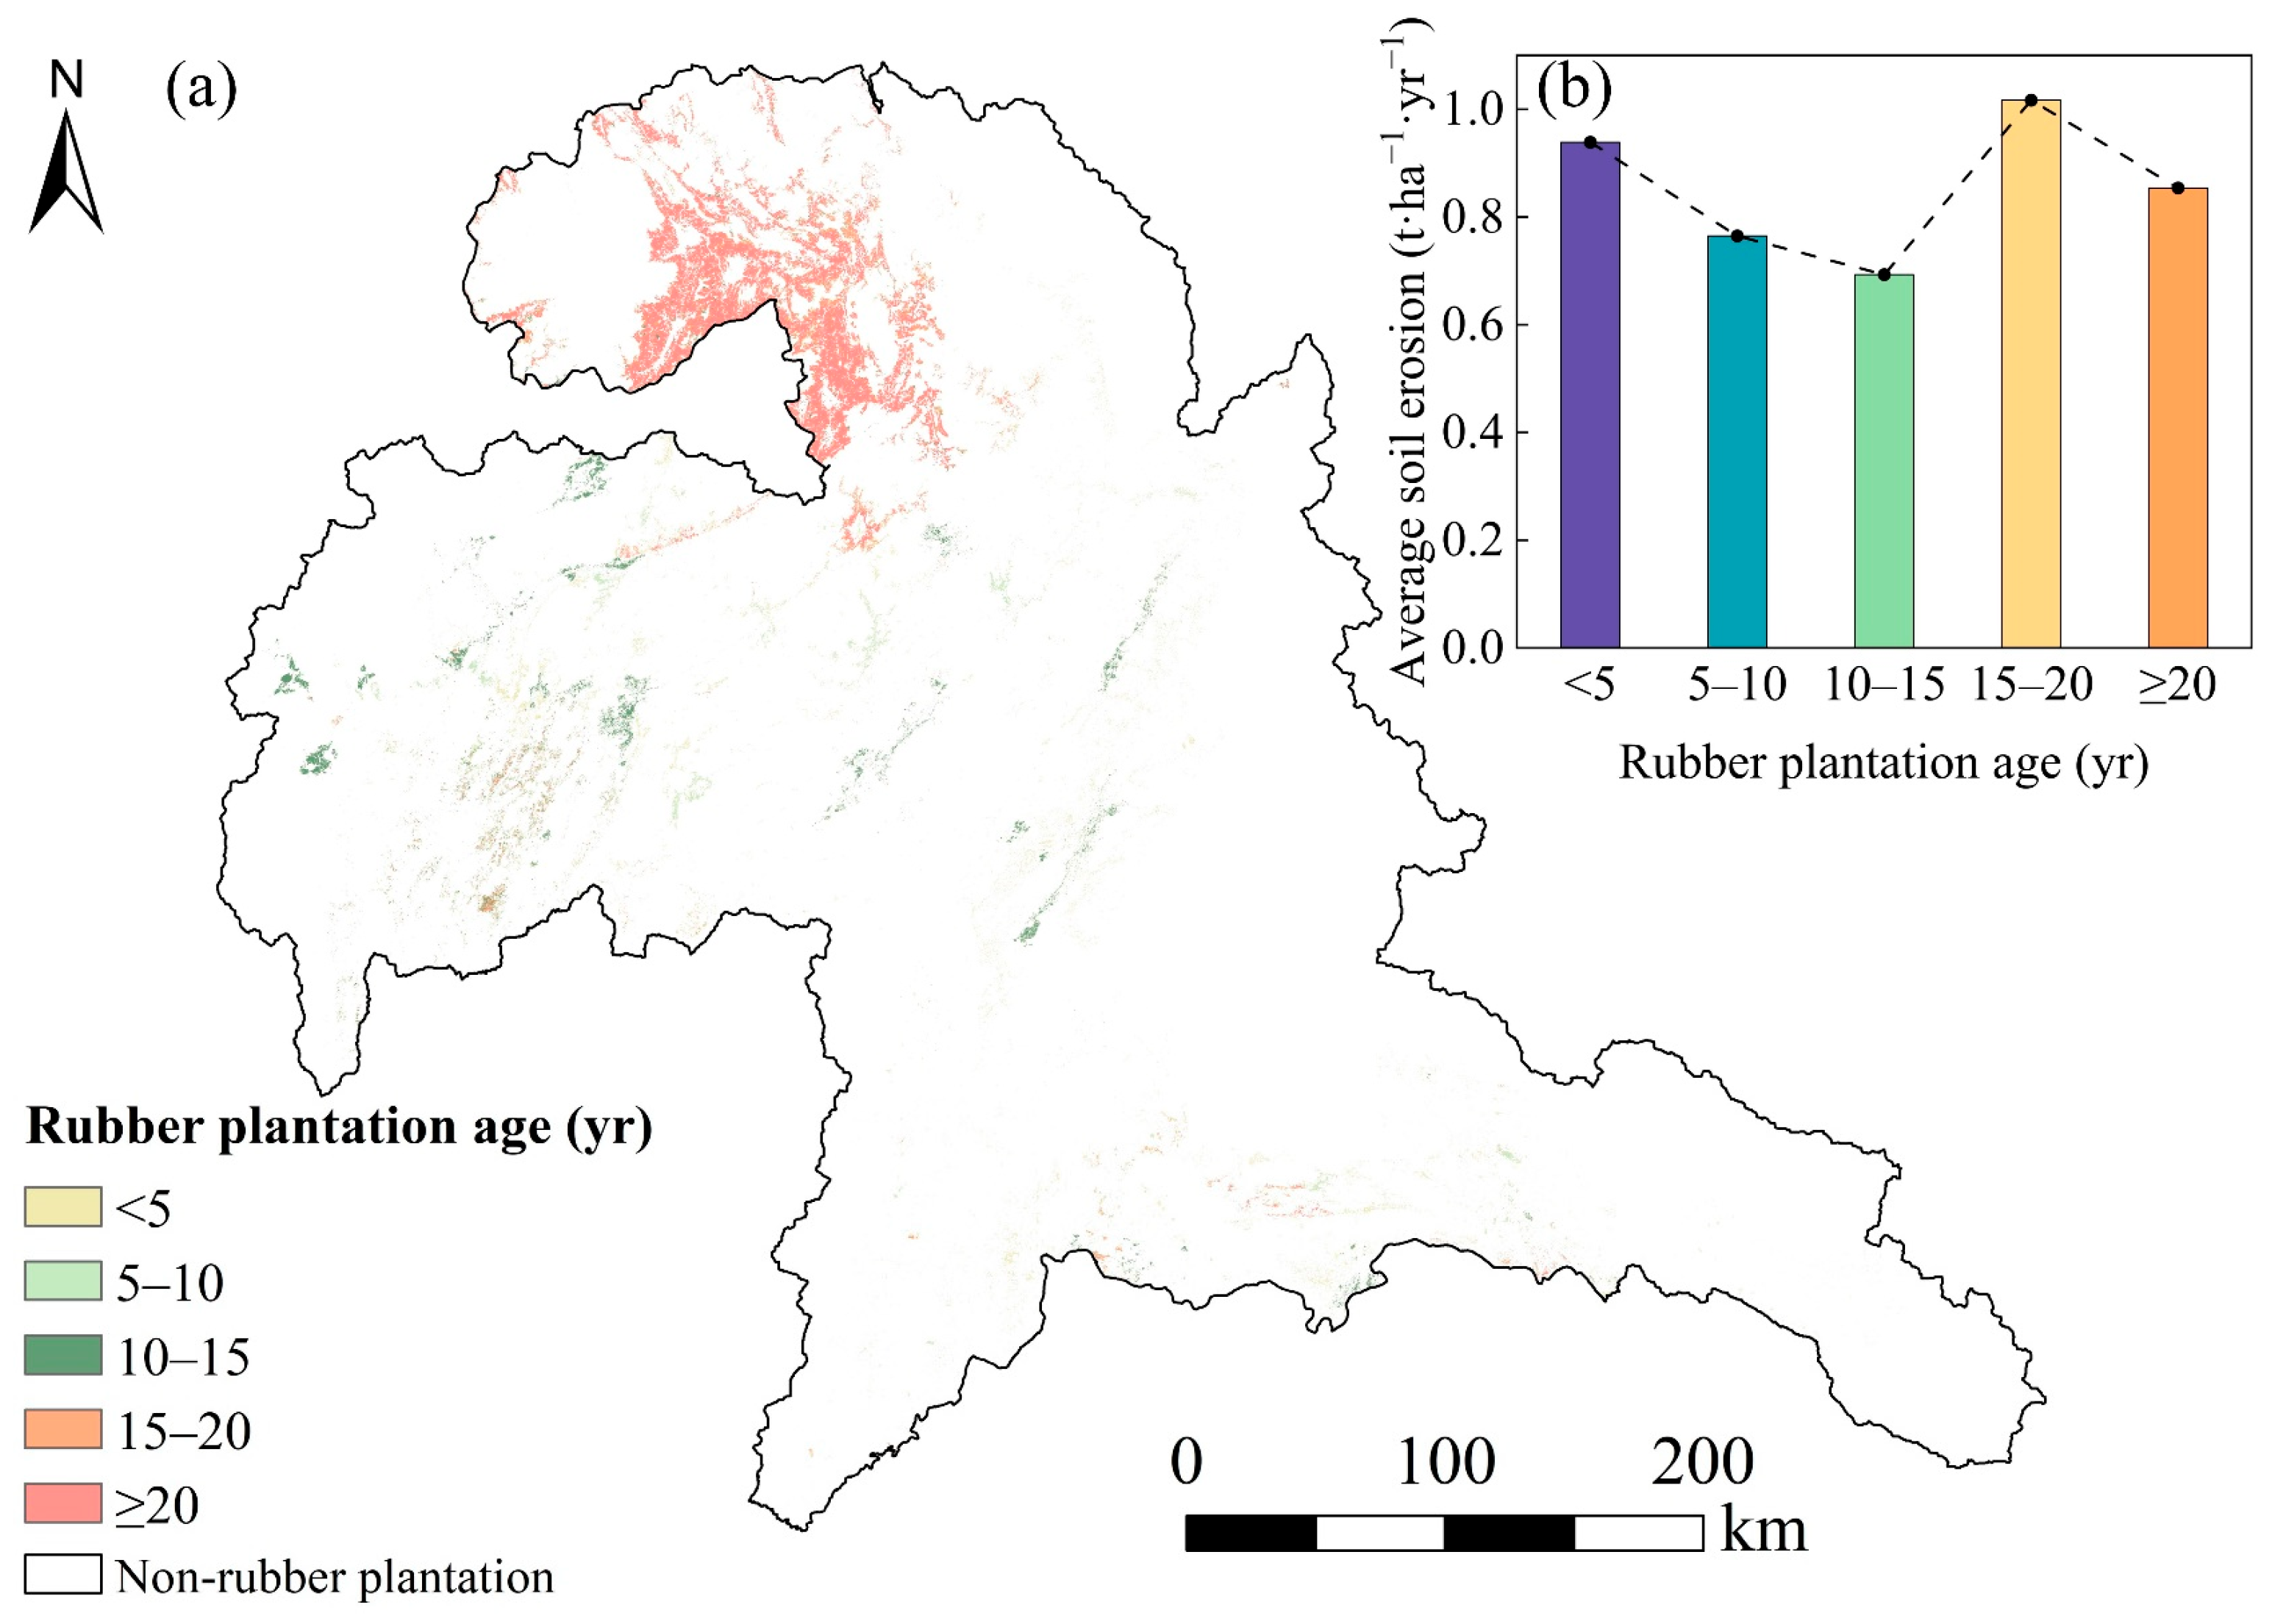
3.3.2. Analysis of Soil Loss in Rubber Plantations of Different Ages

To investigate the soil erosion difference on stand ages, five groups of rubber plantations are classified based on their age, with 2022 as the baseline, namely, <5 years, 5–10 years, 10–15 years, 15–20 years, and ≥20 years.

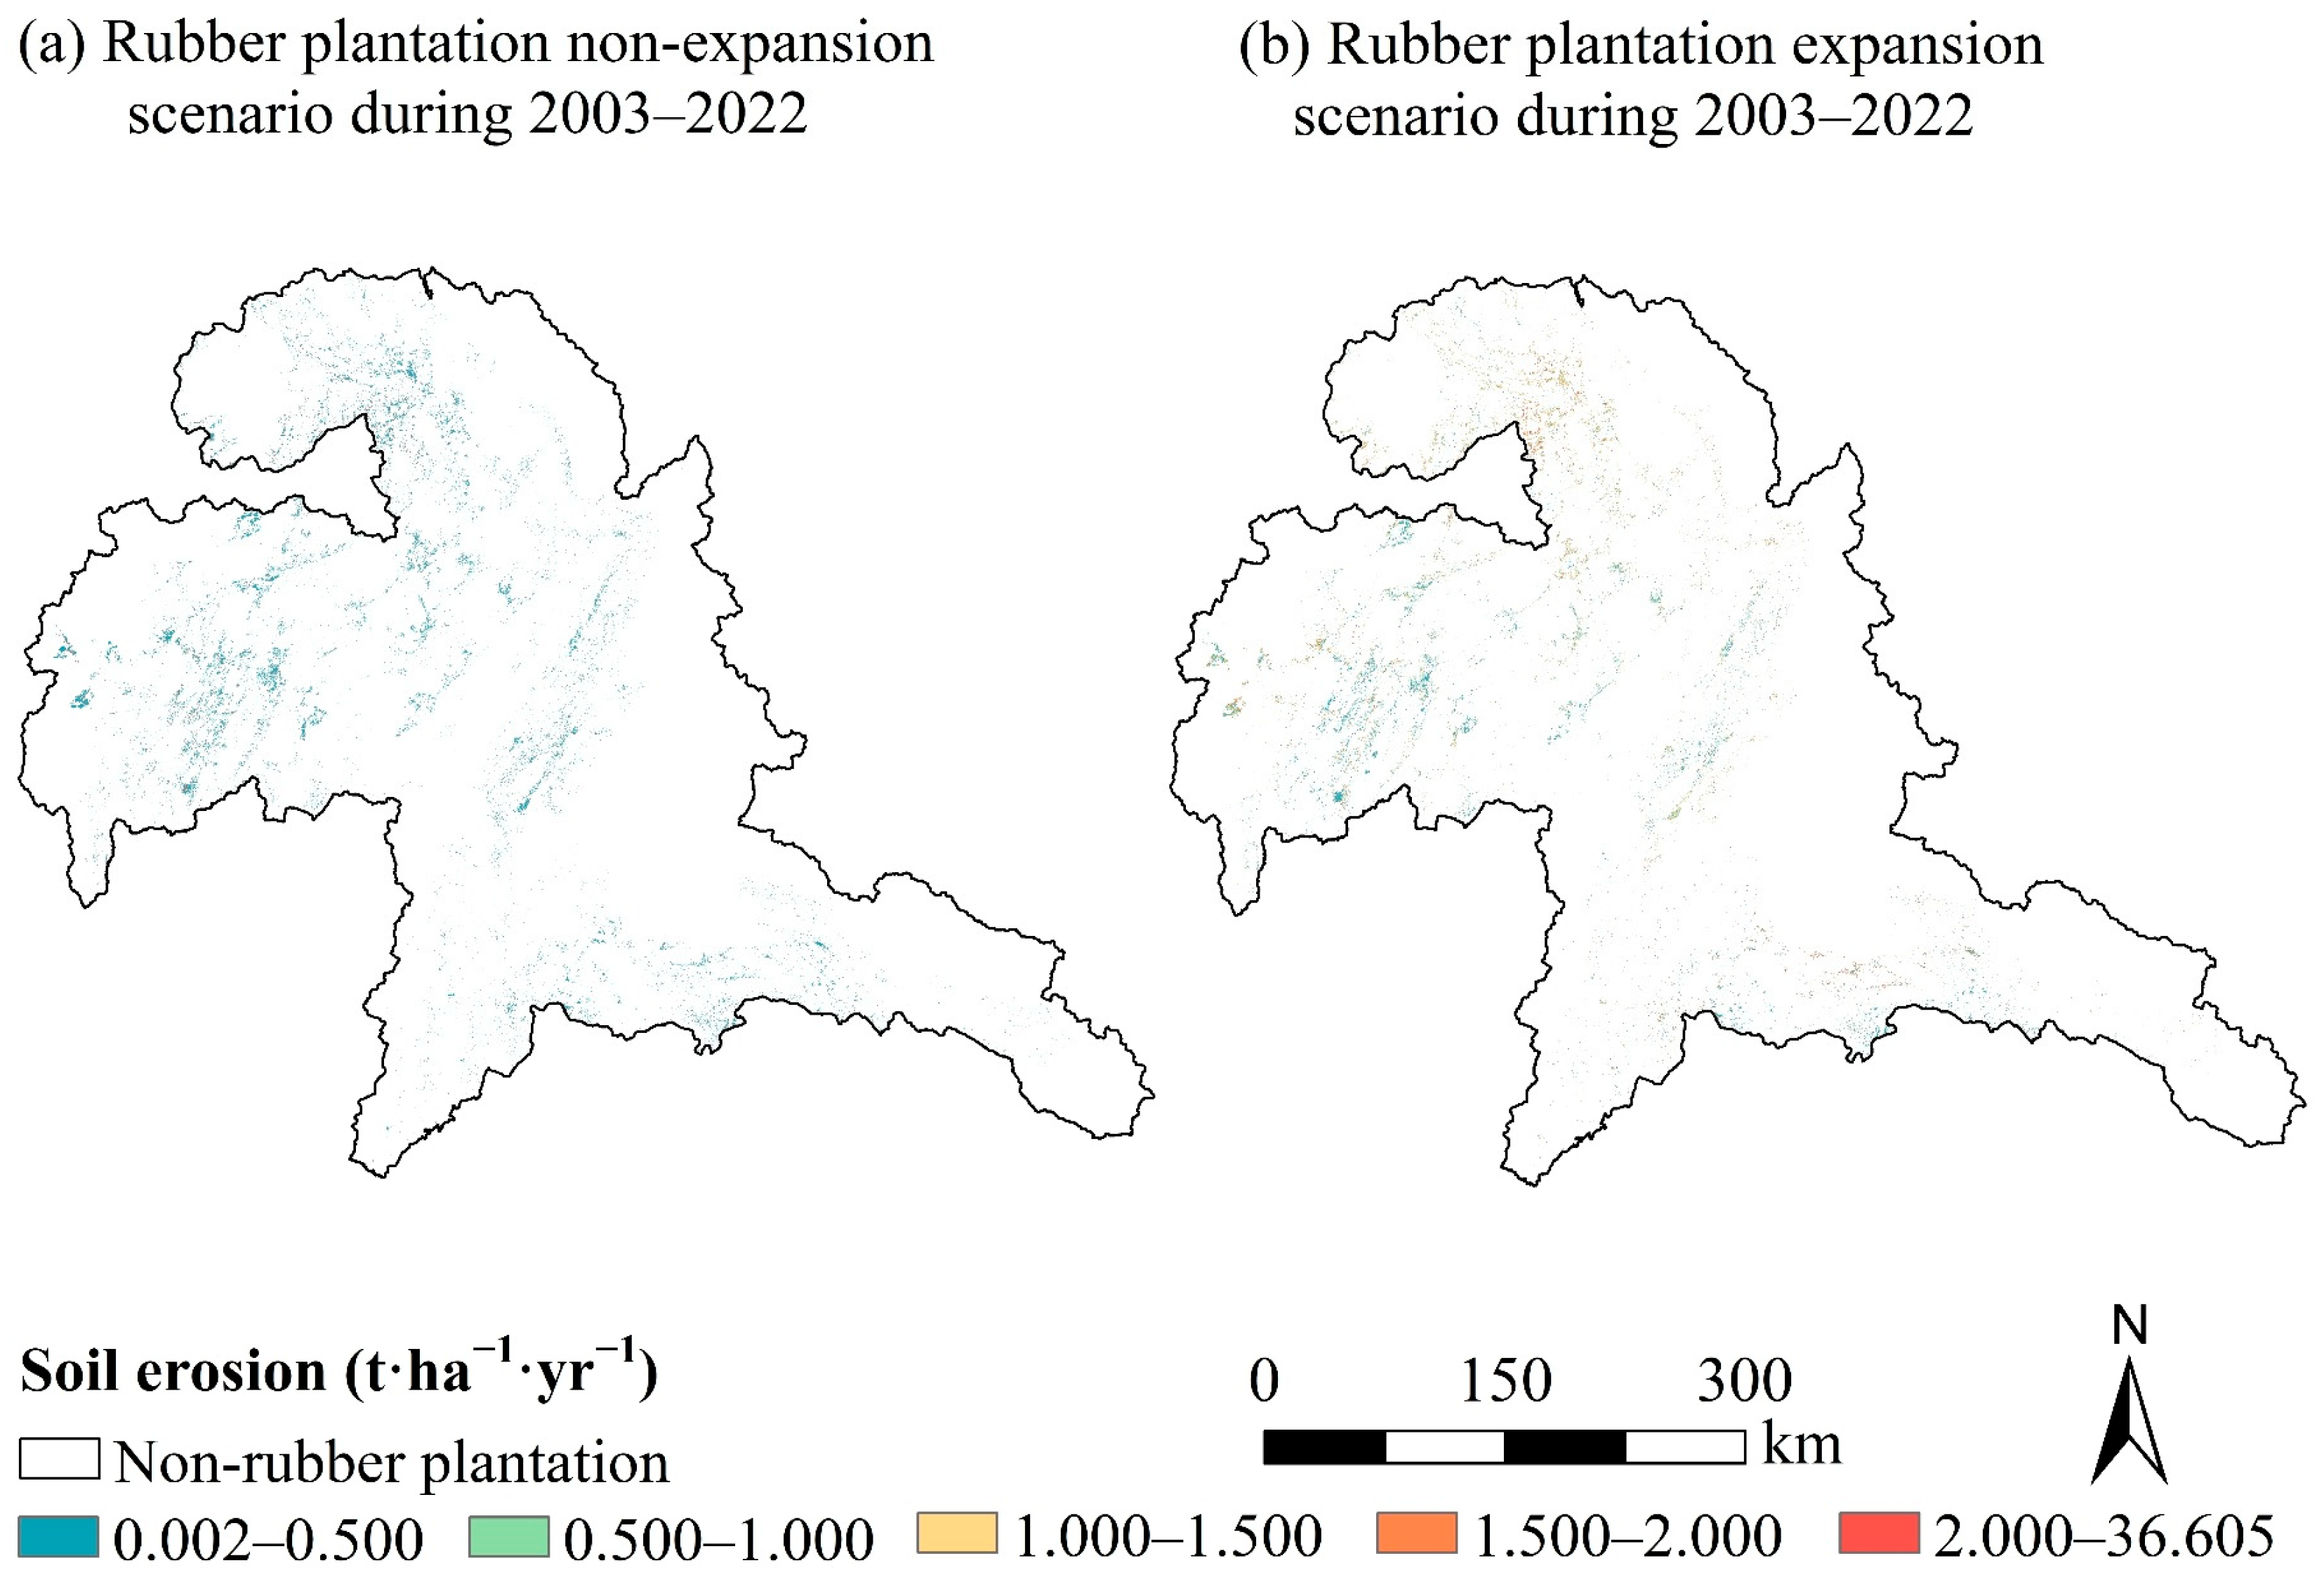
3.4. Methods for Calculating Soil Erosion Caused by Rubber Plantation Expansion

Since the temporal variation of soil erosion is mainly caused by both rubber plantation expansion and climate variation, in order to accurately assess the impact of soil erosion from rubber plantations, it is necessary to eliminate the influence of climate variations. In this study, we design a scenario-based simulation approach, setting up two scenarios to simulate soil erosion in the studied region. The first scenario represents the actual expansion scenario. In this scenario, the soil erosion in the expanded rubber plantation areas ( SE 1 expansion   areas ) is calculated using the R of the end year and the CP of the expanded rubber plantation at the end year (Equation (17)). The second scenario represents a virtual scenario which assumes no rubber plantation expansion at the end year. In this case, soil erosion in the same areas (namely the expanded rubber plantation areas) ( SE 2 expansion   areas ) is calculated using the R of the end year and the C and P of source land cover types at the initial year (Equation (18)). Thus, the soil erosion due to rubber expansions ( SE rubber   expansion ) can be obtained by subtracting SE 2 expansion   areas from SE 1 expansion   areas . We also propose an indicator ( SE exacerbated   rate ) to feature the exacerbated rate of soil erosion due to rubber plantation expansion. It is calculated by dividing the SE r u b b e r   e x p a n s i o n by SE 2 expansion   areas .
SE 1 expansion   areas = R end   year × K × LS × CP rubber   &   end   year
SE 2 expansion   areas = R end   year × K × LS × CP sources   types   &   initial   years
SE rubber   expansion = SE 1 expansion   areas SE 2 expansion   areas
SE exacerbated   rate = SE r u b b e r   e x p a n s i o n / SE 2 expansion   areas
where the SE1expansion areas and SE2expansion areas represent soil erosion under the rubber plantation expansion and non-expansion scenarios, respectively. SErubber expansion and SEexacerbated rate represent the soil erosion and the intensification ratio of rubber plantation expansion, respectively. Rend year represent the R factor at the end of a rubber plantation expansion phase, while CPsources types & initial years and CPrubber & end year represent the CP for the non-expansion and real expansion scenarios, respectively. K and LS represent the soil erodibility factor and slope length and steepness factors, respectively.

3.5. Analysis of Driving Factor Soil Erosion in Rubber Plantations

Two types of potential influencing factors—natural factors (terrain, climate, soil) and human factors—are considered to analyze the driving forces of soil erosion in rubber plantations. Natural factors include slope, aspect, altitude, annual precipitation, mean annual temperature, and soil type. Human factors include GDP and population. Based on these potential influencing factors, we employ the optimal parameter-based geographical detector (OPGD) [50] to perform single-factor and factor interaction analysis to determine the key influencing factors and their interactions of soil erosion in rubber plantations. The data discretization methods, including equal interval, natural interval, quantile interval, geometric interval, and standard deviation classification, with category settings between 4 and 8, are used for data processing before implementing the factor analysis in geographical detectors. The principle of factor detection in geographic probing is shown in Equation (21):
Q = 1 h = 1 L N h σ h 2 N σ 2
where Q denotes the importance of the explanatory variable, with a range from [0, 1]. h = 1, …; L represents the stratification of dependent variable Y or factor X; Nh and N refer to the number of units in layer h and in the entire region, respectively; σ h 2 and σ 2 denote the variances of the Y values in layer h and in the entire region, respectively.

4. Results

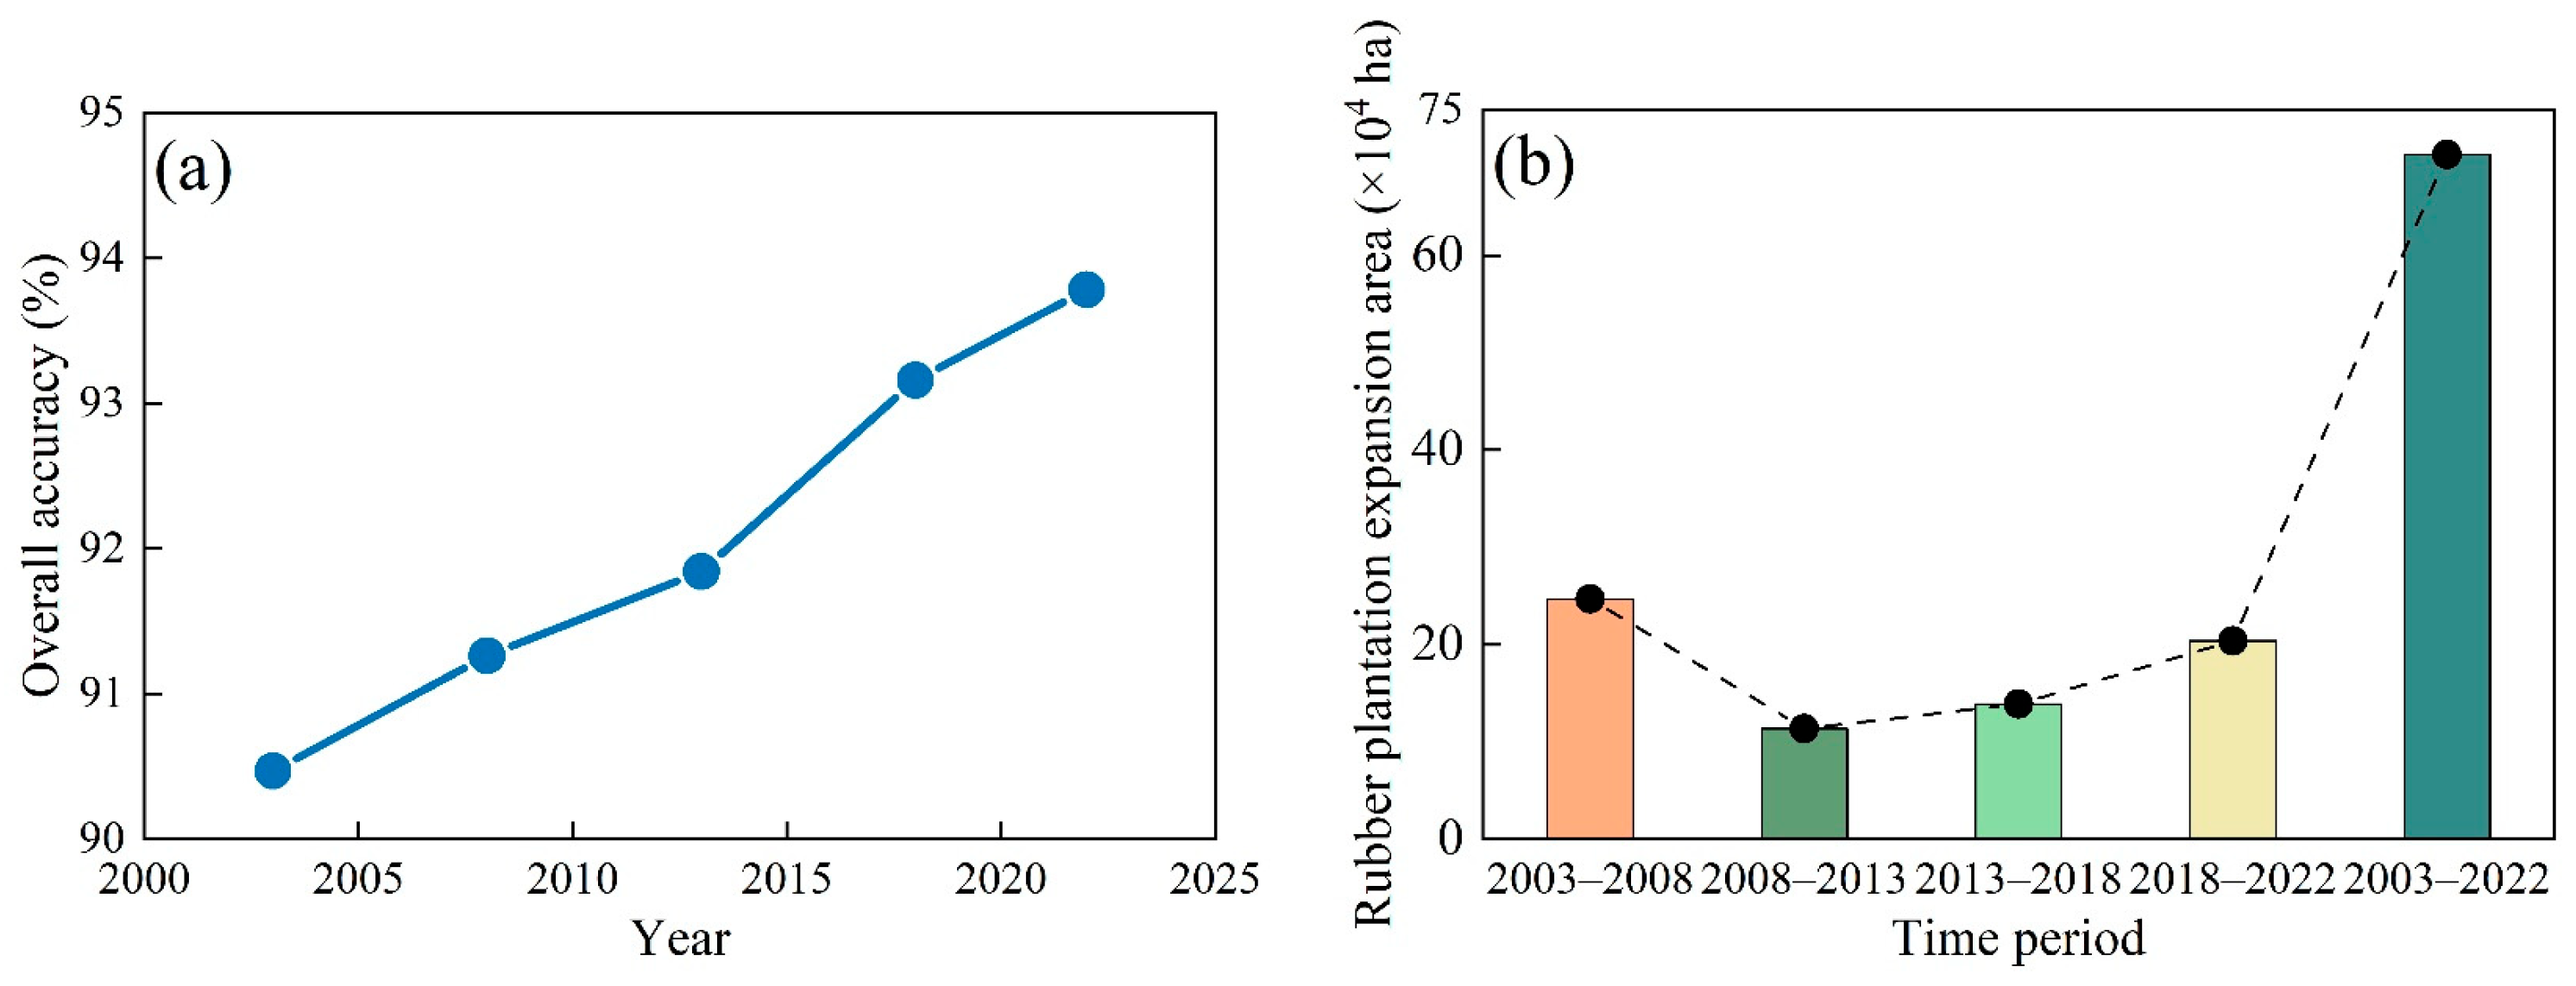
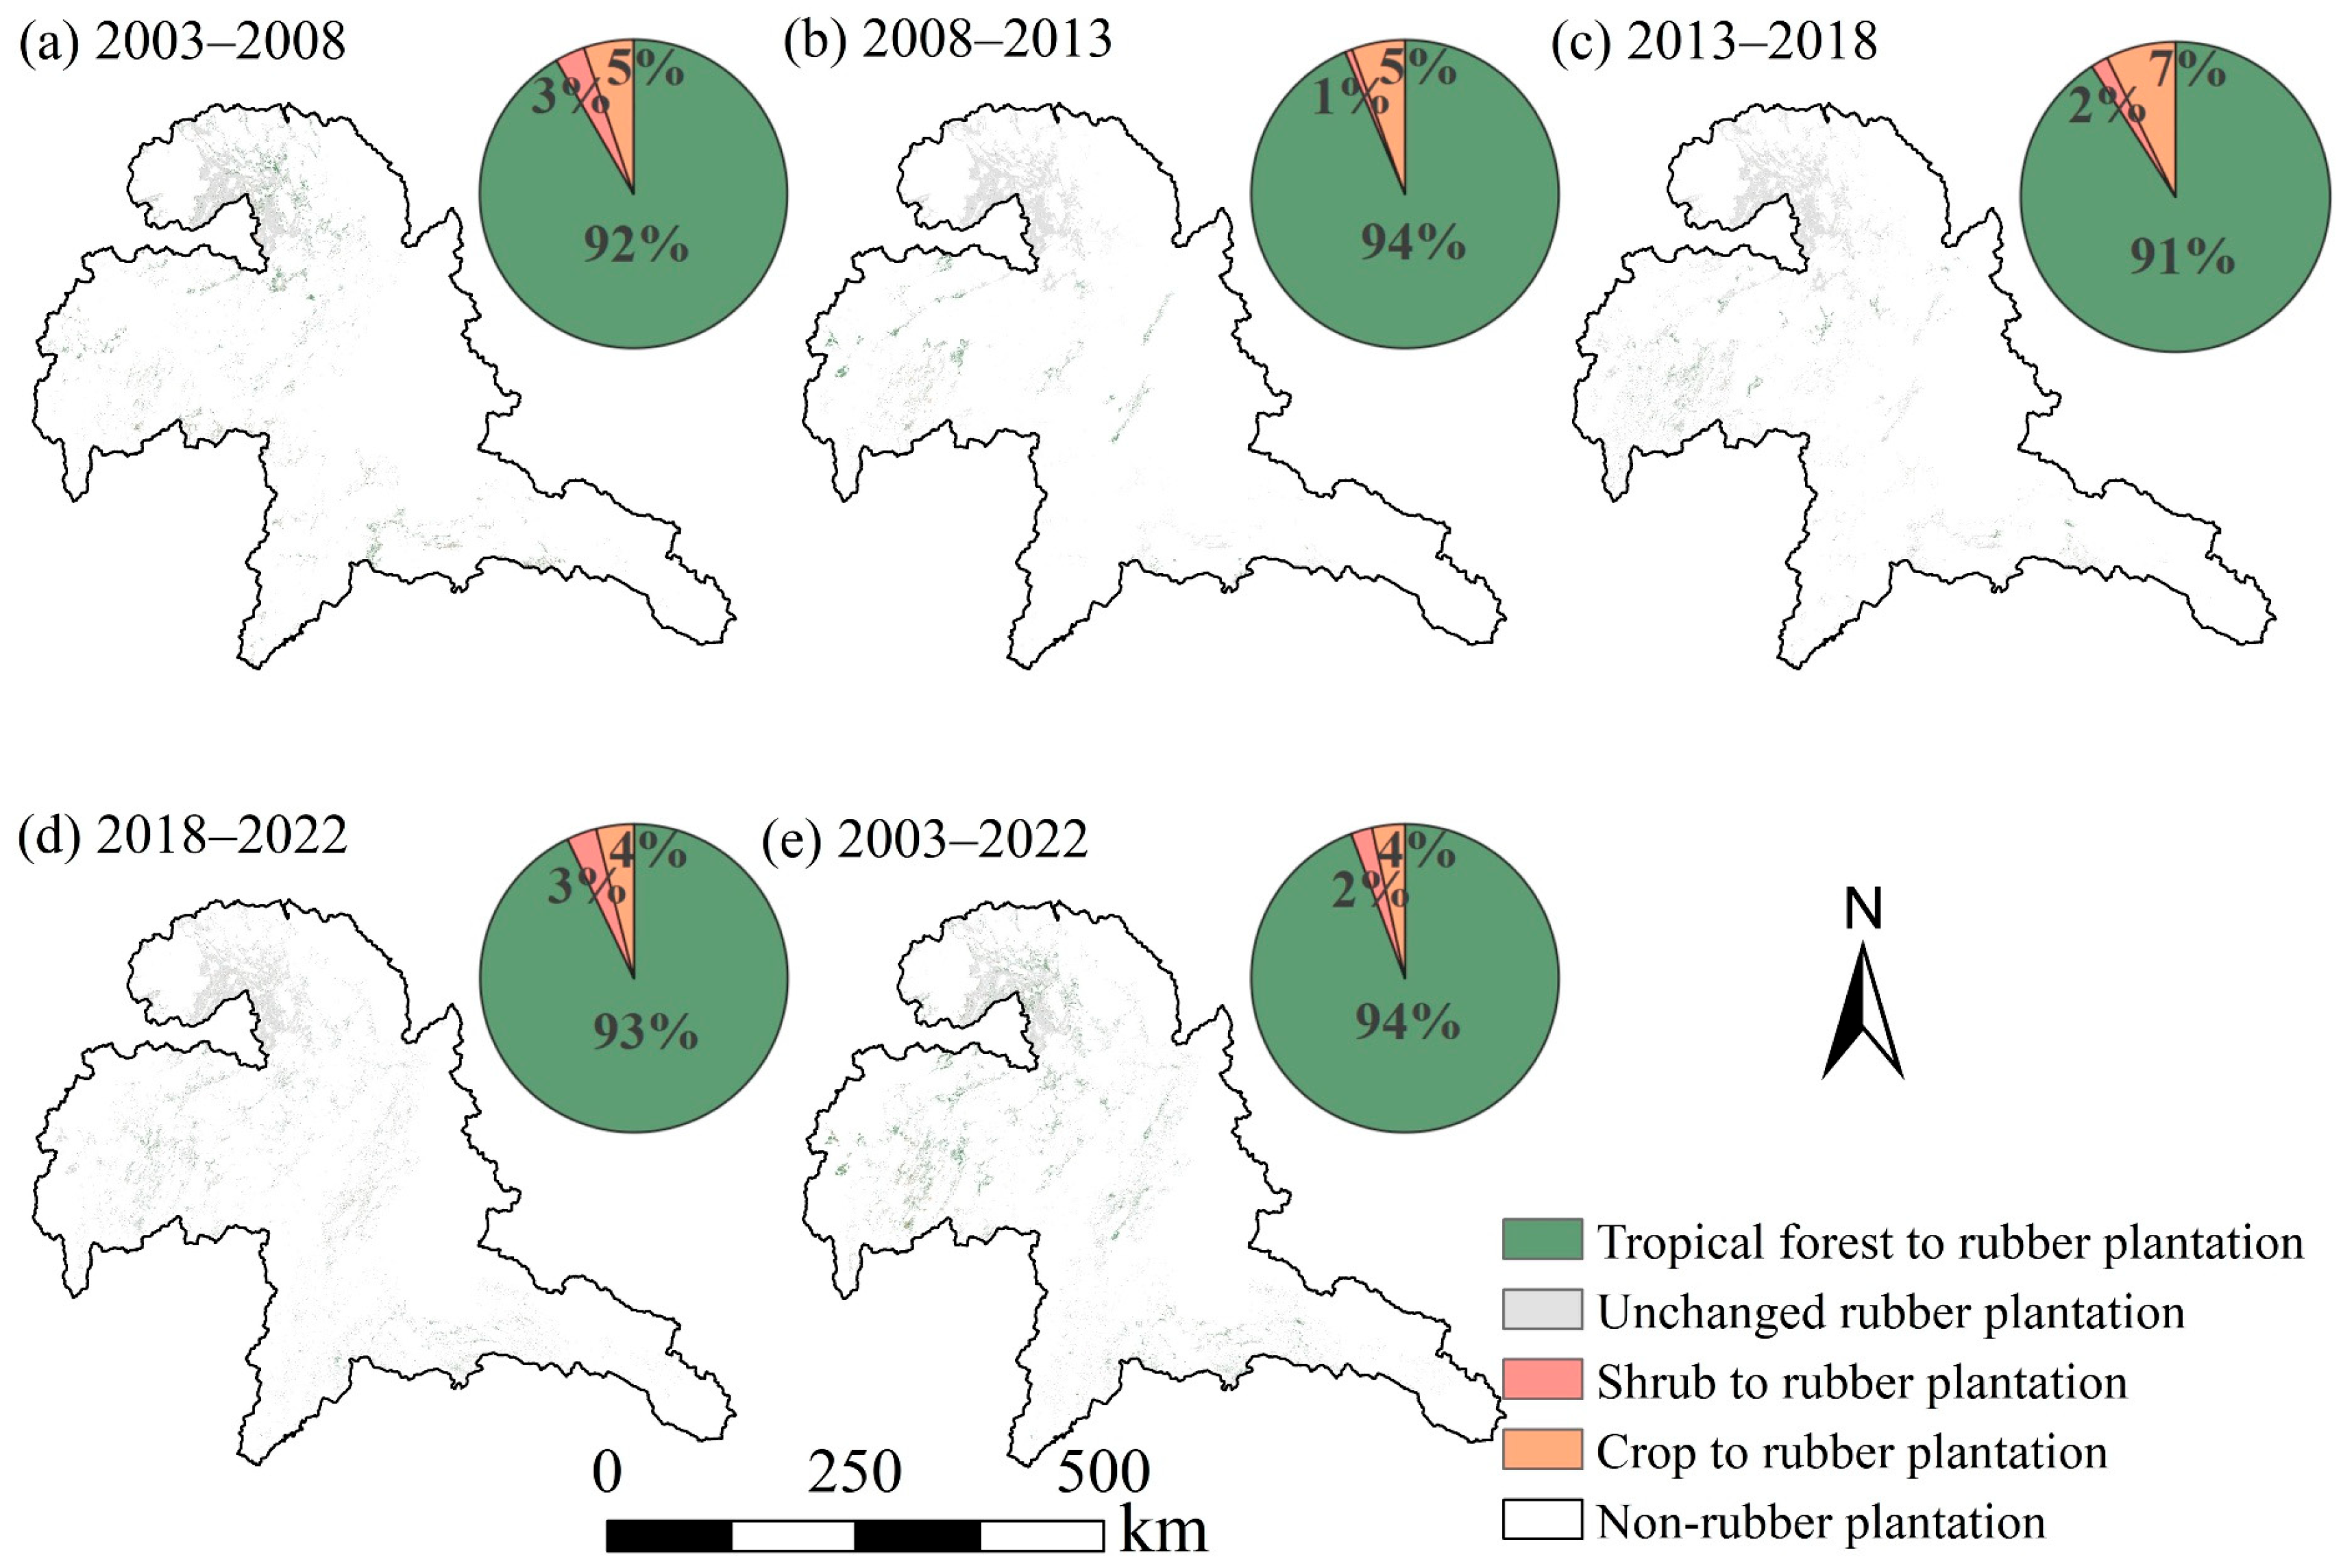
4.1. Rubber Plantation Expansion

The average overall accuracy (OA) across the five-classification using Random Forests algorithm periods is 92.10% (Figure 2a), with the minimum OA exceeding 90%. This indicates that the mapped rubber plantation distribution of each year is sufficiently reliable for subsequent soil erosion modeling. The area of rubber plantation expansion exhibits a trend of initially decreasing and subsequently increasing between 2003 and 2022 (Figure 2b). The greatest expansion occurred during the years 2003–2008, with an increase of 0.2472 million hectares (24.720 × 10⁴ ha). In contrast, the expansion slowed significantly during the period 2008–2013, with only 0.11367 million hectares (11.367 × 10⁴ ha) added. Subsequently, the area of newly expanded rubber plantations began to rise again, increasing by 13.893 × 10⁴ ha during the period 2013–2018 and 20.411 × 10⁴ ha during the years 2018–2022. In total, the total rubber plantation expansion area from 2003 to 2022 reached 0.70391 million hectares (70.391 × 10⁴ ha).
Rubber plantations are primarily converted from tropical forest, shrubs, and crops (Figure 3). The largest proportion of land converted to rubber plantations comes from tropical forests, accounting for more than 90% of the total converted area (Figure 3). Croplands follow, with a greater conversion area than shrubs. The fastest expansion occurred during the years 2003–2008, with the largest area of tropical forest—approximately 2.265 million hectares (22.654 × 10⁴ ha)—converted to rubber plantations (Figure 3a). During the period 2008–2013, this conversion decreased by more than half, with only 1.064 million hectares (10.645 × 10⁴ ha) converted (Figure 3b). The conversion area increased again between 2013 and 2018, reaching 1.263 million hectares (12.632 × 10⁴ ha) (Figure 3c), and further to 1.896 million hectares (18.960 × 10⁴ ha) during the years 2018–2022 (Figure 3d).
The conversion of cropland to rubber plantations is relatively limited due to the mountainous terrain in the study area, accounting for only 4% of the total conversion between 2003 and 2022. The largest conversion from cropland occurred during the period 2003–2008, with an area of 0.129 million hectares (1.292 × 10⁴ ha). Conversion from shrubs is the smallest, contributing only 2% during the study period.
Spatially, rubber plantations expanded in all directions—from south to north and east to west—between 2003 and 2022. Most plantations are concentrated in Xishuangbanna, in the northern part of the study area, where many were established before 2003. Over the past two decades, rubber plantations in Laos have expanded rapidly, with extensive tropical forest clearance, particularly in the western, central, and southern parts of the study region. Cropland conversion is primarily concentrated in the western parts of Myanmar and Thailand, located in the southern region of the study area. Conversion from shrublands is more fragmented and scattered across the landscape.

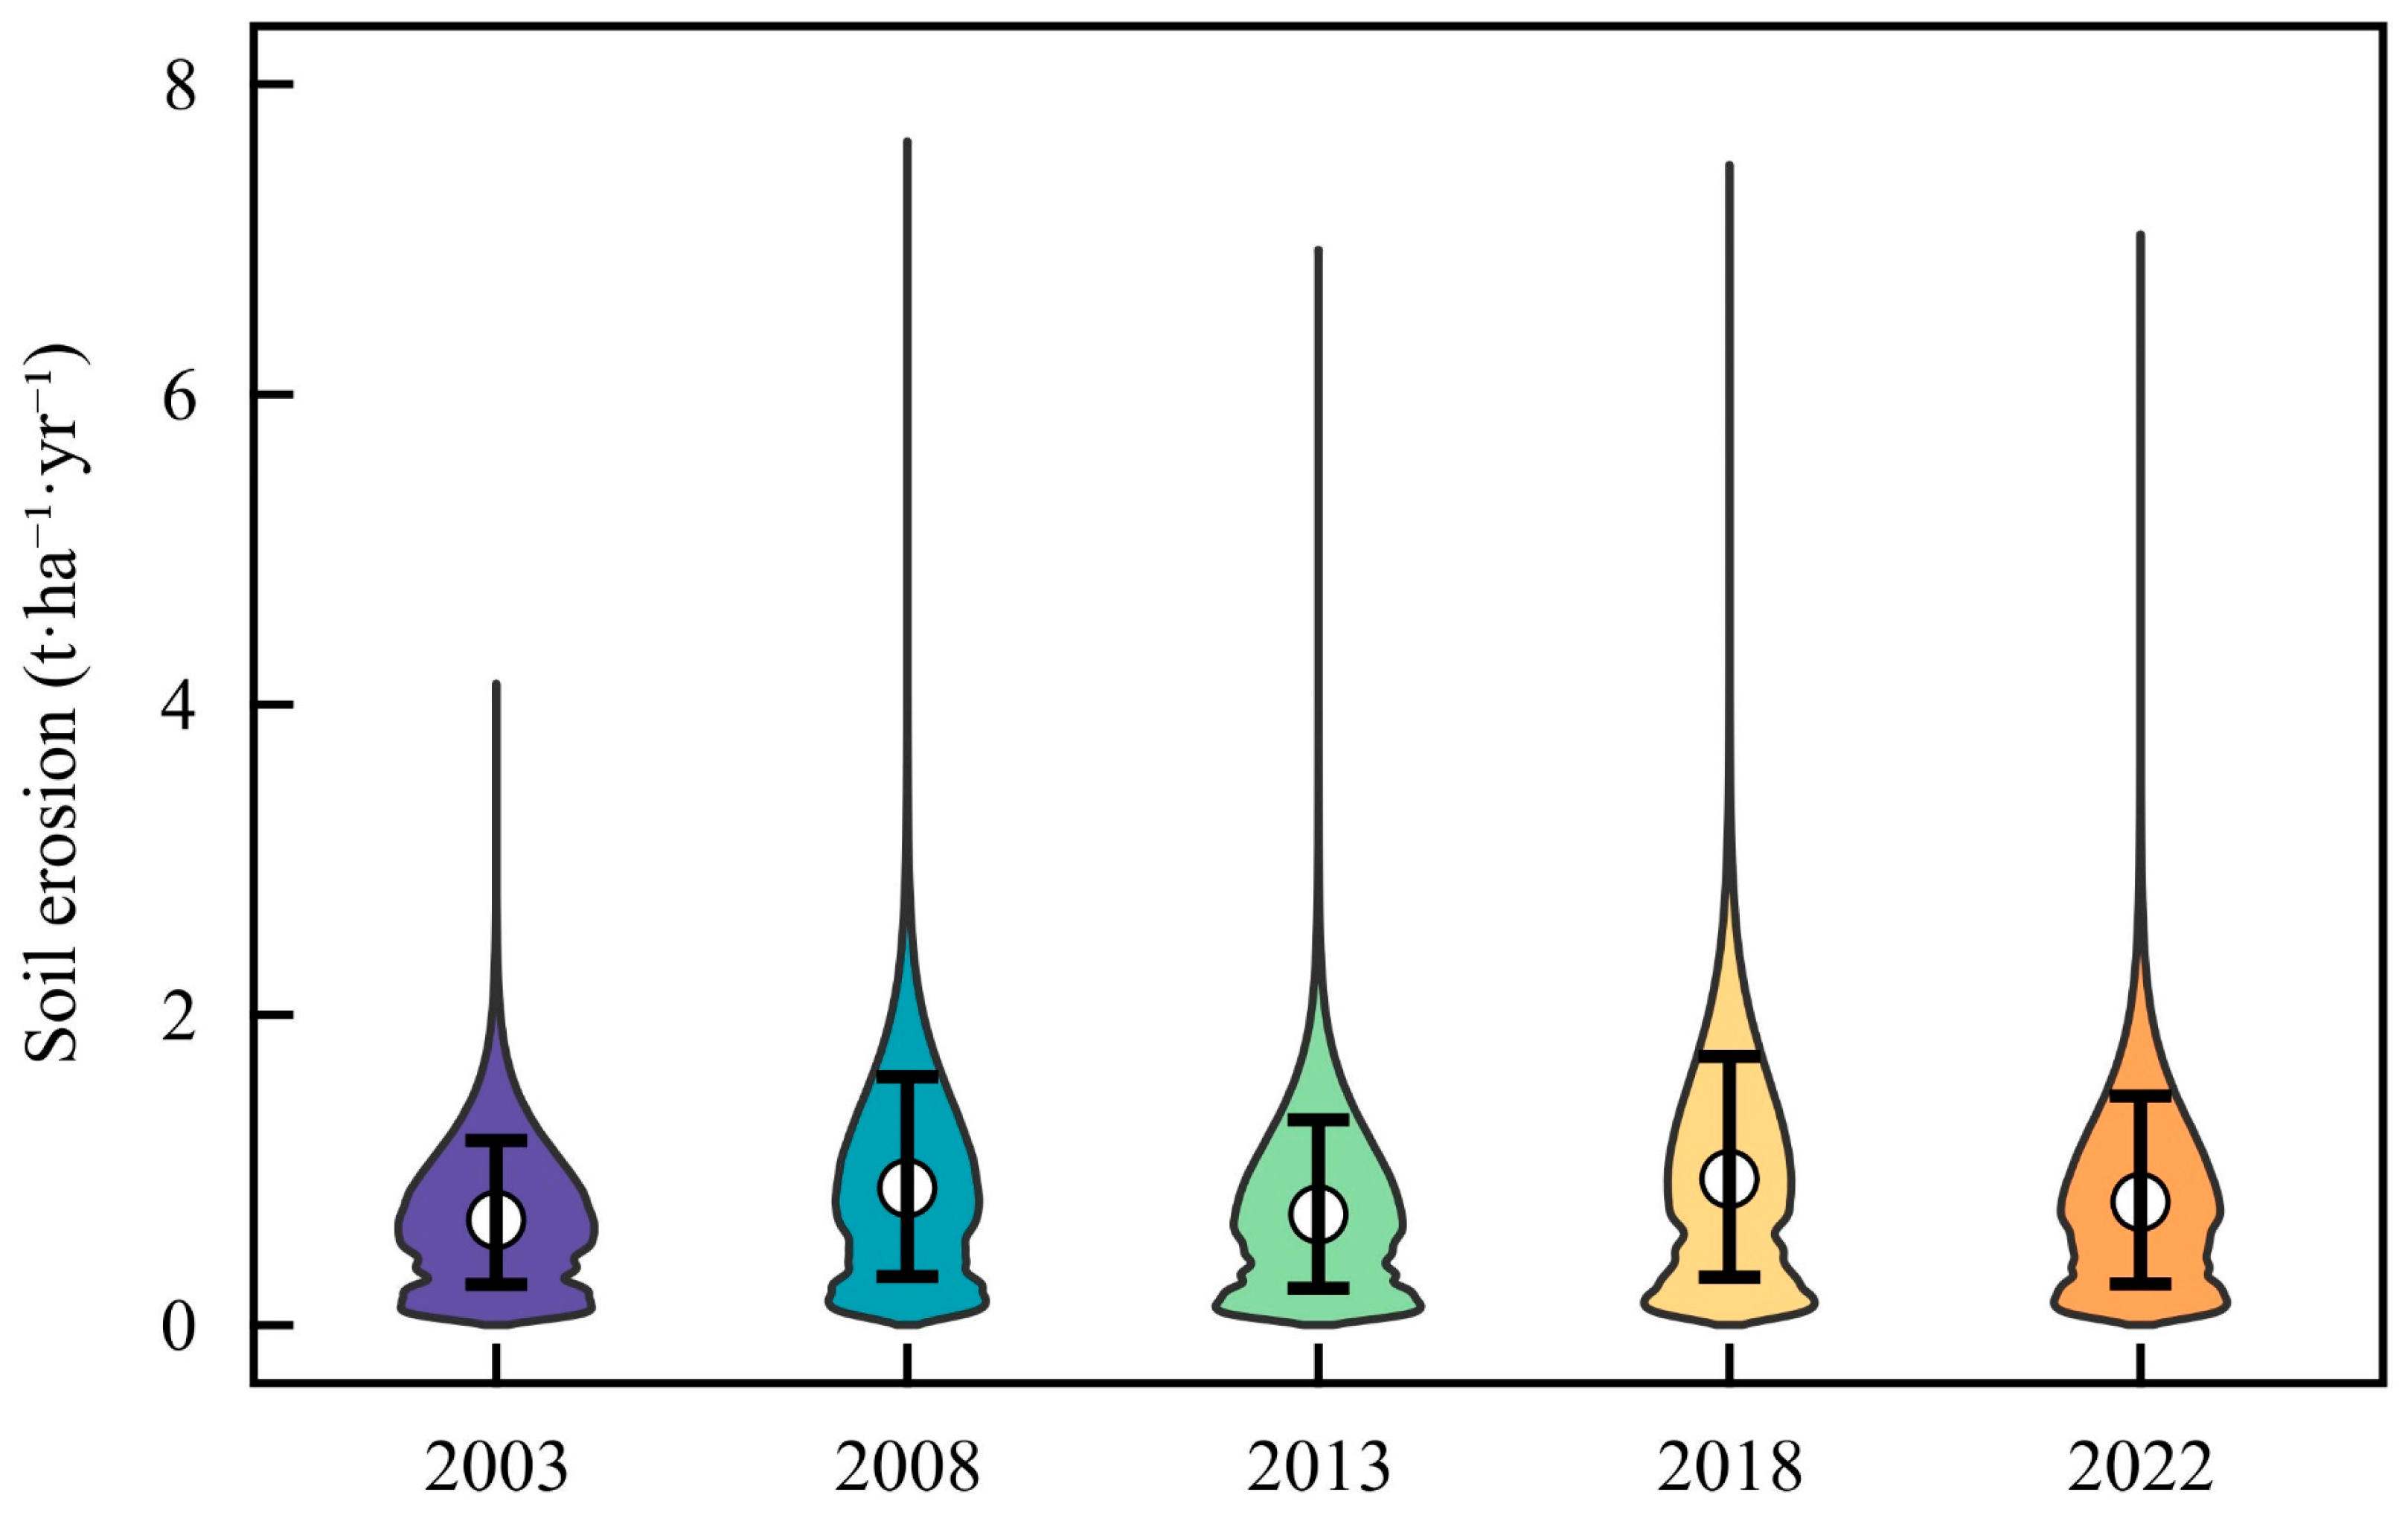
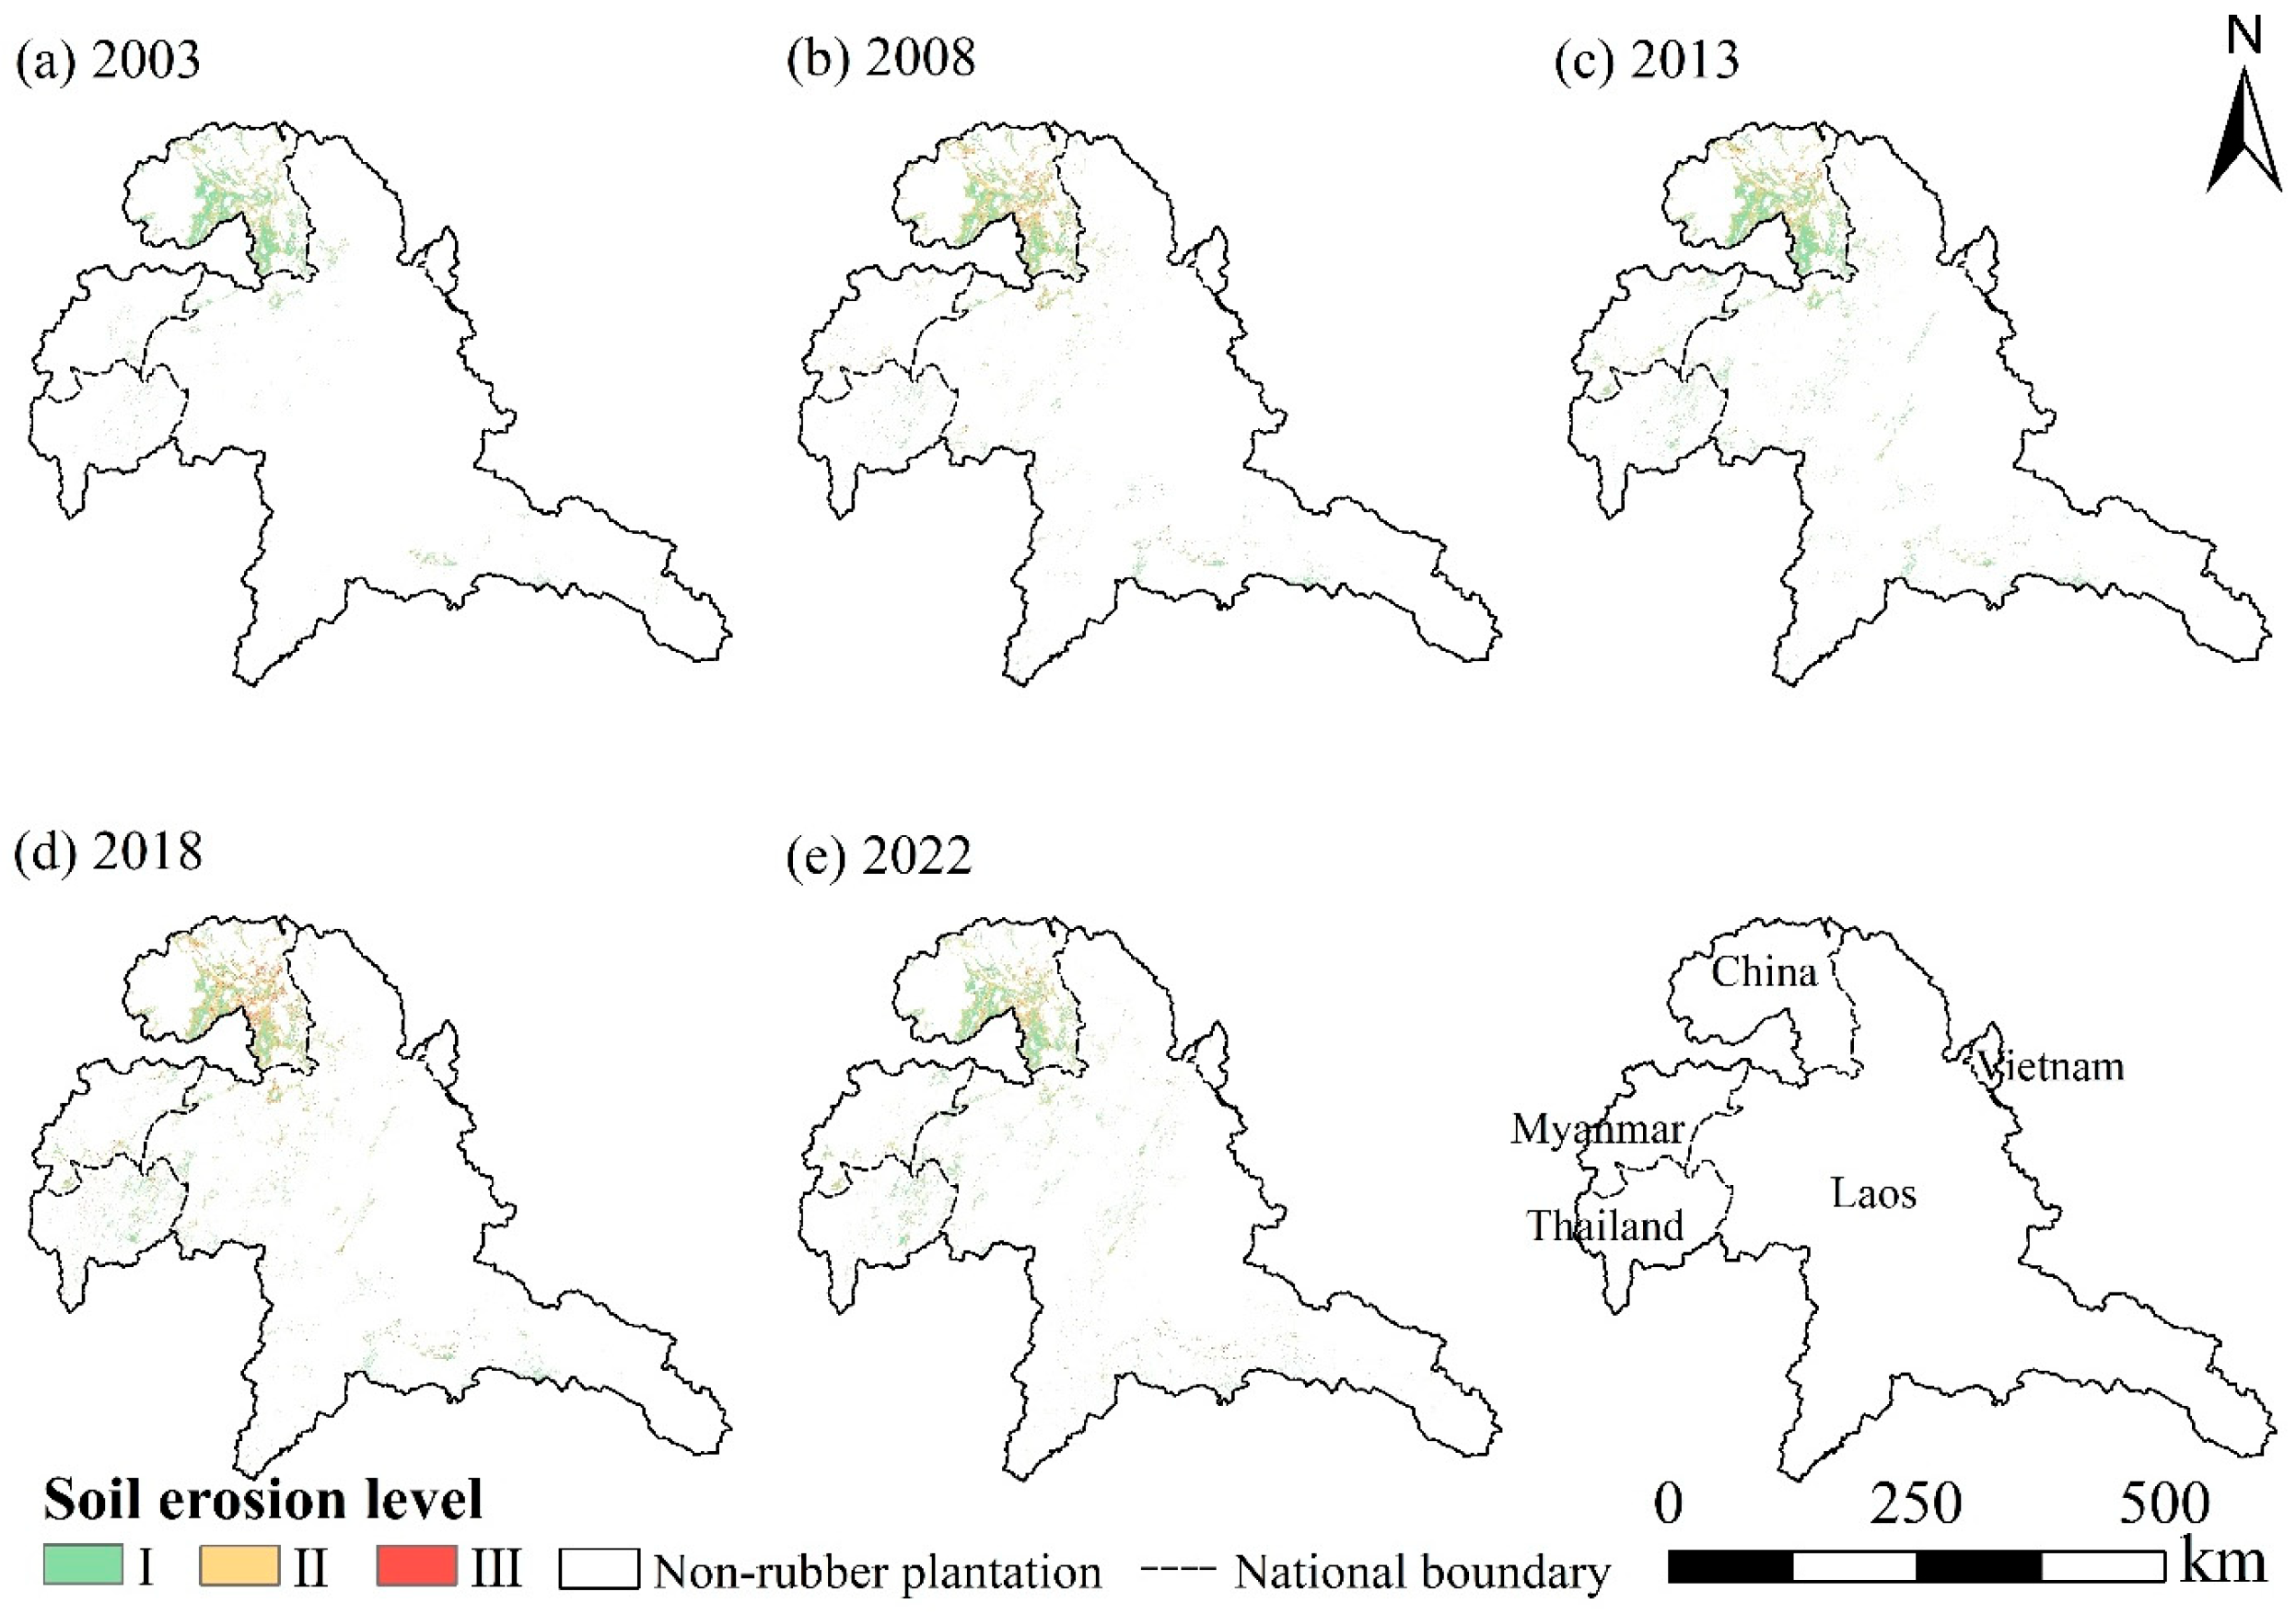
4.2. Soil Erosion in Rubber Plantations

Our results show that the R factor varies greatly, ranging from 64.427 to 741.010 MJ·mm·ha−1·h−1·yr−1 (Figure 4). Overall, the R factor remains at a high level as the study area belongs to a typical tropical monsoon climate with abundant annual rainfall. The regional averages for the years 2003, 2008, 2013, 2018, and 2022 are 264.056, 327.567, 276.727, 333.245, and 320.194 MJ·mm·ha−1·h−1·yr−1, respectively. Standard deviations of R for the five periods are 69.278, 87.118, 86.453, 64.804, and 97.342, indicating that the regional precipitation distribution is more uneven in 2008, 2013, and 2022. Spatially, the R factor generally remains high in the southern region over the 20 years. The CP factor ranges from 0.001 to 0.250, with high values mainly concentrated in the western part of the study area. The regional averages for the five periods are 0.013, 0.014, 0.015, 0.016, and 0.021. The corresponding standard deviations are 0.051, 0.051, 0.054, 0.055, and 0.061, indicating that its spatial distribution pattern is relatively similar in 2003, 2008, 2013, and 2018, while there is a larger spatial fluctuation in 2022. The K factor ranges from 0.010 to 0.020 t·ha·h·ha−1·MJ−1·mm−1, with a regional average of 0.015 t·ha·h·ha−1·MJ−1·mm−1 and a standard deviation of 0.010. This suggests that the soils in the study area exhibit relatively strong resistance to erosion, indicating that there is little variation across the region. The LS factor ranges from 0.030 to 144.594, with a regional average of 7.607 and a standard deviation of 5.047. This indicates that the terrain within the region is highly variable and exhibits significant spatial heterogeneity.
Spatially, soil erosion in the rubber plantation of the study area exhibits a fluctuating pattern, showing mitigation (2003–2008), aggravation (2008–2013), mitigation (2013–2018), and then aggravation again (2018–2022). The total soil erosion volumes in rubber plantations are 41.370 × 10⁴, 70.202 × 10⁴, 64.905 × 10⁴, 89.731 × 10⁴, and 65.130 × 10⁴ t in 2003, 2008, 2013, 2018, and 2022, respectively. The soil erosion of rubber plantations fluctuates with years (Figure 5), mainly ranging from 0.100 to 1.800 t·ha−1·yr−1. The median soil erosion intensities of rubber plantations in the study area are as follows: 0.679 in 2003; 0.884 in 2008; 0.714 in 2013; 0.943 in 2018; and 0.795 in 2022. These values indicate a fluctuating trend, with the lowest erosion intensity recorded in 2003 and the highest in 2018. The corresponding standard deviations are 0.464, 0.644, 0.543, 0.711, and 0.606. The minimum standard deviation in 2003 indicates a more concentrated distribution of erosion intensity, while the maximum value in 2018 suggests greater spatial variability during that year. The average soil erosion (Figure 6) figures for the years 2003, 2008, 2013, 2018, and 2022 are 0.726, 0.957, 0.780, 1.020, and 0.871 t·ha−1·yr−1, respectively. In 2003, soil erosion of rubber plantation is still mild, but by 2018, it has become the most severe, with a very uneven spatial distribution. Spatially, the high soil erosion of rubber plantations is mainly concentrated in the northern part of the study area, especially in the central and southern areas of Xishuangbanna. In contrast, rubber plantations in the central and western parts of the study area experienced lighter soil erosion.

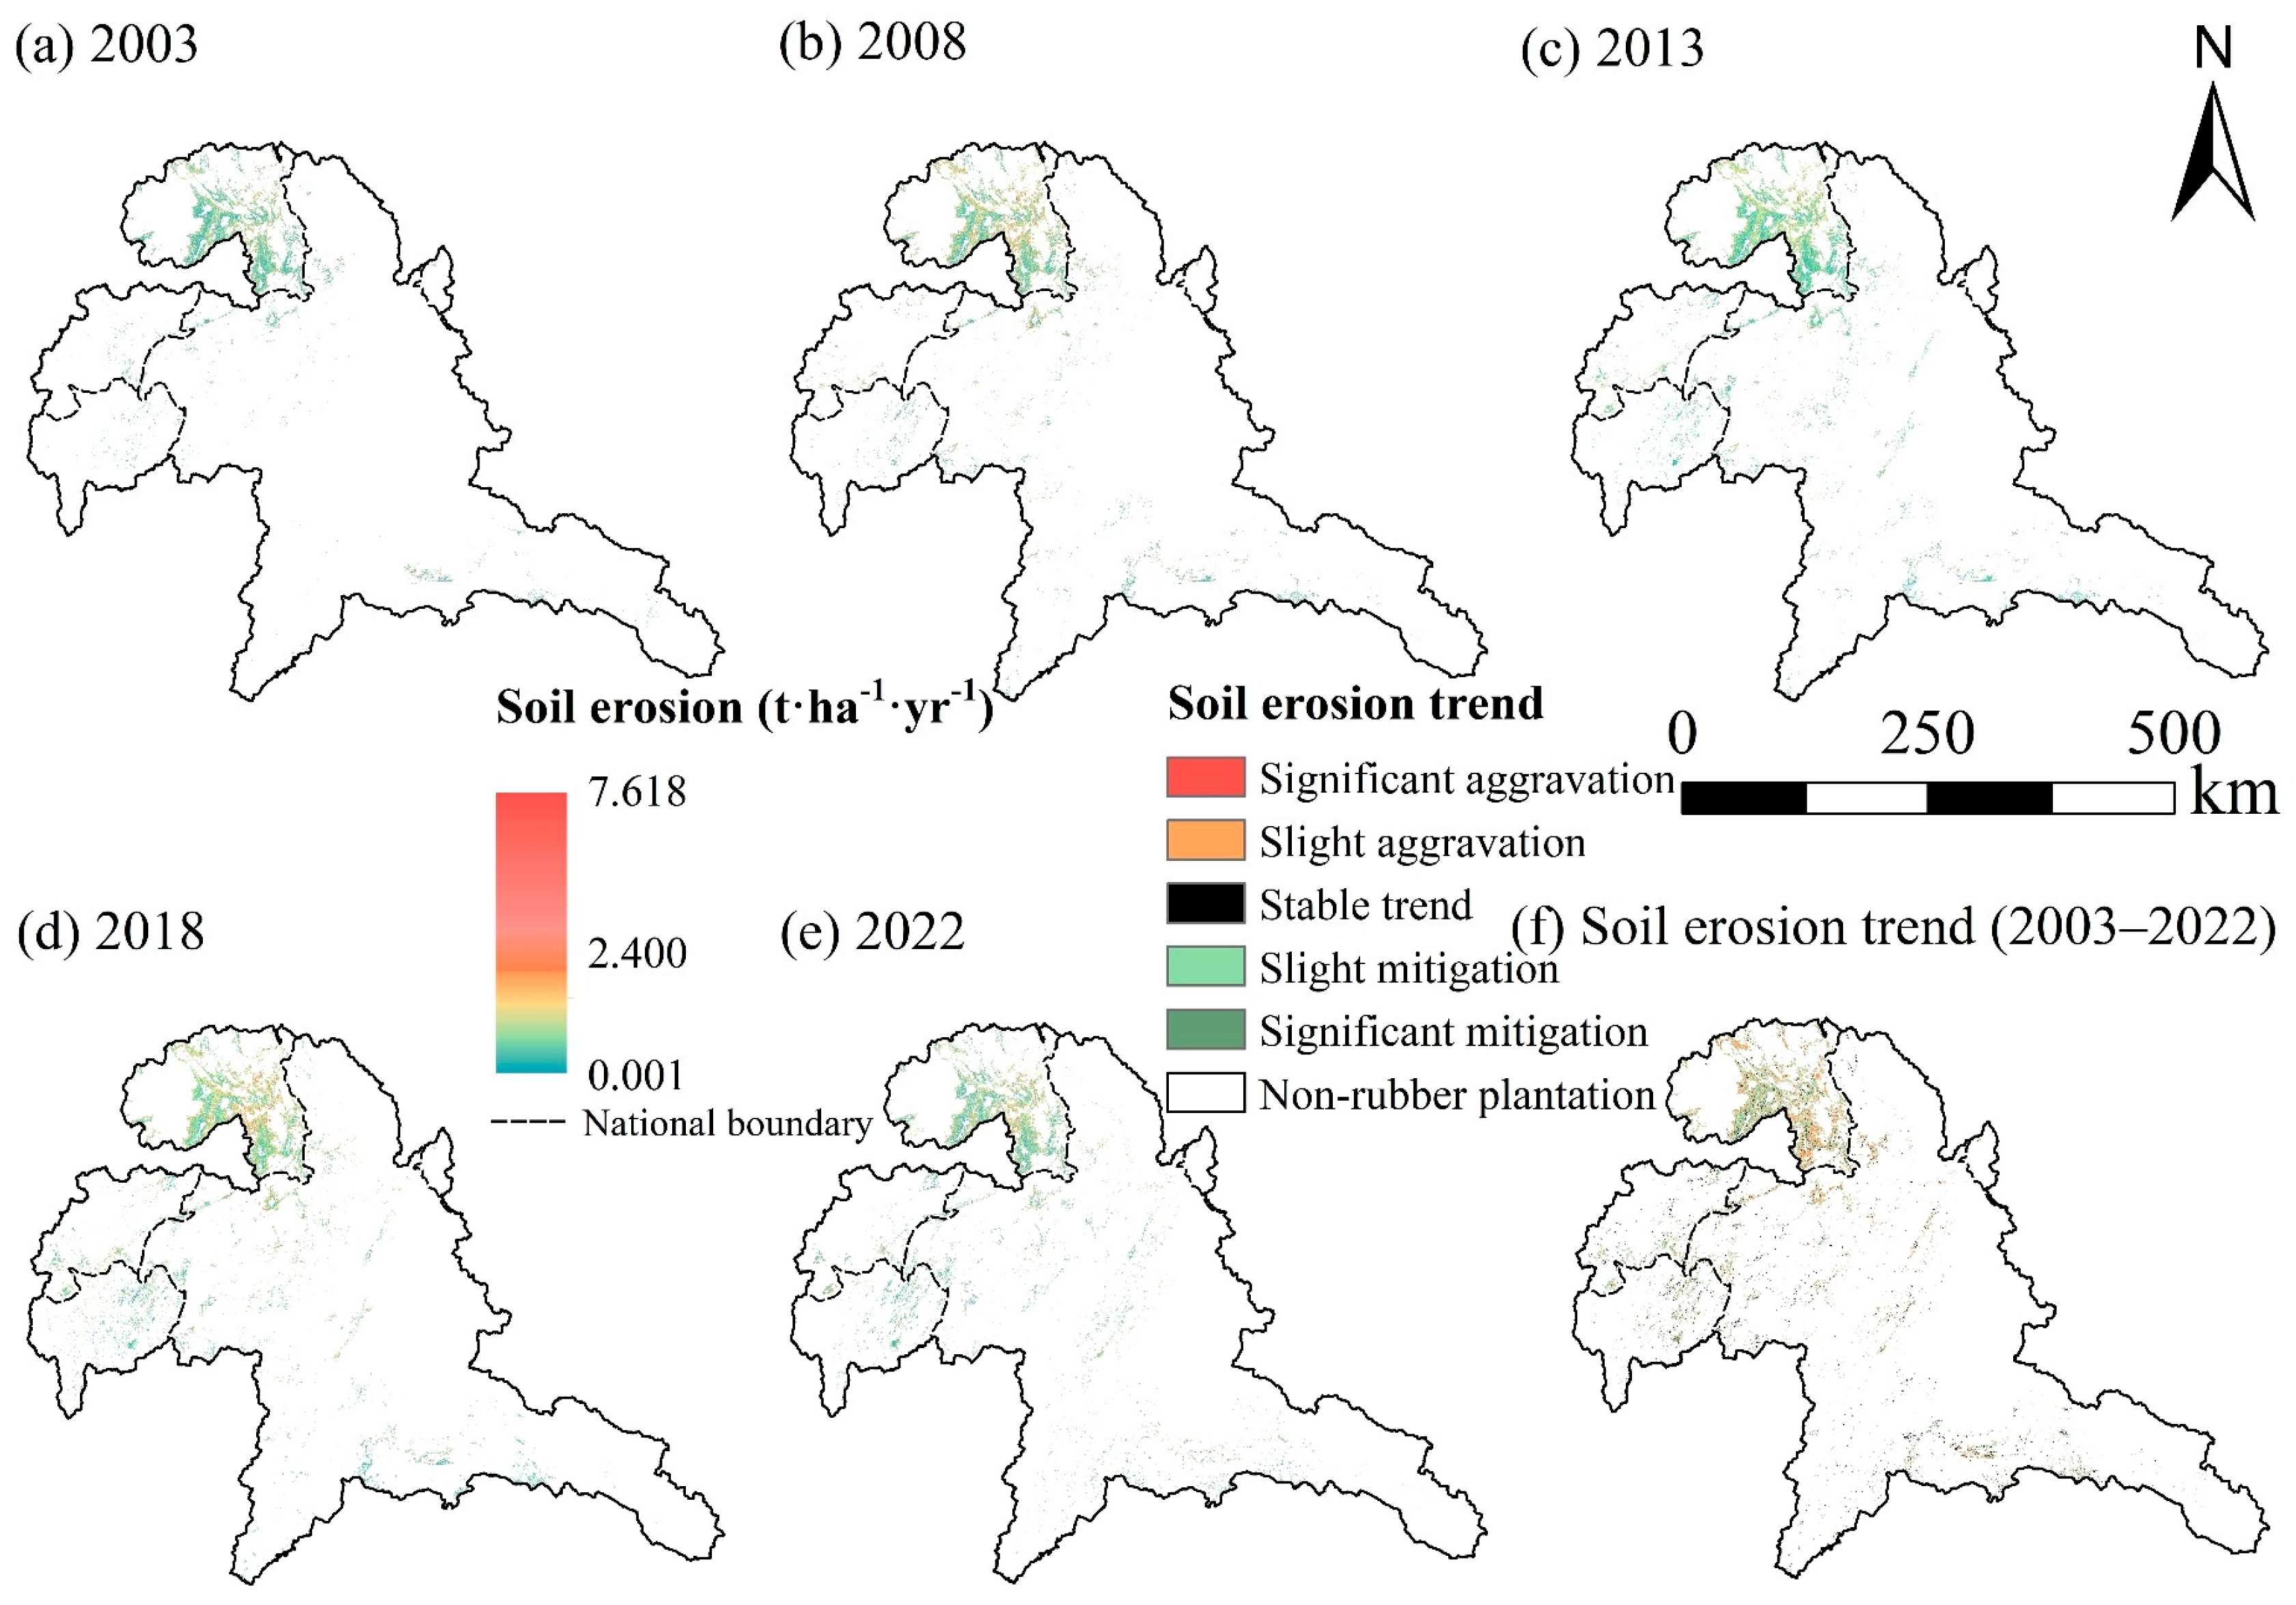
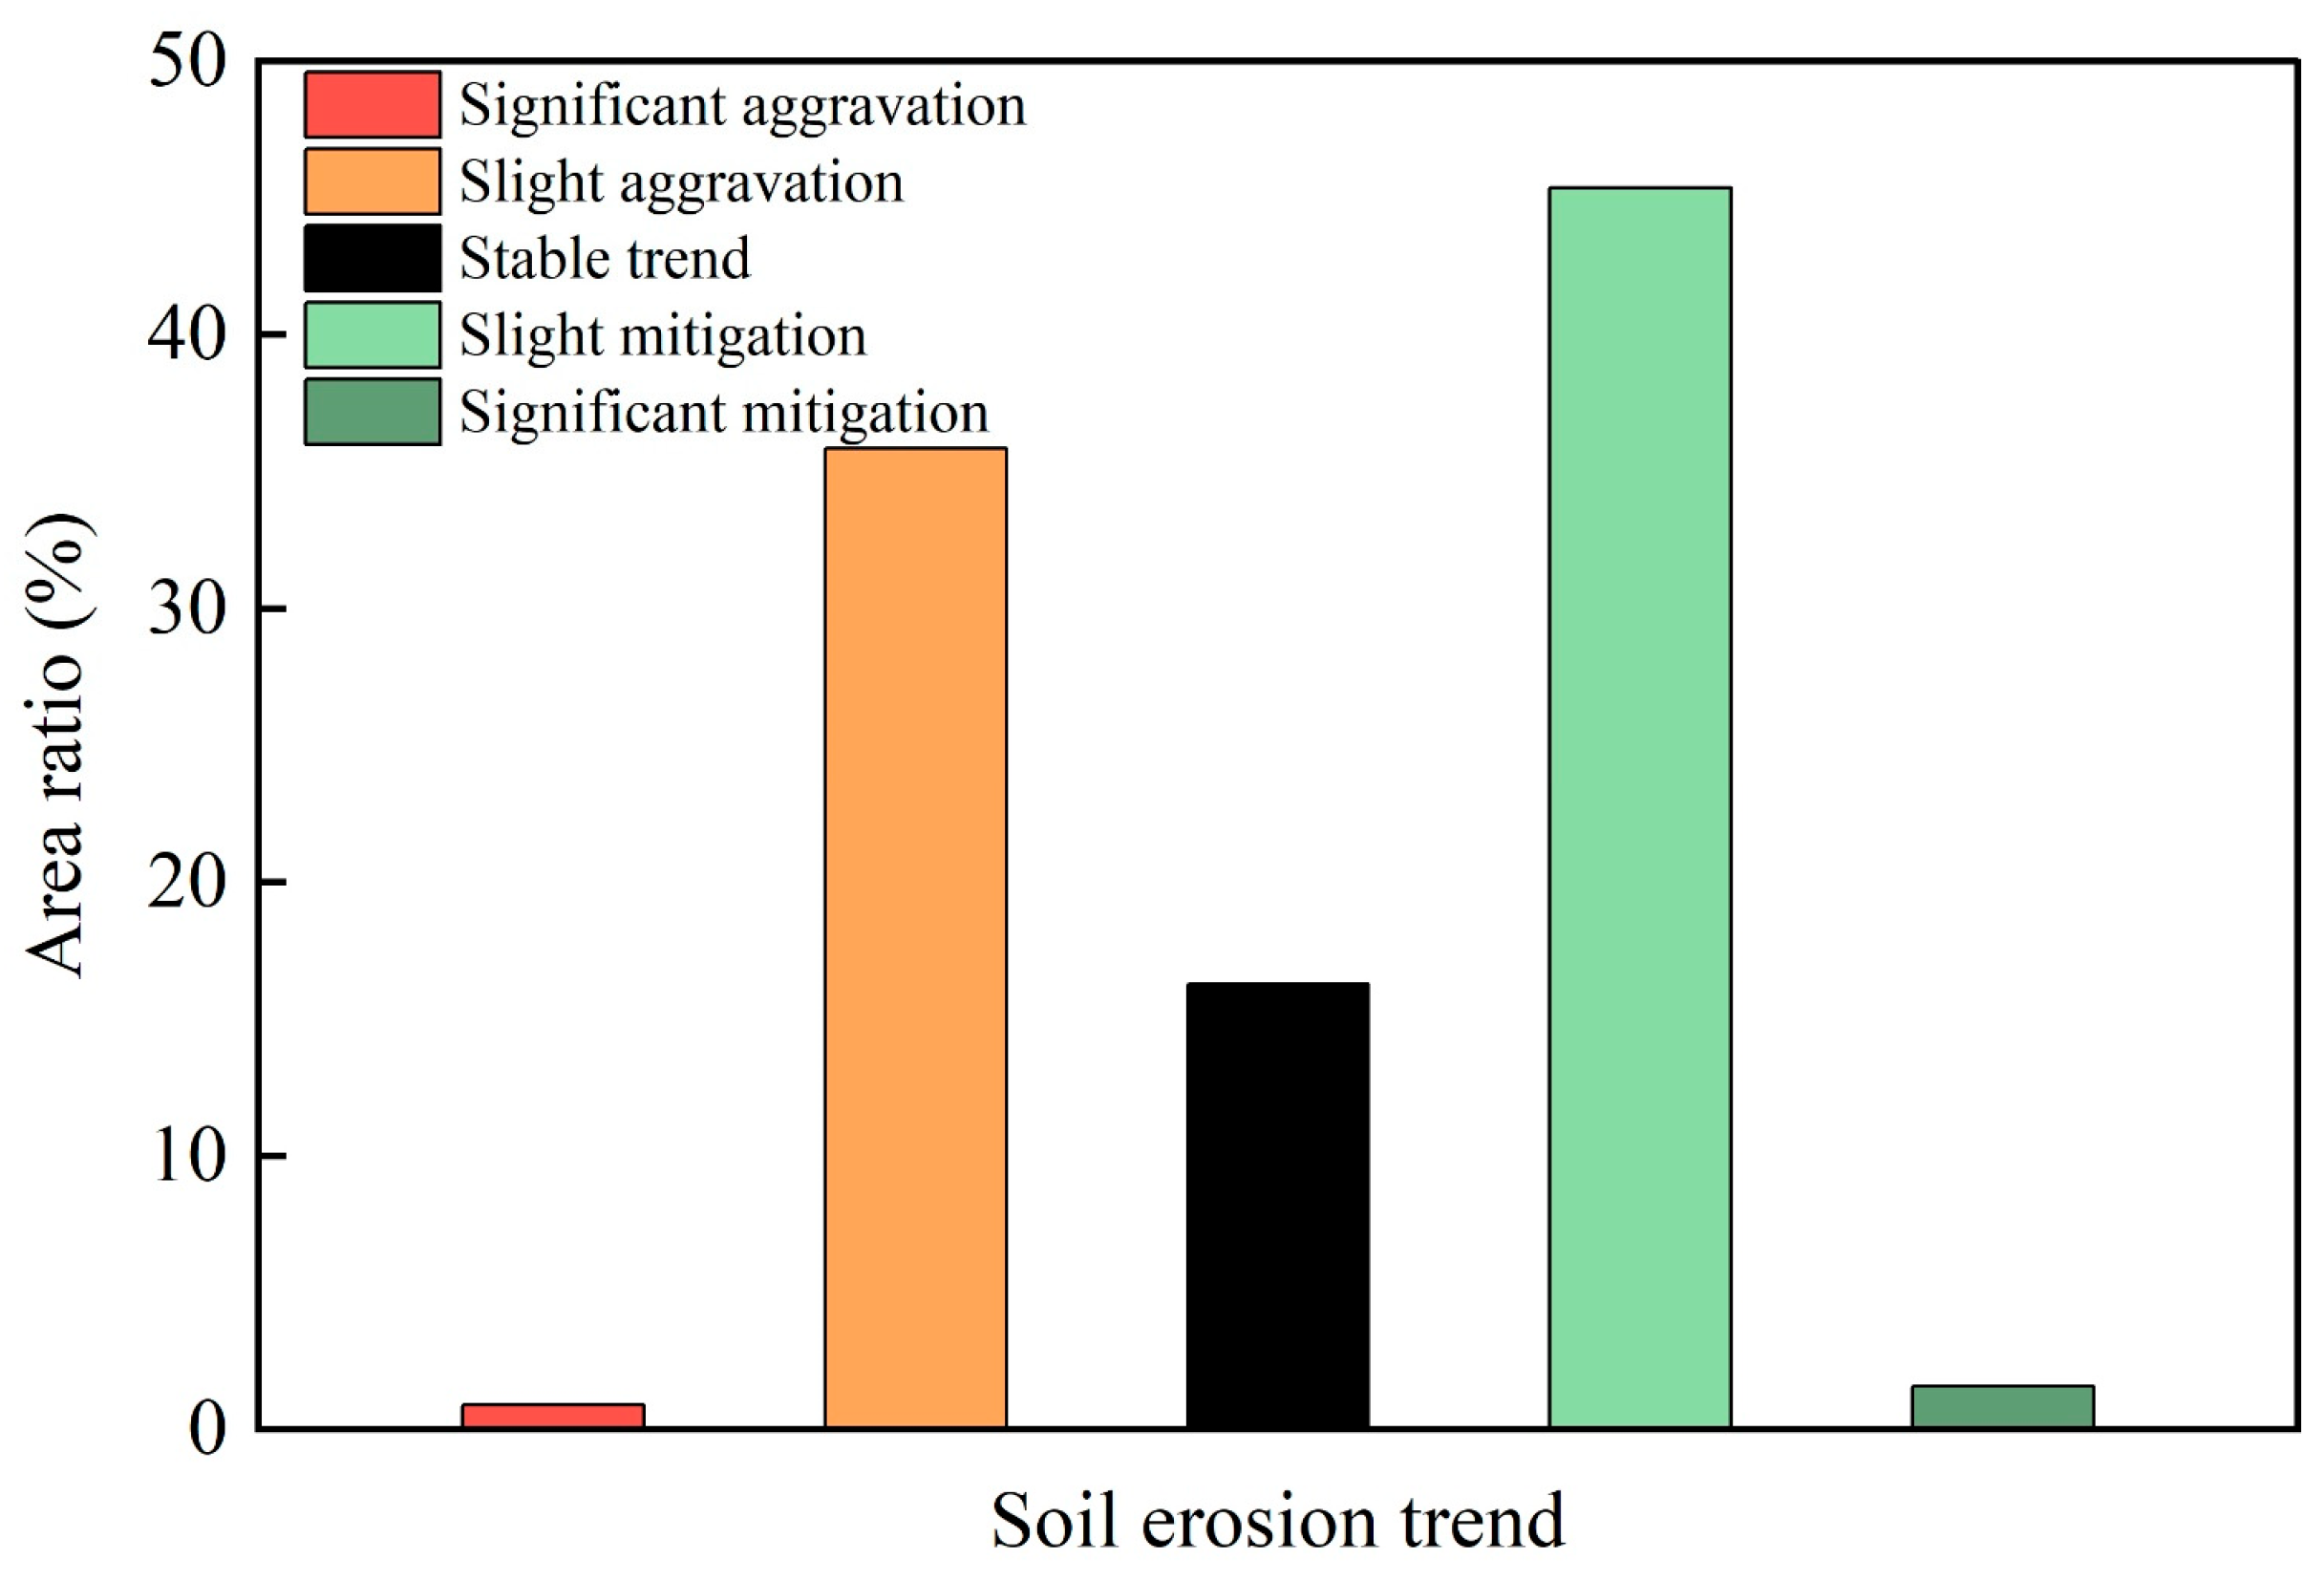
4.3. Temporal and Spatial Variation Trend of Soil Erosion in Rubber Plantations

Over the past 20 years, soil erosion has exhibited both slight aggravation and slight mitigation trends. Most areas with increased erosion are concentrated in the northern and central parts of the study region (Figure 6f). Specifically, areas showing slight aggravation account for 35.859%, while those experiencing slight mitigation make up 45.377% (Figure 7). The observed mitigation in certain regions is mainly attributed to the high proportion of mature rubber trees (over 20 years old), which contribute to improved ground cover and soil stability. In contrast, the slight aggravation is largely due to the large-scale establishment of new rubber plantations over the past two decades. Notably, areas with significant aggravation represent the smallest proportion, at only 0.905%. Areas with significant improvement slightly exceed this, accounting for 1.583%. The proportion of areas with a stable trend is 16.276%.
The spatial distribution of soil erosion levels also indicates that soil erosion in rubber plantation areas has followed a fluctuating pattern over the past 20 years, exhibiting a trend of initial aggravation, followed by mitigation, then a second phase of aggravation, and finally, mitigation once again (Figure 8). Spatially, soil erosion in the northern region gradually intensified, making it the most severely affected area across all years, particularly in 2008 and 2018. However, a significant mitigation effect is observed after 2018. The western and central areas, by contrast, show a clear trend of mitigation from 2003 to 2022, marked by an increasing proportion of Level I erosion.
In 2003, Level I is predominantly distributed throughout the entire region, with Levels II and III together accounting for less than 26% of the area, indicating a slight soil erosion condition of the entire region. Levels II and III are primarily distributed in the Chinese part of the study area, whereas the regions located in Myanmar, Thailand, Vietnam, and Laos are predominantly characterized by Level I. In 2008, the area of Levels II and III significantly increased, especially in China’s mountainous areas (Figure 8). The newly added Level II mainly originated from Level I and the newly added Level III mainly originated from Level II, with the converted rates of 15.301% and 3.071%, respectively (Figure 9 and Figure 10). In 2013, Level I erosion area increased substantially compared to 2008, rising by 12.288%, particularly in the China and Myanmar regions (Figure 8). This increase is largely due to conversions from Level II to Level I (11.642%) and from Level III to Level II (3.647%) (Figure 9 and Figure 10).
By 2018, soil erosion in rubber plantation worsened again. The combined area of Level II and III erosion reached 46.915% (Figure 8). Based on our analysis, the areas with worsened soil erosion are predominantly distributed in China and Laos. Most of the newly added Level II area came from Level I, while Level III originated mainly from Level II, with conversion rates of 16.773% and 6.411%, respectively (Figure 9 and Figure 10).
In 2022, a significant increase in Level I area is observed, especially in mountainous regions in China and Myanmar (Figure 8). The increase in Level I is mainly due to conversions from Level II (12.946%), and the new Level II areas are primarily converted from Level III (5.060%) (Figure 9 and Figure 10). When comparing 2003 and 2022, the overall area proportions of Level II and III have increased. The new Level II areas mainly originated from Level I, while Level III came from Level II, with respective conversion rates of 7.834% and 1.123% (Figure 9 and Figure 10).
Significant spatial heterogeneity in the plantation age can be observed in the study region (Figure 11a), with aging rubber plantations mainly distributed in the northern areas (accounting for 45.631% of the total area), while younger plantations are primarily located in the south. Soil erosion exhibits a trend of decreasing, then increasing, and subsequently decreasing again with increasing plantation age (Figure 11b). The average soil erosion is 0.939 t·ha−1·yr−1 for plantations less than 5 years old. It decreases to 0.765 and 0.693 t·ha−1·yr−1 for plantations aged 5–10 and 10–15 years, respectively. Erosion then rises to 1.017 t·ha−1·yr−1 for plantations aged 15–20 years, before decreasing again to 0.854 t·ha−1·yr−1 for those aged 20 years and above.

4.4. Soil Erosion Caused by Rubber Plantation Expansion

A comparison of spatial patterns between soil erosion under expansion and non-expansion scenarios indicates that rubber plantation expansion has led to overall aggravation of soil erosion in the study region (Figure 12), with an average increase of 0.754 t·ha−1·yr−1 from 2003 to 2022 (Table 3). During the initial phase of expansion (2003–2008), when rubber plantations are within 5 years of establishment, soil erosion under the expansion scenario is approximately 3.42 times greater than that under the non-expansion scenario (Table 3). By 2022, this difference had risen to 6.09 times, reflecting significantly aggravated soil erosion (Figure 12) and an increase of approximately 509.459% in erosion over the 20-year period (Table 3). In other periods, soil erosion under the expansion scenario remained relatively stable, ranging from 0.9 to 1 t·ha−1·yr−1, except for the 2008–2013 period, when it dropped to 0.606 t·ha−1·yr−1. Despite this, erosion under the expansion scenario consistently remained three to four times higher than in the non-expansion scenario. Specifically, during the periods 2003–2008, 2008–2013, 2013–2018, and 2018–2022, soil erosion under the expansion scenario increased by 342.060%, 405.000%, 304.979%, and 362.255%, respectively, compared to the non-expansion scenario.
Notably, the lower soil erosion observed during 2008–2013 is primarily due to the expansion of rubber plantations into relatively flat terrain during that period. The most severe increase in soil erosion—509.459%—is caused by plantations established in 2003, which had matured over 20 years by 2022. This finding aligns with our observation that rubber plantations aged 15–20 years are most susceptible to severe soil erosion.

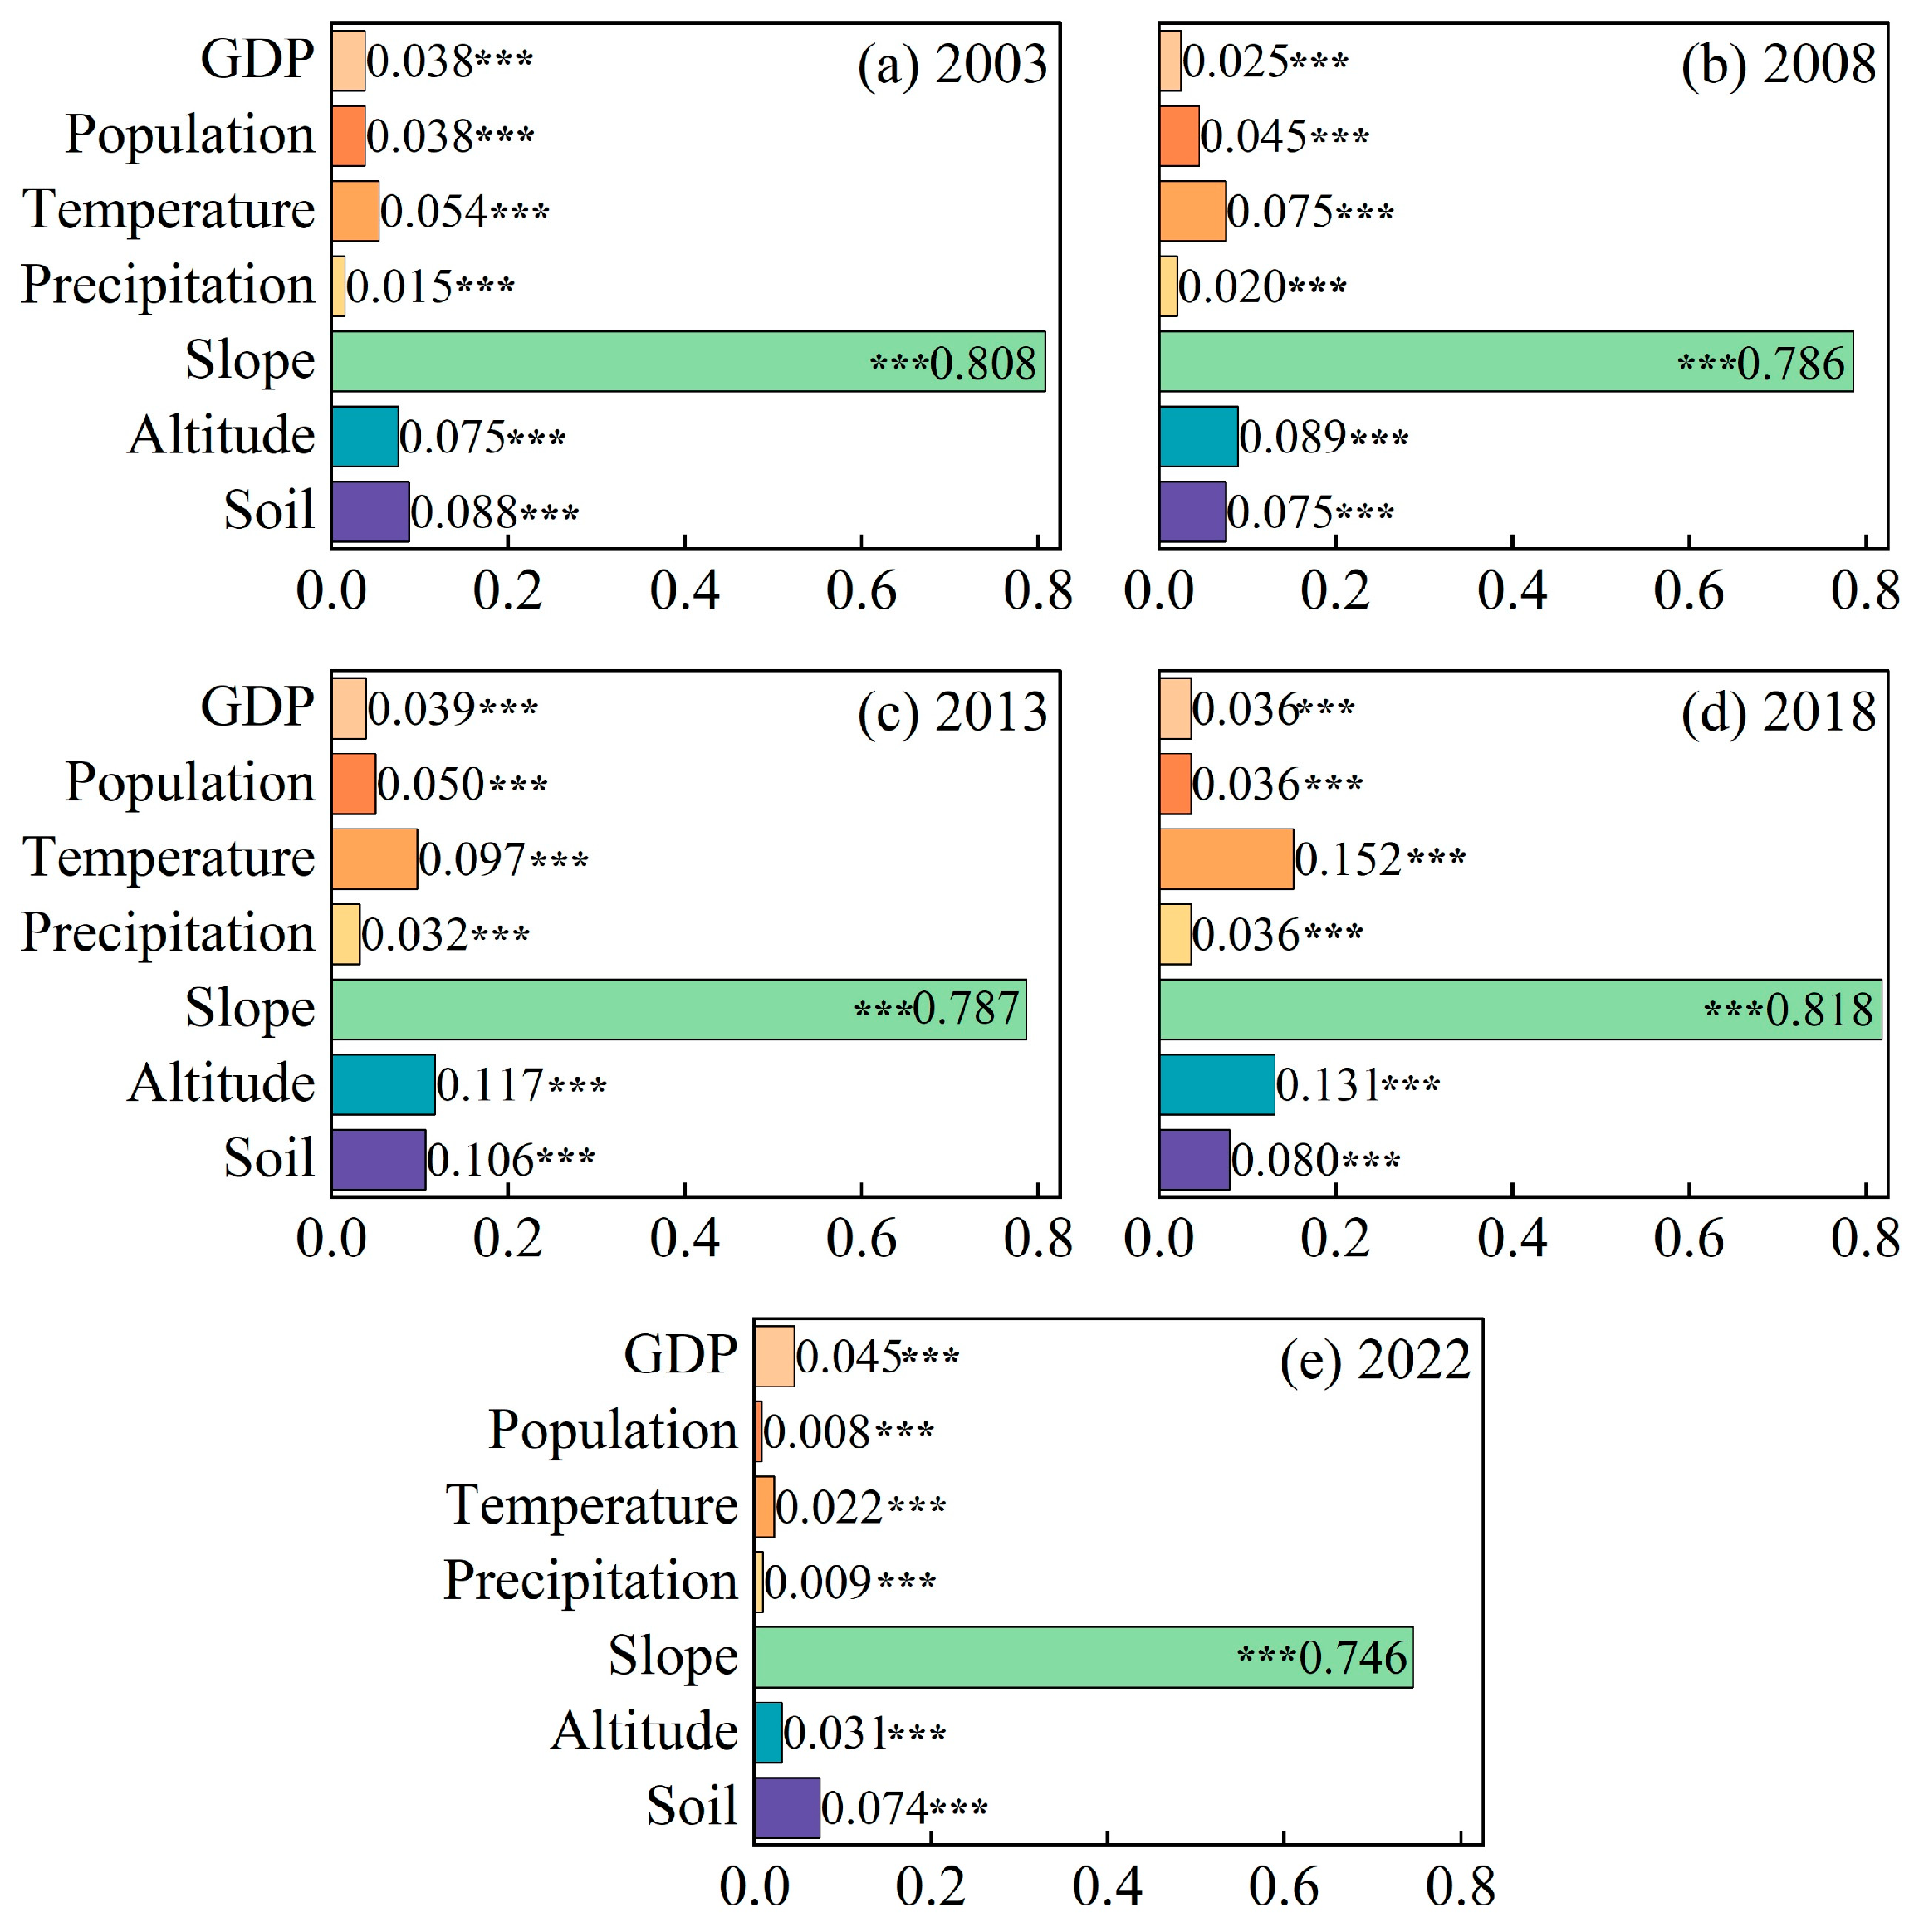
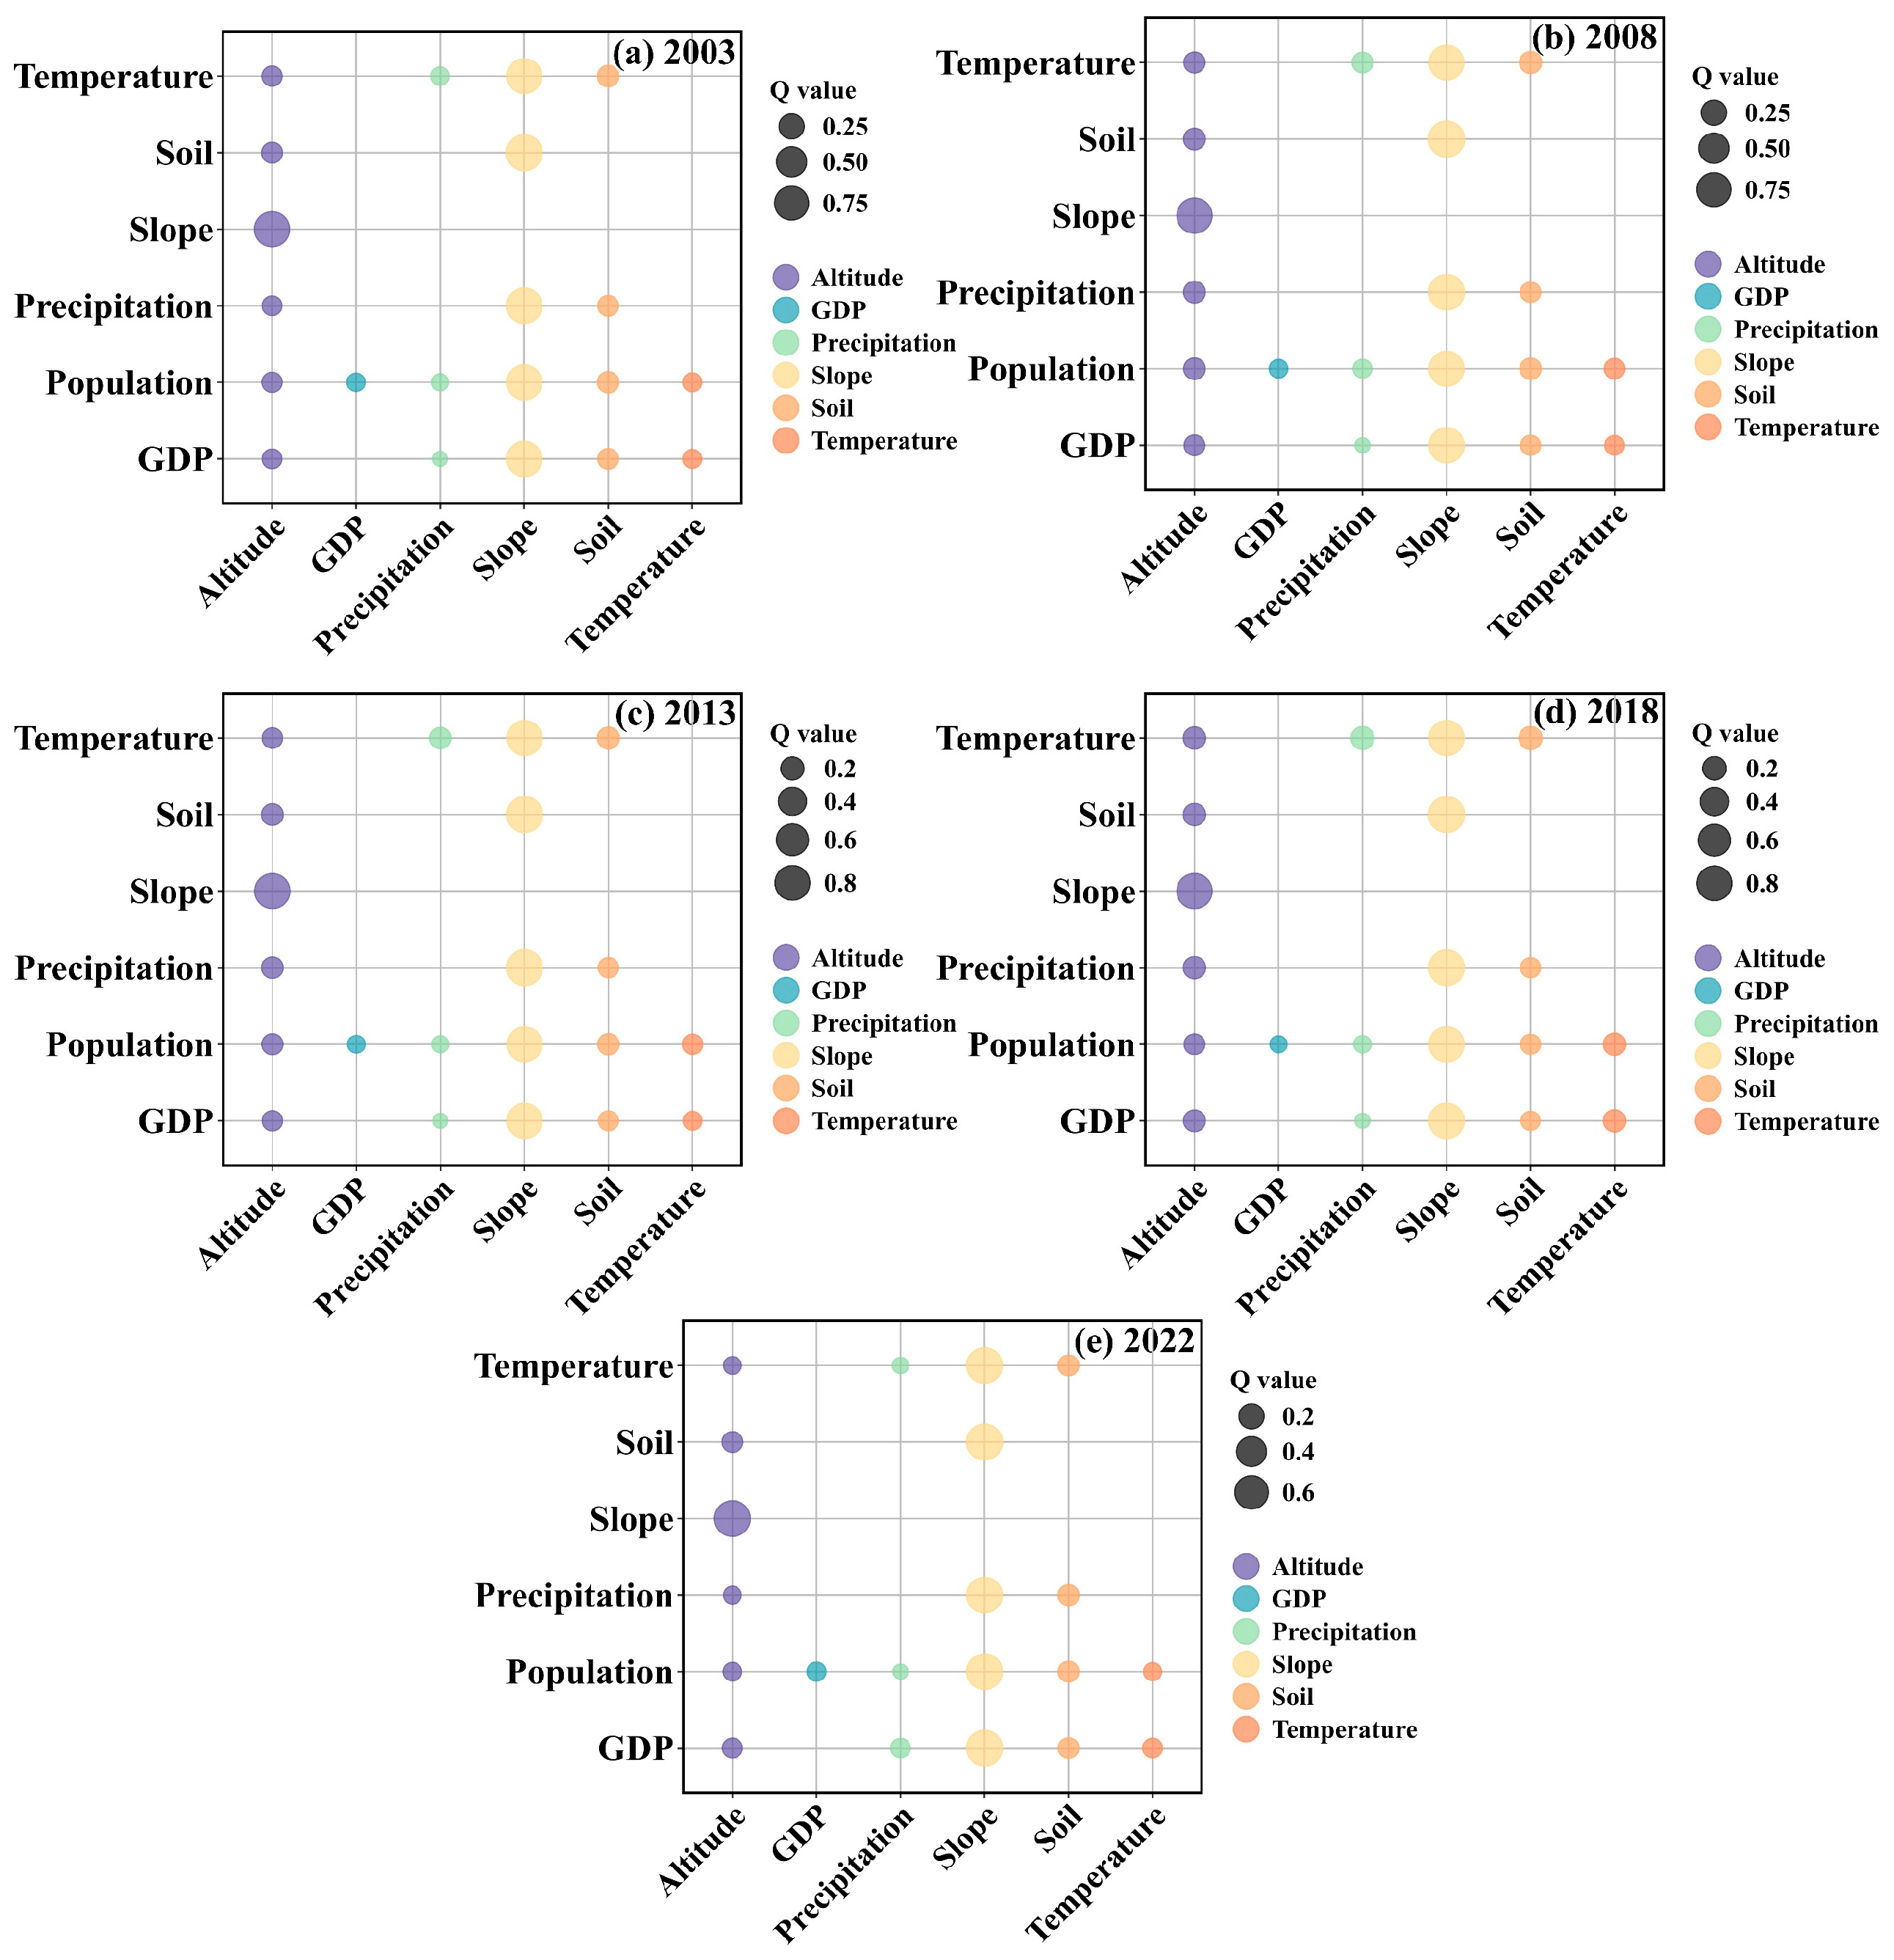
4.5. Driving Factor Analysis

The factor detection results (Figure 13) show that all selected potential influencing factors significantly affected soil erosion in rubber plantations (p < 0.01), with slope consistently identified as the most critical explanatory variable across all years. Specifically, the Q value of slope ranged between 0.746 and 0.818, reflecting substantially stronger explanatory power than any other factors. Moreover, the explanatory contribution of climatic factors (temperature and precipitation) increased over time, with temperature becoming notably more influential after 2013. In contrast, anthropogenic factors such as GDP and population consistently exhibited relatively low explanatory power. Additionally, the influence of altitude and soil type remained relatively stable in earlier years but became more pronounced after 2013.
The factor interaction analysis (Figure 14) shows that the interactions between slope and other factors had a significant effect on soil erosion, particularly the interaction between slope and soil type. Although GDP alone showed limited explanatory power, its interaction with slope ranked among the top factors influencing soil erosion. Specifically, in 2003, 2008, 2013, and 2018, the top three interaction terms with the highest explanatory power are slope and soil type, slope and precipitation, and slope and GDP.

5. Discussions

5.1. Soil Erosion Under the Background of Rubber Plantation Expansion

Over the past 20 years, the growing international demand for natural rubber has led to the replacement of large areas of primary and secondary forests in the study region with rubber plantations [51]. The higher soil erosion observed in rubber plantations compared to natural forests can be attributed to several factors: First, rubber plantations generally have larger canopy gaps compared to primary forests, with weaker canopy interception, which makes them more susceptible to soil erosion under intensified rainfall conditions [52]. Second, due to a thinner litter layer [53] and lower ground vegetation cover [54], more soil is exposed, significantly increasing the risk of soil erosion [55]. Third, the establishment of rubber plantations often involves the use of heavy machinery, which can severely disrupt soil structure, resulting in increased surface runoff during the rainy season and consequently accelerating soil erosion [56]. Fourth, during the tapping season, large numbers of rubber farmers enter the plantation for tapping operations, and such frequent human activity leads to increased trampling and compaction [57], thereby disrupting the soil structure. In addition, the harvested latex is transported to processing facilities using small or large vehicles or machinery, which further exacerbates soil disturbance [58]. As a result, when the rainy season arrives, the combination of prior disturbance and heavy rainfall significantly increases the risk of soil erosion. Fifth, previous research suggests that plantation ecosystems often have higher water consumption, potentially causing a soil moisture deficit, and making the soil more prone to erosion in prolonged drought conditions [59]. Sixth, in the early stages of establishment, plantations have weaker water retention and soil stabilization capacities [60], making them more prone to soil erosion than primary forests.
The vast expansion of rubber plantations is driven by the growing demand for natural rubber [61]. This normally happens before the period 2015–2016. In the study region, the expansion of rubber plantations is greatest between 2003 and 2008, particularly in the northern part, Xishuangbanna. Rubber plantations continue to expand in the western, northern, and central areas after 2008. Since the expansion of rubber plantations has primarily occurred at the cost of the deforestation of natural forest—and natural forest experiences significantly less soil erosion compared to rubber plantation [62] —the expansion has led to a substantial increase in soil erosion. However, it is also worth noting that farmers’ willingness to plant rubber plantations has decreased in recent years due to the drop in rubber prices. Farmers have also reduced their management practices for rubber plantations, such as weeding and fertilization, and in some cases have even stopped these practices altogether. This has led to a significant improvement in the understory and soil environment, causing a marked mitigation of soil erosion in recent years (2018–2022) [63].
From 2003 to 2022, soil erosion in rubber plantations primarily exhibited slight aggravation and slight mitigation trends. Some 45.377% of the area slight mitigation, which is higher than the area with slight aggravation (35.859%). By analyzing the impact of rubber plantation expansion on soil erosion, we find that the expansion significantly increases soil erosion in the early stages (within 5 years) by approximately 3.5 times. In the long term (20 years), the soil erosion caused by rubber plantation expansion increases by approximately 5 times.
Soil erosion varies according to the age of rubber plantations. In the first 15 years after planting, as the trees grow and the canopy gradually closes, the soil conservation capacity gradually improves, and soil erosion mitigates. Panklang et al. (2022) reported that rubber plantations entering maturity (after 6 years) tend to exhibit an increased risk of soil erosion [62]. Similarly, Liu et al. (2018) found that mid-aged rubber plantations (between 12 and 18 years old) exhibited the most severe soil erosion [31]. This study shows an increase in soil erosion for 15–20-year-old rubber plantations. This may be due to the following reasons: first, rubber tapping typically begins in the 7th to 9th year, after which fertilizer use increases, potentially polluting the soil and altering its properties. These changes can break down soil aggregates, compact the soil, and reduce water infiltration, thereby increasing the risk of erosion [13]. Second, tapping leads to frequent human activity, increasing soil trampling and disturbing the soil and loose materials, which exacerbates soil erosion [64]. Moreover, rubber tapping increases water consumption in rubber plantations [65], exacerbating soil drought, and prolonged drought conditions make the soil more susceptible to erosion during the rainy season [59].
As a typical artificial economic forest, rubber plantations are closely related to human activities. However, our factor analysis results indicate that soil erosion in rubber plantations is mainly influenced by natural factors, especially slope, with human factors having a smaller impact. First, rubber plantations have gradually expanded into areas with higher elevations, steeper slopes, lower vegetation cover, and higher precipitation [66], where soil erosion is more likely to occur. This explains the strong influence of topographic factors in our analysis. The uncertainty in the contribution of human factors to soil erosion may stem from the GDP data derived from nighttime light imagery, which limits their ability to capture the economic dynamics specifically associated with rubber plantation expansion. In addition, rubber plantation management involves complex human activities such as tapping, fertilizing, and weeding [67], which cannot be fully represented by general population statistics. In future work, we plan to explore the use of institutional statistics (e.g., harvested rubber area) to better quantify the management intensity of rubber plantations. This substitution inevitably introduces some uncertainty concerning the results of the driving factor analysis. Lastly, given the substantial differences in the socioeconomic and environmental contexts across the countries, and the limitations in data availability, we are currently unable to clearly explain the drivers of spatial heterogeneity in soil erosion across rubber plantations.

5.2. Comparison with Existing Studies

A comparison of our results with previous research in Xishuangbanna, China, indicates that the estimated soil erosion of rubber plantations in this study falls within a reasonable range (Table 4). Nevertheless, the lower bound in our study is 0.003 t·ha−1·yr−1, while in other studies it is much larger, reaching as much as 0.330 t·ha−1·yr−1. This difference may lie in the limitations of the empirical formula for calculating the R factor. In relatively arid years [68], when monthly precipitation remains below a certain threshold for several consecutive months, the R-value will be at a lower level. On the other hand, the highest soil erosion in rubber plantations calculated in our study is 6.917 t·ha−1·yr−1, which is significantly higher than the highest recorded value (4.730 t·ha−1·yr−1) in previous studies. This difference may arise because existing studies are often conducted using small-scale site data, with limited variations in forest age and slope, whereas this study is conducted on a large scale, covering various slopes and forest ages. When compared with the site-based experimental results reported by Neyret et al. (2020) [69] in the steep mountainous regions of northern Thailand, the measured soil erosion in young plantations was 3.6 t·ha−1·yr−1, which falls within the range estimated by our model (0.021–4.767 t·ha−1·yr−1). However, the reported soil erosion in mature rubber plantations reached as high as 57 t·ha−1·yr−1, far exceeding our model estimates. This indicates that while the model can effectively estimate soil erosion potential at broader spatial scales, such estimates may serve as reference values but remain difficult to align precisely with ground-based measurements at specific sites.

5.3. Limitation Analysis and Outlook

Limitations may stem from the following aspects in this study. First, the CP value may be overestimated in mature rubber plantation. Although the calculation of the CP factor for rubber plantations is improved by using FVC, the saturation problem of NDVI still exists [71], and it may lead to an overestimation of the CP factor for mature rubber plantations when using the NDVI pixel-based binary model to calculate FVC, which in turn results in an overestimation of soil erosion. Second, uncertainties also arise from the input data. The soil data used in the study are relatively coarse (1 km) for regions outside China and may not accurately reflect the actual soil erodibility of the local area. The precipitation data were derived from meteorological sources with relatively coarse spatial resolution (0.05°), whereas the model was run at a spatial resolution of 30 m. The integration of datasets with differing spatial resolutions introduces additional uncertainty into the model inputs. Furthermore, as topographic effects were not explicitly considered during the integration of input data, this may have led to spatial smoothing of the modeled erosion intensity, thereby limiting the model’s ability to capture the true spatial heterogeneity of erosion risk (especially in mountainous areas). Third, rubber plantations are difficult to accurately identify in Landsat imagery during their early planting stages [72], which may lead to newly planted rubber plantations not being identified in time, introducing uncertainty into the estimation of soil erosion. Fourth, while the Mann–Kendall method was used to assess erosion trends in rubber plantations, it does not account for seasonal or cyclical variability (e.g., ENSO events and interannual rainfall anomalies), which may obscure actual trend patterns. In addition, the influence of nonlinear and periodic climatic disturbances common in tropical systems was not controlled, potentially biasing the interpretation of trend results. Finally, the uncertainty could also come from RUSLE model. The RUSLE model only considers annual soil loss caused by sheet erosion, inter-rill erosion, and rill erosion, and ignores wind erosion or some additional erosion caused by human activities, which may underestimate the total amount of soil erosion [73]. Moreover, the RUSLE model has inherent limitations in capturing seasonal variability and temporal changes in land management practices, making it unsuitable for dynamically simulating soil erosion at the regional scale. It is also not responsive to climate variability [74], such as extreme precipitation events or prolonged droughts. In addition, RUSLE does not represent specific erosion events but instead provides long-term average erosion estimates. The model was not specifically calibrated for tropical mountainous regions, which may introduce additional uncertainty in its application to such environments.
Future research should focus more on establishing a long-term soil erosion observation system for rubber plantations. Observational data are important in calibrating the uncertainty of key parameters such as CP. In addition, we plan to explore the use of less saturation-prone vegetation indices, such as the Enhanced Vegetation Index (EVI), to improve the estimation of the CP factor. Currently, the estimation of the rainfall erosivity factor (R) involves considerable uncertainty due to the generally low spatial resolution of available meteorological products. In the future, statistical downscaling methods based on deep learning, which incorporate various auxiliary factors, such as topography and vegetation, may provide meteorological data with a higher spatial resolution. This would help improve the accuracy of R-factor estimation. Lastly, improving the spatial resolution of soil data by incorporating environmental factors such as vegetation type, topography, and climate will also be an important direction for future advancements.

6. Conclusions

This study investigates the soil erosion in rubber plantations and its change derived by rubber plantation expansion in the central region of the Lancang-Mekong River Basin. The Universal Soil Loss Equation (RUSLE) model is modified to quantitatively evaluate the impact of rubber plantation expansion on soil erosion. The results of the study indicate that, over the past two decades, soil erosion in rubber plantations shows both slight aggravation (35.859%) and slight mitigation (45.377%). Soil erosion in rubber plantations of different ages shows significant differences, with soil erosion following a trend of decreasing, then increasing, and then decreasing again as the age of the plantation changes. Rubber plantation expansion has led to an overall soil erosion aggravation, with 0.754 t·ha−1·yr−1. Soil erosion in rubber plantations is most strongly influenced by slope, while the effect of climatic factors (e.g., temperature and precipitation) increases year by year. Interactions between slope and other factors consistently demonstrate strong explanatory power for soil erosion, especially slope and soil type.
Our study provides scientific evidence for the development of targeted soil and water conservation strategies within the Lancang-Mekong River Basin. Specifically, our findings can be directly applied to inform regional land-use planning and policymaking. By identifying areas with the erosion risk following forest-to-rubber conversion, our data offer a robust reference for establishing ecological protection redlines, optimizing environmental impact assessment protocols for new plantations, and ultimately fostering the sustainable development of the rubber industry in this vital watershed.
It is essential to note that the model’s inherent limitations may have contributed to an underestimation of soil erosion in rubber plantations in our findings. Additionally, the use of coarse-resolution soil and rainfall data, along with the constraints related to the CP factor, has introduced further uncertainties into the results. Future works should seek to optimize the CP factor for rubber plantations based on systematic plot observations. This will improve the accuracy of soil erosion estimation and lay the foundation for further research on soil erosion in rubber plantations.

Author Contributions

H.X.: Writing—original draft, Visualization, Validation, Software, Methodology, Investigation, Formal analysis, Conceptualization. T.D.P.: Visualization, Writing—review & editing. Q.W.: Supervision, Methodology. P.C.: Supervision, Methodology. D.L. (Dengsheng Lu): Supervision, Methodology. D.L. (Dengqiu Li): Supervision, Methodology. Y.C.: Writing—original draft, Supervision, Resources, Methodology, Investigation, Funding acquisition, Formal analysis, Conceptualization. All authors have read and agreed to the published version of the manuscript.

Funding

The authors thank the anonymous reviewers for their valuable comments and suggestions. This study is supported by the National Natural Science Foundation of China (grant number 42277450), and the Fujian Province Water Conservancy Science and Technology Project (MSK202430).

Data Availability Statement

The data presented in this study are available upon request from the corresponding author.

Conflicts of Interest

The authors declare no conflicts of interest.

References

  1. Guerra, C.A.; Rosa, I.M.D.; Valentini, E.; Wolf, F.; Filipponi, F.; Karger, D.N.; Nguyen Xuan, A.; Mathieu, J.; Lavelle, P.; Eisenhauer, N. Global vulnerability of soil ecosystems to erosion. Landsc Ecol. 2020, 35, 823–842. [Google Scholar] [CrossRef]
  2. Borrelli, P.; Robinson, D.A.; Panagos, P.; Lugato, E.; Yang, J.E.; Alewell, C.; Wuepper, D.; Montanarella, L.; Ballabio, C. Land use and climate change impacts on global soil erosion by water (2015–2070). Proc. Natl. Acad. Sci. USA 2020, 117, 21994–22001. [Google Scholar] [CrossRef]
  3. de Oliveira, M.L.; Dos Santos, C.A.C.; de Oliveira, G.; Perez-Marin, A.M.; Santos, C.A.G. Effects of human-induced land degradation on water and carbon fluxes in two different Brazilian dryland soil covers. Sci. Total Environ. 2021, 792, 148458. [Google Scholar] [CrossRef] [PubMed]
  4. Atoma, H.; Suryabhagavan, K.V.; Balakrishnan, M. Soil erosion assessment using RUSLE model and GIS in Huluka watershed, Central Ethiopia. Sust. Wat. Resour. Man. 2020, 6, 12. [Google Scholar] [CrossRef]
  5. Usman, K.; Deribew, K.T.; Alemu, G.; Hailu, S. Spatial modeling of soil loss as a response to land use-land cover change in Didessa sub-basin, the agricultural watershed of Ethiopia. Heliyon 2023, 9, e14590. [Google Scholar] [CrossRef] [PubMed]
  6. Zou, R.; Sultan, H.; Muse Muhamed, S.; Khan, M.N.; Liao, W.; Li, Q.; Cheng, S.; Tian, J.; Cao, Z.; Tao, Y. Sustainable integration of rubber plantations within agroforestry systems in China: Current research and future directions. Plant Sci. Today 2024, 11. [Google Scholar] [CrossRef]
  7. Singh, A.K.; Liu, W.; Zakari, S.; Wu, J.; Yang, B.; Jiang, X.J.; Zhu, X.; Zou, X.; Zhang, W.; Chen, C.; et al. A global review of rubber plantations: Impacts on ecosystem functions, mitigations, future directions, and policies for sustainable cultivation. Sci. Total Environ. 2021, 796, 148948. [Google Scholar] [CrossRef]
  8. Guillaume, T.; Holtkamp, A.M.; Damris, M.; Brümmer, B.; Kuzyakov, Y. Soil degradation in oil palm and rubber plantations under land resource scarcity. Agric. Ecosyst. Environ. 2016, 232, 110–118. [Google Scholar] [CrossRef]
  9. Joseph, P.; Jessy, M.D.; Mohan, M. Soil carbon pools under rubber (Hevea brasiliensis) based agroforestry systems in South India. Agrofor. Syst. 2022, 96, 1121–1133. [Google Scholar] [CrossRef]
  10. Labrière, N.; Locatelli, B.; Laumonier, Y.; Freycon, V.; Bernoux, M. Soil erosion in the humid tropics: A systematic quantitative review. Agric. Ecosyst. Environ. 2015, 203, 127–139. [Google Scholar] [CrossRef]
  11. Sidle, R.C.; Ziegler, A.D.; Negishi, J.N.; Nik, A.R.; Siew, R.; Turkelboom, F. Erosion processes in steep terrain—Truths, myths, and uncertainties related to forest management in Southeast Asia. For. Ecol. Manag. 2006, 224, 199–225. [Google Scholar] [CrossRef]
  12. Liu, W.; Luo, Q.; Li, J.; Wang, P.; Lu, H.; Liu, W.; Li, H. The effects of conversion of tropical rainforest to rubber plantation on splash erosion in Xishuangbanna, SW China. Hydrol. Res. 2015, 46, 168–174. [Google Scholar] [CrossRef]
  13. Chen, C.; Liu, W.; Wu, J.; Jiang, X.; Zhu, X. Can intercropping with the cash crop help improve the soil physico-chemical properties of rubber plantations? Geoderma 2019, 335, 149–160. [Google Scholar] [CrossRef]
  14. McBratney, A.B.; Odeh, I.O.A.; Bishop, T.F.A.; Dunbar, M.S.; Shatar, T.M. An overview of pedometric techniques for use in soil survey. Geoderma 2000, 97, 293–327. [Google Scholar] [CrossRef]
  15. Wischmeier, W.H.; Smith, D.D. Predicting Rainfall Erosion Losses: A Guide to Conservation Planning; Department of Agriculture, Science and Education Administration: Washington, DC, USA, 1978. [Google Scholar]
  16. Renard, K.G. Predicting Soil Erosion by Water: A Guide to Conservation Planning with the Revised Universal Soil Loss Equation (RUSLE); US Department of Agriculture, Agricultural Research Service: Washington, DC, USA, 1997.
  17. Kumar, M.; Prasad, S.A.; Narayan, S.; Sandeep, D.S.; Kumar, R.S.; Panigrahi, B. Global-scale application of the RUSLE model: A comprehensive review. Hydrol. Sci. J. 2022, 67, 806–830. [Google Scholar] [CrossRef]
  18. Wulder, M.A.; Roy, D.P.; Radeloff, V.C.; Loveland, T.R.; Anderson, M.C.; Johnson, D.M.; Healey, S.; Zhu, Z.; Scambos, T.A.; Pahlevan, N.; et al. Fifty years of Landsat science and impacts. Remote Sens. Environ. 2022, 280, 113195. [Google Scholar] [CrossRef]
  19. Sujatha, E.R.; Sridhar, V. Spatial Prediction of Erosion Risk of a Small Mountainous Watershed Using RUSLE: A Case-Study of the Palar Sub-Watershed in Kodaikanal, South India. Water 2018, 10, 1608. [Google Scholar] [CrossRef]
  20. Moges, D.M.; Bhat, H.G. Integration of geospatial technologies with RUSLE for analysis of land use/cover change impact on soil erosion: Case study in Rib watershed, north-western highland Ethiopia. Environ. Earth Sci. 2017, 76, 765. [Google Scholar] [CrossRef]
  21. Thomas, J.; Joseph, S.; Thrivikramji, K.P. Assessment of soil erosion in a tropical mountain river basin of the southern Western Ghats, India using RUSLE and GIS. Geosci. Front. 2018, 9, 893–906. [Google Scholar] [CrossRef]
  22. Obaid, H.A.; Shahid, S. Soil erosion susceptibility of Johor River basin. Water Environ. J. 2017, 31, 367–374. [Google Scholar] [CrossRef]
  23. Rizeei, H.M.; Saharkhiz, M.A.; Pradhan, B.; Ahmad, N. Soil erosion prediction based on land cover dynamics at the Semenyih watershed in Malaysia using LTM and USLE models. Geocarto Int. 2016, 31, 1158–1177. [Google Scholar] [CrossRef]
  24. Batista, P.V.G.; Silva, M.L.N.; Silva, B.P.C.; Curi, N.; Bueno, I.T.; Acérbi Júnior, F.W.; Davies, J.; Quinton, J. Modelling spatially distributed soil losses and sediment yield in the upper Grande River Basin—Brazil. Catena 2017, 157, 139–150. [Google Scholar] [CrossRef]
  25. Bera, A. Estimation of soil loss by USLE model using GIS and remote sensing techniques: A case study of Muhuri River Basin, Tripura, India. Eurasian J. Soil Sci. 2017, 6, 206–215. [Google Scholar] [CrossRef]
  26. Aburto, F.; Cartes, E.; Mardones, O.; Rubilar, R. Hillslope soil erosion and mobility in pine plantations and native deciduous forest in the coastal range of south-Central Chile. Land. Dedrad. Dev. 2021, 32, 453–466. [Google Scholar] [CrossRef]
  27. Pham, T.G.; Degener, J.; Kappas, M. Integrated universal soil loss equation (USLE) and Geographical Information System (GIS) for soil erosion estimation in A Sap basin: Central Vietnam. Int. Soil Water Conserv. Res. 2018, 6, 99–110. [Google Scholar] [CrossRef]
  28. Liu, H.; Blagodatsky, S.; Giese, M.; Liu, F.; Xu, J.; Cadisch, G. Impact of herbicide application on soil erosion and induced carbon loss in a rubber plantation of Southwest China. Catena 2016, 145, 180–192. [Google Scholar] [CrossRef]
  29. Puktlang, W.; Mongkolsawat, C.; Suwanwerakamtorn, R. The Impact of Expanding Rubber Tree Plantation on Soil Erosion in the Mekong-Sub Basin. In Proceedings of the 34th Asian Conference on Remote Sensing, Bali, Indonesia, 20–24 October 2013. [Google Scholar]
  30. Zhou, X.; Wang, Z.; Yu, B.; Seitz, L. Effects of large-scale rubber farm on soil erosion and river bed material in the upper Mekong Basin. In River Flow 2014; CRC Press: Boca Raton, FL, USA, 2014; pp. 2305–2312. [Google Scholar]
  31. Liu, H.; Sergey, B.; Feng, L.; Jianchu, X.; Cadisch, G. Impact of rubber plantation age on erosive potential studied with USLE model. J. Appl. Water Eng. Res. 2018, 6, 252–261. [Google Scholar] [CrossRef]
  32. Li, Q.; Zeng, T.; Chen, Q.; Han, X.; Weng, X.; He, P.; Zhou, Z.; Du, Y. Spatio-temporal changes in daily extreme precipitation for the Lancang–Mekong River Basin. Nat. Hazards 2023, 115, 641–672. [Google Scholar] [CrossRef]
  33. Gupta, A. The Physical Geography of Southeast Asia; OUP Oxford: Oxford, UK, 2005. [Google Scholar]
  34. Funk, C.; Peterson, P.; Landsfeld, M.; Pedreros, D.; Verdin, J.; Shukla, S.; Husak, G.; Rowland, J.; Harrison, L.; Hoell, A. The climate hazards infrared precipitation with stations—A new environmental record for monitoring extremes. Sci. Data 2015, 2, 150066. [Google Scholar] [CrossRef]
  35. IIASA; FAO. Harmonized World Soil Database Version 2.0; FAO: Rome, Italy; IIASA: Laxenburg, Austria, 2023. [Google Scholar]
  36. Chen, J.; Gao, M.; Cheng, S.; Hou, W.; Song, M.; Liu, X.; Liu, Y. Global 1 km × 1 km gridded revised real gross domestic product and electricity consumption during 1992–2019 based on calibrated nighttime light data. Sci. Data 2022, 9, 202. [Google Scholar] [CrossRef]
  37. Gaughan, A.E.; Stevens, F.R.; Linard, C.; Jia, P.; Tatem, A.J. High resolution population distribution maps for Southeast Asia in 2010 and 2015. PLoS ONE 2013, 8, e55882. [Google Scholar] [CrossRef] [PubMed]
  38. Xu, H.F.; Chen, Y.L.; Chen, B.Q.; R, M.L.; Lu, D.S.; Wang, S.S. A new framework for mapping rubber plantations through the combination of automatic sample migration, dynamic phenology, and change detection variables based on time series Landsat images. 2025; under review. [Google Scholar]
  39. Zhou, F.J.; Chen, M.H.; Lin, F.X.; Huang, Y.H.; Lu, C.L. The rainfall erosivity index in Fujian Province. J. Soil Water Conserv. 1995, 9, 13–18. [Google Scholar]
  40. Chuenchum, P.; Xu, M.; Tang, W. Predicted trends of soil erosion and sediment yield from future land use and climate change scenarios in the Lancang–Mekong River by using the modified RUSLE model. Int. Soil Water Conserv. Res. 2020, 8, 213–227. [Google Scholar] [CrossRef]
  41. Wu, J.; Cheng, Y.; Mu, Z.; Dong, W.; Zheng, Y.; Chen, C.; Wang, Y. Temporal Spatial Mutations of Soil Erosion in the Middle and Lower Reaches of the Lancang River Basin and Its Influencing Mechanisms. Sustainability 2022, 14, 5169. [Google Scholar] [CrossRef]
  42. Zhang, H.; Yang, Q.; Li, R.; Liu, Q.; Moore, D.; He, P.; Ritsema, C.J.; Geissen, V. Extension of a GIS procedure for calculating the RUSLE equation LS factor. Comput. Geosci. 2013, 52, 177–188. [Google Scholar] [CrossRef]
  43. Li, L.; Wang, Y.; Liu, C. Effects of land use changes on soil erosion in a fast developing area. Int. J. Environ. Sci. Technol. 2014, 11, 1549–1562. [Google Scholar] [CrossRef]
  44. Li, X.; Zulkar, H.; Wang, D.; Zhao, T.; Xu, W. Changes in Vegetation Coverage and Migration Characteristics of Center of Gravity in the Arid Desert Region of Northwest China in 30 Recent Years. Land 2022, 11, 1688. [Google Scholar] [CrossRef]
  45. Carlson, T.N.; Ripley, D.A. On the relation between NDVI, fractional vegetation cover, and leaf area index. Remote Sens. Environ. 1997, 62, 241–252. [Google Scholar] [CrossRef]
  46. Kendall, M.G. Rank Correlation Methods; Springer: Berlin/Heidelberg, Germany, 1948. [Google Scholar]
  47. Mann, H.B. Nonparametric tests against trend. Econom. J. Econom. Soc. 1945, 13, 245–259. [Google Scholar] [CrossRef]
  48. Sen, P.K. Estimates of the regression coefficient based on Kendall’s tau. J. Am. Stat. Assoc. 1968, 63, 1379–1389. [Google Scholar] [CrossRef]
  49. Jiang, W.; Yuan, L.; Wang, W.; Cao, R.; Zhang, Y.; Shen, W. Spatio-temporal analysis of vegetation variation in the Yellow River Basin. Ecol. Indic. 2015, 51, 117–126. [Google Scholar] [CrossRef]
  50. Song, Y.; Jinfeng, W.; Yong, G.; Xu, C. An optimal parameters-based geographical detector model enhances geographic characteristics of explanatory variables for spatial heterogeneity analysis: Cases with different types of spatial data. Gisci. Remote Sens. 2020, 57, 593–610. [Google Scholar] [CrossRef]
  51. Wang, Y.; Hollingsworth, P.M.; Zhai, D.; West, C.D.; Green, J.M.H.; Chen, H.; Hurni, K.; Su, Y.; Warren-Thomas, E.; Xu, J.; et al. High-resolution maps show that rubber causes substantial deforestation. Nature 2023, 623, 340–346. [Google Scholar] [CrossRef] [PubMed]
  52. Liu, Y.; Wang, F.; Zhang, S.; Ding, W.; Li, R.; Han, J.; Ge, W.; Chen, H.; Shi, S. Analysis of canopy interception characteristics and influencing factors in typical artificial forest in the Loess Plateau semi-arid region. J. Environ. Manag. 2024, 370, 122455. [Google Scholar] [CrossRef] [PubMed]
  53. Elliot, W.J.; Page-Dumroese, D.; Robichaud, P.R. The effects of forest management on erosion and soil productivity. In Soil Quality and Soil Erosion; CRC Press: Boca Raton, FL, USA, 2018; pp. 195–208. [Google Scholar]
  54. Yang, X.; Li, D.; McGrouther, K.; Long, W.; Li, Y.; Chen, Y.; Lv, X.; Niazi, N.K.; Song, Z.; Wang, H. Effect of Eucalyptus forests on understory vegetation and soil quality. J. Soils Sediments 2017, 17, 2383–2389. [Google Scholar] [CrossRef]
  55. Gong, C.; Tan, Q.; Liu, G.; Xu, M. Impacts of mixed forests on controlling soil erosion in China. Catena 2022, 213, 106147. [Google Scholar] [CrossRef]
  56. Yang, K.; Liu, H.; Ning, J.; Zhen, Q.; Zheng, J. Rainwater infiltration and nutrient recharge system significantly enhance the growth of degraded artificial forest in semi-arid areas with shallowly buried soft bedrock. For. Ecol. Manag. 2023, 539, 121016. [Google Scholar] [CrossRef]
  57. Liu, J.; Liu, W.; Li, W.; Zeng, H. How does a rubber plantation affect the spatial variability and temporal stability of throughfall? Hydrol. Res. 2019, 50, 60–74. [Google Scholar] [CrossRef]
  58. Nugent, C.; Kanali, C.; Owende, P.M.O.; Nieuwenhuis, M.; Ward, S. Characteristic site disturbance due to harvesting and extraction machinery traffic on sensitive forest sites with peat soils. For. Ecol. Manag. 2003, 180, 85–98. [Google Scholar] [CrossRef]
  59. Zhou, Z.; Wang, Y.; Li, R.; Qi, L.; Zhao, Y.; Xu, Y.; Tong, Y.; Huang, J. The deterioration and restoration of dried soil layers: New evidence from a precipitation manipulation experiment in an artificial forest. J. Hydrol. 2023, 625, 130087. [Google Scholar] [CrossRef]
  60. Chen, S.; Hua, J.; Liu, W.; Yang, S.; Wang, X.; Ji, W. Effects of artificial restoration and natural recovery on plant communities and soil properties across different temporal gradients after landslides. Forests 2023, 14, 1974. [Google Scholar] [CrossRef]
  61. Li, Z.; Liu, M.; Xu, L.; Teng, W.; Fang, J. Construction of Eco-Compensation Policy Framework for Natural Rubber with Production and Ecological Win–Win. Land 2025, 14, 368. [Google Scholar] [CrossRef]
  62. Panklang, P.; Thoumazeau, A.; Chiarawipa, R.; Sdoodee, S.; Sebag, D.; Gay, F.; Thaler, P.; Brauman, A. Rubber, rubber and rubber: How 75 years of successive rubber plantation rotations affect topsoil quality? Land. Dedrad. Dev. 2022, 33, 1159–1169. [Google Scholar] [CrossRef]
  63. Ali, M.F.; Akber, M.A.; Smith, C.; Aziz, A.A. The dynamics of rubber production in Malaysia: Potential impacts, challenges and proposed interventions. For. Policy. Econ. 2021, 127, 102449. [Google Scholar] [CrossRef]
  64. Milazzo, F.; Francksen, R.M.; Zavattaro, L.; Abdalla, M.; Hejduk, S.; Enri, S.R.; Pittarello, M.; Price, P.N.; Schils, R.L.M.; Smith, P.; et al. The role of grassland for erosion and flood mitigation in Europe: A meta-analysis. Agric., Ecosyst. Environ. 2023, 348, 108443. [Google Scholar] [CrossRef]
  65. Vijayan, D.; Girindran, R.; Sam, A.S.; Sathyan, A.R.; Kaechele, H. The large-scale expansion of rubber plantations in southern India: Major impacts and the changing nature of drivers. Environ. Monit. Assess 2024, 196, 356. [Google Scholar] [CrossRef]
  66. Ahrends, A.; Hollingsworth, P.M.; Ziegler, A.D.; Fox, J.M.; Chen, H.; Su, Y.; Xu, J. Current trends of rubber plantation expansion may threaten biodiversity and livelihoods. Glob. Environ. Change 2015, 34, 48–58. [Google Scholar] [CrossRef]
  67. Chotiphan, R.; Vaysse, L.; Lacote, R.; Gohet, E.; Thaler, P.; Sajjaphan, K.; Bottier, C.; Char, C.; Liengprayoon, S.; Gay, F. Can fertilization be a driver of rubber plantation intensification? Ind. Crops Prod. 2019, 141, 111813. [Google Scholar] [CrossRef]
  68. Kefi, M.; Yoshino, K.; Setiawan, Y. Assessment and mapping of soil erosion risk by water in Tunisia using time series MODIS data. Paddy Water Environ. 2012, 10, 59–73. [Google Scholar] [CrossRef]
  69. Neyret, M.; Robain, H.; de Rouw, A.; Janeau, J.-L.; Durand, T.; Kaewthip, J.; Trisophon, K.; Valentin, C. Higher runoff and soil detachment in rubber tree plantations compared to annual cultivation is mitigated by ground cover in steep mountainous Thailand. Catena 2020, 189, 104472. [Google Scholar] [CrossRef]
  70. Liu, W.; Luo, Q.; Lu, H.; Wu, J.; Duan, W. The effect of litter layer on controlling surface runoff and erosion in rubber plantations on tropical mountain slopes, SW China. Catena 2017, 149, 167–175. [Google Scholar] [CrossRef]
  71. Gao, S.; Zhong, R.; Yan, K.; Ma, X.; Chen, X.; Pu, J.; Gao, S.; Qi, J.; Yin, G.; Myneni, R.B. Evaluating the saturation effect of vegetation indices in forests using 3D radiative transfer simulations and satellite observations. Remote Sens. Environ. 2023, 295, 113665. [Google Scholar] [CrossRef]
  72. Wang, X.; Chen, B.; Dong, J.; Gao, Y.; Wang, G.; Lai, H.; Wu, Z.; Yang, C.; Kou, W.; Yun, T. Early identification of immature rubber plantations using Landsat and Sentinel satellite images. Int. J. Appl. Earth Obs. 2024, 133, 104097. [Google Scholar] [CrossRef]
  73. Phinzi, K.; Ngetar, N.S. The assessment of water-borne erosion at catchment level using GIS-based RUSLE and remote sensing: A review. Int. Soil Water Conserv. Res. 2019, 7, 27–46. [Google Scholar] [CrossRef]
  74. Benavidez, R.; Jackson, B.; Maxwell, D.; Norton, K. A review of the (Revised) Universal Soil Loss Equation ((R)USLE): With a view to increasing its global applicability and improving soil loss estimates. Hydrol. Earth Syst. Sci. 2018, 22, 6059–6086. [Google Scholar] [CrossRef]
Figure 1. Study region overview. (a) Study region location, (b) Altitude, (c) Land cover.
Remotesensing 17 02220 g001
Figure 2. Verification of rubber forest classification accuracy (a) and expansion area (b).
Remotesensing 17 02220 g002
Figure 3. The main sources of rubber plantation expansion in different periods.
Remotesensing 17 02220 g003
Figure 4. Spatial distribution of RUSLE model factors. (a) R, (b) CP, (c) K, (d) LS.
Remotesensing 17 02220 g004
Figure 5. Violin diagram of rubber plantation soil erosion in each year.
Remotesensing 17 02220 g005
Figure 6. Temporal distribution of soil erosion in rubber plantations (ae) and soil erosion trends in rubber plantations (f).
Remotesensing 17 02220 g006
Figure 7. Soil erosion trend of rubber plantations from 2003 to 2022.
Remotesensing 17 02220 g007
Figure 8. Temporal distribution of soil erosion levels in rubber plantations.
Remotesensing 17 02220 g008
Figure 9. Spatial and temporal transformation of different soil erosion levels in rubber plantations.
Remotesensing 17 02220 g009
Figure 10. Conversion area of each soil erosion level in rubber plantations.
Remotesensing 17 02220 g010
Figure 11. Spatial distribution of rubber plantation ages (a) and soil erosion of rubber plantations at different ages (b).
Remotesensing 17 02220 g011
Figure 12. Spatial distribution of soil erosion under two scenarios from 2003 to 2022: (a) rubber plantation non-expansion scenario, (b) rubber plantation expansion scenario.
Remotesensing 17 02220 g012
Figure 13. Factor analysis of rubber plantation soil erosion in different years. *** represents p < 0.05.
Remotesensing 17 02220 g013
Figure 14. Factor interaction detection results on soil erosion of rubber plantations.
Remotesensing 17 02220 g014
Table 1. C and P factor assignment.
Land Cover TypeCP
Tropical forest0.0011
Shrub0.081
Crop0.50.5
Water body0.011
Urban impervious surface0.11
Table 2. Analysis of soil erosion trends in rubber plantations.
SSEZSESoil Erosion Trend
≥0.0005≥1.96Significant aggravation
≥0.0005−1.96–1.96Slight aggravation
−0.0005–0.0005−1.96–1.96Stable trend
<0.0005−1.96–1.96Slight mitigation
<0.0005<−1.96Significant mitigation
Table 3. Soil erosion in rubber plantation scenario and non-rubber plantation scenario.
Average Soil Erosion
(t·ha−1·yr−1)
Rubber Plantation Non-Expansion ScenarioRubber Plantation Expansion ScenarioExacerbated Rate (%)
2003–20080.2331.030342.060
2008–20130.1200.606405.000
2013–20180.2410.976304.979
2018–20220.2040.943362.255
2003–20220.1480.902509.459
Table 4. Comparison of soil erosion in rubber plantations in this study with existing studies.
MethodsStudy SiteData YearAge of Rubber PlantationRubber Plantation
Soil Erosion
(t·ha−1·yr−1)
References
USLEXishuangbanna20144, 12, 18, 25 and 36 years0.330–2.800[31]
Field experimentsXishuangbanna201122 years0.910–4.730[70]
Field experimentsXishuangbanna201412 years0.500–4.250[28]
Field experimentsThailand2015Mature/young 3.600/57.000[69]
RUSLEThailand2013all ages0.021–4.767This study
RUSLEXishuangbanna2013all ages0.003–6.917This study
Disclaimer/Publisher’s Note: The statements, opinions and data contained in all publications are solely those of the individual author(s) and contributor(s) and not of MDPI and/or the editor(s). MDPI and/or the editor(s) disclaim responsibility for any injury to people or property resulting from any ideas, methods, instructions or products referred to in the content.

