Article

Urban Greening Analysis: A Multimodal Large Language Model for Pinpointing Vegetation Areas in Adverse Weather Conditions

1
School of Information Science and Technology (School of Artificial Intelligence), Beijing Forestry University, Beijing 100083, China
2
Engineering Research Center for Forestry-Oriented Intelligent Information Processing of National Forestry and Grassland Administration, Beijing 100083, China
3
Hebei Key Laboratory of Smart National Park, Beijing 100083, China
4
State Key Laboratory of Efficient Production of Forest Resources, Beijing 100083, China
5
School of Computer Science and Technology, East China Normal University, Shanghai 200062, China
6
General Forestry Station of Beijing Municipality, Beijing 100029, China
*
Author to whom correspondence should be addressed.
Remote Sens. 2025, 17(12), 2058; https://doi.org/10.3390/rs17122058
Submission received: 24 April 2025 / Revised: 1 June 2025 / Accepted: 13 June 2025 / Published: 14 June 2025
(This article belongs to the Special Issue Urban Sensing Methods and Technologies II)

Abstract

:
Urban green spaces are an important part of the urban ecosystem and hold significant ecological value. To effectively protect these green spaces, urban managers urgently need to identify them and monitor their changes. Common urban vegetation positioning methods use deep learning segmentation models to process street view data in urban areas, but this is usually inefficient and inaccurate. The main reason is that they are not applicable to the variable climate of urban scenarios, especially performing poorly in adverse weather conditions such as heavy fog that are common in cities. Additionally, these algorithms also have performance limitations such as inaccurate boundary area positioning. To address these challenges, we propose the UGSAM method that utilizes the high-performance multimodal large language model, the Segment Anything Model (i.e., SAM). In the UGSAM, a dual-branch defogging network WRPM is incorporated, which consists of the dense fog network FFA-Net, the light fog network LS-UNet, and the feature fusion network FIM, achieving precise identification of vegetation areas in adverse urban weather conditions. Moreover, we have designed a micro-correction network SCP-Net suitable for specific urban scenarios to further improve the accuracy of urban vegetation positioning. The UGSAM was compared with three classic deep learning algorithms and the SAM. Experimental results show that under adverse weather conditions, the UGSAM performs best in OA (0.8615), mIoU (0.8490), recall (0.9345), and precision (0.9027), surpassing the baseline model FCN (OA improvement 28.19%) and PointNet++ (OA improvement 30.02%). Compared with the SAM, the UGSAM improves the segmentation accuracy by 16.29% under adverse weather conditions and by 1.03% under good weather conditions. This method is expected to play a key role in the analysis of urban green spaces under adverse weather conditions and provide innovative insights for urban development.

1. Introduction

With socio-economic development, population growth, and accelerated industrialization, most cities continue to expand. Urban expansion serves as the foundation for urban development; yet, during this process, substantial urban green spaces and suburban vegetation are frequently occupied and transformed into residential buildings and industrial facilities [1]. Urban greenery plays a crucial role in achieving urban carbon neutrality and improving air quality [2,3,4]. The reduction in green spaces has led to multiple environmental challenges, including intensified urban heat island effects and diminished urban ecosystem diversity [5,6]. Therefore, comprehensive planning of urban green spaces during urban development becomes an inevitable choice for environmental preservation [7,8,9,10].
Previous studies have proposed various methods for coordinated planning of urban green spaces, all requiring precise localization of vegetation within urban areas. Traditional manual field surveys demand on-site personnel inspections, proving time-consuming and cost-prohibitive for large-scale urban applications [11,12]. Advances in remote sensing technology enable automated all-weather collection of streetscape data, allowing researchers to locate urban green spaces through street view image analysis. Progress in artificial intelligence (AI) has led to automated localization methods using machine learning and deep learning algorithms, which employ automatically acquired streetscape data combined with image segmentation algorithms like FCN [13] and PointNet++ [14] to demarcate vegetation areas [15]. However, there are two challenges in using these artificial intelligence algorithms [16,17,18]. First, there are limitations in the performance of these algorithms, which cannot handle the boundary regions well during segmentation, and there is a lot of room for improvement in segmentation accuracy [19]. Secondly, the urban climate is highly variable, and in some coastal cities there is often inclement weather such as storms, and most of the areas of the streetscape images collected under adverse weather are blurred and the data quality is poor, which leads to a low accuracy of the final localization [20]. Furthermore, in order for these AI algorithms to function effectively in practice, it is imperative to consider their substantial computational costs and inference times [21]. Therefore, providing urban managers with a method suitable for vegetation positioning in urban scenarios is of practical significance.
Fortunately, on the one hand, multimodal large language models have emerged as a dominant approach in various artificial intelligence applications and are widely adopted in image segmentation and object detection research. The Segment Anything Model (SAM) is a multimodal large language model designed for image segmentation [22]. The SAM has demonstrated the high efficiency in performing diverse segmentation tasks through training on extensive datasets, and its pretraining model architecture and parameters make it able to quickly adapt to the greening recognition task of different scenes without complex parameter tuning [23]. Consequently, this suggests that there is potential for resolving the issues associated with substantial computing resources and inference time when implementing the SAM in practice. Meanwhile, when applied to urban vegetation localization, the SAM effectively addresses the performance limitations of traditional algorithms. For example, compared with traditional image segmentation algorithms, the SAM performs better in dealing with complex backgrounds, occlusions, and morphological diversity of vegetation in street view images, and can effectively reduce segmentation errors caused by image complexity [24,25]. In addition, the multimodal characteristics of the SAM support the fusion of multiple information, and by combining image visual features and semantic information, it can significantly improve the accuracy and stability of greening area identification, provide strong technical support for accurately distinguishing vegetation and nonvegetation areas, and significantly improve the positioning accuracy of urban greening areas [26,27]. However, due to the complexity of urban scenes, directly applying the SAM to urban street view images may result in minor omissions in boundary regions. Therefore, enhancing the model’s capability to handle boundary areas becomes essential.
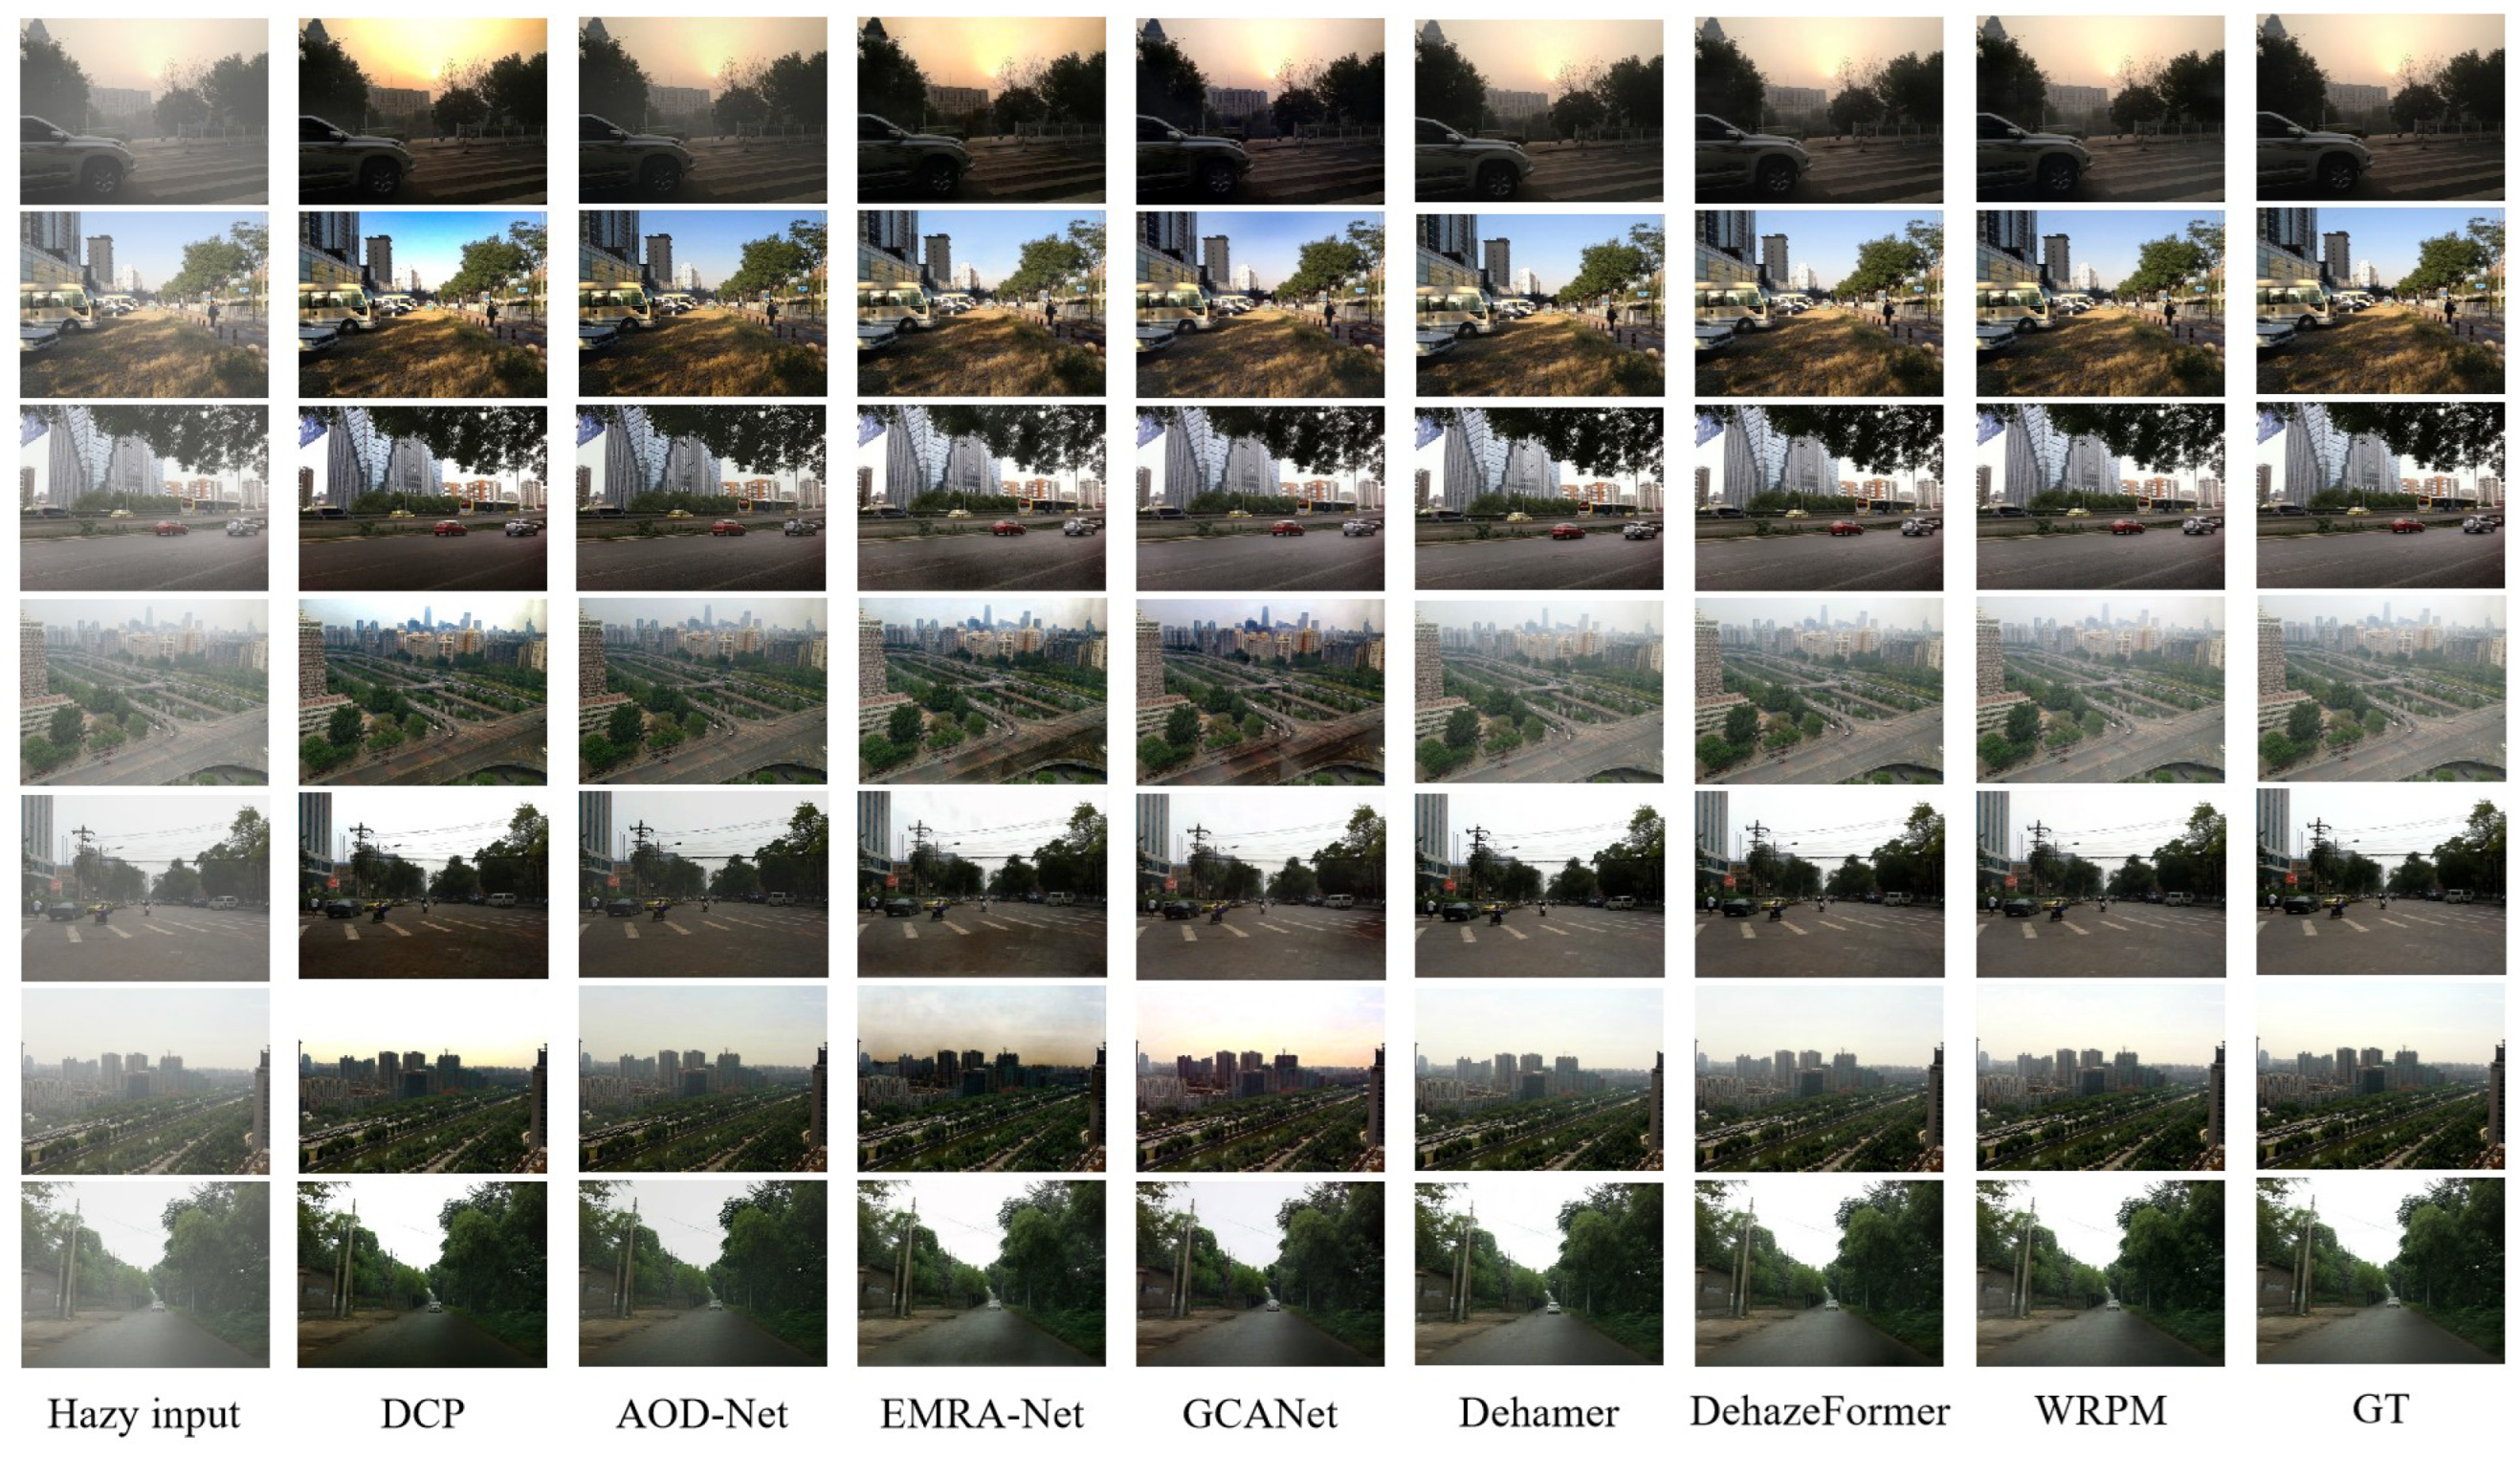
On the other hand, with the advent of image defogging technology, there is a possibility of utilizing these defogging technologies to address the impact of severe weather, such as heavy fog, frequently encountered in urban vegetation positioning tasks. Existing defogging methods can be categorized into traditional physical approaches and deep-learning-based techniques [28]. Traditional physical defogging methods, such as DCP [29], estimate atmospheric transmission and illumination components to achieve defogging. However, their reliance on strong assumptions about uniform fog distribution and scene brightness often leads to halo artifacts, color distortion, and difficulties in maintaining global consistency. With advancements in artificial intelligence, numerous deep-learning-based defogging methods have been developed. AOD-Net [30], leveraging a deep learning framework, simplifies the joint optimization of transmission and atmospheric light by parameterizing the atmospheric scattering model. Nevertheless, its shallow network structure limits its dynamic adaptability to varying fog concentrations, resulting in incomplete defogging. EMRA-Net [31] and GCANet [32] further incorporate multiscale residual modules, channel attention mechanisms, and gated context aggregation strategies to enhance local texture recovery and noise suppression. Despite these improvements, they still struggle with heavy fog regions, leading to incomplete processing. Defogging methods based on Transformer architectures, including Dehamer [33], DehazeFormer [34], and PMNet [35], utilize multihead self-attention mechanisms to focus on deeper image features. However, these methods tend to over-defog, causing the loss of original image characteristics. Moreover, algorithms based on the Transformer structure typically incur substantial computational costs and require extended inference times [33,34,35]. Hence, current defogging techniques fail to meet the requirements of urban scenarios in practice. In other words, there is a need for a defogging method that achieves high defogging quality while preserving the original features of images across different fog concentrations to the greatest extent possible.
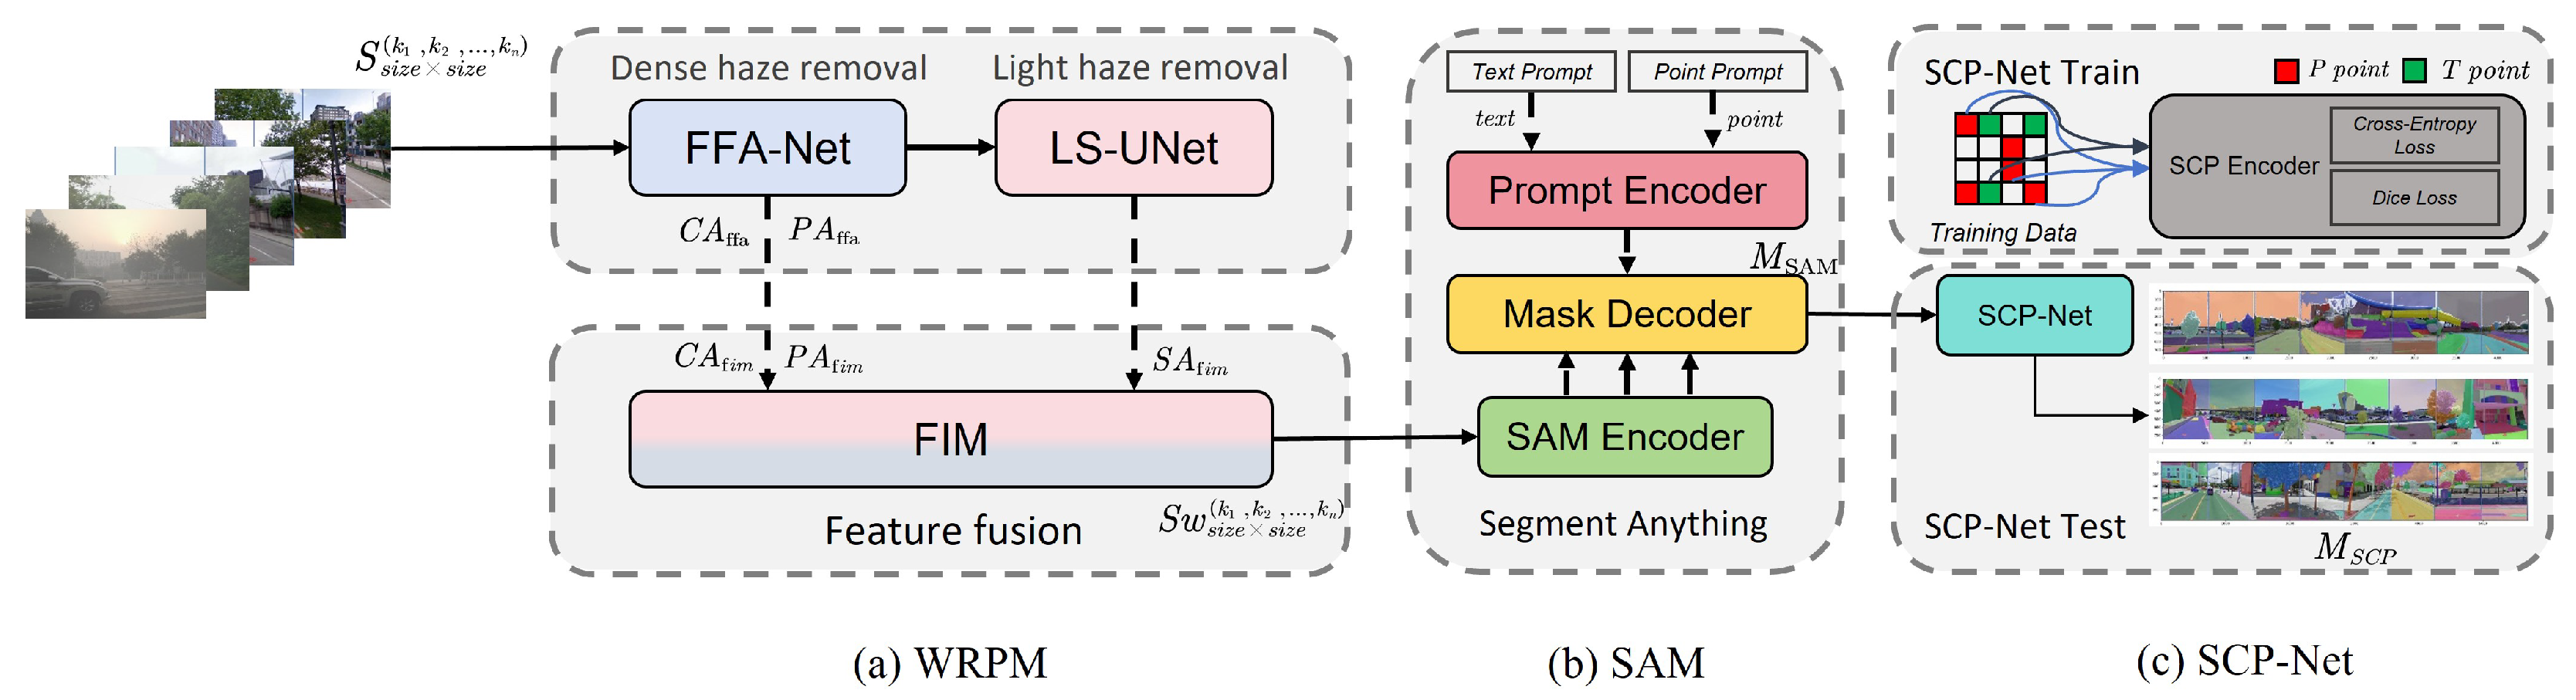
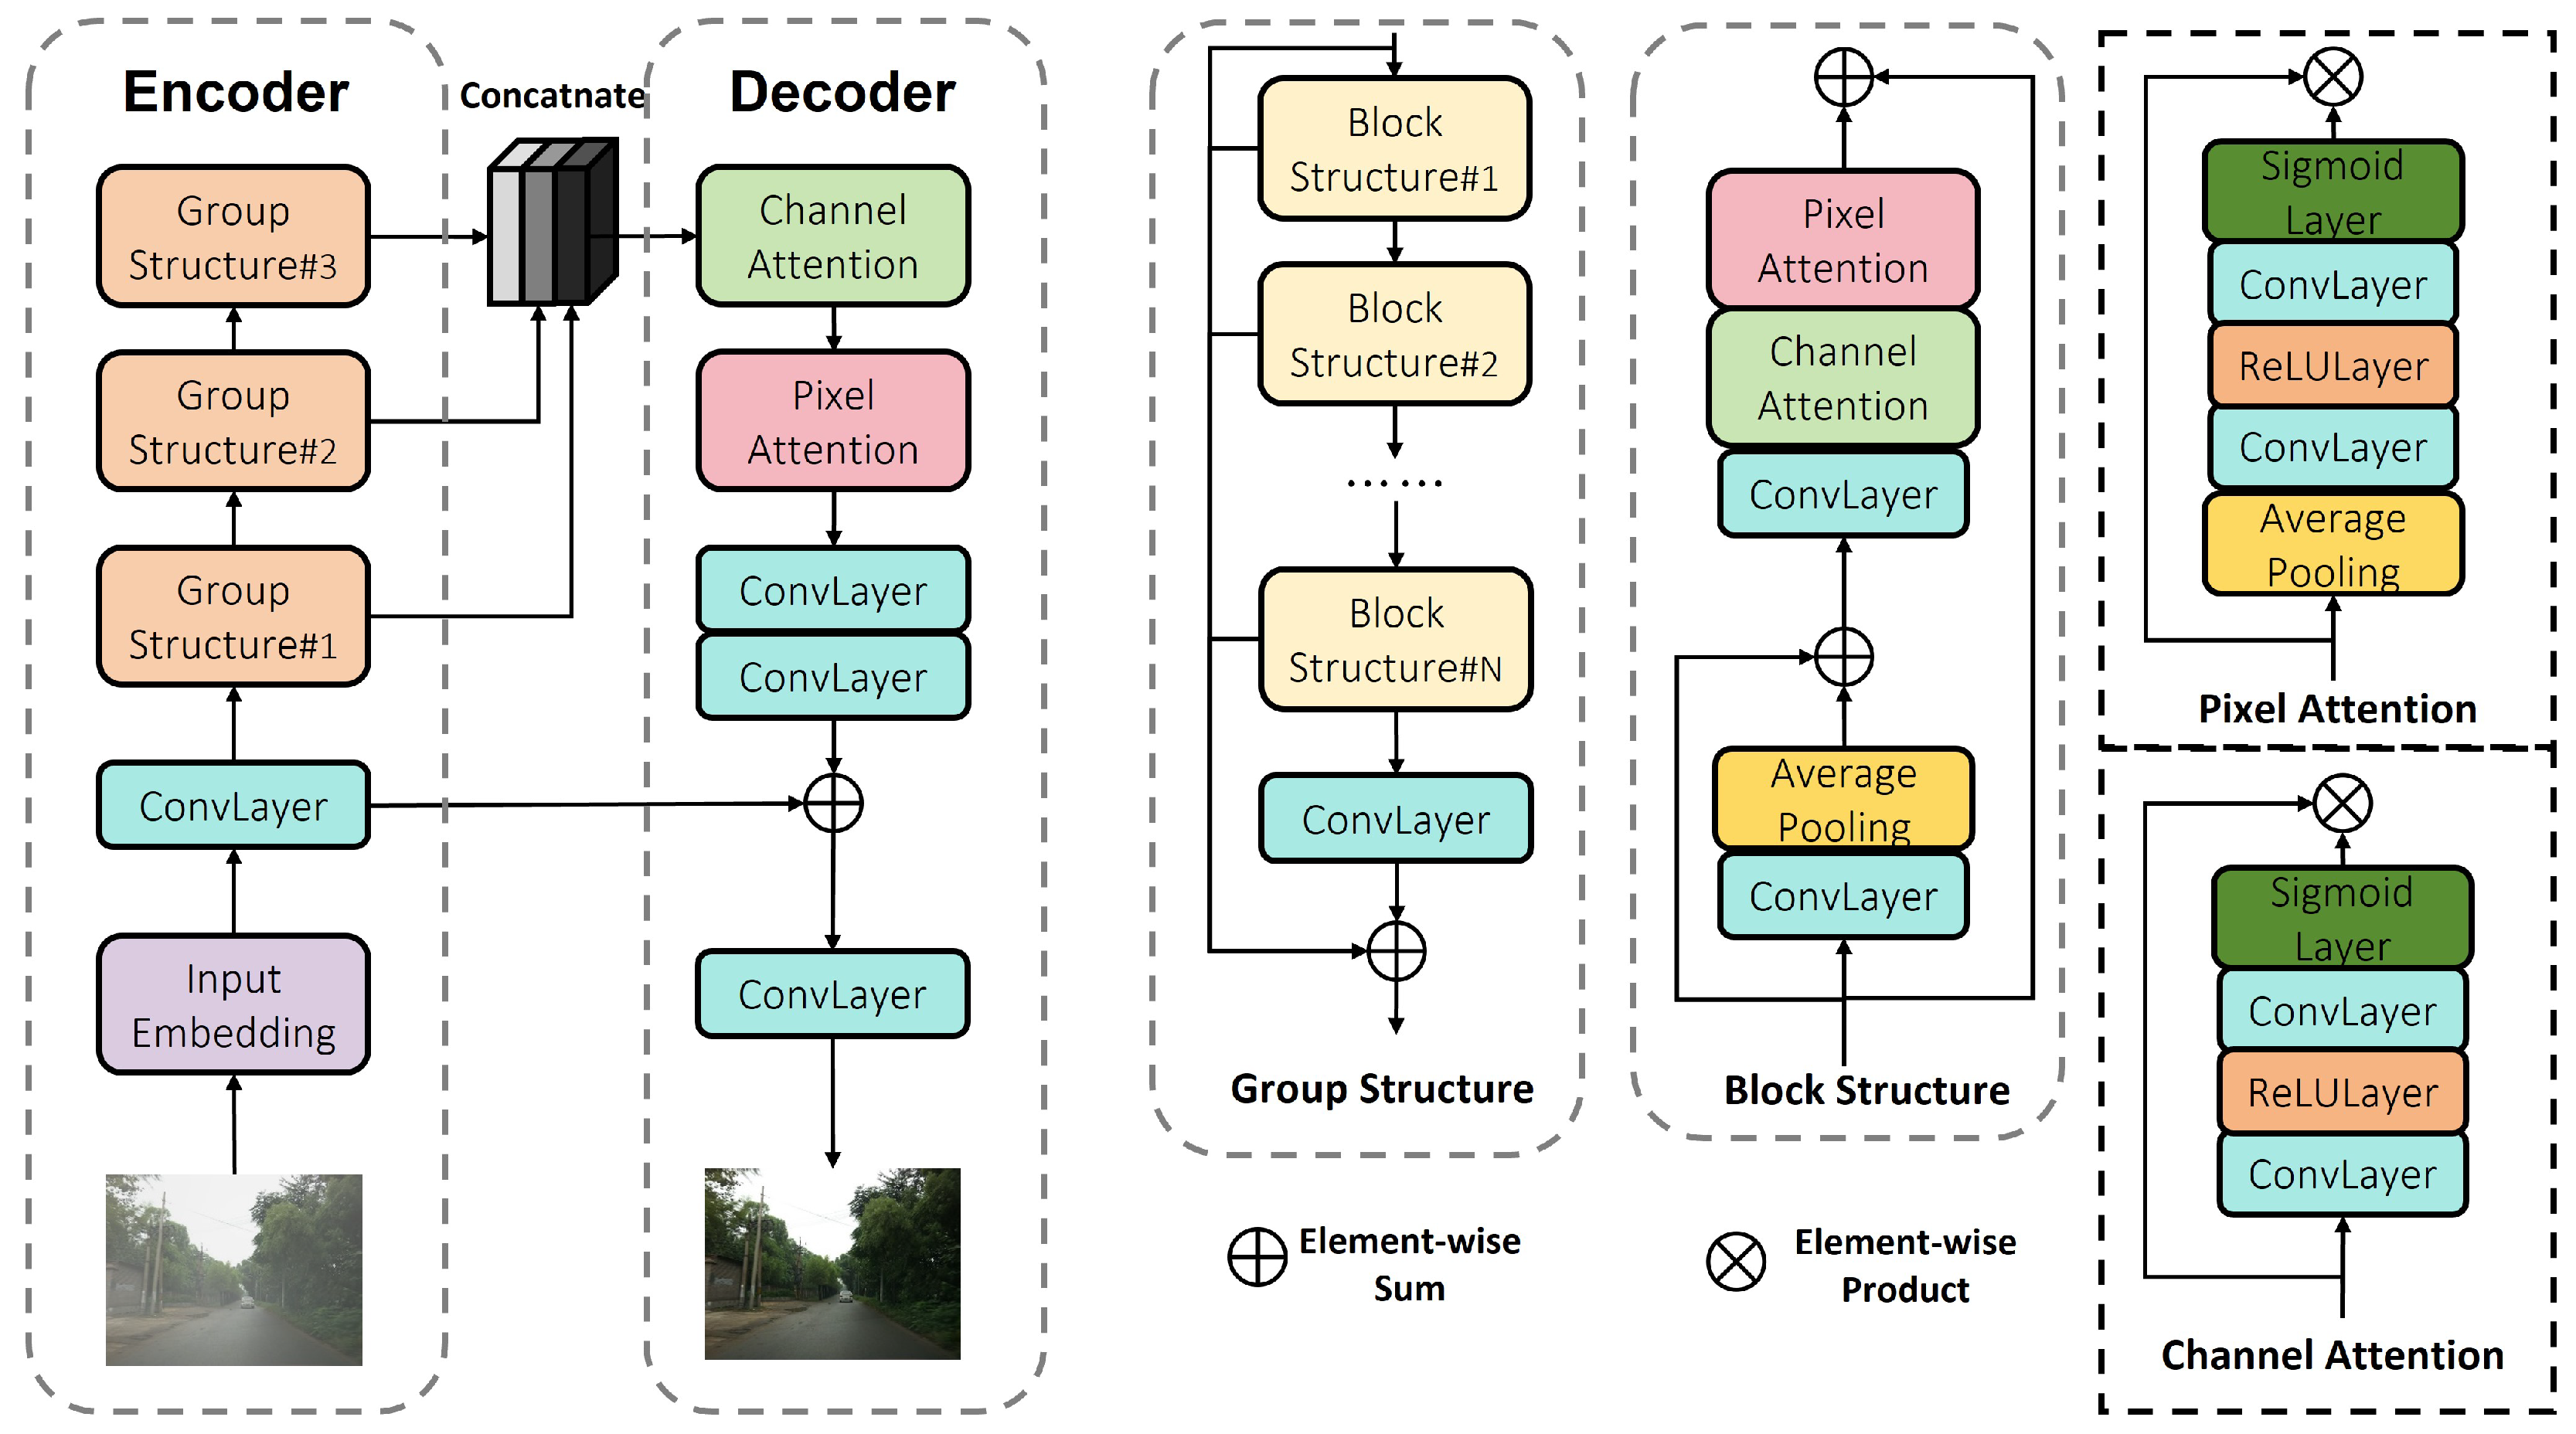
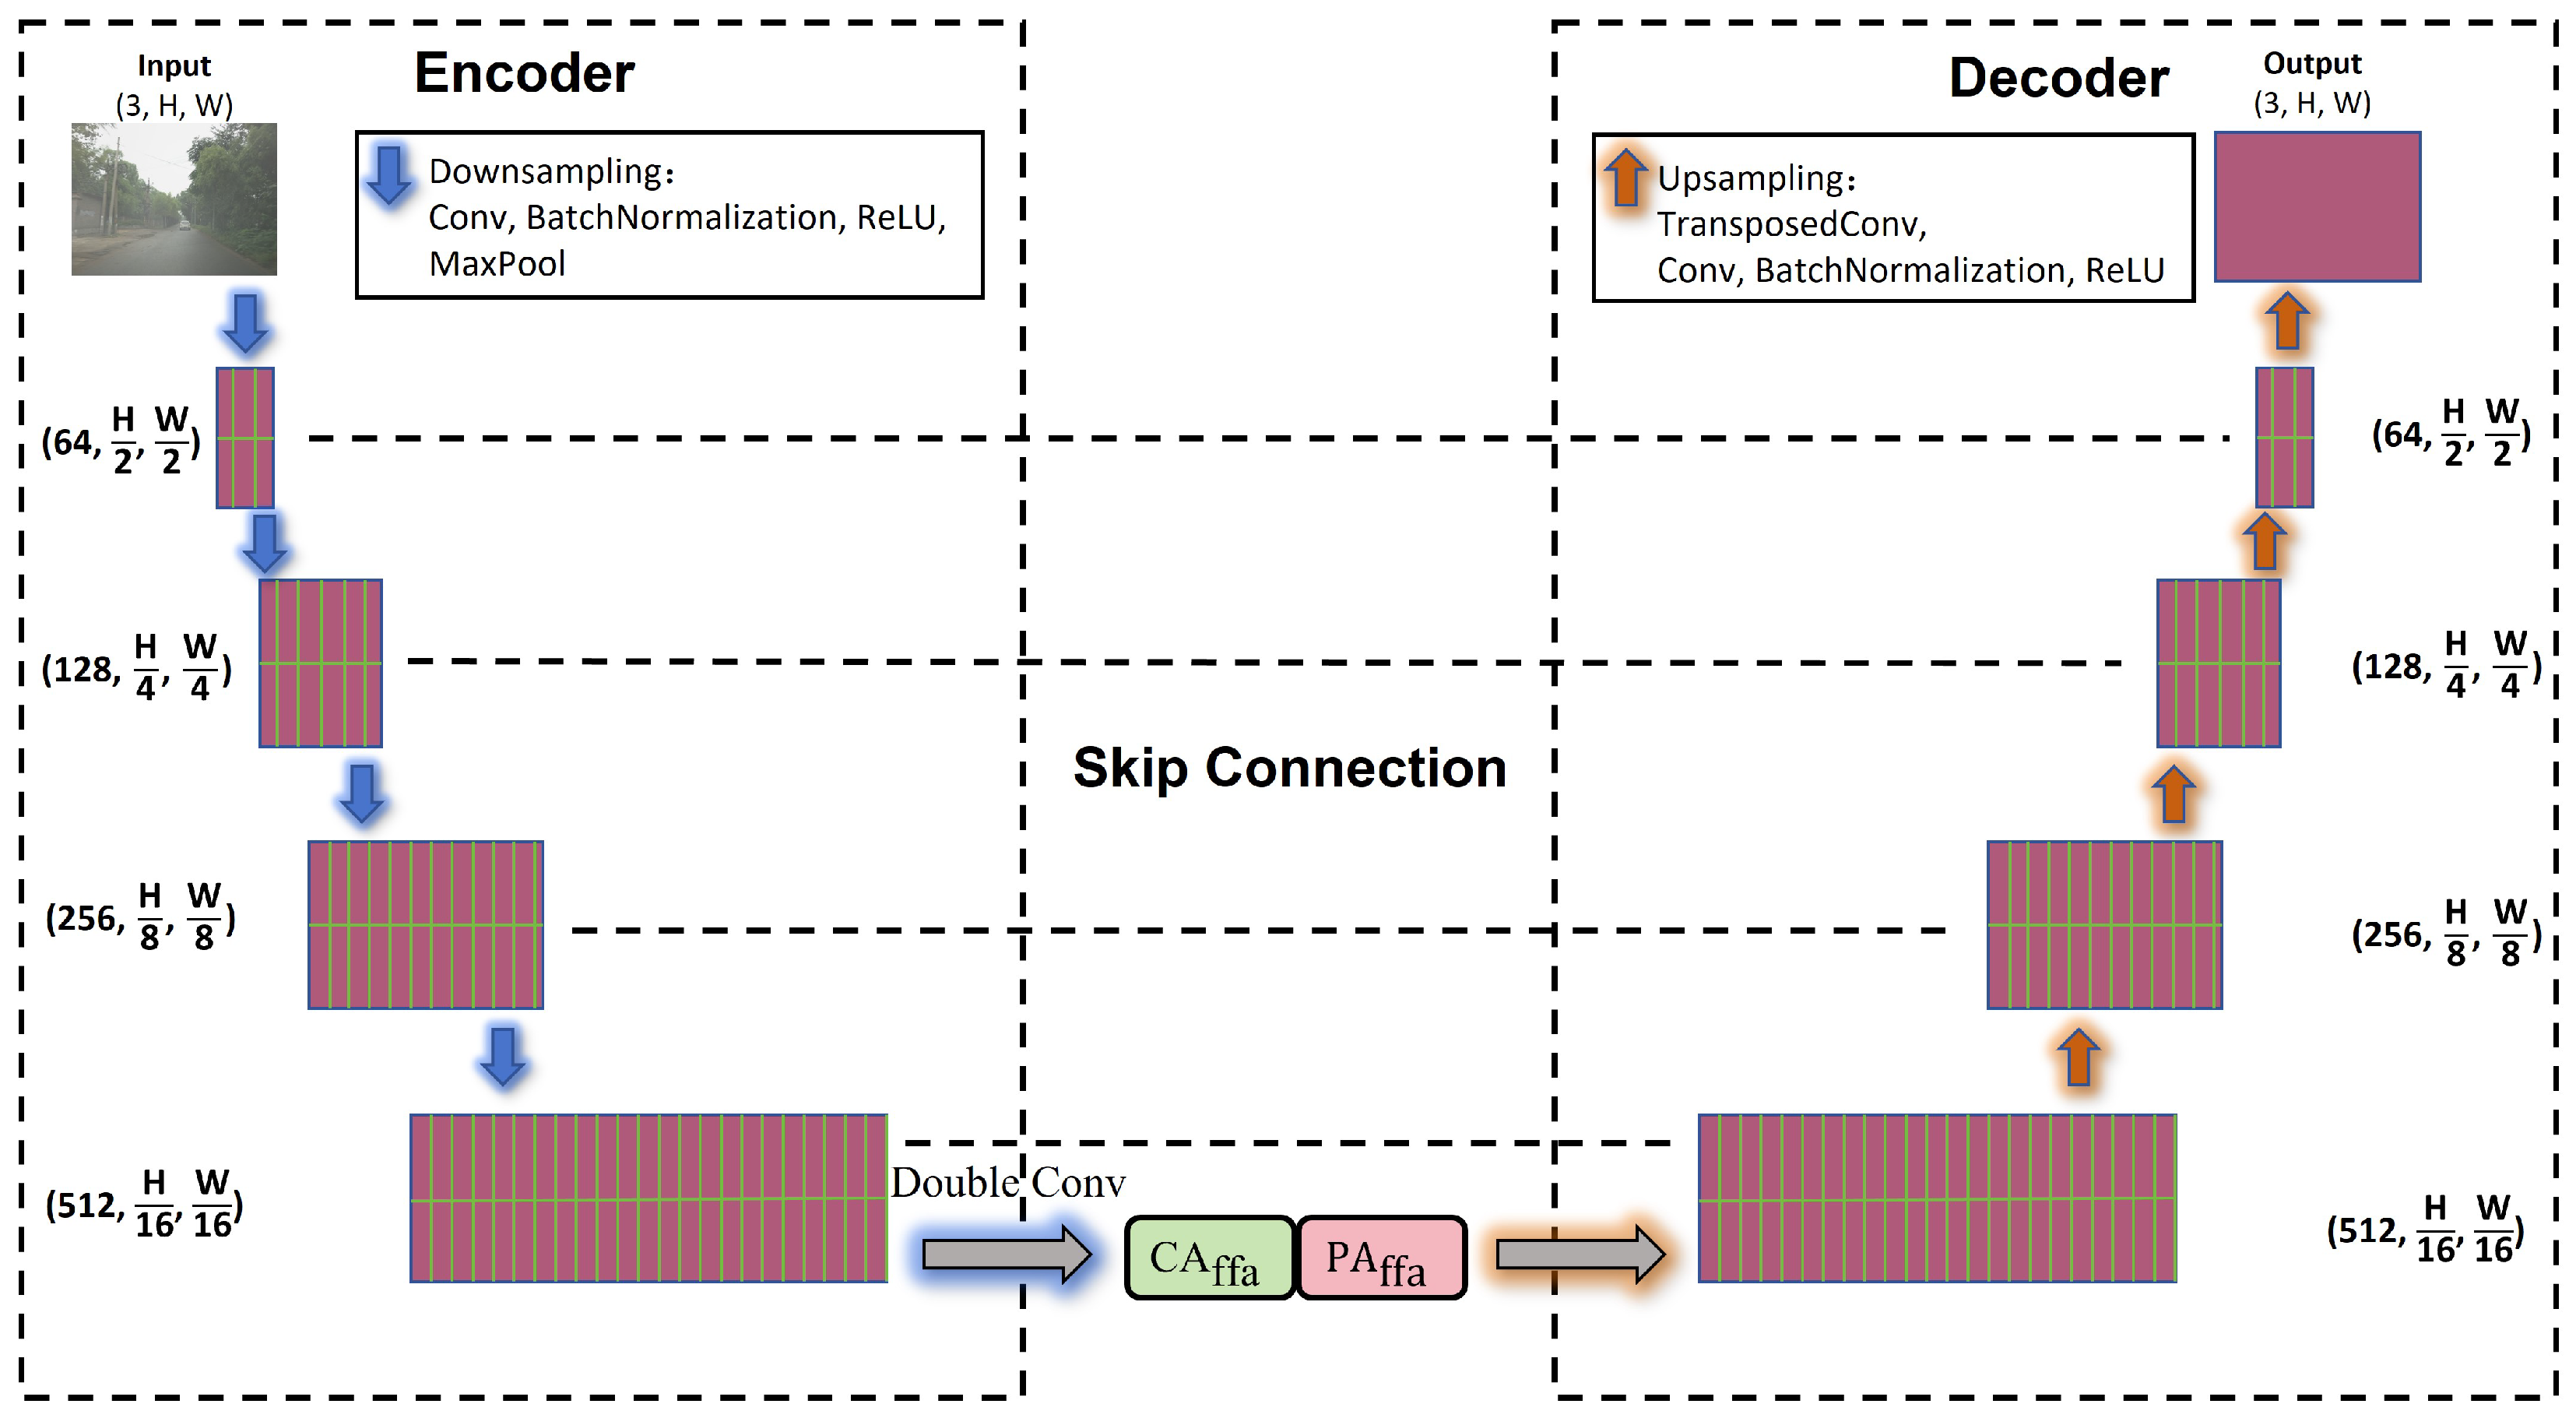
To this end, we first developed a specialized correction network, namely, the Streetscape-Correction Network (SCP-Net). SCP-Net employs an encoder–decoder architecture, where the encoder is based on ResNet and the decoder consists of multiple upsampling layers with skip connections. Additionally, it innovatively incorporates a multiloss function. This network effectively mitigates the issues of misclassification and omission of vegetation in boundary regions during image segmentation using SAM, while enabling directional correction through a dual-error correction mechanism. On the other hand, we designed the Weather-Robust Preprocessing Module (WRPM) to counteract the degradation of street view data quality caused by climatic factors. The WRPM adopts a parallel dual-branch structure for feature extraction, utilizing dense haze region processing network (FFA-Net) and light haze region processing network (LS-UNet) to, respectively, extract dense fog and light fog features from images. These branches enable dedicated processing pathways tailored to different fog concentration levels. Following feature extraction, the feature fusion module (FIM) adaptively fuses the extracted information. The WRPM not only effectively removes foggy regions from images but also preserves the original details of the image to the greatest extent possible. The low cost of training and the high inference efficiency of the backbone network suggest that its application in practice is both feasible and beneficial. We refer to this integrated approach as Urban Green Space SAM (UGSAM).
The main contributions of this work are as follows:
1.
Due to the variable climate in cities, rainy and foggy weather greatly affects the clarity of urban street scene images. Currently, there are few algorithm models for all-weather urban vegetation positioning. We propose a high-precision urban vegetation positioning algorithm UGSAM that can perform well in bad weather. The UGSAM consists of a multimodal large model SAM, a defogging module WRPM, and a correction network SCP-Net. We find that this algorithm performs excellently in bad weather and also has certain performance improvements in normal weather.
2.
To ensure that the UGSAM can maximize defogging while minimizing the damage to the original features of the image, we propose a dual-branch structure WRPM based on channel attention and pixel attention. WRPM includes the dense fog feature network FFA-Net and the light fog feature network LS-UNet, which can fully extract the diverse features of the image. Finally, the features are fused through FIM to achieve refined defogging. To further improve the positioning accuracy, we trained the correction network SCP-Net to conduct a secondary verification on the segmented image, obtaining more accurate results.
3.
The experimental results show that the UGSAM has the best positioning accuracy in all weather conditions. Meanwhile, it requires less time for training and inference and has certain transferability, making it suitable for deployment in urban scenarios.

2. Materials and Methods

2.1. Study Area and Data Connection

We selected Chongqing in China as the focus of our research. The street layout in the central urban area of Chongqing is complex and changeable, which can well test the performance of the model. For the purpose of this study, we gathered streetscape imagery of selected urban thoroughfares under typical meteorological conditions from the publicly accessible Baidu Maps platform to serve as the foundational dataset for our experimental analysis. Figure 1 shows the locations of the study areas. We selected the areas with a population concentration of more than 5000 people per square kilometer and land use types of build land and park for the study. Table 1 shows the proportion distribution of data of different climate types in the selected images.
Recognising the substantial influence that climatic variations exert on the urban landscape, we undertook the compilation of an extensive adverse weather street view dataset to enhance the robustness and scientific rigor of our investigation. This dataset encompasses a diverse array of inclement weather scenarios, thereby facilitating a more holistic examination of the multifarious effects that disparate weather conditions impart upon the urban streetscape. The specific details and categorizations of the data are delineated in Table 2.

2.2. Data Preparation

We selected about 3% of the dataset for manual annotation. This part of the data was first segmented using the SAM (ViT-H) to obtain model-generated vegetation regions. Manual corrections were then applied, and correction points were annotated. The correction points are divided into two types. The first type is erroneous segmentation correction points, meaning areas incorrectly classified as vegetation. Equation (1) shows this process. The second category is the correct nonsegmented points. They refer to vegetation regions that were not correctly classified into the set. They are named T. Equation (2) shows this process.
P = i = 1 N V m o d e l i V t r u e i
T = i = 1 N V t r u e i V m o d e l i
V m o d e l i represents the vegetation region divided by the model in the i picture, V t r u e i is the real vegetation region in the i picture, and the error segmentation correction points of all samples form a set P. N is the total number of images processed, and its value is 50. During the manual annotation process, two uniformly trained annotators independently annotated using a cross-validation method. The annotation consistency was evaluated through the kappa coefficient (kappa > 0.85). Disagreements were reviewed by an expert group to form the final annotation results. All annotated data were verified through multiscale IoU and boundary matching degree detection to ensure that the spatial error of the vegetation area was controlled within 5 px.
The street view data was then cropped and regionally matched to the remotely sensed data. The original streetscape data labeled S z × w j represents the data of size z × w numbered j. The s e l e c t function filters the street view data from the study area b t , finally obtaining the image group k 1 , k 2 , , k n of the matched data, labeled S s i z e × s i z e k 1 , k 2 , , k n . The specific method is shown in Equation (3).
S s i z e × s i z e k 1 , k 2 , , k n = s e l e c t S z × w j , b t

2.3. Framework of UGSAM

We propose a UGSAM method based on the deep learning foundation model SAM by using streetscape data for monitoring urban vegetation distribution. Figure 2 shows the overall framework of the UGSAM.
The innovations in the UGSAM mainly include two parts. The first part is the WRPM. It handles image clarity problems caused by bad urban weather and restores images to their normal weather conditions as much as possible. The second part is the SCP-Net. This network uses streetscape data with marked points for training. After the SAM produces segmentation results, SCP-Net corrects these results.

2.4. WRPM: Weather-Robust Preprocessing Module

In urban street scene analysis, severe weather conditions such as haze often lead to significant degradation in image quality, thereby affecting the accuracy of subsequent critical tasks like vegetation segmentation [37]. To address this, we propose the WRPM, which aims to maximize the restoration of image details through efficient dehazing and provide clear and reliable input for subsequent segmentation tasks.
The WRPM module employs a parallel dual-branch structure, designed with specialized processing paths for regions with different haze concentrations. It then achieves adaptive integration of information through feature fusion. The overall architecture mainly consists of three parts. The WRPM module utilizes a multilevel convolutional neural network [38], combining feature fusion attention mechanisms, multiscale feature extraction, and feature fusion strategies, enabling the effective restoration of images in complex haze scenarios. Specifically, it is composed of a dense haze region processing network FFA-Net, a light haze region processing network LS-UNet, and a feature fusion module FIM.

2.4.1. FFA-Net

FFA-Net is responsible for feature recovery in dense haze regions within the WRPM module. We incorporated multiple residual blocks and a feature attention [39,40] mechanism into this network, enabling it to extract deep-level features from images and effectively process areas with heavy haze and blurred features. Additionally, we designed a multilevel convolutional and residual connection structure within the network. This mechanism ensures that the trained network prioritizes key regions with dense haze in the image, aiming to restore details and structures in these heavily obscured areas. Figure 3 illustrates the basic structure of FFA-Net.
The key to the implementation of FFA-Net lies in the feature attention mechanism. We designed two types of attention: Channel Attention ( C A ffa ) and Pixel Attention ( P A ffa ). Equation (4) describes the computation process of Channel Attention, which dynamically adjusts the weights of feature channels to enhance the representation of haze-related feature channels. Equation (5) describes the computation process of Pixel Attention, which allocates attention weights at the pixel level to focus on and enhance features in local pixel regions with higher haze concentration.
C A ffa = σ Conv δ Conv γ ( x ) x
P A ffa = σ Conv δ Conv x x
where x represents the input feature vector, σ denotes the sigmoid activation function, C o n v stands for convolution, δ represents the R e L U activation function, γ indicates average pooling, and ⊙ signifies element-wise multiplication. The group structure is composed of multiple block residual modules connected in series, along with skip connections, which enhance the main network’s ability to recover dense haze regions. The outputs of the three-layer group modules are combined and then processed through the feature attention module. This result is further integrated with the initial image via a global residual connection to produce the desired output.

2.4.2. LS-UNet

For regions with light haze in the image, we designed an attention-driven dehazing network based on UNet [41]. Building upon the classic UNet encoder–decoder structure, we innovatively integrated the channel attention mechanism ( C A ffa ) and the pixel attention mechanism ( P A ffa ), forming an attention-enhanced deep architecture. Figure 4 illustrates the processing flow of input features within this module.
During the downsampling phase of LS-UNet, low-dimensional features are extracted through consecutive convolutional operations, gradually reducing the spatial dimensions. In the middle part of LS-UNet (i.e., the bottleneck layer), we enhanced its design by introducing a dual-attention architecture that combines the channel attention mechanism and the pixel attention mechanism. The channel attention mechanism dynamically adjusts the weights of feature channels, focusing on more important feature channels to better preserve key information in light haze regions. The pixel attention mechanism enhances the ability to capture detailed features through local feature aggregation, providing richer feature representations for the subsequent decoding phase. During the upsampling phase, deconvolution operations are combined with features from corresponding layers to help restore image details and edges. This design enables the network to excel in detail recovery and edge preservation in light haze regions.
Notably, the introduction of the attention mechanism allows the network to adaptively aggregate features and selectively focus on multiscale features, emphasizing critical aspects such as image structure and texture information while suppressing irrelevant noise. This results in finer image restoration in light haze scenarios, providing clearer image input boundaries for subsequent UGSAM urban vegetation segmentation and effectively improving segmentation accuracy.

2.4.3. FIM

To make full use of the two paths of features extracted from the FFA-Net and LS-UNet paths, we designed the FIM. This module adopts a multilevel attention mechanism to adaptively fuse and weight-fuse feature information at the spatial, channel, and pixel levels. In this way, the FIM can effectively integrate feature information of hazy regions with different concentrations. It ensures the overall clarity of the image and avoids the possible local detail loss or information redundancy that may occur when processing with a single path.
The most significant innovation of the FIM is the design of a multilevel attention mechanism. In this module, we redefined the channel attention and pixel attention. Moreover, according to the characteristics of streetscape data, we introduced the spatial attention mechanism to learn the spatial dimension information of the city.
Channel attention C A fim weights each channel through global context information. It assigns weights to different channels according to their importance, enhancing the global consistency and semantic information of the feature representation and improving the feature capture ability of channels. The processing of input features by it is reflected in Equation (6).
C A fim = Conv δ Conv γ ( x )
Spatial attention S A fim captures important spatial positions in the image by calculating the channel average and maximum values. It adjusts the feature weights of each position according to the spatial distribution of the image, enhancing the feature representation of the haze-covered areas and improving the ability of model to recognize haze. The processing of input features by it is reflected in Equation (7). Here, β represents the max-pooling operation, and C o n c a t represents the channel concatenation operation.
S A fim = Conv Concat β ( x ) , γ ( x )
Pixel attention P A fim combines spatial and channel information to refine processing at the pixel level. It enhances image details and edge features by refining each pixel position, resulting in a clearer and more natural dehazed image. Equation (8) demonstrates the processing of input features by the pixel attention ( P A fim ) module. Here, σ represents the sigmoid activation function, the unsqueeze operation is used to add a dimension, and rearrange denotes the tensor dimension rearrangement operation, which is used to restore the original dimensions.
P A fim = σ Conv Rearrange [ Unsqueeze ( x ) , Unsqueeze ( y ) ]

2.4.4. Defogging Process

For the processing pipeline of streetscape data affected by adverse weather conditions, the WRPM module employs a collaborative mechanism of dual-path parallel processing and adaptive feature fusion. The input hazy image undergoes feature extraction through a dual-branch structure, which involves two specific processes: dual-branch feature extraction and module feature fusion.
Step 1: Dual-branch feature extraction. The input image is simultaneously fed into two branches: the dense fog processing branch and the light fog processing branch. In the dense fog branch, FFA-Net constructs a deep feature extractor through cascaded residual blocks. Each residual block integrates C A ffa and P A ffa in an embedded manner, enabling dynamic weight allocation for feature channels and pixel-level spatial focus. The light fog processing branch adopts an LS-UNet network with a symmetric structure. The feature representation capability is enhanced using the method described in Equation (9).
F middle = P A ffa C A ffa DoubleConv F enc
Among them, F enc is the feature output by the encoder. C A ffa and P A ffa adopt the channel attention and pixel attention mechanisms in FFA-Net. D o u b l e C o n v represents two consecutive C o n v operations. In the decoding stage, transposed convolution is used for the upsampling operation, and the feature of the corresponding encoding layer is concatenated in channels through skip connection. This structure retains high-frequency details. At the same time, through multiscale feature fusion, it enhances the texture restoration ability of the hazy area.
After the dual-branch feature extraction, we obtain the feature maps F ffa R C × H × W and F unet R C × H × W from the corresponding dual-branch of image output. These feature maps are then input into the FIM. This module performs feature integration through a three-stage attention mechanism, ultimately generating the output. The module first generates the base fused features by element-wise addition, as shown in Equation (10), where ⊕ denotes element-wise addition.
F base = F ffa F unet
Step 2: Module feature fusion. After generating the base fused features, we optimize the features using a dual attention mechanism. First, channel attention is applied by performing global average pooling on the base fused features, followed by two convolutional layers and nonlinear activation functions to generate channel weights W c , which capture the importance of each channel. Then, spatial attention is applied by performing max pooling and average pooling on the base fused features, concatenating the two pooling results, and using a convolutional layer to generate spatial weights W s , which focus on critical spatial regions. Finally, through the process in Equation (11), the base fused features are combined with the channel weights and spatial weights. Through convolution and activation functions, pixel-level fusion weights W p are generated, enabling adaptive pixel-level fusion to obtain F fusion .
F fusion = F base ( W p F ffa ) ( ( 1 W p ) F unet )
The final output is corrected through convolution to obtain F output , as shown in Equation (12).
F output = Conv ( F fusion )
The streetscape data, formatted as S s i z e × s i z e k 1 , k 2 , , k n , undergoes processing through the WRPM method. Upon completion of the dehazing process, the resulting data is obtained in the form of S w s i z e × s i z e k 1 , k 2 , , k n , representing the state of the image after haze removal.

2.5. SCP-Net: Streetscape-Correction Network

SCP-Net is a deep learning algorithm specifically designed for segmentation correction of street view images, designed to correct errors in segmentation results generated by the SAM. SCP-Net is trained by using streetscape data from labeled false segmentation points and correct but unsegmented points to achieve accurate correction of segmentation results.
The training data of SCP-Net consists of two parts. The training dataset is expressed as D = { ( x i y i ) } i = 1 N , where x i is the input image and y i is the corresponding correction label (binary mask). In the correction label y i , 0 represents the region of the P set in Equation (1), and 1 represents the region of the T set in Equation (2).
SCP-Net uses an encoder–decoder structure, and the encoder is partly based on ResNet, a pretrained convolutional neural network used to extract multiscale features from input images. The decoder part consists of multiple upper sampling layers and skip connections, which are used to gradually recover the spatial resolution and generate the corrected segmentation mask. The loss function of SCP-Net consists of two parts: cross-entropy loss and Dice loss, which are used to deal with the class imbalance problem and improve the accuracy of segmentation boundary, respectively. Cross-entropy loss is calculated by Equation (13) and Dice loss is calculated by Equation (14), where y ^ i is the result of prediction correction of the input image x i .
L CE = 1 N i = 1 N y i log ( y ^ i ) + ( 1 y i ) log ( 1 y ^ i )
L Dice = 1 2 i = 1 N y i y ^ i i = 1 N y i + i = 1 N y ^ i
Equation (15) shows the definition of the total loss function, where λ is the weight coefficient that balances the effects of the two losses.
L = λ · L CE + ( 1 λ ) · L Dice
SCP-Net optimizes network parameters θ through backpropagation algorithms. Specifically, the update rules of network parameters are shown in Equation (16), where η is the learning rate and θ L is the gradient of the loss function over the network parameters.
θ θ η θ L
In the training process, the Adam optimizer is used to update the parameters, and the learning rate attenuation strategy is set to improve the training stability. In addition, data enhancement techniques (random rotation, scaling, and flipping) are applied to the training data to enhance the generalization ability of the model.
After SCP-Net completes training, it is set after the SAM decoder. The defogged streetscape data S w s i z e × s i z e k i is input into the visual encoder of the SAM, forming the feature vector I n × t o k e n s , as shown in Equation (17).
I n × t o k e n s = V i s u a l E n c o d e r S w s i z e × s i z e k i
The SAM possesses a specialized prompt encoder capable of accepting various forms of prompt information (point, text, box) to assist the model in segmenting specified areas. We configure the text prompt parameter t e x t with vegetation-related cue words (tree, grass, vegetation), which are then fed into the prompt encoder according to Equation (18), resulting in the prompt feature vector P n × t o k e n s .
P n × t o k e n s = P r o m p t E n c o d e r t e x t
The SAM ultimately outputs the segmentation result through the decoder. In Equation (19), it generates the initial segmentation mask M SAM , where M SAM represents the vegetation region.
M S A M = M a s k D e c o d e r I n × t o k e n s , P n × t o k e n s
SCP-Net corrects the initial segmentation mask M SAM . The encoder part of SCP-Net extracts multiscale features from M SAM . The decoder part fuses features of different scales through skip connections, gradually restoring spatial resolution. Finally, it outputs the corrected segmentation mask M SCP . The correction parameters are presented in Equation (20), where f SCP is the correction function of SCP-Net, and θ represents the trained network parameters.
M SCP = f SCP ( M SAM , θ )
Through the aforementioned steps, SCP-Net corrects the segmentation results of SAM. SCP-Net can identify and rectify missegmented points in the SAM model as well as real vegetation areas that were not accurately segmented. The portion corresponding to M SCP represents the final segmented vegetation region.

3. Results

As we aimed to explore the superiority of the UGSAM in the field of urban streetscape data analysis through various experimental methods, the comparative experiments and ablation experiments were designed. In the comparative experiments, we selected widely recognized state-of-the-art methods from published research as benchmark models. Specifically, we compared the performance of these benchmark models with the UGSAM across multiple tasks: dehazing effectiveness, green space segmentation accuracy under normal weather conditions, and green space segmentation accuracy under adverse weather conditions. In the ablation experiments, we compared the performance of the original and improved versions of each component of the UGSAM. These experiments were designed to validate the advantages of the UGSAM in addressing extreme urban weather conditions and complex terrain scenarios.

3.1. Experimental Setup

3.1.1. Experimental Configurations

In this study, the experimental platform uses an Intel(R) Xeon(R) Gold 6248R CPU (Intel Corporation, Beijing, China) with 72 GB of memory. The GPU is NVIDIA RTX4090 (NVIDIA Corporation, Beijing, China). The operating system is Ubuntu 20.04, PyTorch 2.3.0, Python 3.9, and CUDA version is 11.8. For network training, the learning rate is set to 1 × 10 3 , batch size is 16, epochs are 500, the optimizer is Adam, and L1 regularization is applied.

3.1.2. Metrics

The main evaluation metrics of this study are listed in Table 3. First, the primary function of the UGSAM is to segment vegetation areas in streetscape images, so we need to evaluate the accuracy of image segmentation. The image segmentation metrics include OA (overall accuracy), mIoU (mean intersection over union), recall, and precision. Second, the function of the WRPM within the UGSAM is to dehaze urban streetscape images, and its performance needs to be assessed. The evaluation metrics for this include MSE (mean squared error), PSNR (peak signal-to-noise ratio), SSIM (structural similarity index measure), and LPIPS (learned perceptual image patch similarity).

3.2. Comparative Experiments

To comprehensively evaluate the performance of different methods in the task of vegetation region segmentation in street view data, we designed and conducted a series of comparative experiments. The experiments consist of two main parts: the first part compares the performance of dehazing networks, and the second part compares the overall segmentation effectiveness of the UGSAM.
In the dehazing network performance comparison experiment, we compared our designed dehazing network, WRPM, with several state-of-the-art methods, including DCP [29], AOD-Net [30], EMRA-Net [31], GCANet [32], Dehamer [33], DehazeFormer [34], and PMNet [35]. In the segmentation effectiveness comparison experiment, we evaluated the urban street view green space segmentation network, the UGSAM, against K-means, FCN [13], PointNet++ [14], and the SAM [22] under both normal weather conditions and adverse weather conditions.
For each method, we trained and tested the models using the same street view dataset under identical hardware and software configurations to ensure a fair comparison. To quantitatively assess the segmentation performance of each method, we selected representative evaluation metrics.

3.2.1. Dehazing Effectiveness

Table 4 provides a detailed list of performance metrics for the model in image dehazing.
The WRPM significantly outperforms other methods in terms of MSE, PSNR, and SSIM, achieving 52.3697, 30.94, and 0.9728, respectively. This indicates that the WRPM can more effectively restore image details and structural information, producing dehazing results that are closer to real haze-free images. Additionally, the LPIPS value of the WRPM is 0.0067, significantly lower than other methods, showing that its dehazed images are more perceptually close to real images with richer details. The above results show that the difference between the dehazed images generated by the WRPM and real haze-free images is the smallest. Overall, the WRPM demonstrates superior performance in dehazing compared to other methods, proving its effectiveness in handling complex hazy scenes.
To intuitively demonstrate the effectiveness of WRPM, we show the application examples of five fog removal methods on some images in Figure 5, Figure 6 and Figure 7.
As illustrated in Figure 6, although the DCP algorithm achieves relatively thorough haze pixel removal, this comes at the expense of significant original detail loss, resulting in severe color distortion in the restored image. While AOD-Net partially alleviates the color distortion issue, it still suffers from an overall dark color cast and persistent detail loss. In contrast, the proposed WRPM demonstrates exceptional performance in both detail recovery and color restoration. The generated images exhibit enhanced clarity in texture representation and more natural color reproduction, achieving visual quality that substantially outperforms both the DCP and AOD-Net algorithms. The restored results closely approximate real scenes, indicating the superior capability of WRPM in maintaining photorealistic fidelity during the dehazing process.
The selected hazy image in Figure 7 represents a typical scenario with nonuniform haze density distribution between distant and nearby areas. While the distant regions suffer from extremely dense haze, the foreground areas exhibit relatively light fog contamination. As shown in Figure 7, EMRA-Net demonstrates moderately effective haze removal in nearby regions but shows significant limitations in addressing dense haze within distant areas, manifesting substantial residual haze artifacts. GCANet, conversely, overly concentrates on distant haze elimination, resulting in suboptimal restoration of foreground regions where considerable haze persists, particularly evident in the building area marked by the red rectangle.
In comparison, the proposed WRPM achieves more balanced dehazing performance. Our method not only demonstrates remarkable haze removal capability in distant heavy-haze regions (as indicated by the blue frame), it also maintains superior restoration quality in near-view areas. The foreground building within the red frame exhibits minimal haze residue with clear detail restoration and natural color reproduction, closely resembling haze-free reference images. This comparative analysis indicates that the WRPM effectively addresses the challenging task of nonuniform haze distribution by adaptively balancing regional restoration priorities, thereby achieving comprehensive haze removal across both distant and nearby regions.

3.2.2. Green Space Segmentation Accuracy

We compared the accuracy of K-means, FCN, PointNet++, the SAM, and the UGSAM in segmenting green regions in images under normal weather conditions. Through this performance evaluation, we aimed to demonstrate the superiority of the UGSAM in the field of green region segmentation. Table 5 provides a detailed comparison of the performance metrics of these models for green region segmentation in streetscape data under normal weather conditions.
The UGSAM achieved an OA of 0.8776, which represents a 7.15% improvement over PointNet++ and a 1.03% improvement over the SAM. Its mIoU reached 0.8681, showing an 8.25% improvement over PointNet++ and a 1.25% improvement over the SAM. The recall score of 0.9634 indicates that the model excels at detecting vegetation regions to the greatest extent. Additionally, the UGSAM achieved a precision score of 0.8977, surpassing all other models. The final results demonstrate that the UGSAM significantly improves segmentation accuracy compared to K-means, FCN, PointNet++, and the SAM, highlighting its superior performance in green region segmentation tasks.
Figure 8 shows an example of the original data input. We spatially matched the acquired street view data and ultimately formed a 360-degree panoramic input image.
Figure 9 shows the streetscape data completed by UGSAM segmentation. As can be seen from the images, the UGSAM demonstrates powerful performance, with extremely high accuracy in segmenting objects.
After completing the segmentation, the mask decoder of the UGSAM segments the specified regions based on the prompt information encoded in the prompt encoder. Figure 10 displays the final segmented vegetation areas.
Meanwhile, under adverse urban weather conditions, we compared the accuracy of K-means, FCN, PointNet++, the SAM, and the UGSAM in segmenting green regions in images. Through this performance evaluation, we aimed to demonstrate the capability of the UGSAM to handle diverse and challenging urban climate conditions. Table 6 provides a detailed comparison of the performance metrics of these models for green region segmentation in streetscape data under adverse weather conditions.
The UGSAM achieved an OA of 0.8615, an mIoU of 0.8490, a recall of 0.9345, and a precision of 0.9027, outperforming all other models. The accuracy of other models significantly decreases compared to their performance under normal weather conditions. The final results indicate that, compared to K-means, FCN, PointNet++, and the SAM, the UGSAM delivers the most outstanding performance in adverse weather scenarios, further validating its robustness and effectiveness in challenging environments.
Figure 11 demonstrates the segmentation results of images under adverse weather conditions, both with and without the WRPM module. As can be observed from the figure, the original images exhibit a certain degree of haze, resulting in reduced clarity. In the segmentation results of the images without WRPM processing, some trees are not identified, and multiple trees are incorrectly grouped into a single object. Additionally, the distinction between trees and buildings is not clearly defined. However, after applying WRPM for haze removal, these issues are significantly alleviated, and the segmentation accuracy is largely restored to the level achieved under normal weather conditions.
Figure 12 presents a detailed comparison, illustrating the segmentation results of images under adverse weather conditions with and without the WRPM module. From the left-side images, it can be observed that after WRPM processing, the vegetation areas are correctly segmented, whereas the original image fails to achieve the segmentation target. From the right-side images, it is evident that only a small portion of the vegetation area is segmented in the unprocessed image, with the majority of the vegetation regions remaining unrecognized by the model. In contrast, the processed image successfully segments all vegetation areas, with clear boundaries between trees distinctly visible.
Figure 13 provides a detailed comparison, showcasing the segmentation results with and without the application of SCP-Net. The differences within the black boxes prominently highlight the effectiveness of SCP-Net. In the image without SCP-Net processing, certain vegetation areas are missed during segmentation. However, after correction, the previously unsegmented regions are accurately segmented, successfully improving the overall segmentation accuracy.

3.3. Ablation Experiments

3.3.1. WRPM

To verify the effectiveness of the WRPM, we conducted ablation experiments on the UGSAM framework. The experimental group removes the WRPM component while retaining other identical network structures, with comparative tests conducted on mixed datasets containing both normal and severe weather conditions and adverse weather street scenes in a ratio of 2:1. This design aims to isolate the specific contribution of the WRPM in enhancing segmentation robustness.
As shown in Table 7, the experimental results demonstrate significant performance improvements after incorporating the WRPM. In the defogging module of the UGSAM, the use of the WRPM leads to superior performance in all four metrics—OA, recall, precision, and mIoU—compared to using FFA-Net or LS-UNet alone. Specifically, OA improves by 1.17% and 0.89%, respectively. Meanwhile, experiments on FCN and PointNet++ also validate the generalizability of these results. Although the recall of WRPM applied to FCN is slightly lower than that of FFA-Net, the difference is only 0.39%, and all other metrics show improvement. This experiment indicates that the WRPM, which integrates FFA-Net and LS-UNet, is the optimal choice as a defogging module.

3.3.2. SCP-Net

An important aspect of our study is the use of SCP-Net to correct the results of SAM segmentation to improve accuracy. To test the impact of this module on UGSAM performance, we designed an ablation experiment. We tested among FCN, PointNet++, and the UGSAM, where the experimental group removes the SCP-Net and the control group retains the SCP-Net, to analyze the pattern of change in model performance. The data used for the test consisted of normal weather street scenes and adverse weather street scenes in a ratio of 2:1.
Table 8 shows the experimental results for different models and schemes. We conducted four sets of experiments, and the experimental results show that after using SCP-Net for correction, the OA of FCN is improved by 0.58%, the mIoU is improved by 0.47%, and both recall and precision are improved. The OA of PointNet++ is improved by 0.94%, mIoU is improved by 1.58%, and recall and precision are improved significantly. The OA of the UGSAM is improved by 1.04%, mIoU is improved by 0.61%, and recall and precision are also improved significantly. The experimental results show that the addition of SCP-Net helps to correct the image segmentation results and improve the segmentation accuracy.
Another key innovation of SCP-Net lies in its multicomponent loss function, which combines cross-entropy (CE) and Dice loss. To investigate the influence of different loss functions on the performance of the UGSAM, a second ablation study was designed. Four experimental groups were established: Group 1 employed focal loss, Group 2 used standalone CE loss, Group 3 utilized standalone Dice loss, and Group 4 integrated all three loss functions. The control group replicated the original methodology, combining CE and Dice loss. The data used for the test consisted of normal weather street scenes and adverse weather street scenes in a ratio of 2:1.
Table 9 presents the experimental results for different models and configurations. It can be observed that when using the combination of CE loss and Dice loss, PointNet++ achieves the best performance across all four metrics. FCN and the UGSAM achieve the best results in OA, recall, and mIoU, but their precision is slightly lower than that of the combination of all loss functions.
Among the two metrics, recall and precision, recall reflects the proportion of actual positive samples that are correctly predicted, while precision focuses on the proportion of predicted positive samples that are actually positive. We prioritize models with higher recall because, in large-scale data, it is extremely difficult to manually identify vegetation areas that are not detected, whereas identifying errors in already segmented regions is easier due to the smaller area that needs to be checked.

4. Discussion

4.1. Analysis of Method Performance Superiority

This study demonstrates the significant advantages of the UGSAM model in image defogging and semantic segmentation tasks through multidimensional metrics. The WRPM module within UGSAM employs a dual-channel branch structure to process dense fog and light fog regions in images in parallel, and subsequently integrates the extracted features via a fusion module. This approach maximizes defogging effectiveness while preserving as many original image characteristics as possible. The WRPM is capable of addressing images with reduced clarity caused by adverse weather conditions such as rain and fog, thereby enhancing the accuracy of vegetation localization. Additionally, the SCP-Net component of the UGSAM refines the segmentation results produced by the SAM, further improving localization precision.
In the comparative experiments, on one hand, we conducted a performance comparison between the defogging WRPM and other defogging networks. The results are presented in Table 4. In the experimental results, the LPIPS metric indicates that the defogged images by the WRPM are perceptually closer to ground truth and possess richer details. The results of SSIM and PSNR suggest that the defogged images generated by the WRPM have the minimal difference from the ground truth. In
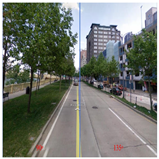
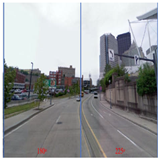
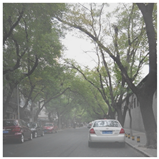
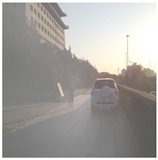
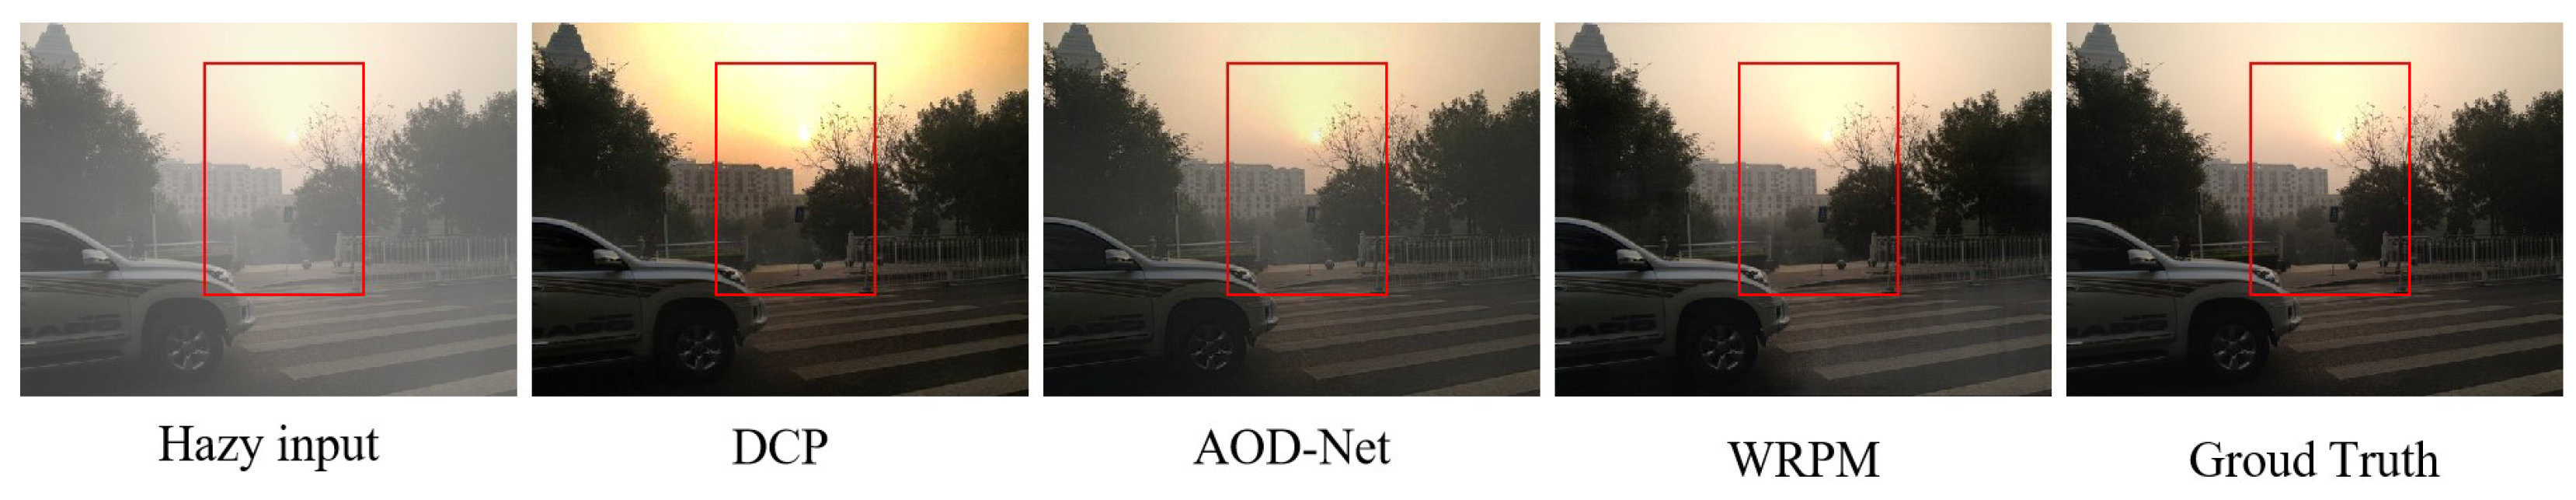
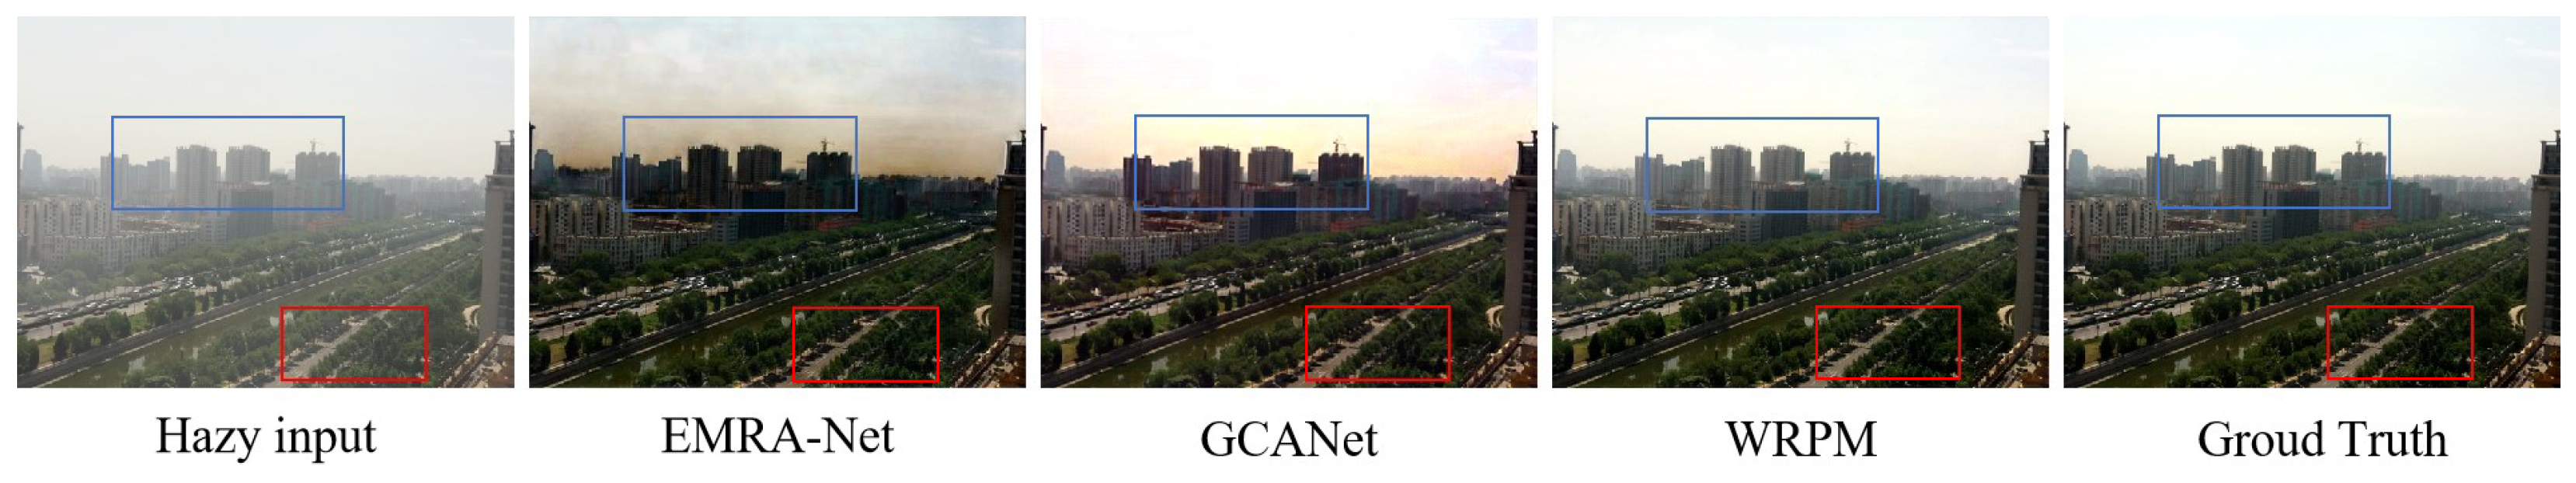
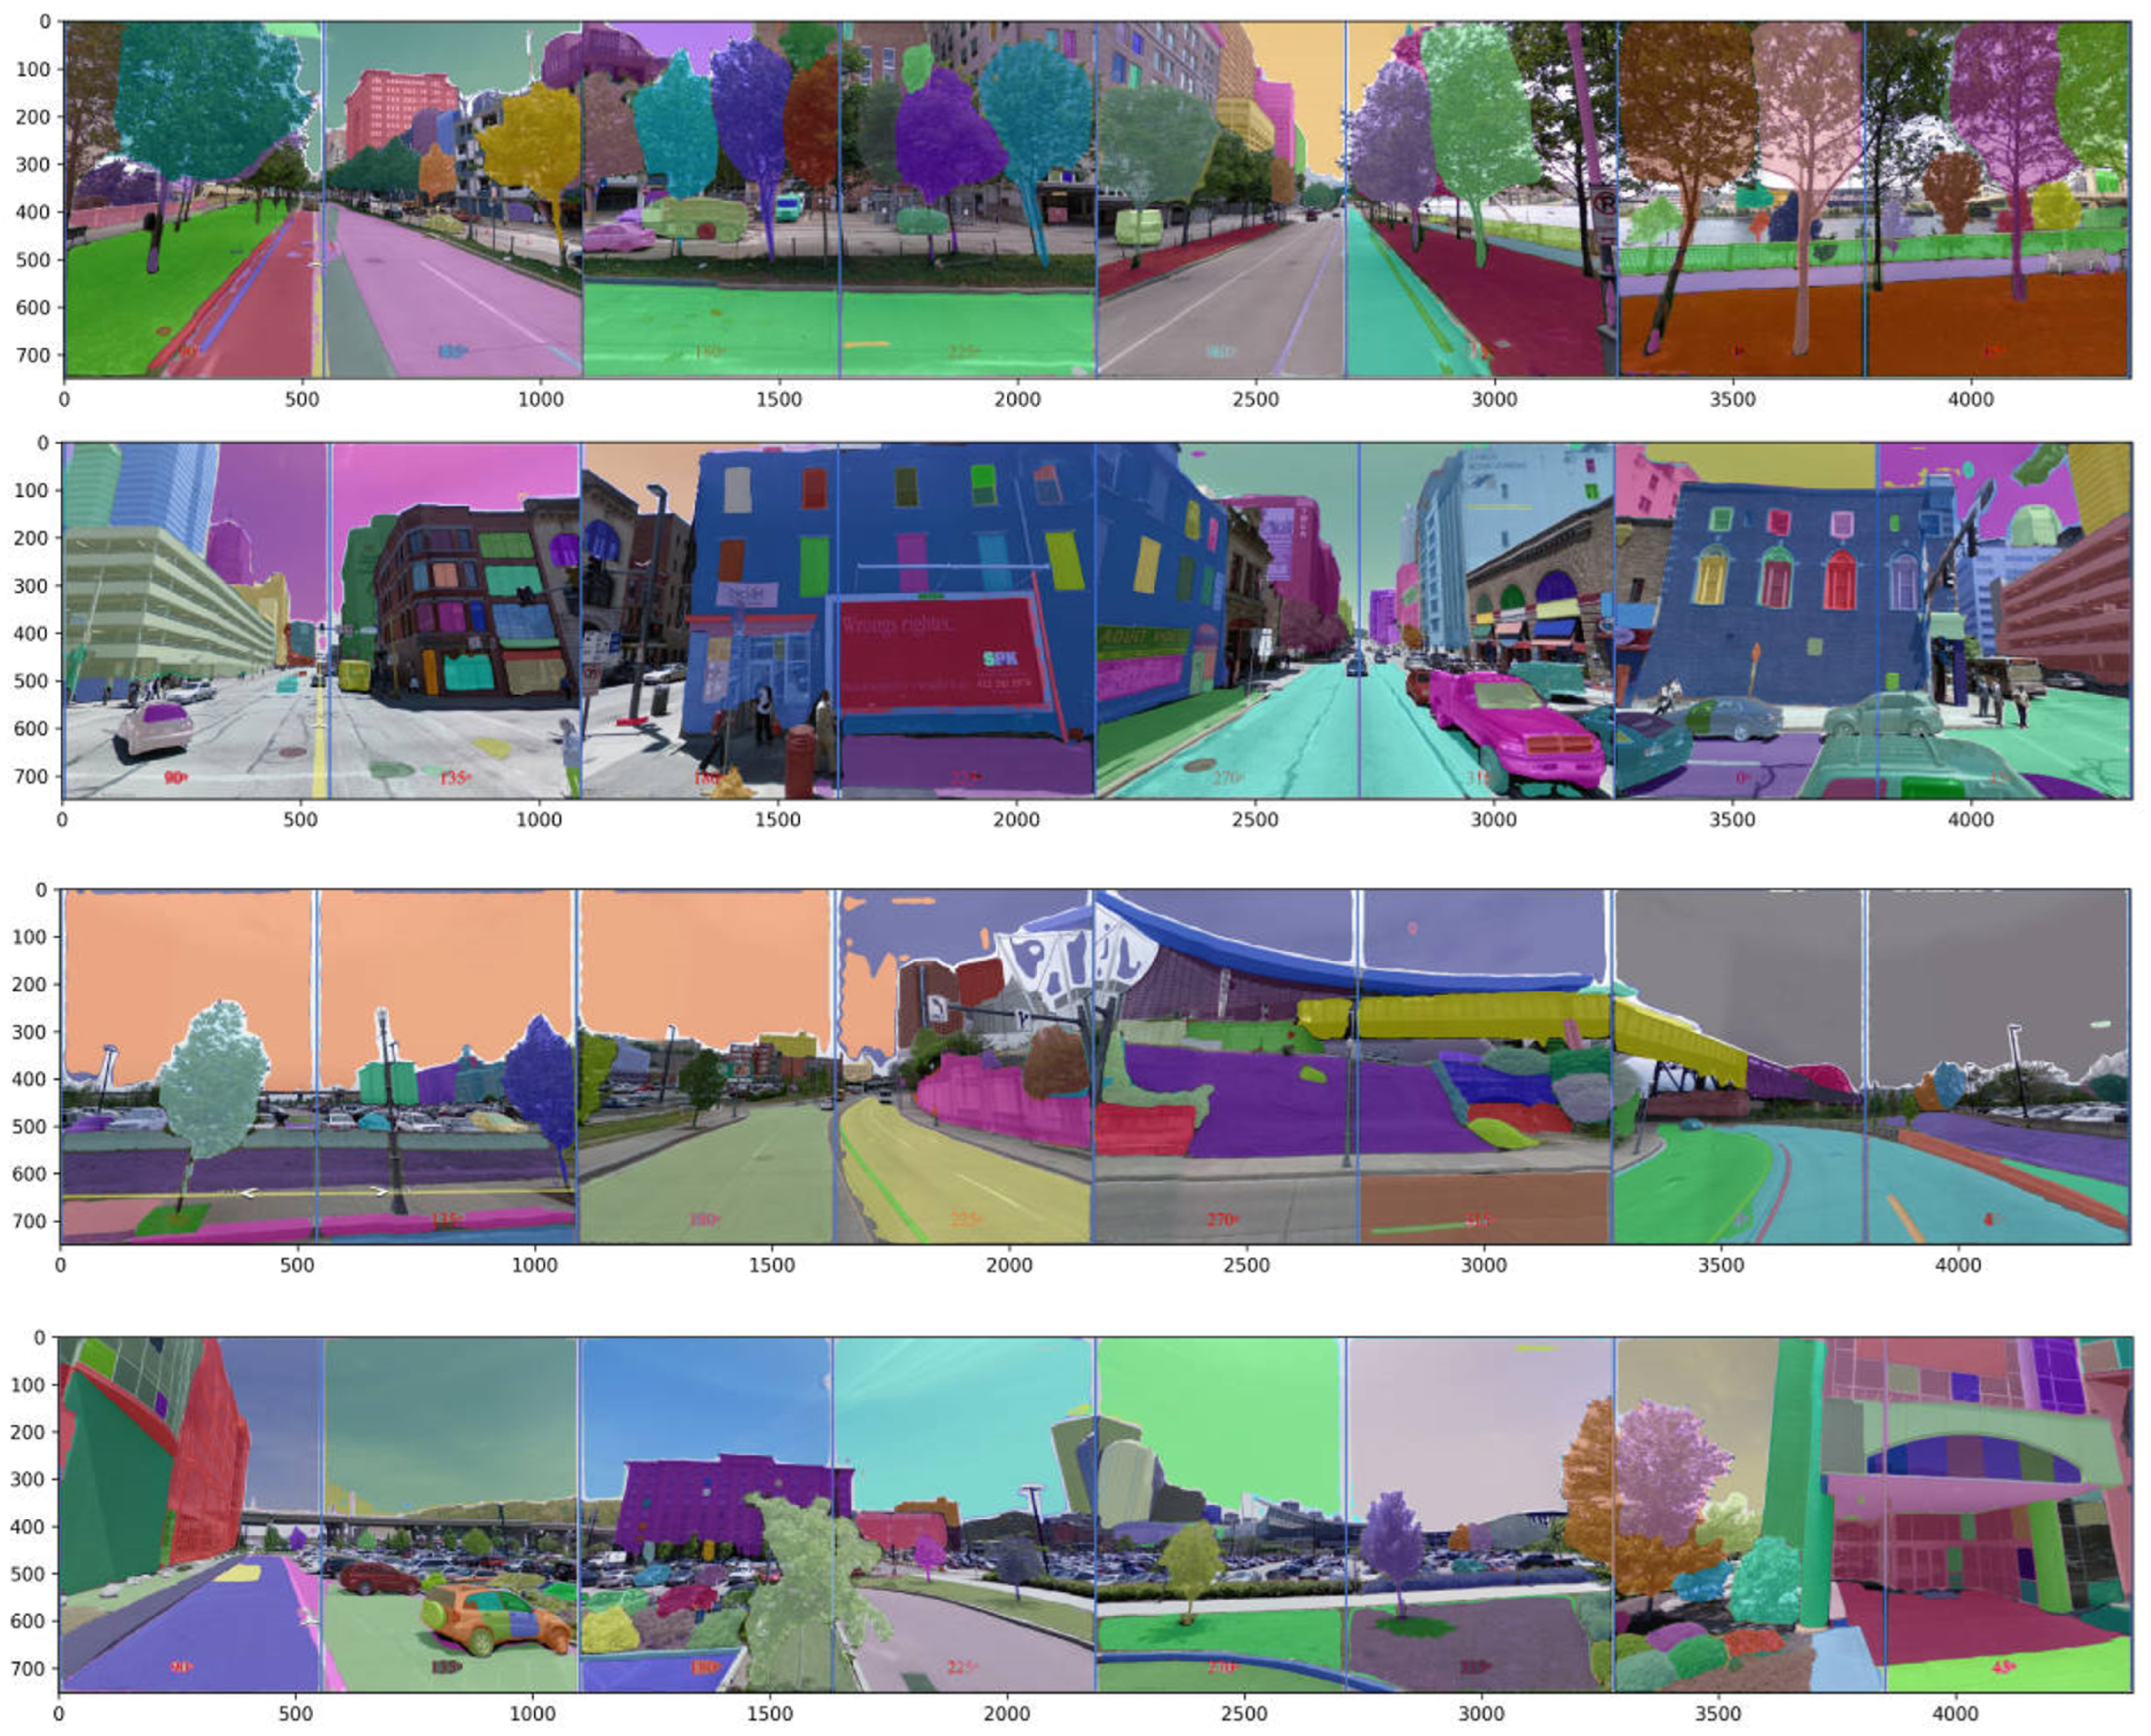
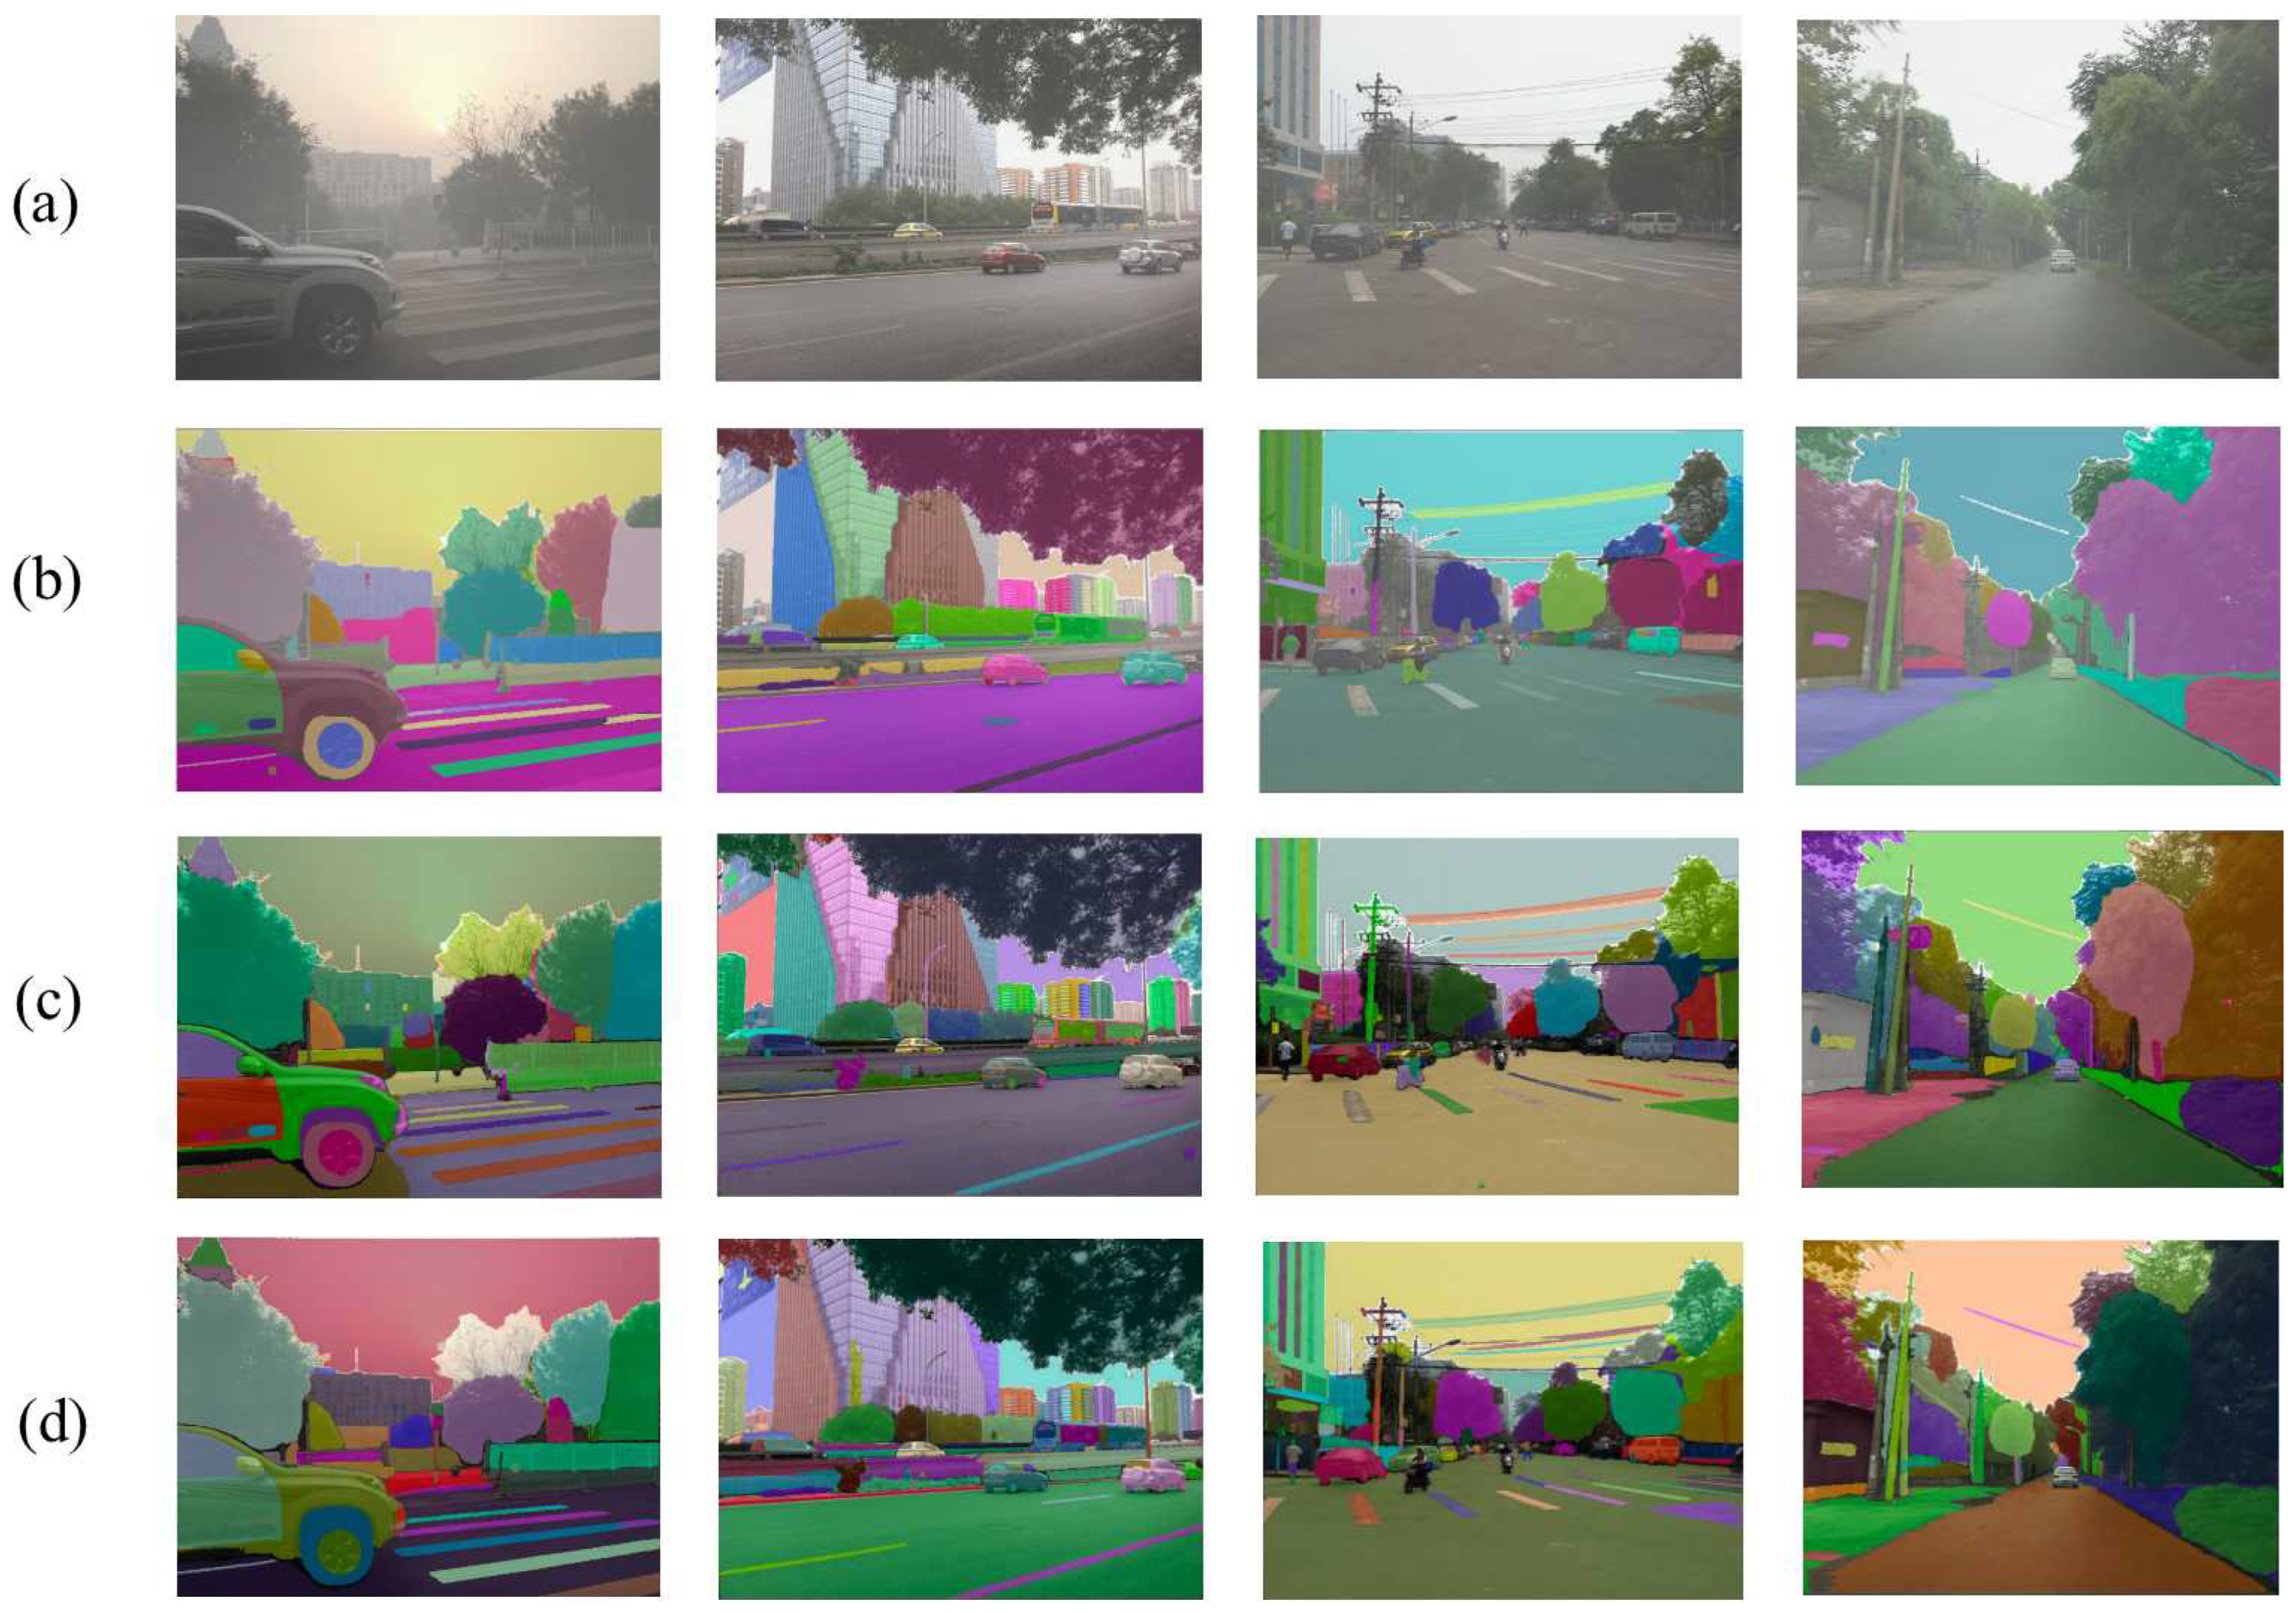
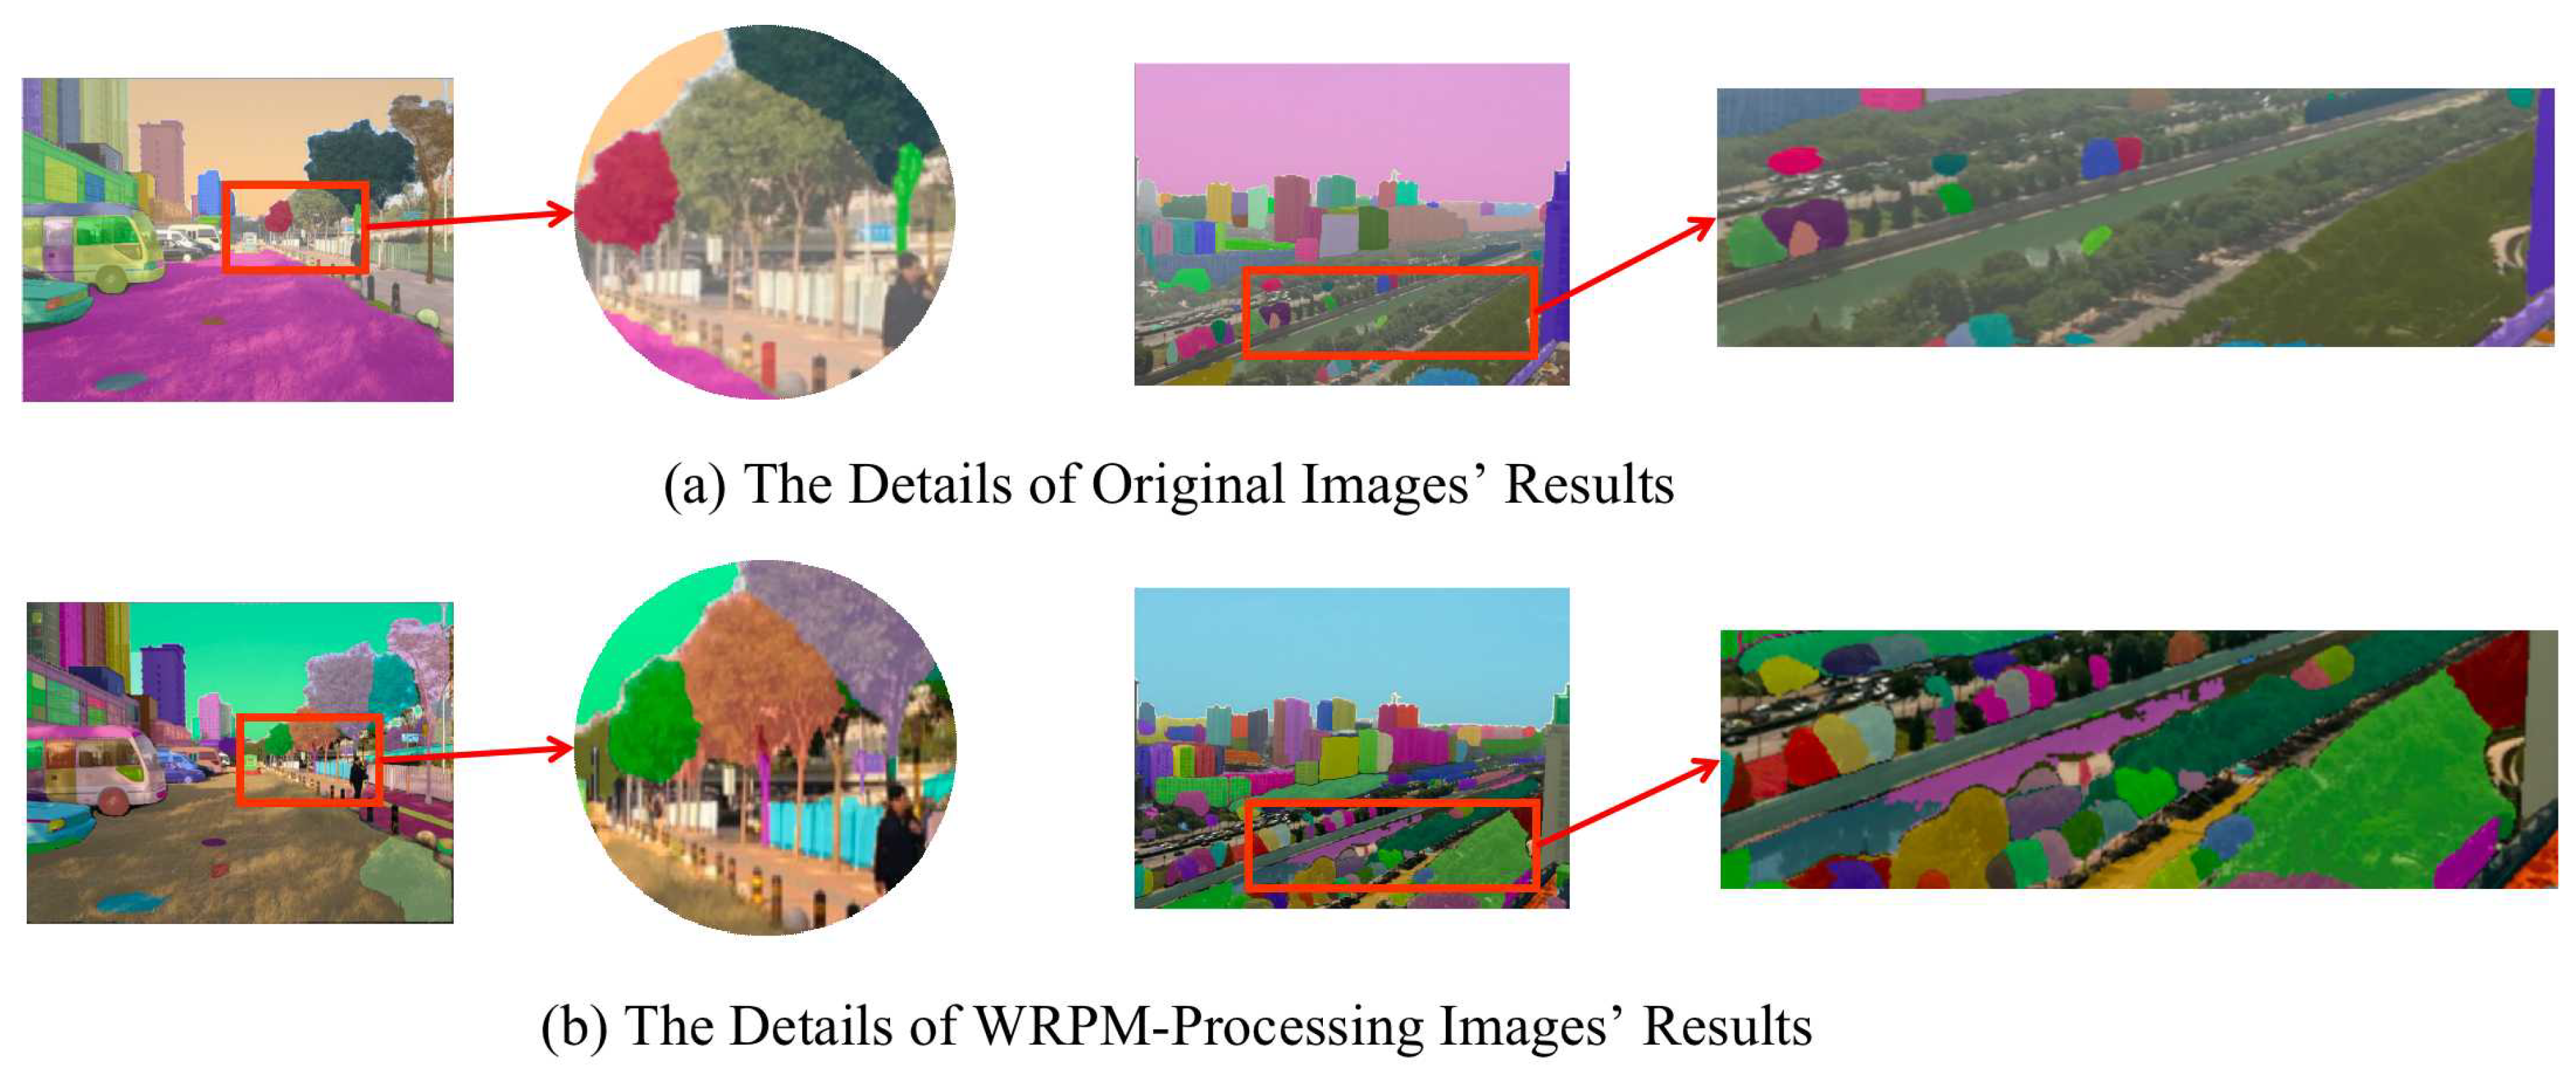
 Figure 5, Figure 6 and Figure 7, the results processed by different defogging methods are visualized. Through comparison, it can be found that the WRPM is always the closest to the ground truth.
On the other hand, we tested the vegetation segmentation performance of the UGSAM method under normal and adverse weather conditions. The segmentation accuracy directly determines the positioning accuracy. The results under normal weather conditions are presented in Table 5, and those under adverse weather conditions are shown in Table 6. In adverse weather conditions, the UGSAM achieved extremely significant improvements over the SAM in multiple indicators, with OA increasing by 16.29%, and realized high-precision positioning of vegetation areas. Under normal weather conditions, the OA of the UGSAM was only 1.03% higher than that of the SAM, which is not significant. However, the main contribution of this study lies in the scenarios of severe weather. Therefore, the improvement brought about by normal weather is an additional contribution. In the future, we hope to achieve a breakthrough in the positioning accuracy of vegetation under normal weather conditions.
In the ablation experiments, we conducted three distinct tests. Firstly, we performed split tests on the three modules within the WRPM, with the results detailed in Table 7. The findings indicate that the integration of FFA-Net and LS-UNet via FIM yields optimal performance. Secondly, we evaluated the performance of SCP-Net, as presented in Table 8. The results demonstrate that SCP-Net significantly enhances positioning accuracy. Finally, we examined various loss functions employed in SCP-Net, with the outcomes reported in Table 9. The experimental data reveal that our proposed composite loss function outperforms all alternatives tested.

4.2. Computational Resource Cost

The primary objective of this study is to implement the proposed method in the practical application of vegetation area positioning within urban environments. A critical discussion on the feasibility of deploying this method at the edge in urban scenarios is essential. The challenges associated with model deployment and the computational resources consumed during operation are the key determinants of its deployment viability. Given that this research involves large-scale models, which are typically characterized by high computational demands, it is imperative to evaluate the computational resources required for operation. For this analysis, the arithmetic power of the NVIDIA RTX4090 (82.58 TFLOPS with FP32) was used as a benchmark.
As illustrated in Table 10, we compared the number of parameters and GFLOPs of the model in this study with those of multimodal large models during the training phase. The results indicate that WRPM trains 34.4 M parameters and consumes 3.72 GFLOPs, whereas SCP-Net trains 1.7 M parameters and consumes 0.46 GFLOPs. These figures demonstrate significantly lower computational resource consumption compared to the training requirements of the three SAM weight variants, highlighting superior cost-effectiveness and enabling scalable, low-cost deployment of the algorithm in urban settings.Models based on the Transformer architecture have a large amount of computation due to the self-attention mechanism and generally have more than 100 M parameters, which is much higher than the computational cost of the UGSAM [33,34].
Table 11 presents the training time of the SAM, the WRPM and SCP-Net, as well as the time required for inferring a standard image. All computations were carried out on a single NVIDIA RTX4090 graphics card.
It can be observed from the table that the total training duration for the entire UGSAM is approximately 16 h and 30 min. Additionally, the time required to infer a single image using the Vit-B weights is around 32 s. Compared to the extensive training periods lasting several months and the requirement for hundreds of high-memory GPUs associated with large models, the UGSAM introduced in this study demonstrates remarkable cost-effectiveness and efficiency, rendering it highly suitable for large-scale deployment in urban environments.

4.3. Limitations and Scalability

Although the UGSAM offers low cost and high accuracy, its application may be constrained in certain urban environments. In regions susceptible to natural disasters or those affected by conflict, the spatial layout alterations may diverge from established social and economic development models, complicating the model’s ability to provide consistent estimates. In these specific urban contexts, employing the UGSAM necessitates relabeling the data and training the SCP-Net.
Fortunately, SCP-Net has a relatively small parameter count, resulting in significantly lower time and cost requirements for training compared to larger models. If deployment is essential in these particular scenarios or if enhanced accuracy is desired, we can opt to freeze both the encoder and decoder of the SAM while flexibly increasing the number of network layers during SCP-Net training to improve precision. This approach will incur a slight increase in cost. However, it remains substantially less than that associated with fine-tuning the SAM.
Additionally, the WRPM serves as a universal defogging module characterized by strong transferability and is not limited by scene transitions.

5. Conclusions

This study proposes an efficient real-time monitoring method for urban street vegetation conditions. The research develops an innovative solution using deep learning and multimodal visual large models. We present the UGSAM, a method for real-time analysis of street view images to extract vegetation areas, which meets urban greening management requirements with high accuracy and low operational costs.
The UGSAM integrates feature fusion with a multiattention mechanism Weather-Robust Processing Module, the WRPM, combined with a segmentation correction protocol network, SCP-Net. This architecture enables effective handling of image degradation caused by variable urban weather conditions while improving recognition accuracy. The correction network helps refine vegetation segmentation results by identifying overlooked vegetation areas, enhancing overall segmentation precision.
We conducted comprehensive comparative experiments and ablation studies on benchmark datasets. The superior performance of the UGSAM was validated through multiple perspectives and task scenarios. In standard weather conditions, the OA of the UGSAM achieved 0.8776 for vegetation segmentation tasks, representing a 1.2% improvement over the SAM. The mIoU reached 0.8681, showing a 1.5% enhancement compared with the SAM. Under adverse weather conditions, the UGSAM demonstrated exceptional capability, with OA and mIoU surpassing the SAM by 18.9% and 25.5%, respectively, showing significant performance advantages.
In the ablation experiments, we designed three sets of experiments to validate the effectiveness and superiority of each component in the UGSAM. First, we tested the performance of the UGSAM using the WRPM with fused features against using FFA-Net and LS-UNet individually. The results showed that the model with the WRPM performed the best. Second, we tested the performance of the UGSAM with and without SCP-Net, and the results demonstrated that the incorporation of SCP-Net improved the model’s performance. Finally, we experimented with multiple loss function strategies during the training of SCP-Net to determine the optimal approach. The results indicated that the combination of cross-entropy loss and Dice loss yielded the best performance, which is consistent with the strategy used in the UGSAM.
In conclusion, these results are of significant importance, as they are likely to be used for potentially important findings in the field of urban greening distribution recognizing.

Author Contributions

Conceptualization, C.M., H.L. and C.L.; methodology, H.L. and C.L.; validation, H.L.; formal analysis, S.Y. and H.L.; data curation, H.L. and S.Y.; writing—original draft preparation, H.L., S.Y. and Q.Y.; writing—review and editing, C.M. and H.L.; visualization, J.Y. and J.F.; project administration, C.M. and B.M.; funding acquisition, C.M., Z.C. and F.X. All authors have read and agreed to the published version of the manuscript.

Funding

This research was funded by the Science and Technology Innovation Program of Xiongan New Area (grant no. 2023XAGG0065), the Fundamental Research Funds for the Central Universities (grant no. QNTD202504), the Outstanding Youth Team Project of Central Universities (QNTD202308), Emergency Open Competition Project of National Forestry and Grassland Administration (202303), On-the-job positioning management of plain ecological forest maintenance personnel in 2024 (2024-LYZ-01-003), and the Beijing Forestry University National Training Program of Innovation and Entrepreneurship for Undergraduates (Name: Spatiotemporal Evolution of Urban Carbon Storage Using Deep Learning: A Case Study of Xiong’an New Area).

Data Availability Statement

The data is available at https://github.com/ForestryIIP/UGSAM (accessed on 12 June 2025).

Conflicts of Interest

The authors declare no conflicts of interest.

References

  1. Wu, D.; Gong, J.; Liang, J.; Sun, J.; Zhang, G. Analyzing the influence of urban street greening and street buildings on summertime air pollution based on street view image data. ISPRS Int. J. Geo-Inf. 2020, 9, 500. [Google Scholar] [CrossRef]
  2. Vuckovic, M.; Kiesel, K.; Mahdavi, A. Studies in the assessment of vegetation impact in the urban context. Energy Build. 2017, 145, 331–341. [Google Scholar] [CrossRef]
  3. Liu, L.; Guan, D.; Peart, M.; Wang, G.; Zhang, H.; Li, Z. The dust retention capacities of urban vegetation—A case study of Guangzhou, South China. Environ. Sci. Pollut. Res. 2013, 20, 6601–6610. [Google Scholar] [CrossRef]
  4. Dimoudi, A.; Nikolopoulou, M. Vegetation in the urban environment: Microclimatic analysis and benefits. Energy Build. 2003, 35, 69–76. [Google Scholar] [CrossRef]
  5. Olimovich, A.Q.; Khudoymurodovich, O.K. The role and importance of plants in environmental protection. ACADEMICIA Int. Multidiscip. Res. J. 2021, 11, 937–941. [Google Scholar] [CrossRef]
  6. Li, Y.; Xia, C.; Wu, R.; Ma, Y.; Mu, B.; Wang, T.; Petropoulos, E.; Hokoi, S. Role of the urban plant environment in the sustainable protection of an ancient city wall. Build. Environ. 2021, 187, 107405. [Google Scholar] [CrossRef]
  7. Zhang, Y.; Han, Z.; Li, X.; Zhang, H.; Yuan, X.; Feng, Z.; Wang, P.; Mu, Z.; Song, W.; Blake, D.R.; et al. Plants and related carbon cycling under elevated ground-level ozone: A mini review. Appl. Geochem. 2022, 144, 105400. [Google Scholar] [CrossRef]
  8. Liu, Y.Y.; van Dijk, A.I.; McCabe, M.F.; Evans, J.P.; de Jeu, R.A. Global vegetation biomass change (1988–2008) and attribution to environmental and human drivers. Glob. Ecol. Biogeogr. 2013, 22, 692–705. [Google Scholar] [CrossRef]
  9. Silleos, N.G.; Alexandridis, T.K.; Gitas, I.Z.; Perakis, K. Vegetation indices: Advances made in biomass estimation and vegetation monitoring in the last 30 years. Geocarto Int. 2006, 21, 21–28. [Google Scholar] [CrossRef]
  10. Poley, L.G.; McDermid, G.J. A systematic review of the factors influencing the estimation of vegetation aboveground biomass using unmanned aerial systems. Remote Sens. 2020, 12, 1052. [Google Scholar] [CrossRef]
  11. Von Schönfeld, K.C.; Bertolini, L. Urban streets: Epitomes of planning challenges and opportunities at the interface of public space and mobility. Cities 2017, 68, 48–55. [Google Scholar] [CrossRef]
  12. Hassen, N.; Kaufman, P. Examining the role of urban street design in enhancing community engagement: A literature review. Health Place 2016, 41, 119–132. [Google Scholar] [CrossRef]
  13. Long, J.; Shelhamer, E.; Darrell, T. Fully convolutional networks for semantic segmentation. In Proceedings of the IEEE Conference on Computer Vision and Pattern Recognition, Boston, MA, USA, 7–12 June 2015; pp. 3431–3440. [Google Scholar]
  14. Qi, C.R.; Yi, L.; Su, H.; Guibas, L.J. Pointnet++: Deep hierarchical feature learning on point sets in a metric space. Adv. Neural Inf. Process. Syst. 2017, 30, 1–14. [Google Scholar]
  15. Ahmed, F.; Mohanta, J.; Keshari, A.; Yadav, P.S. Recent advances in unmanned aerial vehicles: A review. Arab. J. Sci. Eng. 2022, 47, 7963–7984. [Google Scholar] [CrossRef] [PubMed]
  16. Gao, L.; Xiang, X.; Chen, W.; Nong, R.; Zhang, Q.; Chen, X.; Chen, Y. Research on Urban Street Spatial Quality Based on Street View Image Segmentation. Sustainability 2024, 16, 7184. [Google Scholar] [CrossRef]
  17. Xia, Y.; Yabuki, N.; Fukuda, T. Sky view factor estimation from street view images based on semantic segmentation. Urban Clim. 2021, 40, 100999. [Google Scholar] [CrossRef]
  18. Wu, Z.; Xu, K.; Li, Y.; Zhao, X.; Qian, Y. Application of an Integrated Model for Analyzing Street Greenery through Image Semantic Segmentation and Accessibility: A Case Study of Nanjing City. Forests 2024, 15, 561. [Google Scholar] [CrossRef]
  19. Wang, Y.K.; Fan, C.T. Single image defogging by multiscale depth fusion. IEEE Trans. Image Process. 2014, 23, 4826–4837. [Google Scholar] [CrossRef]
  20. Xu, Y.; Wen, J.; Fei, L.; Zhang, Z. Review of video and image defogging algorithms and related studies on image restoration and enhancement. IEEE Access 2015, 4, 165–188. [Google Scholar] [CrossRef]
  21. Do, J.; Ferreira, V.C.; Bobarshad, H.; Torabzadehkashi, M.; Rezaei, S.; Heydarigorji, A.; Souza, D.; Goldstein, B.F.; Santiago, L.; Kim, M.S.; et al. Cost-effective, energy-efficient, and scalable storage computing for large-scale AI applications. ACM Trans. Storage (Tos) 2020, 16, 1–37. [Google Scholar] [CrossRef]
  22. Kirillov, A.; Mintun, E.; Ravi, N.; Mao, H.; Rolland, C.; Gustafson, L.; Xiao, T.; Whitehead, S.; Berg, A.C.; Lo, W.Y.; et al. Segment anything. In Proceedings of the IEEE/CVF International Conference on Computer Vision, Paris, France, 2–6 October 2023; pp. 4015–4026. [Google Scholar]
  23. Dosovitskiy, A.; Beyer, L.; Kolesnikov, A.; Weissenborn, D.; Zhai, X.; Unterthiner, T.; Dehghani, M.; Minderer, M.; Heigold, G.; Gelly, S.; et al. An image is worth 16×16 words: Transformers for image recognition at scale. arXiv 2020, arXiv:2010.11929. [Google Scholar]
  24. Zhao, X.; Ding, W.; An, Y.; Du, Y.; Yu, T.; Li, M.; Tang, M.; Wang, J. Fast segment anything. arXiv 2023, arXiv:2306.12156. [Google Scholar]
  25. Yang, Y.; Wu, X.; He, T.; Zhao, H.; Liu, X. Sam3d: Segment anything in 3d scenes. arXiv 2023, arXiv:2306.03908. [Google Scholar]
  26. Bui, N.T.; Hoang, D.H.; Tran, M.T.; Doretto, G.; Adjeroh, D.; Patel, B.; Choudhary, A.; Le, N. Sam3d: Segment anything model in volumetric medical images. In Proceedings of the 2024 IEEE International Symposium on Biomedical Imaging (ISBI), Athens, Greece, 27–30 May 2024; IEEE: New York, NY, USA, 2024; pp. 1–4. [Google Scholar]
  27. Chan, T.J.; Sahni, A.; Fang, Y.; Li, J.; Luthra, A.; Pouch, A.; Rajapakse, C.S. SAM3D: Zero-Shot Semi-Automatic Segmentation in 3D Medical Images with the Segment Anything Model. arXiv 2024, arXiv:2405.06786. [Google Scholar]
  28. Cai, B.; Xu, X.; Jia, K.; Qing, C.; Tao, D. Dehazenet: An end-to-end system for single image haze removal. IEEE Trans. Image Process. 2016, 25, 5187–5198. [Google Scholar] [CrossRef]
  29. Wang, Y.; Solomon, J.M. Deep closest point: Learning representations for point cloud registration. In Proceedings of the IEEE/CVF International Conference on Computer Vision, Seoul, Republic of Korea, 27 October–2 November 2019; pp. 3523–3532. [Google Scholar]
  30. Li, B.; Peng, X.; Wang, Z.; Xu, J.; Feng, D. Aod-net: All-in-one dehazing network. In Proceedings of the IEEE International Conference on Computer Vision, Venice, Italy, 22–29 October 2017; pp. 4770–4778. [Google Scholar]
  31. Lin, Q.; Zhou, J.; Ma, Q.; Ma, Y.; Kang, L.; Wang, J. EMRA-Net: A pixel-wise network fusing local and global features for tiny and low-contrast surface defect detection. IEEE Trans. Instrum. Meas. 2022, 71, 1–14. [Google Scholar] [CrossRef]
  32. Chen, D.; He, M.; Fan, Q.; Liao, J.; Zhang, L.; Hou, D.; Yuan, L.; Hua, G. Gated context aggregation network for image dehazing and deraining. In Proceedings of the 2019 IEEE Winter Conference on Applications of Computer Vision (WACV), Waikoloa Village, HI, USA, 7–11 January 2019; IEEE: New York, NY, USA, 2019; pp. 1375–1383. [Google Scholar]
  33. Guo, C.L.; Yan, Q.; Anwar, S.; Cong, R.; Ren, W.; Li, C. Image dehazing transformer with transmission-aware 3d position embedding. In Proceedings of the IEEE/CVF Conference on Computer Vision and Pattern Recognition, New Orleans, LA, USA, 18–24 June 2022; pp. 5812–5820. [Google Scholar]
  34. Song, Y.; He, Z.; Qian, H.; Du, X. Vision transformers for single image dehazing. IEEE Trans. Image Process. 2023, 32, 1927–1941. [Google Scholar] [CrossRef]
  35. Ye, T.; Zhang, Y.; Jiang, M.; Chen, L.; Liu, Y.; Chen, S.; Chen, E. Perceiving and Modeling Density for Image Dehazing. In Computer Vision—ECCV 2022, Proceedings of the 17th European Conference, Tel Aviv, Israel, 23–27 October 2022; Avidan, S., Brostow, G., Cissé, M., Farinella, G.M., Hassner, T., Eds.; Springer: Cham, Switzerland, 2022; pp. 130–145. [Google Scholar]
  36. Li, B.; Ren, W.; Fu, D.; Tao, D.; Feng, D.; Zeng, W.; Wang, Z. Benchmarking Single-Image Dehazing and Beyond. IEEE Trans. Image Process. 2019, 28, 492–505. [Google Scholar] [CrossRef]
  37. Salazar-Colores, S.; Moya-Sanchez, E.U.; Ramos-Arreguin, J.M.; Cabal-Yepez, E.; Flores, G.; Cortes, U. Fast single image defogging with robust sky detection. IEEE Access 2020, 8, 149176–149189. [Google Scholar] [CrossRef]
  38. Chen, Y. Convolutional Neural Network for Sentence Classification. Master’s Thesis, University of Waterloo, Waterloo, ON, USA, 2015. [Google Scholar]
  39. Li, X.; Li, M.; Yan, P.; Li, G.; Jiang, Y.; Luo, H.; Yin, S. Deep learning attention mechanism in medical image analysis: Basics and beyonds. Int. J. Netw. Dyn. Intell. 2023, 2, 93–116. [Google Scholar] [CrossRef]
  40. Brauwers, G.; Frasincar, F. A general survey on attention mechanisms in deep learning. IEEE Trans. Knowl. Data Eng. 2021, 35, 3279–3298. [Google Scholar] [CrossRef]
  41. Ronneberger, O.; Fischer, P.; Brox, T. U-net: Convolutional networks for biomedical image segmentation. In Proceedings of the Medical Image Computing and Computer-Assisted Intervention–MICCAI 2015: 18th International Conference, Munich, Germany, 5–9 October 2015; Proceedings, Part III 18. Springer: Cham, Switzerland, 2015; pp. 234–241. [Google Scholar]
Figure 1. Location of study area. (a) A schematic diagram of the geographical location of the city in China. (b) The population density statistical chart of the study area. (c) A statistical chart of land use types in the study area.
Remotesensing 17 02058 g001
Figure 2. The framework of UGSAM. (a) WRPM: Weather-Robust Preprocessing Module. The target image is defogged by a dense haze region processing network (i.e., FFA-Net) and a light haze region processing network (i.e., LS-UNet), and the feature fusion of the two modules is realized by using a feature fusion module (i.e., FIM). (b) SAM. The processed image and prompt information are input to the encoder, and the vegetation area mask is obtained by the decoder. (c) SCP-Net: Streetscape-Correction Network. The module corrects the SAM output result.
Remotesensing 17 02058 g002
Figure 3. Detailed structure diagram of FFA-Net. FFA-Net is an encoder–decoder structure and has a unique channel attention and pixel attention mechanism designed to achieve deep learning of image features. The image shows the design of the encoder, decoder, group structure, block structure, and attention mechanism in detail.
Remotesensing 17 02058 g003
Figure 4. Detailed structure diagram of LS-UNet. LS-UNet is an encoder–decoder structure. It implements downsampling inside the encoder to extract low-dimensional features from the image through consecutive convolution operations, and implements upsampling inside the decoder to enhance the ability to restore image details.
Remotesensing 17 02058 g004
Figure 5. The effectiveness of image dehazing, including DCP, AOD-Net, EMRA-Net, GCA-Net, Dehamer, DehazeFormer, and the WRPM.
Remotesensing 17 02058 g005
Figure 6. Comparative visualization of detail enhancement effects among DCP, AOD-Net, and the WRPM.
Remotesensing 17 02058 g006
Figure 7. Comparative visualization of detail enhancement effects among EMRA-Net, GCANet, and the WRPM.
Remotesensing 17 02058 g007
Figure 8. The 360° panoramic streetscape imagery after haze removal.
Remotesensing 17 02058 g008
Figure 9. The panoramic image after segmentation using the UGSAM in normal weather conditions.
Remotesensing 17 02058 g009
Figure 10. Extracted streetscape images with vegetation areas separated.
Remotesensing 17 02058 g010
Figure 11. Visualization of the impact of the WRPM on segmentation accuracy. (a) The street view image captured under harsh weather conditions. (b) The segmentation result obtained without any preprocessing. (c) The segmentation result after applying the WRPM. (d) The ground truth for comparison.
Remotesensing 17 02058 g011
Figure 12. Visualization of segmentation details for both the original image and the image processed with the WRPM. The arrows indicate a magnified view of the details within the red box in the original images.
Remotesensing 17 02058 g012
Figure 13. Visualization of the correction effects of SCP-Net on image segmentation results. The arrrows indicate a magnified view of the details within the red box in the original images. The black boxes highlight the areas where SCP-Net has performed corrections.
Remotesensing 17 02058 g013
Table 1. The proportion distribution of data among different climate types.
Weather TypeQuantityProportion
Normal (sunny, cloudy)68750%
Rainy (ordinary)685%
Rainy (rainstorm)27320%
Light haze17212.5%
Dense haze17212.5%
Table 2. Streetscape data information.
Data TypesData Information Data Examples
streetscape-NormalWeatherBaidu Map, 2018–2020, 1372 imagesRemotesensing 17 02058 i001Remotesensing 17 02058 i002Remotesensing 17 02058 i003
streetscape-InclementWeatherRESIDE [36], 24,577 imagesRemotesensing 17 02058 i004Remotesensing 17 02058 i005Remotesensing 17 02058 i006
Table 3. Summary of calculation formulas for performance metrics.
AbbreviationFormula
OA T P + T N T P + T N + F N + F P
Recall T P T P + F N
Precision T P T P + F N
mIoU T P T P + F N + F P + T N T N + F N + F P 2
MSE MSE = 1 m n i = 0 m 1 j = 0 n 1 [ I ( i , j ) K ( i , j ) ] 2
PSNR PSNR = 10 · log 10 MAX I 2 MSE
SSIM SSIM ( x , y ) = ( 2 μ x μ y + C 1 ) ( 2 σ x y + C 2 ) ( μ x 2 + μ y 2 + C 1 ) ( σ x 2 + σ y 2 + C 2 )
LPIPS LPIPS ( x , x 0 ) = l 1 H l W l h , w d h , w l
Where m and n are the dimensions of the image, I(i,j) is the pixel value of the original image at position (i,j), K(i,j) is the pixel value of the processed image at position (i,j), MAXI is the maximum possible pixel value of the image, x and y are two image patches being compared, and μx and μy are the average pixel values of x and y, respectively. σ x 2 and σ y 2 are the variances of x and y, respectively. σxy is the covariance between x and y.
Table 4. Experimental results comparing dehazing effectiveness with conventional methods.
ModelsMSE ↓PSNR ↑SSIM ↑LPIPS ↓
DCP2373.035217.510.86140.0600
AOD-Net3377.922715.100.80490.0404
EMRA-Net2154.225418.300.86510.0466
GCANet2100.578519.220.87050.0455
Dehamer943.624519.140.83990.1202
DehazeFormer151.744027.340.95530.0102
PMNet181.868026.690.91940.0689
WRPM52.369730.940.97280.0067
The best results are highlighted in bold. ↓ means the smaller the better, ↑ means the bigger the better.
Table 5. Experimental results comparing the UGSAM with conventional methods in normal condition. The checkpoint of the SAM is ViT-H.
ModelsOARecallPrecisionmIoU
K-means0.66670.77610.74290.6118
FCN0.77550.88460.84150.7582
PointNet++0.80610.90910.85370.7865
SAM0.86730.95060.89530.8556
UGSAM0.87760.96340.89770.8681
The best results are highlighted in bold.
Table 6. Experimental results comparing UGSAM with conventional methods in adverse condition. The checkpoint of the SAM is ViT-H.
ModelsOARecallPrecisionmIoU
K-means0.49820.49060.37680.2708
FCN0.57960.66250.55210.4309
PointNet++0.55950.63010.52570.4017
SAM0.69860.81350.73940.6322
UGSAM0.86150.93450.90270.8490
The best results are highlighted in bold.
Table 7. Performance comparison of FFA-Net, LS-UNet, and the WRPM in the defogging module of UGSAM.
ModelsWRPMOARecallPrecisionmIoU
FFA-Net0.68090.80770.78200.6968
FCNLS-UNet0.68720.79140.77930.6935
WRPM0.69350.80380.78780.7028
FFA-Net0.75290.75960.81710.6903
PointNet++LS-UNet0.74710.75440.82040.6880
WRPM0.75620.76650.82420.6989
FFA-Net0.85150.91520.89410.8316
UGSAMLS-UNet0.85430.91160.89350.8274
WRPM0.86320.92770.90480.8452
The best results are highlighted in bold.
Table 8. Effects of SCP-Net on segmentation accuracy.
ModelsSCP-NetOARecallPrecisionmIoU
FCN0.68770.79610.77570.6981
FCN0.69350.80380.78780.7028
PointNet++0.74680.75540.81880.6831
PointNet++0.75620.76650.82420.6989
UGSAM0.85280.91660.89800.8391
UGSAM0.86320.92770.90480.8452
The best results are highlighted in bold.
Table 9. Effects of different loss functions on SCP-Net performance. Focal loss (i.e., FL), cross-entropy loss (i.e., CEL), Dice loss (i.e., DL), recall (i.e., Re), precision (i.e., Pr).
ModelsFLCELDLOARePrmIoU
0.68890.79840.77790.6993
0.69130.79960.77720.6998
FCN0.69080.80010.78310.7006
0.69350.80380.78780.7028
0.69210.79960.78950.7003
0.75160.75920.81920.6863
0.75240.76040.82100.6886
PointNet++0.75520.75970.81990.6907
0.75620.76650.82420.6989
0.75310.76140.82310.6897
0.85420.91730.90010.8403
0.85990.92460.90270.8417
UGSAM0.86030.91960.90350.8410
0.86320.92770.90480.8452
0.86200.92640.90620.8437
The best results are highlighted in bold.
Table 10. The parameter quantity and computational power consumption of each module in the UGSAM.
MethodParams (M)GFLOPs
WRPM (FFA-Net)17.61.75
WRPM (LS-UNet)14.51.51
WRPM (FIM)2.30.48
SCP-Net1.70.46
SAM (Vit-H)63681.34
SAM (Vit-L)30839.39
SAM (Vit-B)9111.64
Table 11. The training and inference time of each module in the UGSAM.
MethodTraining Time (h)Inferencing Time (s)
WRPM (FFA-Net)7.34.22
WRPM (LS-UNet)5.53.68
WRPM (FIM)3.13.07
SCP-Net0.60.94
SAM (Vit-H)0 (Freeze)56.13
SAM (Vit-L)0 (Freeze)32.19
SAM (Vit-B)0 (Freeze)19.87
Disclaimer/Publisher’s Note: The statements, opinions and data contained in all publications are solely those of the individual author(s) and contributor(s) and not of MDPI and/or the editor(s). MDPI and/or the editor(s) disclaim responsibility for any injury to people or property resulting from any ideas, methods, instructions or products referred to in the content.

