Abstract
In recent years, the altered hydrological regimes and frequent extreme hydrological events in its watershed have significantly affected the stability and biodiversity of the dish-shaped lakes (DSLs) ecosystem in Poyang Lake. This study uses long-term water level records from the Xingzi hydrological station, multi-source remote sensing imagery, and field surveys to assess how altered hydrological regimes and frequent extreme hydrological events influence the coupled hydro-ecological evolution of DSLs under different gate-controlled conditions. The results reveal the following: (1) After 2003, average monthly water levels declined by 0.84 m, shifting prolonged inundation depths from the 10.0 to 14.0 m range into the 5.5 to 9.5 m range. Extreme hydrological events disrupted the hydrological regimes, triggering a clear “collapse–recovery” succession in submerged plants and major shifts in shoal wetland vegetation. (2) Gate-controlled DSLs (GC DSLs) mitigated many of these impacts by reducing the autumnal drawdown in the water area change rate to 0.324 km2/d, curbing the upward expansion of emergent and hygrophytic vegetation during high-water-level years, and stabilizing habitats during low-water-level years, although different management strategies and substrate characteristics may still lead to divergent habitat trajectories. (3) The habitat heterogeneity exhibited by the DSLs’ vegetation communities along the elevation gradient had differential effects on migratory birds, and GC DSLs can offer migratory birds relatively stable resting habitats and food resources during extreme hydrological events. The study recommends that DSL management should adopt a hierarchical dynamic regulation strategy to balance natural hydrological fluctuations with human interventions, thereby strengthening the resilience of DSL wetland habitats to extreme hydrological events.
1. Introduction
Dish-shaped lakes (DSLs), defined as seasonal sub-lakes that emerge on shoals within the main lake basin during the dry season, are integral components of the Poyang Lake wetland system [1,2]. These DSLs provide critical habitats for a diverse array of aquatic organisms and migratory birds, thereby playing a significant role in maintaining global biodiversity and ecosystem integrity [3,4,5,6]. However, recent alterations in the hydrological regime of the middle and lower Yangtze River, coupled with the increasing frequency of extreme hydrological events, have led to substantial changes in the habitats of these DSLs in Poyang Lake. Key hydrological factors such as water levels and the timing of water rise and recession have shifted [7], disrupting the growth cycles of aquatic vegetation. This disruption has resulted in the decline of submerged plants and the expansion of emergent and hygrophilous vegetation, indicating a restructuring of plant communities [8,9]. Consequently, the degradation of wetland functions has imposed survival pressures on overwintering migratory birds, manifesting as habitat loss, reduced food resources, and decreased species diversity [10,11,12]. To safeguard the stability of DSL wetlands, it is therefore essential to clarify their hydrological regime, habitat evolution trends, and the mitigating effects of artificial water-level regulation under extreme events.
Previous studies have demonstrated that the amplitude and frequency of water level fluctuations directly influence wetland distribution patterns and ecological connectivity. Notably, during the dry season, excessively low water levels have led to significant reductions in wetland areas and increased isolation of water bodies, severely impacting the habitats and reproductive environments of aquatic species [13,14,15]. The water level variations are closely linked to the growth of aquatic vegetation. Lower water levels have facilitated the expansion of emergent plants, while submerged vegetation has declined, leading to reduced species diversity [16,17,18]. Remote sensing and ecological modeling analyses have further revealed that declining water levels diminish the distribution and biomass of submerged and floating plants [19,20,21,22]. Aquatic vegetation plays a crucial role in nutrient cycling, mitigating eutrophication, and providing essential habitats for birds [23,24,25,26,27]. Moreover, water level fluctuations and wetland degradation have led to the contraction of migratory bird habitats, particularly during the dry season, exacerbating habitat fragmentation and threatening species such as the Siberian Crane that rely heavily on large wetlands [24,28,29]. There is a complex coupling among hydrological regime, wetland vegetation, and migratory bird habitats, which is critically important for the maintenance of ecosystem functions [30,31].
Based on the above, most studies elucidating changes in hydrological regime and their impacts on wetland spatial patterns and ecological functions have been conducted at the Poyang Lake scale [13,14,15,20,21,22]. There is a lack of systematic understanding of the habitat evolution processes of DSLs under the combined effects of altered hydrological regimes and extreme hydrological events. Furthermore, the mechanisms by which gate-controlled DSLs (GC DSLs) regulate water levels to mitigate ecological impacts remain unclear, hindering the optimization and implementation of management strategies.
In response to the above issues, this study carried out several key work. First, it focuses on the scale of representative DSL units in Poyang Lake, revealing the impact of extreme hydrological events on the evolution of small-scale wetland habitats. This provides a more refined perspective for understanding ecological response mechanisms at the sub-lake level. Second, the study introduces a novel index—the Water Area Change Rate Index (WACRI)—to quantify lake water dynamics. Combined with time-series analysis, this allows for a more systematic assessment of changes in wetland vegetation and waterbody patterns before and after extreme hydrological events. Finally, the study analyzes the regulatory roles of different types of DSLs in enhancing ecosystem resilience.
This study integrates long-term hydrological data, optical/microwave remote sensing imagery, and field survey information, combined with technical approaches such as water level frequency analysis, land cover classification, vegetation coverage calculation, and analysis of water extraction, to quantitatively assess the response of key habitat elements in the DSLs of Poyang Lake to new hydrological regimes, extreme hydrological events, and artificial regulation. The objective is to systematically evaluate the evolutionary trends of key habitat components across different DSLs and explore their ecological response mechanisms under changing environmental conditions. The findings aim to deepen the understanding of the evolutionary mechanisms of lake wetland ecosystems under multiple stressors and provide theoretical and technical support for adaptive ecological management in the context of increasingly frequent extreme hydrological events.
2. Materials and Methods
2.1. Study Area and Datasets
The DSLs investigated in this study are in the northwestern part of Poyang Lake and form part of the Poyang Lake National Nature Reserve. These DSLs constitute a critical ecological subsystem within the lake–wetland complex. The study area comprises nine DSLs: Shahu Lake, Dachahu Lake, Banghu Lake, Zhushihu Lake, Meixihu Lake, Xianghu Lake, Dahuchi Lake, Changhuchi Lake, and Zhonghuchi Lake (Figure 1). The region experiences a subtropical humid monsoon climate. From 1986 to 2020, the mean annual temperature in the Poyang Lake wetland was 17.9 °C, with a maximum of 18.1 °C in 2007 and a minimum of 17.8 °C in 2012. Mean annual precipitation was 1550.1 mm, ranging from 967 mm in 2006 to 3250.5 mm in 1998. Following the implementation of fishing bans, the traditional “DSLs enclosed in autumn” fishing practice has been prohibited. Field investigations revealed that some DSLs are currently unmanaged, resulting in damage to dikes and water-control gates and altering their hydrological connectivity with the main lake.
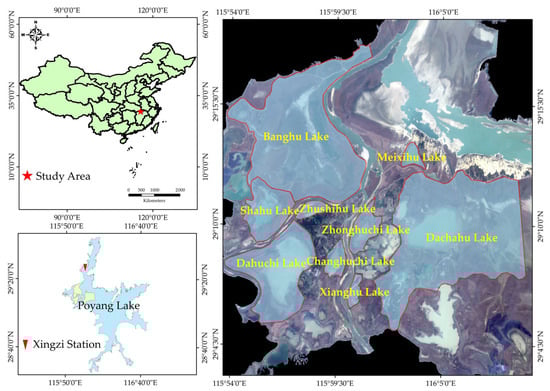
Figure 1.
Location of the study area.
The datasets used in this study include hydrological data, remote sensing imagery, and monitoring records from the nature reserve.
Hydrological data were obtained from the Xingzi hydrological station, which is an important representative hydrological monitoring site in the Poyang Lake region, located in the central part of Poyang Lake. It is one of the nationally designated control stations and is commonly used for monitoring and studying water level fluctuations, hydrological regimes, and hydrodynamic interactions with the Yangtze River. Daily water level observations from 1956 to 2022 were used to analyze long-term trends in hydrological regimes within the DSL region.
Remote sensing imagery included optical satellite images (Landsat-5, Sentinel-2, and MODIS) and microwave radar data (Sentinel-1) (Figure 2). Image collection and analysis were conducted using the Google Earth Engine (GEE) platform. Landsat-5 data were obtained from the LANDSAT/LT05/C02/T1 surface reflectance dataset, which has been atmospherically corrected. Sentinel-2 images were sourced from the COPERNICUS/S2_SR_HARMONIZED dataset, processed using the sen2cor correction algorithm. MODIS data (MOD13Q1 V6.1) provided NDVI values from 2001 to 2024 (totaling 552 scenes). Sentinel-1 SAR images were derived from the COPERNICUS/S1_GRD dataset, calibrated and geometrically corrected (422 scenes, 2016–2024).
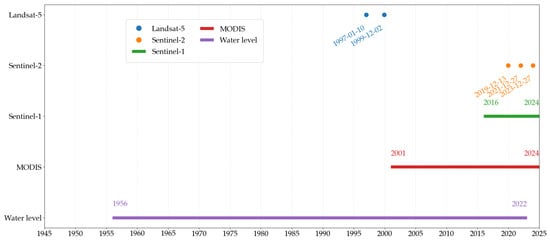
Figure 2.
Temporal distribution of acquired Sentinel-1/2 Landsat-5 MODIS and water level for DSLs of Poyang Lake.
Due to the dual influence of upstream inflow and the Yangtze River, Poyang Lake exhibits a dynamic hydrological regime characterized by “broad surfaces in wet seasons, narrow lines in dry seasons” [32]. Optical characteristics of wetland vegetation also vary substantially throughout the year. Given that sandbars and wetlands are mostly exposed during the autumn and winter, and that vegetation growth stabilizes during this period, remote sensing images were selected from December to the following January for the years surrounding the extreme flood (1998, 2020) and drought (2022) events [33].
Monitoring records were collected from the Jiangxi Poyang Lake National Nature Reserve’s annual ecological resource reports for selected years.
Figure 3 presents the overall methodological workflow of this study. First, remote sensing imagery and water level records from key hydrological stations were systematically collected and processed. A frequency analysis of the Xingzi station’s water level time series was then performed to characterize the hydrological regime of the DSLs. Using optical remote sensing data, habitat elements and vegetation cover were extracted, together with the water level analysis, employed to investigate the effects of altered hydrological regimes and extreme hydrological events on wetland habitat dynamics. Concurrently, microwave remote sensing images were utilized to identify the lake’s water area extent and calculate the water area change rate. By comparing the evolutionary differences in the underlying surfaces of GC DSLs and non-GC DSLs, the impact of artificial regulation on wetland habitat evolution was evaluated. Finally, incorporating monitoring data from the nature reserve, the study evaluated how shifts in habitat configuration disturb the survival and roosting behavior of overwintering waterbirds.
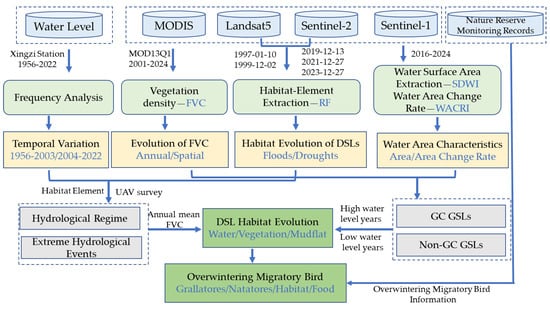
Figure 3.
The overall methodological workflow of this study.
2.2. Habitat Element Extraction
The Random Forest (RF) algorithm was employed to identify and extract habitat elements of DSLs. Based on the characteristics of such lakes and their relevance to migratory bird wintering habitats, the habitat elements were classified into six major categories: Water, Carex, Mudflat, Phragmites australis, Submerged vegetation, and Polygonum-Phalaris arundinacea [9]. The RF algorithm is a robust non-parametric ensemble classifier [34]. Compared to single decision trees, RF offers higher classification stability and accuracy, and is less sensitive to input data volume or multicollinearity. Spectral bands and vegetation indices from Landsat-5 and Sentinel-2 images were used to construct a feature dataset, including Normalized Difference Vegetation Index (NDVI), Normalized Difference Water Index (NDWI), Bare Soil Index (BSI), Modified Normalized Difference Water Index (MNDWI), Green Atmospherically Resistant Index (GARI), Visible Atmospherically Resistant Index (VARI), Modified Soil Adjusted Vegetation Index (MSAVI), and Plant Senescence Reflectance Index (PSRI). Topographic variables were also incorporated to improve classification accuracy. The classification features used are listed in Table 1. Sample collection was carried out using the Collect Earth software in combination with field surveys. This software is a data collection tool based on Google Earth, specifically designed for collecting structured data through enhanced visual interpretation [35]. A total of approximately 450 samples were collected, of which 70% were randomly selected for model construction and 30% for model validation.

Table 1.
Habitat element classification feature variables.
2.3. Fractional Vegetation Cover Calculation
Fractional vegetation cover (FVC), proposed by Gutman et al. [36], is calculated using a linear pixel decomposition model based on NDVI values, which is especially effective in regions with high vegetation density such as wetlands. FVC reflects the spatial distribution and density of vegetation and is an important indicator of vegetation growth status. FVC is calculated as follows:
where FVC represents fractional vegetation cover, NDVIsoil corresponds to the NDVI value of bare soil or non-vegetated areas, and NDVIveg corresponds to the NDVI value of areas with full vegetation coverage. The 95th percentile of the cumulative NDVI distribution is designated as NDVIveg, with NDVI values exceeding this threshold assigned an FVC of 1. Conversely, the 5th percentile is defined as NDVIsoil, with NDVI values below this threshold assigned an FVC of 0.
2.4. Water Surface Area Extraction
The water surface area was extracted using the Sentinel-1 Dual-Polarized Water Index (SDWI), developed by Jia Shichao et al. [37]:
VV (Vertical–Vertical) and VH (Vertical–Horizontal) are two polarization channels in radar imagery:
VV: Radar signals transmitted and received in the vertical polarization.
VH: Radar signals transmitted in the vertical polarization and received in the horizontal polarization.
The fundamental principle of the Sentinel-1 Dual-Polarized Water Index (SDWI) lies in the differential backscattering characteristics of water bodies in synthetic aperture radar (SAR) imagery. Water surfaces typically exhibit low backscatter due to strong signal absorption, whereas soil and vegetation exhibit higher backscatter because of stronger signal scattering. By calculating SDWI, the difference between the VV and VH channel responses is used to distinguish water bodies from non-water surfaces. In SDWI images, water areas generally appear as low values, while non-water areas display higher values.
A limitation of this algorithm is its inability to effectively differentiate water from terrain-induced shadow, though this issue is not present in the study area due to the absence of mountainous terrain, making the method well-suited for this application. Based on manual image interpretation and prior field surveys, with reference to existing research findings [38], pixels with SDWI values greater than 0.4 were identified as water, and the water surface area of 422 scenes in the DSL region from 2016 to 2024 was extracted accordingly.
2.5. Water Area Change Rate Calculation
Based on the water surface areas extracted from Sentinel-1 imagery, the Water Area Change Rate Index (WACRI) was employed to assess the rate of change in the water surface area of DSL system. The WACRI is calculated using the following formula:
where Ai and Ai+1 are water surface areas at consecutive time points, and ODi and ODi+1 are the corresponding observation dates.
2.6. Statistical Analysis and Accuracy Assessment
A random 30% of the sample points were used as the validation dataset. Classification accuracy was evaluated using statistical metrics including the confusion matrix, overall accuracy (OA), and the kappa coefficient.
OA measures the overall correctness of the classification process and is calculated as the ratio of correctly classified pixels to the total number of validation pixels. It is particularly suitable for accuracy assessment when the proportions of land cover classes vary significantly. The formula is as follows, where q represents the number of classes, nii denotes the diagonal elements of the confusion matrix, and n is the total number of classified pixels:
The kappa coefficient accounts for agreement occurring by chance between the classified image and the reference dataset. A kappa value greater than 0.8 indicates near-perfect agreement.
3. Results
3.1. Temporal Variation Characteristics of Water Level
Based on long-term daily water-level observations at the Xingzi station (1956–2022), the long-term mean water level in the study area was 11.28 m, with an observed range of 4.56 m to 20.58 m. Trend analysis reveals a significant downward trajectory over the study period. In particular, 1998 experienced an extreme high-water-level event (annual mean 13.72 m), whereas 2011 registered the lowest annual mean (9.07 m).
Since 2003, the regional hydrological regime has changed markedly. A comparison of monthly mean water levels before and after 2003 shows an overall decline of 0.84 m from 2004 to 2022 (Figure 4). Changes in maximum monthly water levels exhibit strong temporal heterogeneity: aside from July (nearly unchanged), the annual mean decrease was 1.27 m, with the largest drops in January (–2.76 m), March (–2.65 m), and September (–2.53 m). Minimum water-level changes display a pronounced seasonal pattern, with average declines of 2.41 m in May–June and August–November, most notably in August (–3.08 m), September (–3.83 m), and October (–2.46 m). In contrast, slight increases in monthly minima occurred in March–April and July, with April showing the greatest rise (+1.26 m).
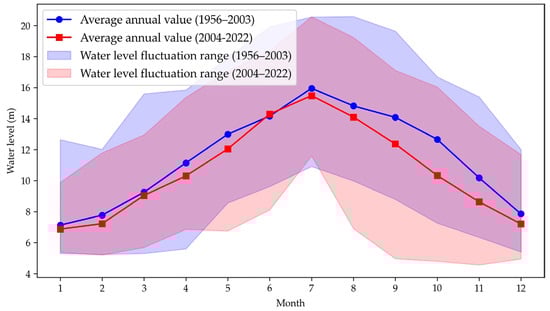
Figure 4.
Monthly average water levels at the Xingzi station for 1956–2003 and 2004–2022.
To analyze the hydrological regimes of the basin, a frequency analysis of daily mean water levels was conducted for two periods: 1956–2003 and 2004–2022. The analysis used 0.5 m intervals, as shown in Figure 5. For the period 1956–2003, the water level range of 13.0–13.5 m showed the longest persistence at 18.9 days. Extended-duration levels were primarily distributed between 10.0 and 14.0 m. However, a marked shift occurred in the period 2004–2022. The 6.0–6.5 m range now had the greatest duration at 21.9 days. Longer-lasting levels were concentrated in the lower 5.5–9.5 m range. These findings indicate a substantial alteration in the basin’s hydrological regimes.
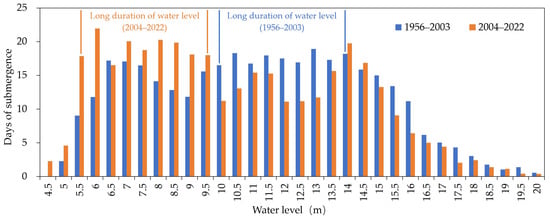
Figure 5.
Comparison of the duration of different water levels between 1956–2003 and 2004–2022.
3.2. Evolution Trend of the Habitat of DSLs
3.2.1. Characteristics of Habitat Succession in DSLs Before and After Extreme Flood and Drought Events
Using multi-source satellite imagery at 10/30 m resolution, a Random Forest classifier (OA > 85%, Kappa > 0.82) was applied to map substrate changes in ecologically sensitive zones during the same seasons one year before and after the 1998 flood, 2020 flood, and 2022 drought (Figure 6). Habitat transition matrices (Figure 7 and Figure 8) were then used to quantify conversion pathways among habitat types, thereby revealing vegetation succession patterns driven by extreme hydrological events.
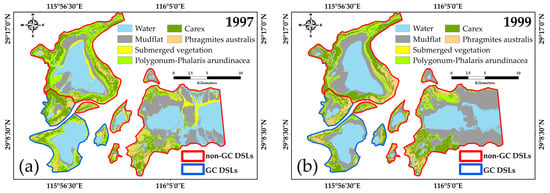
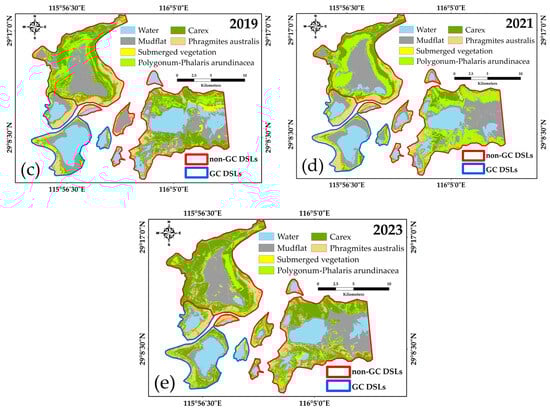
Figure 6.
Distribution of DSL habitats before and after extreme hydrological events. (a) 1997, (b) 1999, (c) 2019, (d) 2021, (e) 2023.
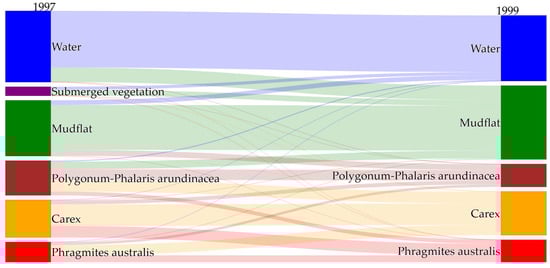
Figure 7.
Characteristics of habitat succession before and after the extreme flood event in 1998.
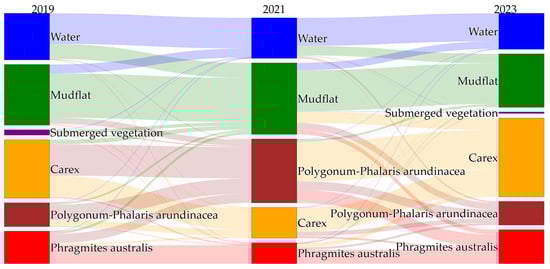
Figure 8.
Characteristics of habitat succession before and after the extreme flood in 2020 and the extreme drought in 2022.
In 1998, the Yangtze Basin experienced a severe flood, which profoundly altered DSL habitats: the mudflat area surged from 62.56 km2 in 1997 to 82.75 km2 in 1999; submerged vegetation formerly concentrated in nearshore shallow zones of Banghu Lake, Dachahu Lake and Changhuchi Lake reduced and nearly disappeared. Areas of Carex spp. and Phragmites australis changed only modestly, increasing from 42.10 km2 and 22.58 km2 to 49.06 km2 and 25.11 km2, respectively; by contrast, Polygonum-Phalaris arundinacea stands declined sharply from 38.93 km2 to 25.77 km2.
The 2020 flood produced a similar succession pattern: mudflats expanded from 67.88 km2 to 79.87 km2, and submerged vegetation fell from 6.04 km2 to near zero—most of it converting to mudflats, with some areas invaded by Polygonum-Phalaris arundinacea. Carex spp. losses (≈35.09 km2) and Phragmites australis losses (≈10.30 km2) were also predominantly converted into Polygonum-Phalaris arundinacea.
Following the 2022 drought, habitats evolved further: 25.38 km2 of former mudflats transitioned to emergent/hygrophilous vegetation, submerged vegetation reappeared, and 44.05 km2 and 14.49 km2 of Polygonum-Phalaris arundinacea converted into Carex spp. and Phragmites australis, respectively.
3.2.2. Evolution of FVC from 2001 to 2024
FVC effectively reflects the density and spatial distribution of vegetation, particularly herbaceous species [39,40,41]. Since Poyang Lake wetlands are dominated by herbaceous plants, FVC provides an accurate measure of vegetation dynamics in this region [42,43,44].
From 2001 to 2024, GC DSLs showed no clear long-term trend in FVC, whereas non-GC DSLs exhibited an increasing trend. Interannual analysis revealed that both lake types reached their highest FVC values in 2023 (0.584 for GC DSLs and 0.578 for non-GC DSLs) and their lowest in 2010 (0.379) and 2002 (0.417), respectively (Figure 9). FVC typically peaks in late spring to early summer (April–June) and declines to its minimum in late autumn through winter (October–February), consistent with natural phenology. The mean monthly FVC was 0.470 for GC DSLs and 0.475 for non-GC DSLs, with coefficients of variation of 0.18 and 0.20, respectively, indicating that GC DSLs experienced more stable vegetation cover, while non-GC DSLs subject to greater hydrological fluctuations and extreme events showed larger variability.
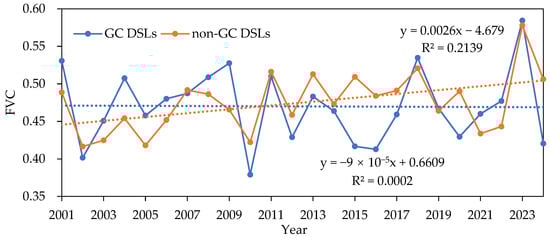
Figure 9.
Annual average FVC trends for GC DSLs and non-GC DSLs from 2001 to 2024.
Spatial patterns of annual mean FVC (Figure 10) indicate that emergent and hygrophilous vegetation in non-GC DSLs expanded downslope toward the lake center, whereas GC DSLs maintained a relatively stable spatial distribution.
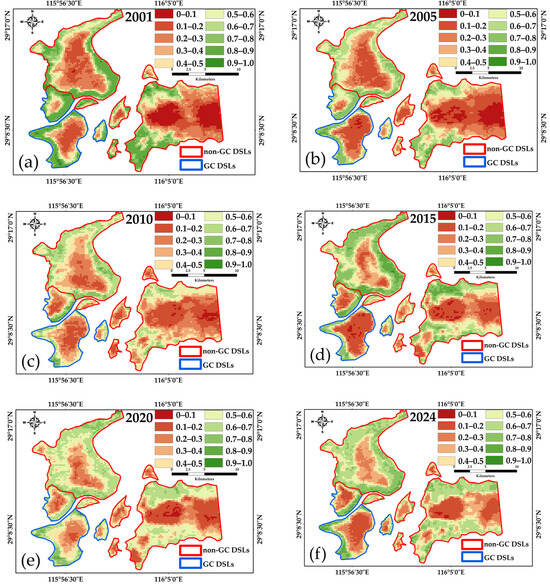
Figure 10.
Spatial distribution of the annual average FVC of typical-year DSLs. (a) 2001, (b) 2005, (c) 2010, (d) 2015, (e) 2020, (f) 2024.
3.3. Trends in the Changes of Water Characteristics
3.3.1. Evolution Trend of the Water Area
From 2016 to 2024, the total water area of the DSL cluster exhibited a declining trend (Figure 11), with peak annual areas of 153.53 km2 in 2016 and 153.05 km2 in 2020, and a minimum of 64.06 km2 in 2023. The range of water area variation for GC DSLs was 28.38 ± 9.94 km2, compared to 104.15 ± 52.00 km2 for non-GC DSLs.
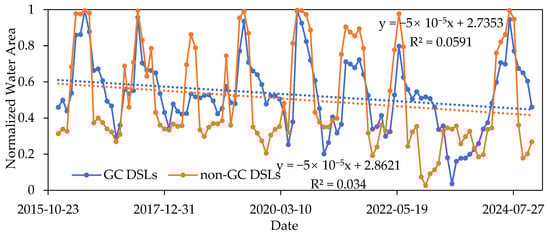
Figure 11.
Comparison of normalized water area between GC DSLs and non-GC DSLs from 2016 to 2024.
All DSLs displayed pronounced seasonality (Figure 12). GC DSLs had a slightly larger water area in autumn (September–November, 29.59 km2) than in spring (March–May, 23.77 km2), with the maximum area in summer (June–August, 34.98 km2) and the minimum in winter (December–February, 22.03 km2). Non-GC DSLs followed a similar pattern, with the highest and lowest areas in summer (159.52 km2) and winter (58.92 km2), respectively, but the autumn area (58.92 km2) was lower than spring (99.70 km2).
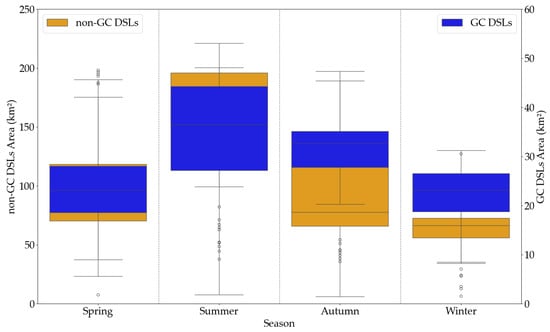
Figure 12.
Comparison of water area by season between GC DSL and non-GC DSL from 2016 to 2024.
This difference likely arises because hydraulic structures in GC DSLs slow inflow before the flood season; once Poyang Lake water levels exceed the subsidiary embankments, rapid expansion occurs. During recession, these structures also slow outflow, maintaining higher water levels in autumn. In contrast, non-GC DSLs, being naturally connected, respond quickly to both rising and falling lake levels.
During the flood season (April–October), GC DSLs and non-GC DSLs showed closely synchronized area trends (correlation coefficient = 0.9632), whereas in the non-flood season (November–March) the correlation dropped to 0.6942. This further indicates that gate-control projects primarily influence the changes in water area of the DSLs during the non-flood season, while their regulatory effect on the water area during the flood season is relatively minor.
3.3.2. Evolution Trend of the Water Area Change Rate
From 2016 to 2024, non-GC DSLs exhibited a mean area increase rate of 1.73 km2/d and a mean area decrease rate of 1.72 km2/d. Their maximum increase and decrease rates were 20.01 km2/d (on 8 June 2020, during the extreme flood) and 8.23 km2/d, with coefficients of variation of 1.31 for increases and 1.08 for decreases. In contrast, GC DSLs showed a mean area increase rate of 0.44 km2/d and a mean area decrease rate of 0.35 km2/d; their maximum increase and decrease rates were 4.29 km2/d and 2.76 km2/d, respectively, with coefficients of variation of 1.24 for increases and 1.15 for decreases. Thus, both the long-term mean rates and the extreme rates of area change in GC DSLs were substantially lower than those in non-GC DSLs (Figure 13).
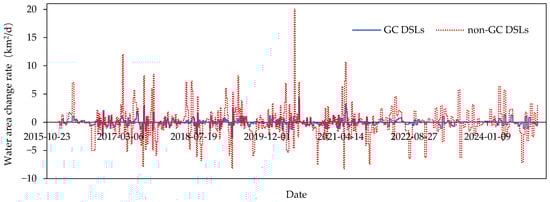
Figure 13.
Comparison of the water area change rate between GC DSLs and non-GC DSLs from 2016 to 2024.
Kernel-density estimation of the water area change rate distributions revealed a skewness of 1.13 for non-GC DSLs, indicating a positively skewed distribution with some large positive change-rate outliers driven by extreme flood years (e.g., 1998 and 2020). GC DSLs had a lower skewness of 0.90, indicating fewer extreme change-rate values and a more symmetric distribution. This reduction in skewness reflects the stabilizing effect of hydraulic structures on lake-area dynamics (Figure 14).
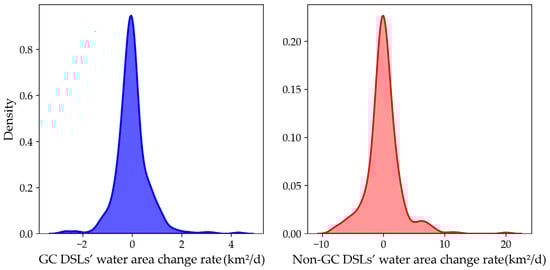
Figure 14.
Density distribution of the water area change rate of GC DSLs and non-GC DSLs from 2016 to 2024.
4. Discussion
4.1. Impacts of Hydrological Regime Change on DSL Habitats
Analysis of daily water level records at the Xingzi station from 1956 to 2022 reveals a long-term decline in the mean water levels of the DSL region, with a mean monthly decline of 0.84 m since 2003. This persistent decrease not only reflects climatic influences on basin hydrology but also highlights the effects of regional water-resource development on downstream flow regimes, thereby altering the DSLs’ hydroperiod [45,46]. Peak water-level reductions exceeded 2.5 m in January, March, and September, demonstrating pronounced temporal heterogeneity that may affect aquatic species distributions, wetland vegetation patterns, and habitat connectivity.
The shift in the duration of inundation from the 10.0–14.0 m band to the 5.5–9.5 m band suggests a transformation of the wetland’s inundation–exposure cycle, with potential consequences for community structure, interspecific competition, and wetland functioning [47,48,49]. December 2024 UAV surveys captured clear zonation extending from shore to lake center (Figure 15): submerged vegetation (e.g., Vallisneria spp., Waterthymes) at low elevations; floating-leaved vegetation (e.g., Trapa bispinosa Roxb., Nymphoides); hygrophilous vegetation (e.g., Polygonum, Phalaris arundinacea, Carex spp.); and emergent stands (e.g., Phragmites australis) at high elevations. As the duration of low-water stages lengthens, emergent and hygrophilous vegetation encroach on lower-elevation zones, displacing former floating-leaf and submerged communities—a pattern confirmed by the 2022 drought, which saw extensive conversion of Polygonum-Phalaris arundinacea flats into higher-elevation Carex spp. and Phragmites australis. The pronounced September water level decline may further influence habitat availability for incoming wintering waterbirds.
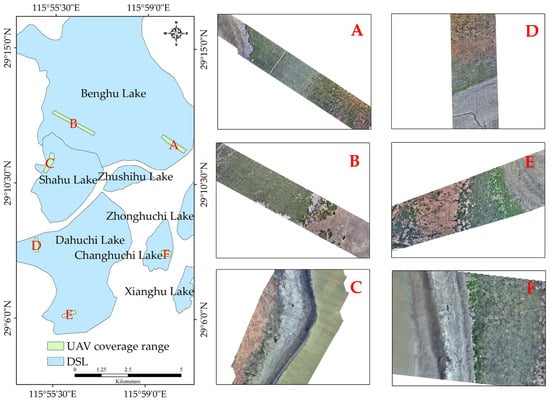
Figure 15.
Distribution of vegetation strips in DSLs captured by UAV in December 2024. (A) Southeastern Benghu Lake, (B) Southwestern Banghu Lake, (C) Western Shahu Lake, (D) Western Dahuchi Lake, (E) Southern Dahuchi Lake, (F) Eastern Changhchi Lake.
Alongside changes in the hydrological regime, the annual mean FVC of the DSLs exhibited interannual fluctuations around an overall increase from 2001 to 2024—rising in GC DSLs and remaining relatively stable in non-GC DSLs. This pattern is primarily driven by declining water levels and prolonged low-water stages, which transform former mudflats into suitable habitats for emergent and hygrophilous vegetation, thereby increasing both mean FVC and biomass (Figure 16).
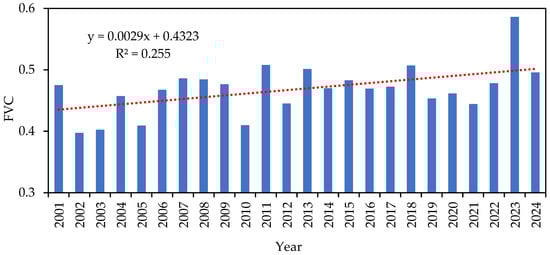
Figure 16.
Annual mean FVC changes of DSLs from 2001 to 2024.
Analysis of habitat succession before and after extreme hydrological events (the 1998 and 2020 floods and the 2022 drought) demonstrates that such events exert pronounced disturbances on the wetland ecosystem. During floods, mudflat area expanded markedly and submerged vegetation experienced collapse, virtually disappearing in 1999 and 2021, while other plant communities (e.g., Carex spp., Polygonum, Phalaris arundinacea, Phragmites australis) exhibited varying degrees of expansion or replacement. These responses indicate that extreme floods, through hydraulic scouring, prolonged inundation, and sediment redistribution, disrupt pre-existing vegetation stability and drive dynamic succession within sensitive wetland zones [48,50].
In contrast, drought events produced opposite effects: some submerged vegetation partially recovered under low-water conditions, likely due to increased water transparency, thereby enhancing photosynthesis and activating the submerged seed bank [51,52,53]. Although this recovery demonstrates ecosystem resilience, it also suggests that frequent extreme droughts may induce long-term shifts in plant community structure, with potential consequences for wetland functions and biodiversity. The patterns observed in Poyang Lake DSLs mirror global trends of wetland degradation under altered hydrological regimes driven by climate change and human activities [54,55,56], underscoring the critical role of hydrology in wetland habitat evolution.
4.2. Impact of Artificial Regulation on the Habitat of DSLs
By integrating water level records from the Xingzi station, DSL FVC measurements, and hydraulic-control classifications, we found that GC DSLs exhibit a lower annual mean FVC in high-water-level years, whereas in low-water-level years their FVC is significantly higher than that of non-GC DSLs (Table 2). Non-GC DSLs experience rapid post-flood water area recession (−1.296 km2/d), exposing mudflats that are quickly colonized by emergent wetland vegetation. In contrast, hydraulic structures in GC DSLs, namely embankments and sluice gates, prolong high-water conditions, resulting in a much slower water-area decline (−0.324 km2/d). Consequently, mudflat exposure is limited, and overall vegetation cover and biomass remain lower than in non-GC DSLs. During low-water-level years, marked by an earlier onset and prolonged dry season at Poyang Lake and relatively lower wet-season water levels, non-GC DSLs undergo intensified drought stress. GC DSLs buffer these hydrological fluctuations, maintaining a mean water area of 23.70 ± 5.28 km2 during the 2022 non-flood season, thereby mitigating the adverse effects of extreme drought on vegetation. Consequently, in low-water-level years GC DSLs exhibit an 8.9% higher annual mean FVC than non-GC DSLs.
Table 2.
Comparison of FVC between GC and non-GC DSLs during typical water level years.
Correlation analysis between the Xingzi station water levels and DSL FVC (Figure 17) shows that non-GC DSLs have a strong negative correlation (Pearson’s r = −0.7072, R2 = 0.4456, p < 0.001), whereas GC DSLs show a weaker negative correlation (Pearson’s r = −0.4383, R2 = 0.1689, p < 0.001). This contrast further indicates that hydraulic regulation attenuates the influence of water level fluctuations on DSL habitat evolution.
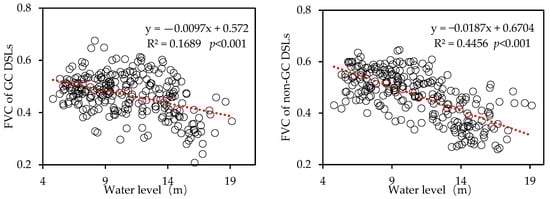
Figure 17.
Correlation analysis between FVC of GC and non-GC DSLs and water level at the Xingzi station.
Table 3 summarizes water area statistics (2016–2024) for four representative DSLs: three GC DSLs (Dahuchi Lake, Shahu Lake, Changhuchi Lake) and one non-GC DSL (Banghu Lake). Banghu Lake exhibits a coefficient of variation (CV) of 0.72—nearly twice those of the GC DSLs—indicating large intra-annual area fluctuations, whereas GC DSLs show relatively minor variability.
Table 3.
Characteristic values of water area changes in typical DSLs.
We selected four representative DSLs and assessed their area coverage before and after the 2020 extreme flood and the 2022 extreme drought. In Banghu Lake, emergent and hygrophilous wetland vegetation covered 69.57% of the lake area in 2019, declined to 63.88% after the 2020 flood, and then increased to 72.50% in 2023 following the 2022 drought. In contrast, GC DSLs, including Dahuchi Lake, Shahu Lake, and Changhuchi Lake, showed different trends. After the 2020 flood, emergent and hygrophilous cover in these lakes increased by 8.93%, 5.16%, and 30.14%, respectively. Following the 2022 drought, Dahuchi Lake and Shahu Lake continued to gain vegetation cover, whereas Changhuchi Lake’s cover declined to 34.32%, remaining nonetheless above its pre-event level. Variations in vegetation response among GC DSLs may result from differences in hydraulic regulation strategies, local topography, and vegetation characteristics across lakes [57].
4.3. Impact of Habitat Evolution of DSLs on Overwintering Migratory Birds
Poyang Lake serves as a critical wintering ground along the East Asian–Australasian Flyway, attracting numerous migratory birds each year. The survival of these birds depends on the stability of the wetland ecosystem and the availability of food resources, both of which are shaped by changes in the hydrological regime, vegetation succession, and hydraulic regulation in the DSL complex of Poyang Lake [30].
Hydrological requirements of wintering birds vary among functional groups. Grallatores (e.g., the indicator species Siberian crane) prefer foraging in shallow water depths of 15–20 cm, whereas natatores (e.g., ducks and geese) forage and rest in deeper waters [58]. Since 2003, Poyang Lake’s water levels have declined overall, especially during the autumn–winter period (September to November), when maximum levels in September fell by as much as 2.53 m. Such declines may reduce shallow-water foraging habitat for wintering grallatores. In contrast, longer durations at low water levels (e.g., more days in the 5.5–9.5 m range) expand mudflat and shoal habitats, temporarily increasing habitat for grallatores. However, excessively low levels can reduce water connectivity and constrain natatores movements. Extreme events amplify these effects. The 1998 and 2020 floods caused rapid water level rises that inundated mudflats and shoals, reducing grallatores foraging grounds, while the 2022 drought drove levels to historic lows and sharply contracted water bodies, likely forcing natatores into limited refugia and intensifying intra- and interspecific competition.
Wetland vegetation succession directly influences food availability. Submerged macrophytes, such as Vallisneria spp. tubers, constitute a key food source for grallatores including the Siberian crane, whereas hygrophilous vegetation, notably Carex spp., provides nutrition for natatores (ducks and geese). Floods frequently induce catastrophic loss of submerged vegetation (e.g., Poyang Lake in 1999 and 2021), leading to food shortages that may force cranes to forage in alternative habitats such as adjacent rice paddies or lotus ponds [59]. Although submerged macrophytes showed partial recovery after the 2022 drought (e.g., in 2023), the magnitude and pace of recovery may remain insufficient to satisfy the nutritional demands of migratory birds. Declining water levels promote downslope expansion of emergent vegetation. Carex spp. in particular expand on newly exposed mudflats, potentially enhancing food resources for natatores.
According to the collected ground-based survey data [60,61,62], extreme flood events had a significant impact on the population size of wintering migratory birds in DSLs. A marked decline in bird numbers was observed in the year of the flood event. Although the population generally rebounded in subsequent years, the number of Siberian cranes did not return to pre-flood levels (Table 4), which is consistent with the analysis presented earlier in the article.
Table 4.
Ground-based investigation of migratory birds.
Hydraulic regulation through GC DSLs buffers the impacts of extreme hydrological events. In drought years (e.g., 2022), hydraulic regulation maintained larger water areas and a mean FVC of 0.477 compared to 0.443 in non-GC DSLs, thereby providing more stable habitat and food supplies. However, sustaining elevated water levels after flood events can delay mudflat exposure, thereby hindering grallatores foraging activity. Moreover, prolonged deviation from natural hydrological regimes may disrupt habitat utilization and adaptive behaviors of migratory birds, warranting further investigation of these cumulative effects.
5. Conclusions
Based on the study of the evolutionary trends and ecological impacts of DSL habitats in Poyang Lake under altered hydrological regimes superimposed with extreme hydrological events, the following key conclusions are drawn: (a) The water level at the Xingzi station in Poyang Lake exhibited a significant declining trend from 1956 to 2022, with a marked shift since 2003, as the duration of high water levels decreased while low water levels became more prolonged. This indicates a substantial alteration in the watershed’s hydrological regime. (b) Extreme flood events led to the catastrophic collapse of submerged vegetation, whereas extreme drought events, on the one hand, facilitated the partial recovery of submerged vegetation, and on the other hand, drove the expansion of emergent and hygrophilous vegetation into lower-elevation lake zones. (c) In GC DSLs, water level control significantly mitigated the ecological impacts of extreme hydrological events. Meanwhile, the trend of habitat evolution was influenced by different regulation strategies, topographic conditions, and the characteristics of pre-existing vegetation. (d) Declining water levels triggered the reassembly of plant communities along elevation gradients, resulting in differential effects on the habitat and food resources available to overwintering migratory birds. (e) Artificial regulation during extreme drought years helped maintain partial water coverage, thereby providing relatively stable foraging and roosting habitats for overwintering migratory birds.
In summary, the interplay between altered hydrological regimes and extreme hydrological events has profoundly reshaped the habitats of DSLs in Poyang Lake. Future research should focus on developing coupled models of water levels, vegetation dynamics, and overwintering migratory birds to quantify the long-term cumulative effects of artificial regulation on biodiversity. Such efforts will provide a scientific basis for adaptive wetland management under evolving river–lake relationships and increasingly frequent hydrological extremes.
Author Contributions
Conceptualization, Y.X. and T.H.; methodology, Y.X.; software, Y.X.; validation, L.-M.C., Y.S. and Z.L.; investigation, Y.X. and H.L.; resources, Q.J.; data curation, L.-M.C.; writing—original draft preparation, Y.X.; writing—review and editing, Y.X.; supervision, L.-G.C.; project administration, L.-G.C.; funding acquisition, Y.X. All authors have read and agreed to the published version of the manuscript.
Funding
This research was funded by the National Key Research and Development Program of China (No.2023YFC3209001).
Data Availability Statement
These data were derived from the following resources, which are available in the public domain: Landsat-5, Sentinel-1, Sentinel-2, and MODIS data can be accessed from https://code.earthengine.google.com/ (accessed on 30 January 2025). The other data supporting the conclusions of this article will be made available by the authors on request.
Conflicts of Interest
The authors declare no conflict of interest.
References
- Guo, M.; Yu, D.K.; Li, Z.; Liu, T.; Jing, J.F.; Wang, Y.Y. The Impact of Extreme Droughts on Aquatic Macrophyte Communities in the Sub-lakes of Poyang Lake. J. Ecol. Rural Environ. 2024, 40, 790–798. (In Chinese) [Google Scholar]
- Chen, J.; Li, Y.L.; Zhou, J.F.; Lu, J.Y.; Wei, L.; Guo, Y.Y. Assessing surface water-groundwater interactions in the seasonal lake-wetland system of Lake Poyang. J. Lake Sci. 2021, 33, 842–853. (In Chinese) [Google Scholar]
- Wei, Z.Z.; Xu, Z.L.; Dong, B.; Xu, H.F.; Lu, Z.P.; Liu, X. Habitat Suitability Evaluation and Ecological Corridor Construction of Wintering Cranes in Poyang Lake. Ecol. Eng. 2023, 189, 106894. [Google Scholar] [CrossRef]
- Hu, B.J.; Hu, X.R.; Nie, X.; Zhang, X.K.; Wu, N.C.; Hong, Y.J.; Qin, H.M. Seasonal and Inter-Annual Community Structure Characteristics of Zooplankton Driven by Water Environment Factors in a Sub-lake of Lake Poyang, China. PeerJ 2019, 7, e7590. [Google Scholar] [CrossRef]
- Xiao, Z.; Li, H.; Li, X.C.; Li, R.H.; Huo, S.L.; Yu, G.L. Geographic Pattern of Phytoplankton Community and Their Drivers in Lakes of Middle and Lower Reaches of Yangtze River Floodplain, China. Environ. Sci. Pollut. Res. 2022, 29, 83993–84005. [Google Scholar] [CrossRef]
- Liu, X.; Qian, K.M.; Chen, Y.W.; Gao, J.F. A Comparison of Factors Influencing the Summer Phytoplankton Biomass in China’s Three Largest Freshwater Lakes: Poyang, Dongting, and Taihu. Hydrobiologia 2017, 792, 283–302. [Google Scholar] [CrossRef]
- Liu, Y.B.; Wu, G.P. Hydroclimatological Influences on Recently Increased Droughts in China’s Largest Freshwater Lake. Hydrol. Earth Syst. Sci. 2016, 20, 93–107. [Google Scholar] [CrossRef]
- Liu, Q.; Liu, J.; Liu, H.; Liang, L.; Cai, Y.P.; Wang, X.; Li, C.H. Vegetation Dynamics under Water-Level Fluctuations: Implications for Wetland Restoration. J. Hydrol. 2020, 581, 124418. [Google Scholar] [CrossRef]
- Han, Z.; Sun, L.; Wang, S.Y.; Wang, J.; Liu, X.B.; Peng, W.Q. Research Progress of Numerical Simulation of Wetland Plant Ecology and Research Example of Poyang Lake Wetland. J. China Inst. Water Resour. Hydropower Res. 2022, 22, 539–557. (In Chinese) [Google Scholar]
- Shao, M.Q.; Jiang, J.H.; Hong, G.X.; Zeng, B.B. Abundance, Distribution and Diversity Variations of Wintering Water Birds in Poyang Lake, Jiangxi Province, China. Pak. J. Zool. 2014, 46, 451–462. [Google Scholar]
- Wang, Y.F.; Chen, Q.; Li, L.; Ding, H.F.; Fraser, J.D.; Hou, J.J.; Wang, W.J. The Cascading Effects of Submerged Macrophyte Collapse on Geese at Poyang Lake, China. Freshw. Biol. 2023, 68, 926–939. [Google Scholar] [CrossRef]
- Li, Y.K.; Zhong, Y.F.; Shao, R.Q.; Yan, C.; Jin, J.F.; Shan, J.H.; Li, F.S.; Ji, W.T.; Li, B.; Zhang, X.Y.; et al. Modified Hydrological Regime from the Three Gorges Dam Increases the Risk of Food Shortages for Wintering Waterbirds in Poyang Lake. Glob. Ecol. Conserv. 2020, 24, e01286. [Google Scholar] [CrossRef]
- Dai, X.; Wan, R.; Yang, G.; Wang, X.; Xu, L.; Li, Y.; Li, B. Impact of Seasonal Water-Level Fluctuations on Autumn Vegetation in Poyang Lake Wetland, China. Front. Earth Sci. 2019, 13, 398–409. [Google Scholar] [CrossRef]
- Tan, Z.; Jiang, J. Spatial–Temporal Dynamics of Wetland Vegetation Related to Water Level Fluctuations in Poyang Lake, China. Water 2016, 8, 397. [Google Scholar] [CrossRef]
- Ren, Q.; Yuan, J.; Wang, J.; Liu, X.; Ma, S.; Zhou, L.; Miao, L.; Zhang, J. Water Level Has Higher Influence on Soil Organic Carbon and Microbial Community in Poyang Lake Wetland than Vegetation Type. Microorganisms 2022, 10, 131. [Google Scholar] [CrossRef]
- Zhu, F.; Yuan, J.; Hou, Z.; Guo, X.; Liao, W.; Yang, S.; Chu, Z. Seasonal Water Level Changes Affect Plant Diversity and Littoral Widths at Different Elevation Zones in the Erhai Lake. Front. Plant Sci. 2025, 16, 1503627. [Google Scholar] [CrossRef]
- Huang, W.; Liu, X.; Tian, L.; Cui, G.; Liu, Y. Vegetation and Carbon Sink Response to Water Level Changes in a Seasonal Lake Wetland. Front. Plant Sci. 2024, 15, 1445906. [Google Scholar] [CrossRef]
- Zhao, Y.; Mao, D.; Zhang, D.; Wang, Z.; Du, B.; Yan, H.; Qiu, Z.; Feng, K.; Wang, J.; Jia, M. Mapping Phragmites australis Aboveground Biomass in the Momoge Wetland Ramsar Site Based on Sentinel-1/2 Images. Remote Sens. 2022, 14, 694. [Google Scholar] [CrossRef]
- Zhang, X.; Liu, Y.; Zhao, W.; Li, J.; Xie, S.; Zhang, C.; He, X.; Yan, D.; Wang, M. Impact of Hydrological Changes on Wetland Landscape Dynamics and Implications for Ecohydrological Restoration in Honghe National Nature Reserve, Northeast China. Water 2023, 15, 3350. [Google Scholar] [CrossRef]
- Lin, Y.L.; Li, X.H.; Tan, Z.Q.; Song, Y.Y.; Xu, C.Y. Dynamic Characteristics of Vegetation Communities in the Floodplain Wetland of Lake Poyang Based on Spatio-Temporal Fusion of Remote Sensing Data. J. Lake Sci. 2023, 35, 1408–1422. (In Chinese) [Google Scholar]
- Wang, X.; Guo, Y. Spatio-Temporal Analysis of Water Area Variability in Poyang Lake (2012–2021) Using Remote Sensing. J. Comput. Methods Sci. Eng. 2024, 25, 1432–1447. [Google Scholar] [CrossRef]
- Xia, Y.; Fang, C.; Lin, H.; Li, H.; Wu, B. Spatiotemporal Evolution of Wetland Eco-Hydrological Connectivity in the Poyang Lake Area Based on Long Time-Series Remote Sensing Images. Remote Sens. 2021, 13, 4812. [Google Scholar] [CrossRef]
- Larson, D.M.; Cordts, S.D.; Hansel-Welch, N. Shallow Lake Management Enhanced Habitat and Attracted Waterbirds during Fall Migration. Hydrobiologia. 2020, 847, 3365–3379. [Google Scholar] [CrossRef]
- Aharon-Rotman, Y.; McEvoy, J.; Zhaoju, Z.; Yu, H.; Wang, X.; Si, Y.; Xu, Z.; Yuan, Z.; Jeong, W.; Cao, L.; et al. Water Level Affects Availability of Optimal Feeding Habitats for Threatened Migratory Waterbirds. Ecol. Evol. 2017, 7, 10440–10450. [Google Scholar] [CrossRef]
- Holm, T.E.; Clausen, P. Effects of Water Level Management on Autumn Staging Waterbird and Macrophyte Diversity in Three Danish Coastal Lagoons. Biodivers. Conserv. 2006, 15, 4399–4423. [Google Scholar] [CrossRef]
- Rajpar, M.N.; Zakaria, M. Effects of Water Level Fluctuation on Waterbirds Distribution and Aquatic Vegetation Composition at Natural Wetland Reserve, Peninsular Malaysia. Int. Sch. Res. Not. 2011, 2011, 324038. [Google Scholar] [CrossRef][Green Version]
- Zhao, D.H.; Lv, M.T.; Jiang, H.; Cai, Y.; Xu, D.L.; An, S.Q. Spatio-Temporal Variability of Aquatic Vegetation in Taihu Lake over the Past 30 Years. PLoS ONE 2013, 8, e66365. [Google Scholar] [CrossRef]
- Li, Y.; Dong, X.; Hu, C. The Impact of Ecological Water Level on Wintering Migratory Birds in Poyang Lake–Focusing on Phytophagous Geese. Ecol. Indic. 2024, 169, 112946. [Google Scholar] [CrossRef]
- Li, X.; Hu, B.S.; Qi, S.H.; Luo, J. The Influence of Short-Term Water Level Fluctuations on the Habitat Response and Ecological Fragility of Siberian Cranes in Poyang Lake, China. Remote Sens. 2024, 16, 4431. [Google Scholar] [CrossRef]
- Duan, H.L.; Pan, Y.W.; Yu, X.B.; Xia, S.X. Effects of Habitat Change on the Wintering Waterbird Community in China’s Largest Freshwater Lake. Remote Sens. 2023, 15, 4582. [Google Scholar] [CrossRef]
- Yu, F.H.; Zhai, J.C.; Huang, Z.Q.; Chen, J.M.; Han, F.Q.; Wang, L.B. The Impact of Poyang Lake Water Level Changes on the Landscape Pattern of Wintering. Glob. Ecol. Conserv. 2025, 58, e03453. [Google Scholar]
- Sun, F.D.; Ma, R. Hydrologic Changes of Poyang Lake Based on Radar Altimeter and Optical Sensor. Acta Geogr. Sin. 2020, 75, 544–557. [Google Scholar]
- Li, B.; Zhang, A.Z.; Sun, G.Y.; Pan, Z.J.; Fu, H. Extraction of Typical Vegetation Communities in Poyang Lake Wetland Based on Time Series Sentinel-2 Images. Remote Sens. Technol. Appl. 2024, 39, 1271–1283. (In Chinese) [Google Scholar]
- Breiman, L. Random Forests. Mach. Learn. 2001, 45, 5–32. [Google Scholar] [CrossRef]
- Bey, A.; Sánchez-Paus Díaz, A.; Maniatis, D.; Marchi, G.; Mollicone, D.; Ricci, S.; Bastin, J.F.; Moore, R.; Federici, S.; Rezende, M.; et al. Collect Earth: Land Use and Land Cover Assessment through Augmented Visual Interpretation. Remote Sens. 2016, 8, 807. [Google Scholar] [CrossRef]
- Gutman, G.; Ignatov, A. The Derivation of the Green Vegetation Fraction from NOAA/AVHRR Data for Use in Numerical Weather Prediction Models. Int. J. Remote Sens. 1998, 19, 1533–1543. [Google Scholar] [CrossRef]
- Jia, S.; Xue, D.; Li, C.; Zheng, J.; Li, W.Q. Study on New Method for Water Area Information Extraction Based on Sentinel-1 Data. Yangtze River 2019, 50, 213–217. (In Chinese) [Google Scholar]
- Meng, Q.G.; Zeng, Q.M. Water body extraction method from spaceborne ascending and descending polarimetric SAR data based on principal component analysis. J. Geo-Inf. Sci. 2024, 26, 1057–1074. (In Chinese) [Google Scholar]
- Zhang, W.; Yang, X.; Manlike, A.; Jin, Y.X.; Zheng, F.L.; Guo, J.; Shen, G.; Zhang, Y.J.; Xu, B. Comparative Study of Remote Sensing Estimation Methods for Grassland Fractional Vegetation Coverage–A Grassland Case Study Performed in Ili Prefecture, Xinjiang, China. Int. J. Remote Sens. 2019, 40, 2243–2258. [Google Scholar] [CrossRef]
- Zhang, S.; Chen, H.; Fu, Y.; Niu, H.; Yang, Y.; Zhang, B. Fractional Vegetation Cover Estimation of Different Vegetation Types in the Qaidam Basin. Sustainability 2019, 11, 864. [Google Scholar] [CrossRef]
- Miao, Z.G.; Chen, J.; Wang, C.L.; Zhang, S.H.; Ma, Y.J.; Dong, T.C.; Zhao, Y.; Shi, R.; Zhao, J. Global Dynamics of Grassland FVC and LST and Spatial Distribution of Their Correlation (2001–2022). Plants 2025, 14, 439. [Google Scholar] [CrossRef] [PubMed]
- Cunnick, H.; Ramage, J.M.; Magness, D.; Peters, S.C. Mapping Fractional Vegetation Coverage across Wetland Classes of Sub-Arctic Peatlands Using Combined Partial Least Squares Regression and Multiple Endmember Spectral Unmixing. Remote Sens. 2023, 15, 1440. [Google Scholar] [CrossRef]
- Ganju, N.K.; Couvillion, B.R.; Defne, Z.; Ackerman, K.V. Development and Application of Landsat-Based Wetland Vegetation Cover and Unvegetated-Vegetated Marsh Ratio (UVVR) for the Conterminous United States. Estuaries Coasts 2022, 45, 1861–1878. [Google Scholar] [CrossRef]
- Kang, M.P.; Zhao, C.Z.; Li, X.Y.; Ma, M.; Zhao, X.W. Temporal and Spatial Characteristics of Vegetation Coverage and Their Influencing Factors in the Sugan Lake Wetland on the Northern Margin of the Qinghai–Tibet Plateau. Front. Ecol. Evol. 2023, 11, 1097817. [Google Scholar] [CrossRef]
- Ye, X.C.; Li, Y.L.; Li, X.H.; Zhang, Q. Factors Influencing Water Level Changes in China’s Largest Freshwater Lake, Poyang Lake, in the Past 50 Years. Water Int. 2014, 39, 983–999. [Google Scholar] [CrossRef]
- Xue, C.Y.; Zhang, Q.; Jia, Y.X.; Yuan, S.Y. Intensifying Drought of Poyang Lake and Potential Recovery Approaches in the Dammed Middle Yangtze River Catchment. J. Hydrol. Reg. Stud. 2023, 50, 101548. [Google Scholar] [CrossRef]
- Wu, Q.; Wang, F.; Chen, Y.W.; Zou, W.X.; Zhu, Z.G. Diazotrophic Community in the Sediments of Poyang Lake in Response to Water Level Fluctuations. Front. Microbiol. 2024, 15, 1324313. [Google Scholar] [CrossRef]
- Liu, Y.; Li, J.; Liu, Y.; He, L.; Yang, S.S.; Gong, H.Y.; Xu, R.X.; Yao, X.Z.; Ge, G. Interactive Effects of Flooding Duration and Sediment Texture on the Growth and Adaptation of Three Plant Species in the Poyang Lake Wetland. Biology 2023, 12, 944. [Google Scholar] [CrossRef]
- Lai, X.H.; Zeng, H.; Zhao, X.M.; Shao, Y.W.; Guo, X. Impact of Extreme Drought on Vegetation Greenness in Poyang Lake Wetland. Forests 2024, 15, 1756. [Google Scholar] [CrossRef]
- Ma, S.; Ren, J.L.; Wu, C.L.; He, Q. Extreme Precipitation Events Trigger Abrupt Vegetation Succession in Emerging Coastal Wetlands. Catena 2024, 241, 108066. [Google Scholar] [CrossRef]
- He, S.; Xu, J.J.; Yi, Y.J.; Zhang, E.Z. Variations in Aquatic Vegetation Diversity Responses to Water Level Sequences during Drought in Lakes under Uncertain Conditions. Water 2023, 15, 2395. [Google Scholar] [CrossRef]
- Ma, M.; Ma, Z.; Du, G. Effects of Water Level on Three Wetlands Soil Seed Banks on the Tibetan Plateau. PLoS ONE 2014, 9, e101458. [Google Scholar] [CrossRef] [PubMed]
- Byrd, K.B.; Lorenz, A.A.; Anderson, J.A.; Wallace, C.S.A.; Leary, K.A.M.; Isola, J.; Ortega, R.; Reiter, M. Quantifying Drought’s Influence on Moist Soil Seed Vegetation in California’s Central Valley through Remote Sensing. Ecol. Appl. 2020, 30, e02153. [Google Scholar] [CrossRef] [PubMed]
- Long, K.E.; Schneider, L.; Connor, S.E.; Shulmeister, N.; Finn, J.; Roberts, G.L.; Zawadzki, A.; Enge, T.G.; Smol, J.P.; Ballard, C.; et al. Human Impacts and Anthropocene Environmental Change at Lake Kutubu, a Ramsar Wetland in Papua New Guinea. Proc. Natl. Acad. Sci. USA 2021, 118, e2022216118. [Google Scholar] [CrossRef] [PubMed]
- Loiselle, A.; Proulx, R.; Larocque, M.; Pellerin, S. Resilience of Lake-Edge Wetlands to Water Level Changes in a Southern Boreal Lake. Wetl. Ecol. Manag. 2021, 29, 867–888. [Google Scholar] [CrossRef]
- Pal, S.; Singha, P. Linking River Flow Modification with Wetland Hydrological Instability, Habitat Condition, and Ecological Responses. Environ. Sci. Pollut. Res. 2023, 30, 11634–11660. [Google Scholar] [CrossRef]
- Meeker, J.E.; Wilcox, D.A.; Harris, A.G. Changes in Wetland Vegetation in Regulated Lakes in Northern Minnesota, USA Ten Years after a New Regulation Plan Was Implemented. Wetlands 2018, 38, 437–449. [Google Scholar] [CrossRef]
- Wu, J.D.; Li, F.S. Study on the Relationship Between the Behavioral Choices of Wintering Waterbirds and Water Level as Well as Food Availability. In Annual Monitoring Report of Natural Resources of Poyang Lake National Nature Reserve in 2010; Zhu, Q., Liu, G.H., Wu, J.D., Eds.; Fudan University Press: Shanghai, China, 2011; pp. 100–109. [Google Scholar]
- Ding, H.F.; Chen, Q.; Wang, Y.F.; Zhu, Z.W.; Zhou, H.Y.; Wang, W.J. Interspecific Relationships between Tundra Swans Cygnus columbianus and Siberian Cranes Leucogeranus leucogeranus in the Lotus Ponds Reclamation Area around Poyang Lake. Chin. J. Zool. 2024, 59, 161–171. (In Chinese) [Google Scholar]
- Xu, Z.W.; Hu, L.; Yu, D.K.; Xiong, C.Y.; Wang, S.Q.; Hao, N.Z.; Yu, C.; Ye, T. Monitoring of Wintering Waterbirds. In Annual Monitoring Report of Natural Resources of Poyang Lake National Nature Reserve in 2019–2020; Liu, G.H., Yu, D.K., Lu, H., Eds.; Jiangxi Science and Technology Press: Nanchang, China, 2020; pp. 125–148. [Google Scholar]
- Zhu, Q.; Yu, D.K.; Zeng, J.X.; Zeng, Q.L.; Zeng, G.H.; Xiong, X.H.; Qi, Y.B.; Tang, C.Q. Monitoring of Wintering Waterbirds by the Conversation and Management Stations of Poyang Lake National Nature Reserve. In Annual Monitoring Report of Natural Resources of Poyang Lake National Nature Reserve in 2020–2021; Zhu, Q., Liu, G.H., Gong, L.Q., Eds.; Jiangxi Science and Technology Press: Nanchang, China, 2021; pp. 116–132. [Google Scholar]
- Xu, Z.W.; Yu, D.K.; Mei, Y.; Yu, J.P.; Yang, R.X.; Qiu, W.H.; Hong, R.; Luo, H. Monitoring of Wintering Waterbirds by the Conversation and Management Stations of Poyang Lake National Nature Reserve. In Annual Monitoring Report of Natural Resources of Poyang Lake National Nature Reserve in 2021–2022; Zhu, Q., Liu, G.H., Gong, L.Q., Eds.; Jiangxi Science and Technology Press: Nanchang, China, 2022; pp. 119–132. [Google Scholar]
Disclaimer/Publisher’s Note: The statements, opinions and data contained in all publications are solely those of the individual author(s) and contributor(s) and not of MDPI and/or the editor(s). MDPI and/or the editor(s) disclaim responsibility for any injury to people or property resulting from any ideas, methods, instructions or products referred to in the content. |
© 2025 by the authors. Licensee MDPI, Basel, Switzerland. This article is an open access article distributed under the terms and conditions of the Creative Commons Attribution (CC BY) license (https://creativecommons.org/licenses/by/4.0/).