Abstract
Glacial hazards pose significant threats to millions globally, especially with rapid climate warming drawing increased attention. Understanding past glacial hazards on both global and regional scales is crucial for early warning systems. This study quantified glacier and glacial lake changes on the Tibetan Plateau (TP) over recent decades and analyzed the spatial and temporal distribution of major glacial hazards. It also focused on glacial lakes that have experienced outburst events by reconstructing long-term data for 48 lakes. Key findings include: (1) TP glaciers have generally shrunk, with glacier area decreasing from 57,100 km2 in the first inventory to 44,400 km2 in the second, primarily in the middle and eastern Himalayas between 5000 and 6000 m. Meanwhile, the number of glacial lakes increased from 14,487 in 1990 to 16,385 in 2020, expanding towards higher elevations and glacier melt zones. (2) Since 1900, 283 glacial hazards have occurred, including 97 glacier surges, 36 glacier-related slope failures, and 150 glacial lake outburst floods (GLOFs). Hazard frequency increased post-2000, especially in the Karakoram and eastern Himalayas, during June to September. (3) Changes in glacier numbers contribute most to hazard frequency (11.56%), followed by July’s temperature change (10.24%). Slope and June’s temperature changes combined have the highest interaction effect (37.59%). (4) Of the 48 lakes studied, four disappeared after outbursts, 38 remained stable, and six expanded. These insights aid in monitoring, early warnings, and disaster management.
1. Introduction
Glaciers are essential freshwater resources globally but also significant indicators of climate change [1,2]. With global warming increasing at an unprecedented rate [3], glaciers worldwide are melting at an accelerated pace [4,5]. Tibetan Plateau (TP) is the most developed region for modern glaciers worldwide, excluding Antarctica and the Arctic [6]. As China’s most glacier-concentrated region, it accounts for approximately 14.5% of the global glacier area [7]. As one of the major glacier distribution areas globally and the source region of major rivers in Asia, the TP is facing an imbalance problem under the accelerated warming [8], which is characterized by rapid melting of solid water and an increasing trend in liquid water [9]. This solid and liquid water imbalance directly exacerbates glacial hazards risks [4], including glacier surge, ice avalanche, and glacial lake outburst floods (GLOFs). These impacts and reach may be further extended by interaction with entrained and relocated deposits, leading to debris flows and debris floods, posing great threat to the hundreds of kilometers downstream [10].
Glacial hazards exhibit typical chain-like characteristics [11] (Figure 1): Glacier melting and retreat reduce the stability of the ice mass and provide an adequate water source supply to the basin formed by glacial erosion, creating numerous glacial lakes with moraine dams [12,13]. During glacier movement, the ice mass slides or enters the glacial lake under the force of gravity, causing the lake water to breach the dam and discharge a large amount of sediment, mud, and rock debris, resulting in devastating impacts on the lives and property of downstream populations and the safety of road infrastructure. For example, a multi-hazard chain event occurred in the Sikkim Himalaya (India) on 3 October 2023, initiated by the catastrophic collapse of 14.7 million m3 of ice-rich lateral moraine into South Lhonak Lake [10]. The resulting tsunami-magnitude wave (~20 m height) breached the terminal moraine, releasing approximately 50 million m3 of lake water downstream. Comparatively, the 17 July 2016 ice-rock avalanche in Tibet’s Aru Range [14] exemplifies extreme high-mountain risks: the sliding mass deposited debris up to 30 m thick across 10 km2, claiming nine lives and over 350 livestock in Dungru Village. This unprecedented event, distinguished by its massive deposit volume, stands among the largest documented ice avalanches in modern history. Under the background of increasing human activities and accelerating climate warming, millions of people around the world are exposed to impacts from potential glacial hazards [15]. Understanding the mechanism of glacial hazards and establishing an effective monitoring and early warning mechanism have become current global research hotspots.
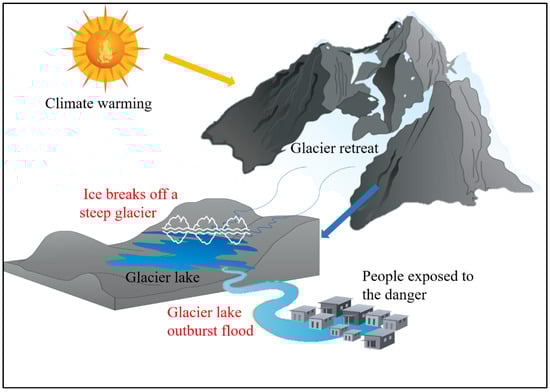
Figure 1.
Illustration of glacial hazards chain. Glacial disasters often exhibit a typical chain of events: glacier surges lead to ice collapses (sometimes triggered by rapid warming) → the collapse of ice causes ice masses to enter rivers or lakes → this results in damming or glacial lake outbursts, which in turn trigger floods → floodwaters then rush downstream along valleys, leading to flash floods and mudslides.
The earliest research on glacial hazards on the TP can be traced back to investigating glacial debris flows in Guxiang gully in the southeastern Tibet Autonomous Region [16]. The intense melting of glaciers in the upper reaches of Guxiang gully provides abundant meltwater and loose sediment, and the warm and humid climate accelerates the weathering and collapse of bedrock. The narrow gorge and steep terrain contribute to frequent glacial debris flow events in Guxiang gully, including several catastrophic disasters. Subsequently, Du et al. [17] systematically discussed the characteristics of glacier debris flows in southeastern Tibet, pointing out that glacier retreats and climate fluctuations are the leading causes of glacier debris flow occurrences. As glacier research deepened under the background of rapid development of earth observation techniques, studies on glacial hazards on the TP became more abundant, including the categorization, causes, simulation, monitoring, and early warning of typical glacial hazards [18,19,20]. Previous studies have also discussed the research progress on different types of glacial hazards [18,21,22], Wu et al. [23] were the first to discuss glacial hazards on the TP and its surrounding areas. Tang et al. [24] presented the first inventory and identified the ice avalanches and GLOFs on the TP. Generally, the existing research can be roughly divided into two categories: one focuses on reviewing and analyzing past glacier disaster events to understand the mechanisms behind their occurrence [25,26,27]; the other conducts risk assessment studies for potential future disasters [19,28,29], aiming to establish effective early warning systems. The key link between these two types of research is historical glacial hazards events, especially those with clear timelines and related data accumulation. With the rapid development of satellite remote sensing, numerous unreported glacial hazards events have been detected across different types and scales [30,31,32,33]. Retrospective analysis of historical hazard events and spatiotemporal analysis can help establish effective monitoring and early warning mechanisms [34]. Furthermore, changes in hazards frequency and intensity also help us understand the impact of climate change on disasters. What are the triggering mechanisms of glacial disasters on the TP? How is the frequency of glacier disasters on the TP changing in the context of rapid warming? However, there has not been a systematic review of glacial hazards on the TP. Furthermore, how about the statuses of these glaciers or glacial lakes post the disaster events?
Based on this, this study compiles the existing literature and datasets to comprehensively analyze the major glacial hazard events and their spatiotemporal distribution characteristics in the TP. Given the chain-reaction characteristics of glacial hazards, we first analyzed the spatiotemporal variations of trigger points (glaciers) and outburst points (glacial lakes) for glacial hazard initiation. Subsequently, we selected three primary types of glacial hazards, including glacier-related slope failures (including ice avalanches, ice-rock avalanches, glacier collapses, and rock avalanches on glaciers), and glacial lake outburst floods (GLOFs), with a focus on examining their spatial distribution patterns and frequency variations. Building upon this foundation, we investigated the key factors influencing the spatial distribution of glacial hazards across the TP by integrating glacier/glacial lake dynamics, climate change, and topographic conditions. Finally, we conducted a long-term time series analysis of area variations for glacial lakes with recurrent outburst histories. The aim is to identify the high-risk areas for glacial hazards and provide necessary references for monitoring glacial hazards on the TP.
2. Materials and Methods
2.1. Study Area
The Tibetan Plateau (TP) has an area of approximately 2.57 million km2, accounting for 26.8% of China’s total land area. It stretches from the southern edge of the Himalayas to the northern side of the Kunlun and Qilian Mountains, spanning approximately 13 degrees of latitude. In China, the TP extends from the Pamir Plateau in the west to the Hengduan Mountains in the east, covering 31 degrees of longitude [35] (Figure 2). As the highest plateau in the world, the average elevation of the TP exceeds 4000 m. It is known as the “Roof of the World” and the “Third Pole of the Earth”. The TP’s climate is cold and dry, and its unique climatic conditions make it the most extensive distribution area of modern glaciers in the middle and low latitudes worldwide. It accounts for 79.5% of the total number of glaciers in China, 84% of the total glacier area, and 81.6% of the glacier storage [36]. The glacial meltwater from this region is the source of many major rivers in Asia, earning it the reputation of being the “Water Tower of Asia” [9]. Since the 1990s, due to global warming, the TP has been warming several times faster than global warming. Glaciers on the TP are generally undergoing rapid melting, and the glaciers on the TP are entering a phase of overall retreat [37]. The risk of glacial hazards is increasing, and related hazard events are frequent. For example, on 16 October 2018, an ice avalanche occurred downstream of Gala Village in Milin County, Yarlung Tsangpo River (Yarlung Zangbo River), causing the river to block and the water level to rise due to the ice avalanche and the ice debris carried by it. This ice avalanche event resulted in an ice avalanche dam forming, severely threatening the lives, property, and infrastructure downstream. On 17 July 2016, an ice avalanche in Aru, Rutog County, Tibet, claimed the lives of nine herders and resulted in the loss of hundreds of livestock. Earlier that month, on July 5, the Zhamabu glacial lake in Nyalam County, Tibet, experienced an outburst flood, causing significant damage to the Bhotekoshi hydropower station and the China-Nepal highway in Nepal.
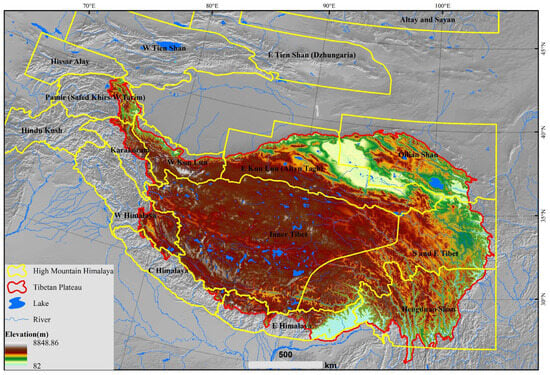
Figure 2.
Geographical location of Tibetan Plateau. The Tibetan Plateau boundary is obtained from Zhang et al. [35].
2.2. Glacial Hazards Related Datasets Comparison and Selection
The chain of past glacier disasters indicates that the destabilization of the main glacier body or glacial lakes is often the trigger for disasters, particularly in areas of rapid glacier melting and where glacial lakes are expanding rapidly. Therefore, changes in glaciers and glacial lakes are critical for understanding climate change impacts [38], and have certain indicative significance for the occurrence of glacier hazards. The glacier distribution data used in this study is obtained from the first Chinese Glacier Inventory (CGI-1) (1978–2002) [39] and the second Chinese Glacier Inventory (CGI-1) (2006–2011) [40]. CGI-1 and CGI-2 gathered glacier outlines and essential parameters—including geographic location, area, length, orientation, and elevation—across two distinct periods (the 1950s to the 1980s and the 2000s to the 2010s). This data is crucial for enhancing our understanding of the distribution and changes in China’s glaciers [41].
Numerous studies have mapped the glacial lake distribution across scales ranging from global to regional, though significant variations exist in glacial lakes numbers, size, types, etc. (Figure 3) [42]. We systematically collected 13 sets of glacial lake distribution datasets covering the entire Tibetan Plateau (TP) (Table S1), including 3 global-scale glacial lake datasets [43,44,45], 5 High Mountain Asia (HMA) regional glacial lake datasets [46,47,48,49,50], 4 Third Pole regional glacial lake datasets [42,51,52,53], and 1 TP glacial lake dataset [54]. Landsat data have been widely applied due to their relatively long time series, with corresponding datasets mostly spanning from 1990 onwards. Only 2 datasets utilized Sentinel data, both of which were developed in recent years. Significant variations exist in the minimum glacial lake area thresholds across studies: 9 datasets set thresholds below 0.01 km2. Zhang et al. [52] defined the minimum identifiable glacial lake in the Third Pole region as 3 pixels (~0.0027 km2). Wang et al. defined the minimum identifiable glacial lake in the HMA region as 6 pixels (~0.0054 km2). Zhang et al. [48], Chen et al. [49], and Dou et al. [54] set the minimum identifiable glacial lake in both HMA and the TP regions as 9 pixels (~0.0081 km2). Previous studies have revealed that a glacial lake in Poiqu River basin, with a maximum pre-outburst area not exceeding 0.01 km2, still triggered severe casualties and substantial property damage during its outburst [55]. Consequently, we emphasize that glacial lakes smaller than 0.01 km2 merit heightened attention in risk assessment and monitoring efforts. Current glacial lake dataset extraction methodologies can be broadly categorized into three approaches: automated methods, semi-automated methods, and manual visual interpretation. Among the collected 13 datasets, only 3 datasets employed fully automated extraction methods, while 5 datasets applied semi-automated mapping approach, and the other 5 datasets applied manual visual interpretation. Chen et al. [49] pioneered an automated extraction approach for glacial lake mapping, followed by manual corrections to refine the results. Visual interpretation remains the predominant technique for glacial lake delineation, particularly in topographically complex regions where spectral heterogeneity of water bodies poses challenges for automated algorithms. Its adaptability across diverse glacial environments and ability to maintain high positional accuracy have established it as the benchmark method for comparative studies in high-mountain hydrology [43]. Which dataset best reflects the true distribution of glacial lakes on the TP? Through comparisons above, we found that only one dataset can cover all the reported glacial lake outburst floods, published by Wang et al. [47]. The dataset utilizes Landsat images and employs visual interpretation methods to extract the boundaries of glacial lakes in HMA for the years 1990 and 2020.
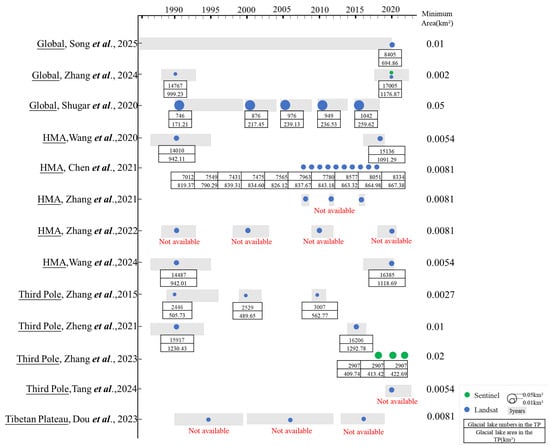
Figure 3.
Summary of published glacial lakes datasets across different scales, including Global (Song et al. [45], 2025; Zhang et al. [43], 2024; Shugar et al. [44], 2020), High Mountain Asia (HMA) (Wang et al. [46], 2020; Chen et al. [49], 2021; Zhang et al. [50], 2021; Zhang et al. [48], 2022; Wang et al. [47], 2024), Third Pole (Zhang et al. [52], 2015; Zheng et al. [51], 2021; Zhang et al. [42], 2023; Tang et al. [53], 2024), and Tibetan Plateau (Dou et al. [54], 2023). Grey bars show the composite years of cloud-free scenes. Blue and green circles denote the satellite source, the circles were scaled according to the minimum size of mapped glacial lakes. Glacial lake numbers and area in Tibetan Plateau of each dataset were counted and filled in the table.
Three main glacial hazards events, including glacier surges [56], glacier-related slope failures (including ice avalanches, ice-rock avalanches, glacier collapses, and rock avalanches on glaciers), and glacial lake outburst floods (GLOFs) were selected. The glacier-related slope failures distribution data (1902–2022) is sourced from the global glacier-related disaster database compiled by Zhang et al. [57]. The database was established based on historical satellite images and includes information on various glacier-related hazards such as ice avalanches, ice-rock avalanches, and rockfalls. This study selects only ice avalanches and ice-rock avalanches for analysis. The glacier surge data is selected from the high Asia glacier surge dataset published by Lv et al. [33] (1972–2019). There are another two glacier surge datasets covering the HMA [32,58], all above datasets are based on elevation changes and remote sensing images. Through the comparison of three datasets, we found that Guo et al. [32] study identified the most numerous active glaciers (275 glaciers), but lacked specific active events. In contrast, the research by Yao et al. [58] is consistent with that of Lv et al. [33]. Records of GLOFs mainly rely on the compilation of GLOFs events in the Tibet Autonomous Region by Yao et al. [59] and the review of high Asia GLOFs events by Zhang et al. [60]. Additionally, 176 previously unrecorded historical GLOFs events identified by Zheng et al. [61]. have been included based on historical satellite images, resulting in a comprehensive list of GLOFs events that have occurred in the TP.
2.3. Potential Influencing Factors Detection of Glacial Hazards Frequency and Long Time Series Glacial Lake Dataset Construction of Reported GLOFs
Based on the mechanism and process of glacier hazard formation, this study primarily analyzes the main factors influencing the frequency of glacier hazard occurrences in the region, including the number and variation characteristics of glaciers, glacial lakes, terrain conditions, and climate characteristics. The terrain data is obtained from SRTM (Shuttle Radar Topography Mission) V4.1, with a spatial resolution of 30 m, which can be accessed from the USGS Earth Explorer website: https://earthexplorer.usgs.gov/ (accessed on 3 June 2024). The climate data used in this study is derived from the 1 km resolution monthly temperature and precipitation dataset for China from 1901 to 2020 [62]. This dataset was generated by downscaling the global 0.5° climate dataset published by CRU (Climate Research Unit) [https://crudata.uea.ac.uk/cru/data/hrg/] (accessed on 3 May 2023) and the high-resolution climate dataset published by WorldClim [http://www.worldclim.org/] (accessed on 24 August 2023) using the Delta spatial downscaling method specifically for the China region. To further calculate the interannual trend of average temperature for different months (June to September) using simple linear regression, the following formula can be used:
where: Trend represents the slope of the simple linear regression equation fitting the average temperature for different months against the time variable. The variable i represents the time location variable, ranging from 1 to n, where n is the number of years in the study period, which is 21. Ti represents the average temperature for the i-th year. A Trend value < 0 indicates a decreasing trend in the monthly average temperature series over time, while a Trend value > 0 indicates an increasing trend. The absolute value of the Trend indicates the rate of change in the monthly average temperature, with a larger absolute value indicating a faster rate of change.
The TP covers a vast area, but disaster events often occur within small localized regions such as points, lines, or locations. Therefore, in this study, a grid of 100 × 100 km cells was created based on the boundary of the TP. The occurrence frequency of different types of glacial hazards within each grid cell and the total frequency of all glacial hazards occurring within different grid cells were calculated and analyzed. Geodetector was applied to detect the contribution of the main influencing factors. Geodetector is a new statistical method to detect stratified spatial heterogeneity and reveal the driving factors behind it [63]. Based on the assumption that the high-influence independent variable should share a similar spatial distribution pattern with the dependent variable [63], Geodetector can measure each independent variable’s contribution by the q-statistic of the factor detector. The formula is as follows:
where h(1…m) denotes the number of factors; Nh denotes the number of samples in subregion k; N represents the total number of spatial units across the whole study area; σ2 and σh2 represent the global variance in the study area and variance in the samples in subregion k, respectively. A greater q-statistic value (range from 0 to 1) indicates higher explanatory power of the selected independent variable. Furthermore, Geodetector also provides another module to detect whether the explanatory powers of two independent variables are enhanced, weakened, or independent of each other [63].
Considering the possibility of repeated outbursts, the recent statuses of glacial lakes posterior to their outbursts need to be continuously monitored for downstream risk management [64]. A glacier lake dataset produced by Wang et al. [47] was selected for the further step analysis. However, this dataset only includes glacial lake distribution in 1990 and 2020, which is not adequate for our needs. Here, we have used a modified normalized difference water index (NDWI) approach proposed by Shugar et al. [44], combined with a variety of thresholds and filters, to identify and accurately map glacial lakes which have outbursted. First, we finished the initial mapping of water pixels from optical imagery in the Google Earth Engine (Figure 4). Then, we manually delineated the boundary of glacial lakes in 2000 and 2010. Studies demonstrate that spatial-resolution-induced mixed pixels constitute a primary error source in lake boundary delineation, with the application of a one-pixel buffer zone along defined edges providing improved accuracy [65]. Therefore, the uncertainty of the individual lake area can be calculated as follows:
where P denotes glacial lake perimeter (meters), G represents the spatial resolution (30 m) of the remote sensing data. The 0.6872 coefficient (adjusted under 1σ conditions) quantifies error probabilities, indicating ~69% of boundary pixels may contain inaccuracies. R corresponds to relative measurement error; A signifies total glacial lake surface area. The resulting calculated error indicated that the total absolute area error in glacial lakes was approximately ±1.03 and ±1.07 km2 and the average relative error was ±15.16% and ±16.95% in 2000 and 2010, respectively.
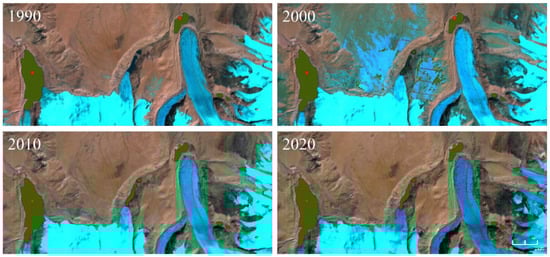
Figure 4.
Glacial lake extraction results from 1990 to 2020 based on Google Earth Engine. The base map uses Landsat images and is displayed in false color synthesis. The red points in the figure represent the glacial lakes to be identified, and the green vectors represent the identified glacial lake surfaces.
3. Results
3.1. Glaciers and Glacial Lakes Changes on the Tibetan Plateau
According to the second glacier inventory results, there are 40,230 glaciers in the Tibetan Plateau (TP). Compared to the first glacier inventory, the number of glaciers has increased by 145, while the total glacier area has decreased from 57,100 km2 to 44,400 km2 in the second inventory (Figure 5a). The average elevation of glacier distribution in the TP was 5340 m in the first inventory, while in the second inventory, it increased significantly to 5500 m. The lowest average elevation of glaciers also increased from 2162 m to 3346 m. Regarding different elevation ranges, the first inventory shows that glaciers in the TP are mainly distributed between 5000 and 6000 m, accounting for 74% of the total glaciers (Figure 5b). This proportion increased to 77% in the second inventory. Additionally, the number of glaciers within this elevation range has significantly changed. Compared to the first inventory, the second inventory recorded an increase of 1373 glaciers in the 5000–6000 m elevation range. Meanwhile, the total area and average area of glaciers in the 5000–6000 m elevation range decreased by 8208.81 km2 and 0.32 km2, respectively. The number of glaciers below 5000 m showed a decreasing trend, with a decrease of 2098 glaciers compared to the first inventory; the total glacier area decreased by 3390.60 km2. Particularly in the 4000–4500 m range, there was a significant decrease, with 1055 glaciers disappearing. In terms of spatial distribution, the regions where glacier numbers decreased were mainly in the middle and eastern sections of the Himalayas, as well as the West Kunlun Mountains and Qilian Mountains. On the other hand, the regions where glacier numbers increased were primarily located in the northern part of the Karakoram Mountains and the middle section of the Kunlun Mountains.
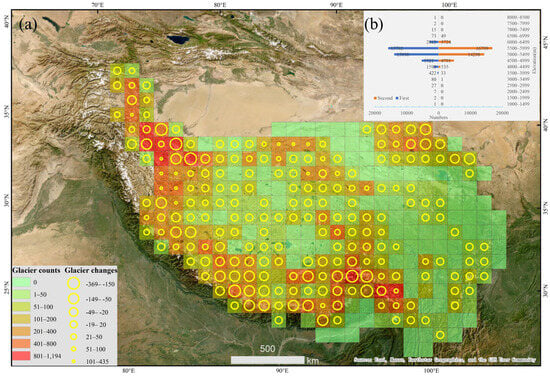
Figure 5.
Spatial distribution of the glacier changes over the Tibetan Plateau. (a) The distribution of glaciers in the second glacier inventory were counted in the 100 × 100 km grids. The yellow circle size depicted the glacier changes between the first and the second glacier inventory. (b) The histogram demonstrated the elevation range changes between the first and the second glacier inventory.
By comparing the changes in glacial lakes on the TP from 1990 to 2020 (Figure 6), it was found that the number of glacial lakes increased from 14,487 (9446 glacier-fed lakes, 5041 non-glacier fed lakes) to 16,385 (11,204 glacier-fed lakes, 5181 non-glacier fed lakes) in the past three decades, mainly concentrated in the eastern Himalayan region. The TP is primarily dominated by glacial lakes with an area of less than 1 km2, accounting for over 99% of the total. In 1990, the average area of glacial lakes on the TP was 0.07 km2 and increased by 5% in 2020. From a vertical perspective, the average elevation of glacial lakes on the TP increased from 4988 m to 5009 m. Glacial lakes on the TP are mainly distributed at altitudes between 5000 and 5500 m, accounting for over 43% of the total glacial lakes. Meanwhile, the most significant increase in glacial lake numbers is also observed within this elevation range, with a total increase of 976 lakes compared to 1990. The average slopes of glacial lakes in 1990 and 2020 are 9.7° and 9.47°, respectively; over 59% of glacial lakes are distributed in a slope range from 5~10°. In terms of spatial distribution, from 1990 to 2020, there was an increasing trend in the number of glacial lakes in 158 grid cells, mainly in the middle and eastern sections of the Himalayas, with an average increase of 12.4 lakes. The largest increase was 103 lakes. The number of glacial lakes in 30 grid cells remained unchanged, while there was a decreasing trend in glacial lake numbers in 22 grid cells, with the largest decrease being 9 lakes.
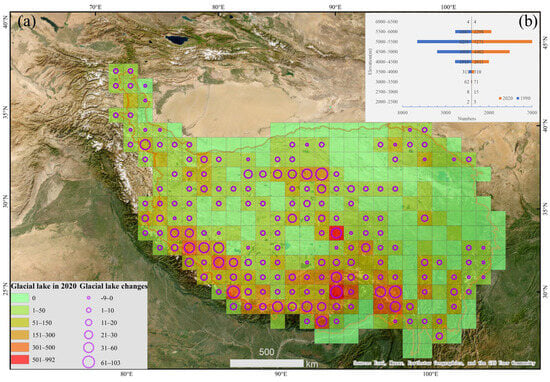
Figure 6.
Spatial distribution of the glacial lake changes from 1990 to 2020 over the Tibetan Plateau. (a) The distribution of glacial lakes in 2020 were counted in the 100 × 100 km grids. The purple circle size depicted the glacial lake changes between 1990 and 2020. (b) The histogram demonstrated the elevation range changes between 1990 and 2020.
3.2. Temporal-Spatial Distribution and Influencing Factors of the Main Glacier Hazard Events Since 1990
A total of 283 glacial hazards occurred in the TP according to the published research, including 97 glacier surges, 36 glacier-related slope failures (GRSF), and 150 GLOFs (48 reported CLOFs) since 1900 (Figure 7). Glacier surges principally occurred in Pamir, Inner Tibet, West Kun Lun, and Karakoram, accounting for 23%, 22%, 21%, and 19% of the total glacier surge events; the remainder were distributed in East Kun Lun, South and East Tibet, and Qilian Shan. The average area of surging glaciers is 41.84 km2, with the largest surging glacier being 355.58 km2 and the smallest being only 2.15 km2. The average elevation of surging glaciers ranges from 4634 m (lower boundary) to 6424 m (upper boundary), with an average slope of about 18 degrees. The highest surging glacier is located at an elevation of 6466 m in West Kun Lun, while the lowest is at an elevation of 4374 m in Pamir. Since 1970, the confirmed glacier surges have mainly occurred after the year 2000, accounting for 71% of all confirmed glacier surge events.
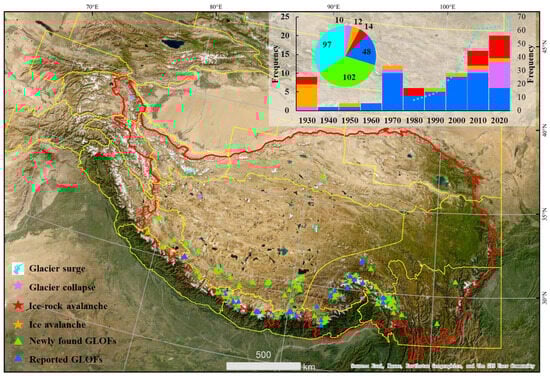
Figure 7.
Distribution of historical glacial hazards events in the Tibetan Plateau.
There has been a total of 36 GRSF events on the TP since 1905 (Figure 7), including 10 glacier collapses, 12 ice avalanches, and 14 ice-rock avalanches. Over 58% of GRSF events are distributed in South and East Tibet, and the other 25% of GRSF events occurred in East Himalaya. The average elevation and slope of GRSF events were 4719 m and 28 degrees, with the lowest elevation being 3577 m and the highest elevation being 5711 m. The earliest recorded event occurred on 16 March 1905, while the most recent event took place on 11 September 2019. GRSF events that occurred after 2000 accounted for 58% of all recorded events. Among the events with specific months recorded, 8 events happened in July, accounting for 22% of the total recorded events; the remaining events were almost evenly distributed from March to November.
There have been records of 48 glacial lakes experiencing outburst floods since 1935 (Figure 7), mainly distributed in East Himalaya and South and East Tibet, accounting for 50% and 23% of the total GLOF events, respectively. All reported GLOFs are moraine-dammed lakes, with a total of 59 outburst events, of which eight glacial lakes have experienced more than two GLOF events. Seventeen GLOFs occurred after 2000, accounting for 28.81% of all recorded events. GLOF events are mainly concentrated from June to September, with 31 events occurring during this period, accounting for 52.54% of all recorded events. The average elevation of reported GLOF events is 5143 m. The highest elevation is 6082 m, and the lowest is 3807 m. Of glacial lake outburst events, 54.17% occurred at elevations above 5000 m. Furthermore, a total of 102 newly discovered GLOF events were identified, with 98 of them being moraine-dammed lakes and only 4 being bedrock-dammed lakes, which are mainly concentrated in the East Himalayas and the Inner Tibetan, accounting for 33% and 26% of all recorded events, respectively. Furthermore, 77.45% of newly discovered glacial lake outburst events occurred at elevations above 5000 m.
To further investigate the main influencing factors affecting the frequency of glacier hazard events, a geographic detector model was employed to analyze the individual contributions and interaction effects of topography (elevation and slope), climate (average temperature change rate from June to September), and glacier background conditions (glacier quantity and variations) on the occurrence frequency of glacial hazards in different grid cells (Table 1). From the perspective of individual factor contributions, the variation in glacier quantity within the grid cell has the highest contribution to the frequency of glacier hazard events, accounting for 11.56% of the total contribution. The next significant factor is the average temperature change rate in July, contributing 10.24%, followed by elevation (8.32%), average temperature change rate in June (6.54%), slope (5.56%), and average temperature change rate in August (4.42%). Regarding the interaction effects of two factors, non-linear enhancement is observed between the major factors. The interaction between the slope and the average temperature change rate in June exhibits the highest contribution to the frequency of glacier hazard events, reaching 37.59%. The interaction between elevation and slope ranks second, contributing 37.45% to the frequency of glacier hazard events. The interaction between glacier quantity variations and the average temperature change rate in August follows closely behind the previous two factors, contributing 33.59% to the frequency of glacier hazard events.

Table 1.
Interactive detection of factors affecting the frequency of glacier disasters.
3.3. Different Status of Glacial Lakes After the Main Glacial Hazards
According to the historical records, eight glacial lakes have experienced more than two GLOF events. Thus, we divided all 48 recorded outburst lakes into three classes: disappeared, stable, and expanding lakes (increased by more than 100% compared to 1990). Satellite images show that four lakes perished after their GLOF events, while this number is five in Zhang et al. [60]. We revised a record of a glacial lake on Cuoalong Glacier (90.6121°N, 28.0652°E), which showed an obvious increasing trend since 1990, especially in the recent ten years; this glacial lake increased from 0.28 km2 in 2010 to 0.44 km2 in 2020. Four perished lakes are distributed in Central Himaya (Longda Co and Zana Co), Inner Tibet (Zangla Tsho), and South and East Tibet (unknown name). A total of 38 glacial lakes remain relatively stable after the outbursts. Among them, 17 lakes burst before 1990, seven lakes burst during 1990 to 2000, nine lakes burst during 2000 to 2010, five lakes burst during 2010 to 2020, and then experienced little changes. Sangwang Tsho burst on 16 July 1954 and resulted in catastrophic downstream damages. Its area slightly expanded from 2000 to 2020. Sangwang Tsho is currently the largest post-outburst glacial lake in the Himalayas (with an area of 5.83 km2 in 2015). Post-outburst lake dynamics were only inferred from the available monitoring period from ca. 1990 to 2015. For some of the lakes where outbursts occurred much earlier than 1990 (such as in the 1960s and 1950s), drastic area changes or fluctuations (expansions or shrinkage) might have occurred but are not observable from our acquired remote sensing images. As shown in their area dynamics during ~1990–2020 (Figure 8), six glacial lakes were identified to have experienced evident expansion since the outburst, of which the most significant increase was observed in a glacial lake on Cuoalong Glacier, which increased by 633% from 1990 to 2020 (Figure 8a). During the past thirty years, this lake has experienced two obvious expansions; it increased by 367% from 1990 to 2000, then kept stable from 2000 to 2010, and further increased by 57% in the recent ten years. Jialong Co (Figure 8b) is about 15.8 km away from Nyalam County and flooded twice in 2002. After the GLOFs, Jialong Co expanded by 150% between 2000 and 2010 and kept stable in recent ten years (Figure 8b). Zhangzangbo/Cirenma Co in the Central Himalaya produced three GLOFs in 1964, 1981, and 1983, respectively; the GLOF on 11 July 1981 had the most serious disastrous effect. The main expansion of Zhangzangbo/Cirenma Co occurred in the first two ten-year periods and increased by 40% and 62%, respectively. Another three glacial lakes, Unknown (Figure 8c), Gelhaipuco (Figure 8d), and Lureco (Figure 8e), had significantly expanded (at least during ca. 1990 and 2010).
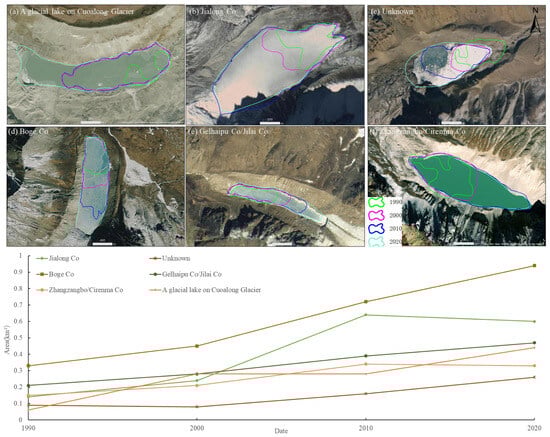
Figure 8.
Analyses for six rapidly expanding glacial lakes after GLOFs. (a–f) denotes a glacial lake (90.61°E, 28.07°N) on Cuolong Glacier, Jialong Co (85.85°E, 28.21°N), unknown glacial lake (85.48°E, 28.66°N), Boge Co (94.76°E, 31.86°N), Gelhaipu Co/Jilai Co (87.81°E, 27.96°N), and Zhangzangbo/Cirenma Co (86.07°E, 28.07°N), respectively.
4. Discussion
4.1. Cryospheric Hazard Cascades: Glacier Initiation and Glacial Lake Culmination
This research demonstrates the spatiotemporal distribution characteristics of historical disaster events and analyzes the major environmental factors influencing the frequency of glacier hazard occurrences. It helps us understand the patterns of glacial hazards and establish effective monitoring and early warning mechanisms to minimize the risks associated with glacial hazards. Glacial retreat as a global phenomenon has significantly intensified the occurrence of natural disasters [66]. In theory, glacial hazards are more likely to occur in areas with rapid glacier melting or active glacier movement. According to a comparison of two glacier inventories, the glacier area on the TP has decreased from 57,100 km2 to 44,400 km2, primarily in the middle and eastern Himalayas below 5000 m. The number of glaciers below 5000 m showed a decreasing trend, with a decrease of 2098 glaciers compared to the first inventory; the total glacier area decreased by 3390.60 km2. The areas of rapid glacier melting are mainly located in the middle and eastern sections of the Himalayas, the western Kunlun Mountains, and the Qilian Mountains, while the number of glaciers in the northern Karakoram Mountains and the middle section of the Kunlun Mountains has shown an increasing trend (“Karakoram Anomaly”). The TP has experienced substantial warming during the past 50 years at a rate twice that of the global average [67]. Furthermore, the TP exhibits spatially heterogeneous warming responses to global climate change, where the magnitude of temperature increase amplifies with rising elevation, a phenomenon known as elevation-dependent warming, especially below 5000 m [68]. Meanwhile, the continuing shrinkage of snow cover in High Mountain Asia (HMA) was observed over the last four decades, which is also influenced by elevation-dependent warming [69]. The combined effects of rising temperatures and reduced snowfall act synergistically to glacier retreat below 5000 m [70]. Glacier retreat above 5000 m elevation on the TP is modulated by unique climatic forcings, particularly through aerosol deposition fluxes on snowpack and ice surfaces that amplify surface darkening via albedo reduction [71], thereby intensifying melt-driven retreat dynamics in these ultra-high altitude systems. Glacial lakes have significantly increased as a consequence of rapid glacier melting, further exacerbating the risk of glacial hazards. Understanding glacial lakes is the first step in estimating the GLOF hazard and risk. Though great efforts have been made on glacial lake mapping across different scales, obvious discrepancies existed in the published glacial datasets because of data availability, minimum area threshold, and mapping methods, etc. By comparison, an HMA glacial dataset published by Wang et al. [47] was selected. This dataset reveals that from 1990 to 2020, the number, average area, and elevation distribution of glacial lakes on the TP all exhibited significant increasing trends. While it outperforms other datasets in reflecting the spatiotemporal patterns of glacial lakes across the plateau, it lacks detailed lake classification—only distinguishing between glacier-contact and non-glacier-contact types based on their positional relationship with glaciers. Furthermore, the dataset does not quantify water storage volume, a critical parameter for assessing potential impacts of glacial lake outburst floods (GLOFs) [72].
How has the frequency of the glacial hazards in the TP changed under the accelerated warming rate? From the perspective of glacier hazard occurrence in different periods, the upward trend in reported incidents showed a marked decline after a shift in the 1970s (Figure 7). Glacial hazard frequency analysis across the Tibetan Plateau reveals divergent temporal patterns: GLOFs exhibited a marked transition circa 1970, shifting from a rapid pre-1970 increase to post-1970 moderate growth with discernible decline post-2010. Glacier-related slope failures events demonstrate no statistically significant trend due to limited event inventory, while glacier surge frequency shows a pronounced escalation in the post-2000 era. This pattern has been observed both globally and regionally [73,74]. Although this phenomenon aligns with independently observed shifts in annual air temperatures and the number of field-based glacier surveys, earlier studies suggest that the formation, growth, and failure of glacial lakes driven by temperature changes are only weakly correlated [73]. From 1901 to 2017, only a few regions saw an increase in reported GLOFs, a trend likely attributed more to the rise in research activity than to atmospheric warming. For instance, a satellite-based approach recorded 60% more events in a 35-year period than had been documented over the previous 100 years in Alaska [74]. This suggests that the rise in image availability is the main factor behind the growing number of detected events over time. Indeed, this is the case: existing studies have found nearly 200 previously unreported GLOF events in the Third Pole region, of which approximately 95% were moraine-dammed glacial lakes [51]. Unfortunately, the exact dates of these newly discovered GLOF events cannot be confirmed, which limits our ability to accurately understand the changes in the frequency of these events. Nevertheless, it is possible to glean evidence of GLOF characteristics. By constructing multi-temporal glacial lake distribution data and conducting research on the temporal changes of glacial lakes, it is of great significance to timely capture signals of GLOFs, so far limited by both availability of optical satellite images and mapping efficiency [75]. Gu et al. [65] demonstrated the potential of using dense Chinese high-resolution satellite images to monitor GLOFs and release early warning.
4.2. Determinants of Glacier Hazard Spatiotemporal Distribution Patterns and Frequency Dynamics
Our analytical framework is predicated on a cascading causation hypothesis: (1) Climate variability serves as the primary driver, (2) inducing cryospheric adjustments (glacier dynamics and glacial lake evolution), (3) which subsequently manifest as hazard cascades through topographic modulation. Historical glacial hazard events show a strong correlation with areas of rapid glacier melting and the rapid increase in glacial lakes in terms of occurrence frequency and spatial distribution [76]. Through the analysis of the contributions and interaction effects of environmental factors that may affect the frequency of glacier hazard occurrences, this study found that the variation in glacier quantity within the grid cell is the factor with the highest contribution to the frequency of glacier hazard events, accounting for 11.56% of the total contribution. This is consistent with previous studies [43] and theoretical expectations. Rapid glacier changes as the consequence of climate warming have reduced their stability, thus increasing the risk of glacial disasters [23]. In addition, we found that GLOFs and glacier-related slope failures (GRSF) display synchronized seasonal clustering, peaking between June and September. Over 70% of these events occur from July to August, with July exhibiting the highest event density. This synchronicity is driven by mid-summer thermal forcing, which intensifies meltwater production and destabilizes ice-dam integrity, concurrently heightening slope instability through accelerated ablation. Our empirical findings provide corroborative validation of this assertion: the contribution rate of the average temperature change rate in July to the frequency of glacier hazard occurrences is second only to the variation in glacier quantity, reaching 10.24% (Table 1). In terms of the interaction effects between factors, the interaction between slope and the average temperature change rate in June is the pair of environmental factors with the highest contribution to the frequency of glacier hazard events, accounting for 37.59%. Previous studies indicated that cascading processes are more likely to occur from smaller (glacier area < 3 km2), steeper-sloped (glacier slope > 30°) hanging glaciers, as evidenced by the 2015 Langtang (Nepal) and 2021 Chamoli (India) rock-ice avalanche disasters [77]. This finding underscores that while glacial dynamics exhibit the highest explanatory power for glacial hazard initiation, their spatiotemporal distribution patterns primarily emerge from the synergistic interplay between climatic forcing and topographic controls—the dominant coupled determinant in multifactorial environmental systems.
4.3. Establishing Early Warning Systems for Glacial Hazards: An Imperative Under Escalating Climate Change and Anthropogenic Activities
The key to glacier hazard risk is not directly related to the size, quantity, or variations of glacial lakes; rather, it lies in the downstream population and their capacity to cope with disasters. For example, in 2013, the Chorabari glacial lake outburst in the Indian part of the western Himalayas caused over 6000 deaths [78], making it one of the largest glacial lake outburst flood disasters in human history, despite the lake’s maximum pre-outburst area being only 0.04 km2. With the continuous development of socio-economic activities, human activities on the TP have rapidly intensified. Research has shown that the average increase in human activity intensity on the TP is more than three times that of the global average during the same period (1990–2010) [79]. Grazing activities, infrastructure construction, road transportation, and major engineering projects are all expanding, bringing human activities closer to the impact zones of glaciers, and human activities near glacier areas are also increasing [80]. This greatly increases the potential losses caused by glacial hazards. Furthermore, the glacial hazards will continue or even intensify in the future under the rapid climate warming. Therefore, a quantitative assessment of human exposure to glacial hazards is of paramount importance in effectively mitigating glacier hazard risks. In addition, we need to pay special attention to glacial lakes that have frequently experienced outburst events in the past. We have observed that the vast majority of glacial lakes that have experienced outburst floods have not disappeared, and some lakes have even shown a trend of rapid expansion after the outburst, which also have been noted in the previous research [64]. This suggests that we need to be vigilant about the risk of these lakes experiencing outburst events again. Although the exact dates of historical glacial lake outburst events are lacking, based on the outburst dates of glacial lakes that have experienced multiple outbursts, the outburst dates of four glacial lakes all show a trend of occurring earlier. Early warning systems (EWS) present a cost-effective alternative to structural interventions for glacial lake risk mitigation, as evidenced by their widespread deployment across High Mountain Asia (HMA) [81]. A 1997 pilot at Nepal’s Rolwaling Valley implemented manual monitoring at Ropal Tsho, a moraine-dammed lake [82], which transitioned to automated operation within a year through integrated sensing and community alert modules [83]. An integrated monitoring framework—encompassing glacial lake dynamics, parent glacier behavior, downstream hydrological shifts, mitigation protocols, early warning dissemination, and evacuation preparedness—remains critical for elucidating GLOFs mechanisms. While satellite constellations excel in spatial-temporal coverage, ground-based monitoring infrastructure retains irreplaceable value in operational EWS.
5. Conclusions
This study compiles the first systematic inventory of major glacial hazards across the Tibetan Plateau, clarifying their spatiotemporal distribution patterns, key driving mechanisms, and providing a foundational framework for standardized hazard assessment. Geospatial analysis reveals pronounced spatial congruence between glacial hazard initiation zones (glacier retreat hotspots) and propagation nodes (expanding glacial lakes) across the Tibetan Plateau, particularly within the 5000–6000 m elevation belt. Systematic compilation of documented events further demonstrates concentration of hazard clusters in the Himalayan sector, with a post-2000 escalation in event frequency. Statistical modeling identifies summer temperature anomalies and steep topographic gradients as the dominant controls on spatiotemporal hazard distribution through univariate detection and interactive factor analysis (q-statistic = 0.38). Additionally, some glacial lakes that have experienced outburst events are expanding, underscoring the need for enhanced monitoring and early warning systems to inform disaster management.
Supplementary Materials
The following supporting information can be downloaded at: https://www.mdpi.com/article/10.3390/rs17111862/s1, Table S1: Summary of published glacial lakes datasets across different scales, including Global, High Mountain Asia (HMA), Third Pole, and Tibetan Plateau.
Author Contributions
Conceptualization, C.G.; methodology, C.G. and B.W.; software, C.G. and S.J.; validation, M.L., X.G. and P.W.; formal analysis, C.G.; investigation, C.G.; resources, S.L.; data curation, C.G.; writing—original draft preparation, C.G.; writing—review and editing, S.L and S.J.; visualization, C.G. and B.W.; supervision, M.L.; project administration, S.L.; funding acquisition, S.L. All authors have read and agreed to the published version of the manuscript.
Funding
This research was funded by the National Key Research and Development Program of China, grant number 2021YFB3901205.
Data Availability Statement
Data used in this study will be available upon request from the first author.
Acknowledgments
We would like to sincerely thank Gong Dianqing from Institute of Geographic Sciences and Natural Resources Research, CAS for his timely help.
Conflicts of Interest
The authors declare no conflicts of interest.
References
- Nie, Y.; Pritchard, H.D.; Liu, Q.; Hennig, T.; Wang, W.; Wang, X.; Liu, S.; Nepal, S.; Samyn, D.; Hewitt, K.; et al. Glacial change and hydrological implications in the Himalaya and Karakoram. Nat. Rev. Earth Environ. 2021, 2, 91–106. [Google Scholar] [CrossRef]
- The GlaMBIE Team. Community estimate of global glacier mass changes from 2000 to 2023. Nature 2025, 639, 382–388. [Google Scholar] [CrossRef] [PubMed]
- Osman, M.B.; Tierney, J.E.; Zhu, J.; Tardif, R.; Hakim, G.J.; King, J.; Poulsen, C.J. Globally resolved surface temperatures since the Last Glacial Maximum. Nature 2021, 599, 239–244. [Google Scholar] [CrossRef]
- Hugonnet, R.; McNabb, R.; Berthier, E.; Menounos, B.; Nuth, C.; Girod, L.; Farinotti, D.; Huss, M.; Dussaillant, I.; Brun, F.; et al. Accelerated global glacier mass loss in the early twenty-first century. Nature 2021, 592, 726–731. [Google Scholar] [CrossRef]
- Hansen, J.E.; Kharecha, P.; Sato, M.; Tselioudis, G.; Kelly, J.; Bauer, S.E.; Ruedy, R.; Jeong, E.; Jin, Q.; Rignot, E.; et al. Global Warming Has Accelerated: Are the United Nations and the Public Well-Informed? Environ. Sci. Policy Sustain. Dev. 2025, 67, 6–44. [Google Scholar] [CrossRef]
- Yao, T.; Thompson, L.; Yang, W.; Yu, W.; Gao, Y.; Guo, X.; Yang, X.; Duan, K.; Zhao, H.; Xu, B.; et al. Different glacier status with atmospheric circulations in Tibetan Plateau and surroundings. Nat. Clim. Change 2012, 2, 663–667. [Google Scholar] [CrossRef]
- Pu, J.; Yao, T.; Wang, N.; Su, Z.; Shen, Y. Fluctuations of the glaciers on the Qinghai-Tibetan Plateau during the past century. J. Glaciol. Geocryol. 2004, 26, 517–522. [Google Scholar]
- Cheng, T.F.; Chen, D.; Wang, B.; Ou, T.; Lu, M. Human-induced warming accelerates local evapotranspiration and precipitation recycling over the Tibetan Plateau. Commun. Earth Environ. 2024, 5, 388. [Google Scholar] [CrossRef]
- Yao, T.; Bolch, T.; Chen, D.; Gao, J.; Immerzeel, W.; Piao, S.; Su, F.; Thompson, L.; Wada, Y.; Wang, L.; et al. The imbalance of the Asian water tower. Nat. Rev. Earth Environ. 2022, 3, 618–632. [Google Scholar] [CrossRef]
- Sattar, A.; Cook, K.L.; Rai, S.K.; Berthier, E.; Allen, S.; Rinzin, S.; Van Wyk De Vries, M.; Haeberli, W.; Kushwaha, P.; Shugar, D.H.; et al. The Sikkim flood of October 2023: Drivers, causes and impacts of a multihazard cascade. Science 2025, 387, eads2659. [Google Scholar] [CrossRef]
- Wu, L.; Li, J.; Miao, Z.; Wang, W.; Chen, B.; Li, Z.; Dai, W.; Xu, W. Pattern and directions of space-borne-airborne-ground collaborated intelligent monitoring on the geo-hazards developing environment and disasters in glacial basin. Acta Geod. Cartogr. Sin. 2021, 50, 1109. [Google Scholar]
- Zhang, G.; Bolch, T.; Yao, T.; Rounce, D.R.; Chen, W.; Veh, G.; King, O.; Allen, S.K.; Wang, M.; Wang, W. Underestimated mass loss from lake-terminating glaciers in the greater Himalaya. Nat. Geosci. 2023, 16, 333–338. [Google Scholar] [CrossRef]
- Veh, G.; Wang, B.G.; Zirzow, A.; Schmidt, C.; Lützow, N.; Steppat, F.; Zhang, G.; Vogel, K.; Geertsema, M.; Clague, J.J.; et al. Progressively smaller glacier lake outburst floods despite worldwide growth in lake area. Nat. Water 2025, 3, 271–283. [Google Scholar] [CrossRef]
- Kääb, A.; Leinss, S.; Gilbert, A.; Bühler, Y.; Gascoin, S.; Evans, S.G.; Bartelt, P.; Berthier, E.; Brun, F.; Chao, W.-A.; et al. Massive collapse of two glaciers in western Tibet in 2016 after surge-like instability. Nat. Geosci. 2018, 11, 114–120. [Google Scholar] [CrossRef]
- Taylor, C.; Robinson, T.R.; Dunning, S.; Carr, J.R.; Westoby, M. Glacial lake outburst floods threaten millions globally. Nat. Commun. 2023, 14, 487. [Google Scholar] [CrossRef]
- Meng, Z.; Lyu, L.; Xu, M.; Yu, G.; Ma, C.; Wang, Z.; Stoffel, M. Effects of frequent debris flows on barrier lake formation, sedimentation and vegetation disturbance, Palongzangbo River, Tibetan Plateau. CATENA 2023, 220, 106697. [Google Scholar] [CrossRef]
- Du, R.; Zhang, S. Characteristics of glacial mud-flows in south-eastern Qingha-Xizang plateau. J. Glaciol. Geocryol. 1981, 3, 10–16. [Google Scholar]
- Wang, S.; Che, Y.; Ma, X. Integrated risk assessment of glacier lake outburst flood (GLOF) disaster over the Qinghai–Tibetan Plateau (QTP). Landslides 2020, 17, 2849–2863. [Google Scholar] [CrossRef]
- Allen, S.K.; Zhang, G.; Wang, W.; Yao, T.; Bolch, T. Potentially dangerous glacial lakes across the Tibetan Plateau revealed using a large-scale automated assessment approach. Sci. Bull. 2019, 64, 435–445. [Google Scholar] [CrossRef]
- Gao, Y.; Liu, S.; Qi, M.; Zhu, Y.; Xie, F.; Wu, K.; Jiang, Z. Characterizing the behaviour of surge-type glaciers in the Geladandong Mountain Region, Inner Tibetan Plateau, from 1986 to 2020. Geomorphology 2021, 389, 107806. [Google Scholar] [CrossRef]
- Cui, P.; Jia, Y. Mountain hazards in the Tibetan Plateau: Research status and prospects. Natl. Sci. Rev. 2015, 2, 397–399. [Google Scholar] [CrossRef]
- Zhao, C.; Yang, W.; Westoby, M.; An, B.; Wu, G.; Wang, W.; Wang, Z.; Wang, Y.; Dunning, S. Brief communication: An approximately 50 Mm3 ice-rock avalanche on 22 March 2021 in the Sedongpu valley, southeastern Tibetan Plateau. Cryosphere 2022, 16, 1333–1340. [Google Scholar] [CrossRef]
- Wu, G.; Yao, T.; Wang, W.; Zhao, H.; Yang, W.; Zhang, G.; Li, S.; Yu, W.; Lei, Y.; Hu, W. Glacial hazards on Tibetan Plateau and surrounding alpines. Bull. Chin. Acad. Sci. (Chin. Version) 2019, 34, 1285–1292. [Google Scholar]
- Tang, M.; Xu, Q.; Wang, L.; Zhao, H.; Wu, G.; Zhou, J.; Li, G.; Cai, W.; Chen, X. Hidden dangers of ice avalanches and glacier lake outburst floods on the Tibetan Plateau: Identification, inventory, and distribution. Landslides 2023, 20, 2563–2581. [Google Scholar] [CrossRef]
- Shugar, D.H.; Jacquemart, M.; Shean, D.; Bhushan, S.; Upadhyay, K.; Sattar, A.; Schwanghart, W.; McBride, S.; de Vries, M.V.W.; Mergili, M.; et al. A massive rock and ice avalanche caused the 2021 disaster at Chamoli, Indian Himalaya. Science 2021, 373, 300–306. [Google Scholar] [CrossRef]
- Zhang, T.; Wang, W.; An, B. A massive lateral moraine collapse triggered the 2023 South Lhonak Lake outburst flood, Sikkim Himalayas. Landslides 2025, 22, 299–311. [Google Scholar] [CrossRef]
- Zhang, T.; Wang, W.; Shen, Z.; Zhan, N.; Wang, Z.; An, B. Understanding the 2004 glacier detachment in the Amney Machen Mountains, northeastern Tibetan Plateau, via multi-phase modeling. Landslides 2023, 20, 315–330. [Google Scholar] [CrossRef]
- Rinzin, S.; Zhang, G.; Sattar, A.; Wangchuk, S.; Allen, S.K.; Dunning, S.; Peng, M. GLOF hazard, exposure, vulnerability, and risk assessment of potentially dangerous glacial lakes in the Bhutan Himalaya. J. Hydrol. 2023, 619, 129311. [Google Scholar] [CrossRef]
- Bazai, N.A.; Cui, P.; Carling, P.A.; Wang, H.; Hassan, J.; Liu, D.; Zhang, G.; Jin, W. Increasing glacial lake outburst flood hazard in response to surge glaciers in the Karakoram. Earth-Sci. Rev. 2021, 212, 103432. [Google Scholar] [CrossRef]
- Lützow, N.; Veh, G.; Korup, O. A global database of historic glacier lake outburst floods. Earth Syst. Sci. Data 2023, 15, 2983–3000. [Google Scholar] [CrossRef]
- Shrestha, F.; Steiner, J.F.; Shrestha, R.; Dhungel, Y.; Joshi, S.P.; Inglis, S.; Ashraf, A.; Wali, S.; Walizada, K.M.; Zhang, T. A comprehensive and version-controlled database of glacial lake outburst floods in High Mountain Asia. Earth Syst. Sci. Data 2023, 15, 3941–3961. [Google Scholar] [CrossRef]
- Guo, L.; Li, J.; Dehecq, A.; Li, Z.; Li, X.; Zhu, J. A new inventory of High Mountain Asia surging glaciers derived from multiple elevation datasets since the 1970s. Earth Syst. Sci. Data 2023, 15, 2841–2861. [Google Scholar] [CrossRef]
- Lv, M.; Guo, H.; Yan, S.; Li, G.; Jiang, D.; Zhang, H.; Zhang, Z. A dataset of surge-type glaciers in the High Mountain Asia based on elevation change and satellite imagery. China Sci. Data 2022, 7. [Google Scholar] [CrossRef]
- Emmer, A.; Wood, J.L.; Cook, S.J.; Harrison, S.; Wilson, R.; Diaz-Moreno, A.; Reynolds, J.M.; Torres, J.C.; Yarleque, C.; Mergili, M.; et al. 160 glacial lake outburst floods (GLOFs) across the Tropical Andes since the Little Ice Age. Glob. Planet. Change 2022, 208, 103722. [Google Scholar] [CrossRef]
- Zhang, Y.; Li, B.; Zheng, D. Datasets of the boundary and area of the Tibetan Plateau. Acta Geogr. Sinica 2014, 69, 65–68. [Google Scholar]
- Yao, T.D.; Yao, Z.J. Impacts of glacial retreat on runoff on Tibetan Plateau. Chin. J. Nat. 2010, 32, 4–8. [Google Scholar]
- Yao, T.; Pu, J.; Lu, A.; Wang, Y.; Yu, W. Recent glacial retreat and its impact on hydrological processes on the Tibetan Plateau, China, and surrounding regions. Arct. Antarct. Alp. Res. 2007, 39, 642–650. [Google Scholar] [CrossRef]
- Maslov, K.A.; Persello, C.; Schellenberger, T.; Stein, A. Globally scalable glacier mapping by deep learning matches expert delineation accuracy. Nat. Commun. 2025, 16, 43. [Google Scholar] [CrossRef]
- Shi, Y.; Liu, C.; Kang, E. The glacier inventory of China. Ann. Glaciol. 2009, 50, 1–4. [Google Scholar] [CrossRef]
- Guo, W.; Liu, S.; Xu, J.; Wu, L.; Shangguan, D.; Yao, X.; Wei, J.; Bao, W.; Yu, P.; Liu, Q.; et al. The second Chinese glacier inventory: Data, methods and results. J. Glaciol. 2015, 61, 357–372. [Google Scholar] [CrossRef]
- Su, B.; Xiao, C.; Chen, D.; Huang, Y.; Che, Y.; Zhao, H.; Zou, M.; Guo, R.; Wang, X.; Li, X.; et al. Glacier change in China over past decades: Spatiotemporal patterns and influencing factors. Earth-Sci. Rev. 2022, 226, 103926. [Google Scholar] [CrossRef]
- Zhang, T.; Wang, W.; An, B.; Wei, L. Enhanced glacial lake activity threatens numerous communities and infrastructure in the Third Pole. Nat. Commun. 2023, 14, 8250. [Google Scholar] [CrossRef] [PubMed]
- Zhang, T.; Wang, W.; An, B. Heterogeneous changes in global glacial lakes under coupled climate warming and glacier thinning. Commun. Earth Environ. 2024, 5, 374. [Google Scholar] [CrossRef]
- Shugar, D.H.; Burr, A.; Haritashya, U.K.; Kargel, J.S.; Watson, C.S.; Kennedy, M.C.; Bevington, A.R.; Betts, R.A.; Harrison, S.; Strattman, K. Rapid worldwide growth of glacial lakes since 1990. Nat. Clim. Change 2020, 10, 939–945. [Google Scholar] [CrossRef]
- Song, C.; Fan, C.; Ma, J.; Zhan, P.; Deng, X. A spatially constrained remote sensing-based inventory of glacial lakes worldwide. Sci. Data 2025, 12, 464. [Google Scholar] [CrossRef]
- Wang, X.; Guo, X.; Yang, C.; Liu, Q.; Wei, J.; Zhang, Y.; Liu, S.; Zhang, Y.; Jiang, Z.; Tang, Z. Glacial lake inventory of high-mountain Asia in 1990 and 2018 derived from Landsat images. Earth Syst. Sci. Data 2020, 12, 2169–2182. [Google Scholar] [CrossRef]
- Wang, X.; Ran, W.; Wei, J.; Yin, Y.; Liu, S.; Bolch, T.; Zhang, Y.; Xue, X.; Ding, Y.; Liu, Q.; et al. Spatially resolved glacial meltwater retainment in glacial lakes exerts increasing impacts in High Mountain Asia. J. Hydrol. 2024, 633, 130967. [Google Scholar] [CrossRef]
- Zhang, M.; Chen, F.; Guo, H.; Yi, L.; Zeng, J.; Li, B. Glacial Lake area changes in high mountain Asia during 1990–2020 using satellite remote sensing. Research 2022, 2022, 9821275. [Google Scholar] [CrossRef]
- Chen, F.; Zhang, M.; Guo, H.; Allen, S.; Kargel, J.S.; Haritashya, U.K.; Watson, C.S. Annual 30 m dataset for glacial lakes in High Mountain Asia from 2008 to 2017. Earth Syst. Sci. Data 2021, 13, 741–766. [Google Scholar] [CrossRef]
- Zhang, M.; Chen, F.; Zhao, H.; Wang, J.; Wang, N. Recent changes of glacial lakes in the high mountain Asia and its potential controlling factors analysis. Remote Sens. 2021, 13, 3757. [Google Scholar] [CrossRef]
- Zheng, G.; Allen, S.K.; Bao, A.; Ballesteros-Cánovas, J.A.; Huss, M.; Zhang, G.; Li, J.; Yuan, Y.; Jiang, L.; Yu, T.; et al. Increasing risk of glacial lake outburst floods from future Third Pole deglaciation. Nat. Clim Change 2021, 11, 411–417. [Google Scholar] [CrossRef]
- Zhang, G.; Yao, T.; Xie, H.; Wang, W.; Yang, W. An inventory of glacial lakes in the Third Pole region and their changes in response to global warming. Glob. Planet. Chang. 2015, 131, 148–157. [Google Scholar] [CrossRef]
- Tang, Q.; Zhang, G.; Yao, T.; Wieland, M.; Liu, L.; Kaushik, S. Automatic extraction of glacial lakes from Landsat imagery using deep learning across the Third Pole region. Remote Sens. Environ. 2024, 315, 114413. [Google Scholar] [CrossRef]
- Dou, X.; Fan, X.; Wang, X.; Yunus, A.P.; Xiong, J.; Tang, R.; Lovati, M.; van Westen, C.; Xu, Q. Spatio-temporal evolution of glacial lakes in the Tibetan Plateau over the past 30 years. Remote Sens. 2023, 15, 416. [Google Scholar] [CrossRef]
- Wang, X.; Zhang, G.; Veh, G.; Sattar, A.; Wang, W.; Allen, S.K.; Bolch, T.; Peng, M.; Xu, F. Reconstructing glacial lake outburst floods in the Poiqu River basin, central Himalaya. Geomorphology 2024, 449, 109063. [Google Scholar] [CrossRef]
- Meier, M.F.; Post, A. What are glacier surges? Can. J. Earth Sci. 1969, 6, 807–817. [Google Scholar] [CrossRef]
- Zhang, T.; Wang, W.; Shen, Z.; An, B. Increasing frequency and destructiveness of glacier-related slope failures under global warming. Sci. Bull. 2023, 69, 30–33. [Google Scholar] [CrossRef]
- Yao, X.; Zhou, S.; Sun, M.; Duan, H.; Zhang, Y. Surging Glaciers in High Mountain Asia between 1986 and 2021. Remote Sens. 2023, 15, 4595. [Google Scholar] [CrossRef]
- Yao, X.; Liu, S.; Sun, M.; Zhang, X. Study on the glacial lake outburst flood events in Tibet since the 20th century. J. Nat. Resour. 2014, 29, 1377–1390. [Google Scholar]
- Zhang, T.; Wang, W. Global Inventory of Glacier-Related Slope Failures and Moraine Dammed Lake Outburst Floods (1901–2020); National Tibetan Plateau Data Center: Beijing, China, 2022. [Google Scholar]
- Zheng, G.; Bao, A.; Allen, S.; Ballesteros-Cánovas, J.A.; Yuan, Y.; Jiapaer, G.; Stoffel, M. Numerous unreported glacial lake outburst floods in the Third Pole revealed by high-resolution satellite data and geomorphological evidence. Sci. Bull. 2021, 66, 1270–1273. [Google Scholar] [CrossRef]
- Peng, S.; Ding, Y.; Liu, W.; Li, Z. 1 km monthly temperature and precipitation dataset for China from 1901 to 2017. Earth Syst. Sci. Data 2019, 11, 1931–1946. [Google Scholar] [CrossRef]
- Wang, J.; Xu, C. Geodetector: Principle and prospective. Acta Geogr. Sin. 2017, 72, 116–134. [Google Scholar]
- Nie, Y.; Liu, Q.; Wang, J.; Zhang, Y.; Sheng, Y.; Liu, S. An inventory of historical glacial lake outburst floods in the Himalayas based on remote sensing observations and geomorphological analysis. Geomorphology 2018, 308, 91–106. [Google Scholar] [CrossRef]
- Gu, C.; Li, S.; Liu, M.; Hu, K.; Wang, P. Monitoring glacier lake outburst flood (GLOF) of Lake Merzbacher using dense Chinese high-resolution satellite images. Remote Sens. 2023, 15, 1941. [Google Scholar] [CrossRef]
- Rounce, D.R.; Hock, R.; Maussion, F.; Hugonnet, R.; Kochtitzky, W.; Huss, M.; Berthier, E.; Brinkerhoff, D.; Compagno, L.; Copland, L.; et al. Global glacier change in the 21st century: Every increase in temperature matters. Science 2023, 379, 78–83. [Google Scholar] [CrossRef]
- Chen, W.; Yao, T.; Zhang, G.; Woolway, R.I.; Yang, W.; Xu, F.; Zhou, T. Glacier surface heatwaves over the Tibetan Plateau. Geophys. Res. Lett. 2023, 50, e2022G–e101115G. [Google Scholar] [CrossRef]
- You, Q.; Chen, D.; Wu, F.; Pepin, N.; Cai, Z.; Ahrens, B.; Jiang, Z.; Wu, Z.; Kang, S.; AghaKouchak, A. Elevation dependent warming over the Tibetan Plateau: Patterns, mechanisms and perspectives. Earth-Sci. Rev. 2020, 210, 103349. [Google Scholar] [CrossRef]
- Li, Y.; Sun, F.; Chen, Y.; Li, B.; Fang, G.; Duan, W.; Xia, Q. The continuing shrinkage of snow cover in High Mountain Asia over the last four decades. Sci. Bull. 2022, 67, 2064–2068. [Google Scholar] [CrossRef]
- Yao, T.; Xue, Y.; Chen, D.; Chen, F.; Thompson, L.; Cui, P.; Koike, T.; Lau, W.K.-M.; Lettenmaier, D.; Mosbrugger, V.; et al. Recent third pole’s rapid warming accompanies cryospheric melt and water cycle intensification and interactions between monsoon and environment: Multidisciplinary approach with observations, modeling, and analysis. Bull. Am. Meteorol. Soc. 2019, 100, 423–444. [Google Scholar] [CrossRef]
- Sarangi, C.; Qian, Y.; Rittger, K.; Leung, L.R.; Chand, D.; Bormann, K.J.; Painter, T.H. Dust dominates high-altitude snow darkening and melt over high-mountain Asia. Nat. Clim. Change 2020, 10, 1045–1051. [Google Scholar] [CrossRef]
- Zhang, G.; Carrivick, J.L.; Emmer, A.; Shugar, D.H.; Veh, G.; Wang, X.; Labedz, C.; Mergili, M.; Mölg, N.; Huss, M. Charac-teristics and changes of glacial lakes and outburst floods. Nat. Rev. Earth Environ. 2024, 5, 447–462. [Google Scholar] [CrossRef]
- Veh, G.; Lützow, N.; Kharlamova, V.; Petrakov, D.; Hugonnet, R.; Korup, O. Trends, breaks, and biases in the frequency of reported glacier lake outburst floods. Earth’s Future 2022, 10, e2021E–e2426E. [Google Scholar] [CrossRef]
- Rick, B.; McGrath, D.; McCoy, S.W.; Armstrong, W.H. Unchanged frequency and decreasing magnitude of outbursts from ice-dammed lakes in Alaska. Nat. Commun. 2023, 14, 6138. [Google Scholar] [CrossRef]
- Frey, H.; Paul, F.; Strozzi, T. Compilation of a glacier inventory for the western Himalayas from satellite data: Methods, challenges, and results. Remote Sens. Environ. 2012, 124, 832–843. [Google Scholar] [CrossRef]
- Wang, M.; Shangguan, D.; Li, D.; Li, Y.; Wang, R.; He, R.; Butt, A.Q. Glacial hazards change in Xinjiang over the past seven decades: Spatiotemporal patterns and trends. Quat. Sci. Rev. 2025, 351, 109183. [Google Scholar] [CrossRef]
- Zhong, Y.; Allen, S.; Li, D.; Corona, C.; Zheng, G.; Liu, Q.; Stoffel, M. Unravelling driving conditions of rock and ice avalanches and resulting cascading processes in High Mountain Asia. Landslides 2025, 22, 989–1001. [Google Scholar] [CrossRef]
- Rafiq, M.; Romshoo, S.A.; Mishra, A.K.; Jalal, F. Modelling Chorabari lake outburst flood, kedarnath, India. J. Mt. Sci. 2019, 16, 64–76. [Google Scholar] [CrossRef]
- Li, S.; Zhang, Y.; Wang, Z.; Li, L. Mapping human influence intensity in the Tibetan Plateau for conservation of ecological service functions. Ecosyst. Serv. 2018, 30, 276–286. [Google Scholar] [CrossRef]
- Qi, W.; Liu, S.; Zhou, L. Regional differentiation of population in Tibetan Plateau: Insight from the “Hu Line”. Acta Geogr. Sin. 2020, 75, 255–267. [Google Scholar]
- Wang, W.; Zhang, T.; Yao, T.; An, B. Monitoring and early warning system of Cirenmaco glacial lake in the central Himalayas. Int. J. Disaster Risk Reduct. 2022, 73, 102914. [Google Scholar] [CrossRef]
- Shrestha, M.; Goodrich, C.; Udas, P.; Rai, D.; Gurung, M.; Khadgi, V. Flood Early Warning Systems in Bhutan: A Gendered Perspective; International Centre for Integrated Mountain Development (ICIMOD): Kathmandu, Nepal, 2016. [Google Scholar]
- Gurung, D.R.; Bajracharya, S.; Shrestha, B.R.; Pradhan, P. Wi-Fi network at Imja Tsho (lake), Nepal: An early warning system (EWS) for glacial lake outburst flood (GLOF). Grazer Schriften Geogr. Raumforschung. 2010, 45, 321–326. [Google Scholar]
Disclaimer/Publisher’s Note: The statements, opinions and data contained in all publications are solely those of the individual author(s) and contributor(s) and not of MDPI and/or the editor(s). MDPI and/or the editor(s) disclaim responsibility for any injury to people or property resulting from any ideas, methods, instructions or products referred to in the content. |
© 2025 by the authors. Licensee MDPI, Basel, Switzerland. This article is an open access article distributed under the terms and conditions of the Creative Commons Attribution (CC BY) license (https://creativecommons.org/licenses/by/4.0/).