

Urban Tree Species Identification Based on Crown RGB Point Clouds Using Random Forest and PointNet


Abstract
1. Introduction
2. Materials and Methods
2.1. Study Zone
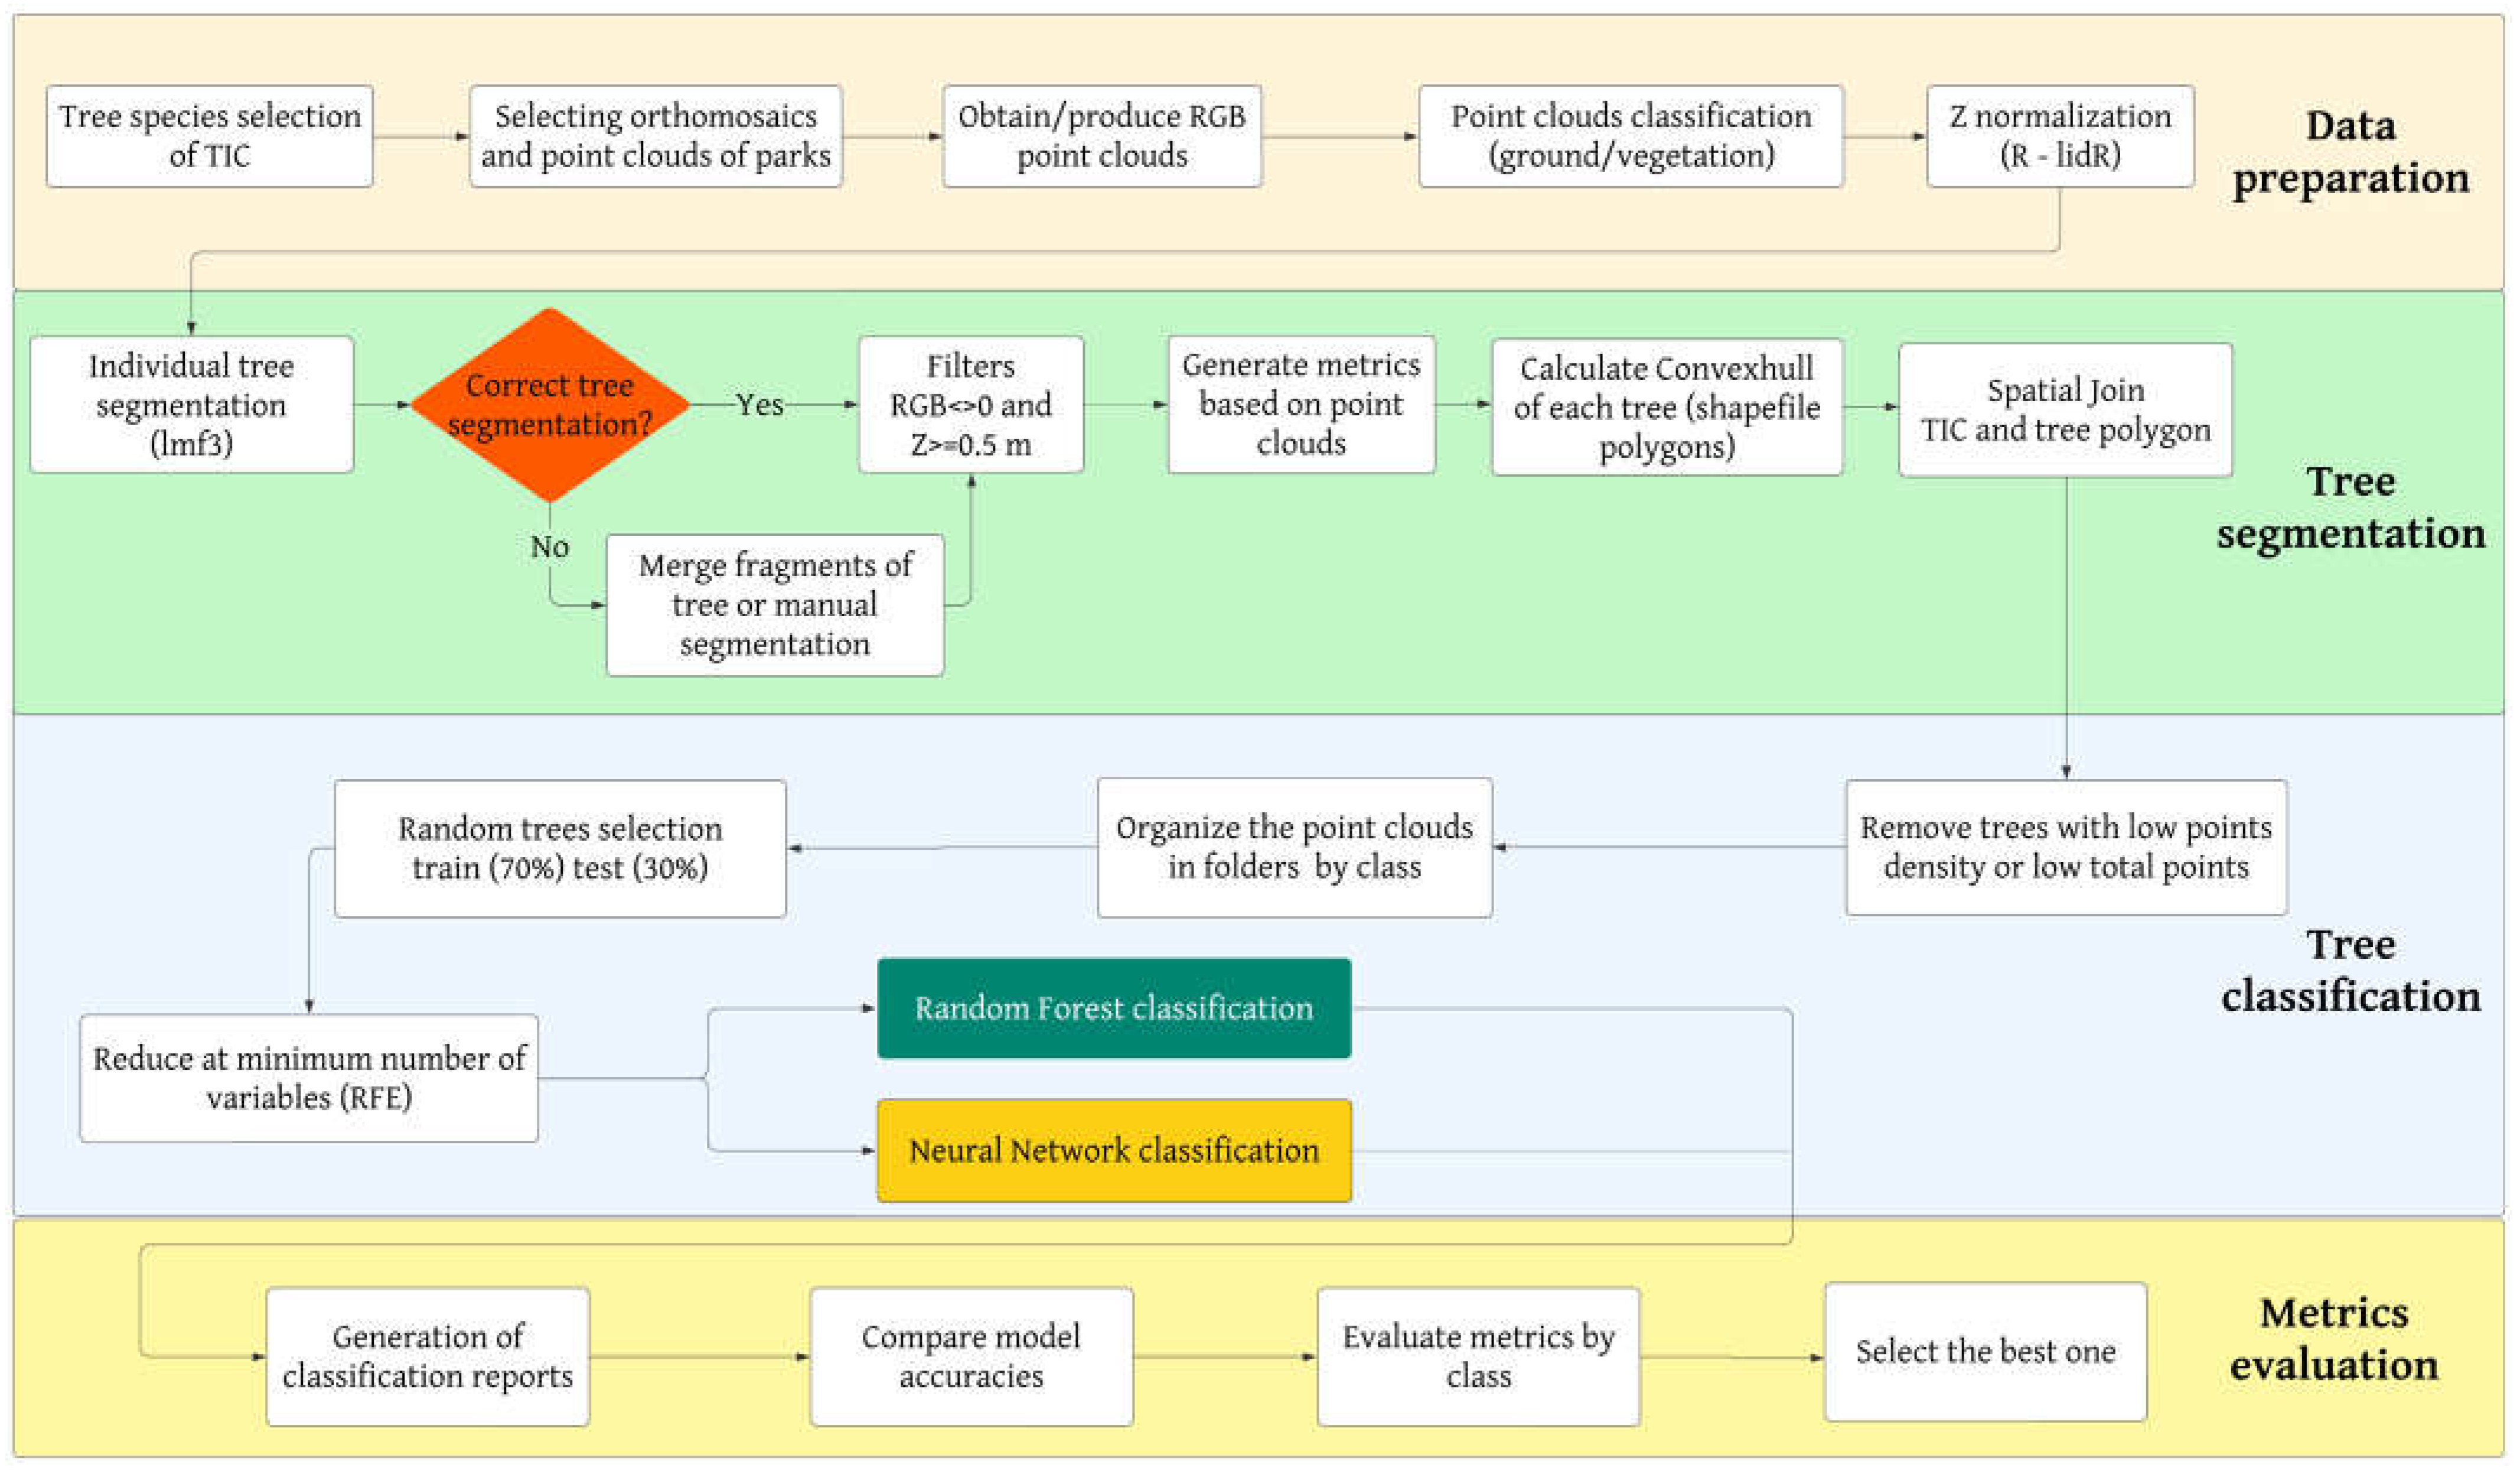
2.2. Workflow Description
2.2.1. UAV Data Collection
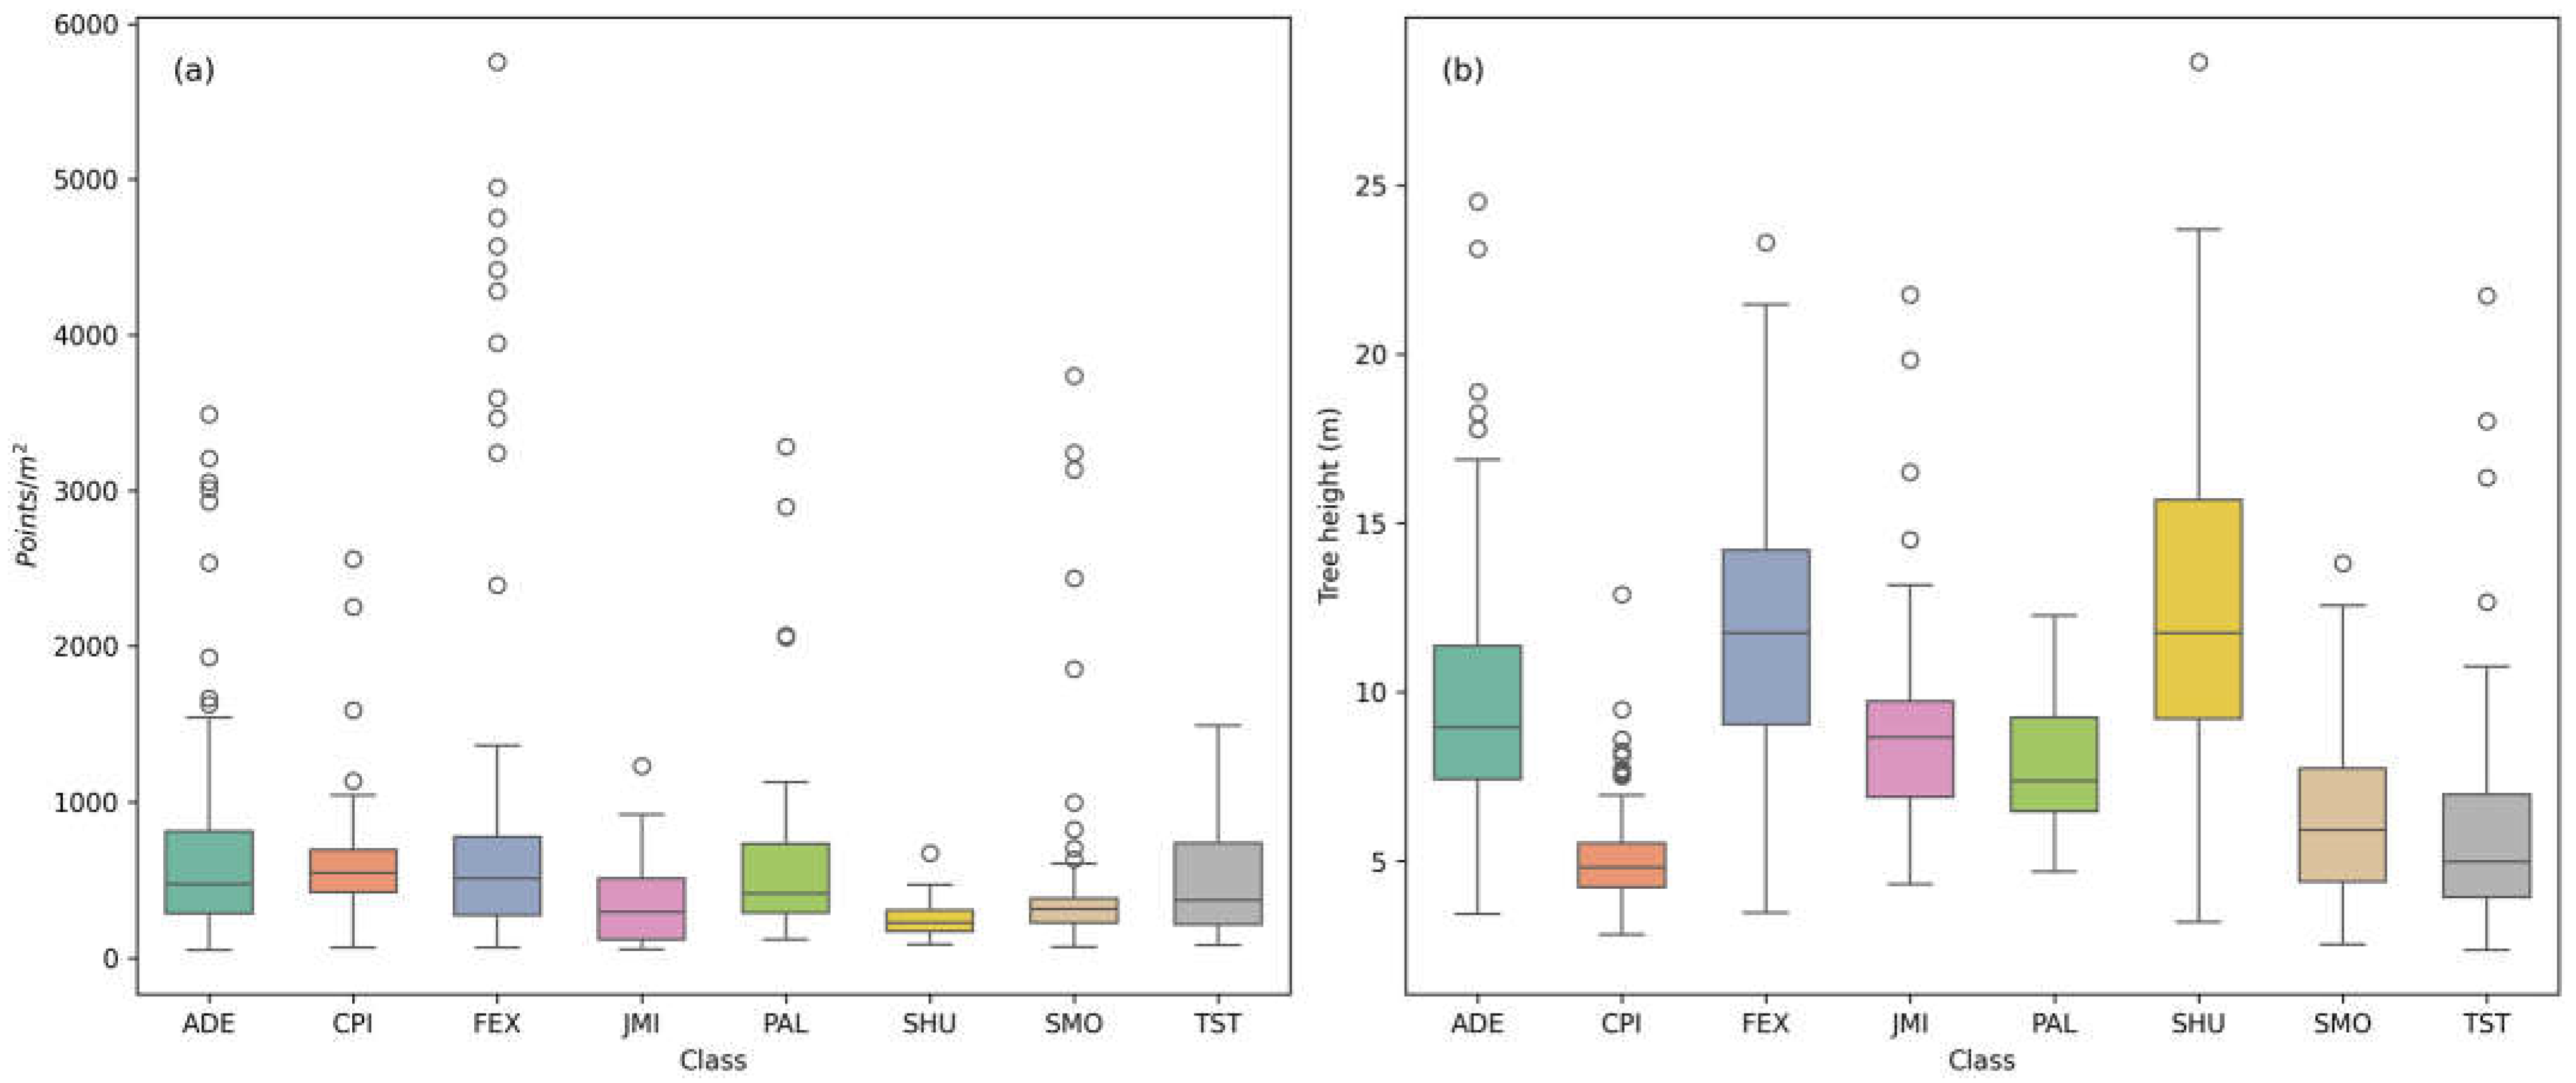
2.2.2. Tree Segmentation and Feature Extraction
2.2.3. Feature Selection and Classification
2.2.4. Tree Identification Using PointNet and PointNet++
3. Results
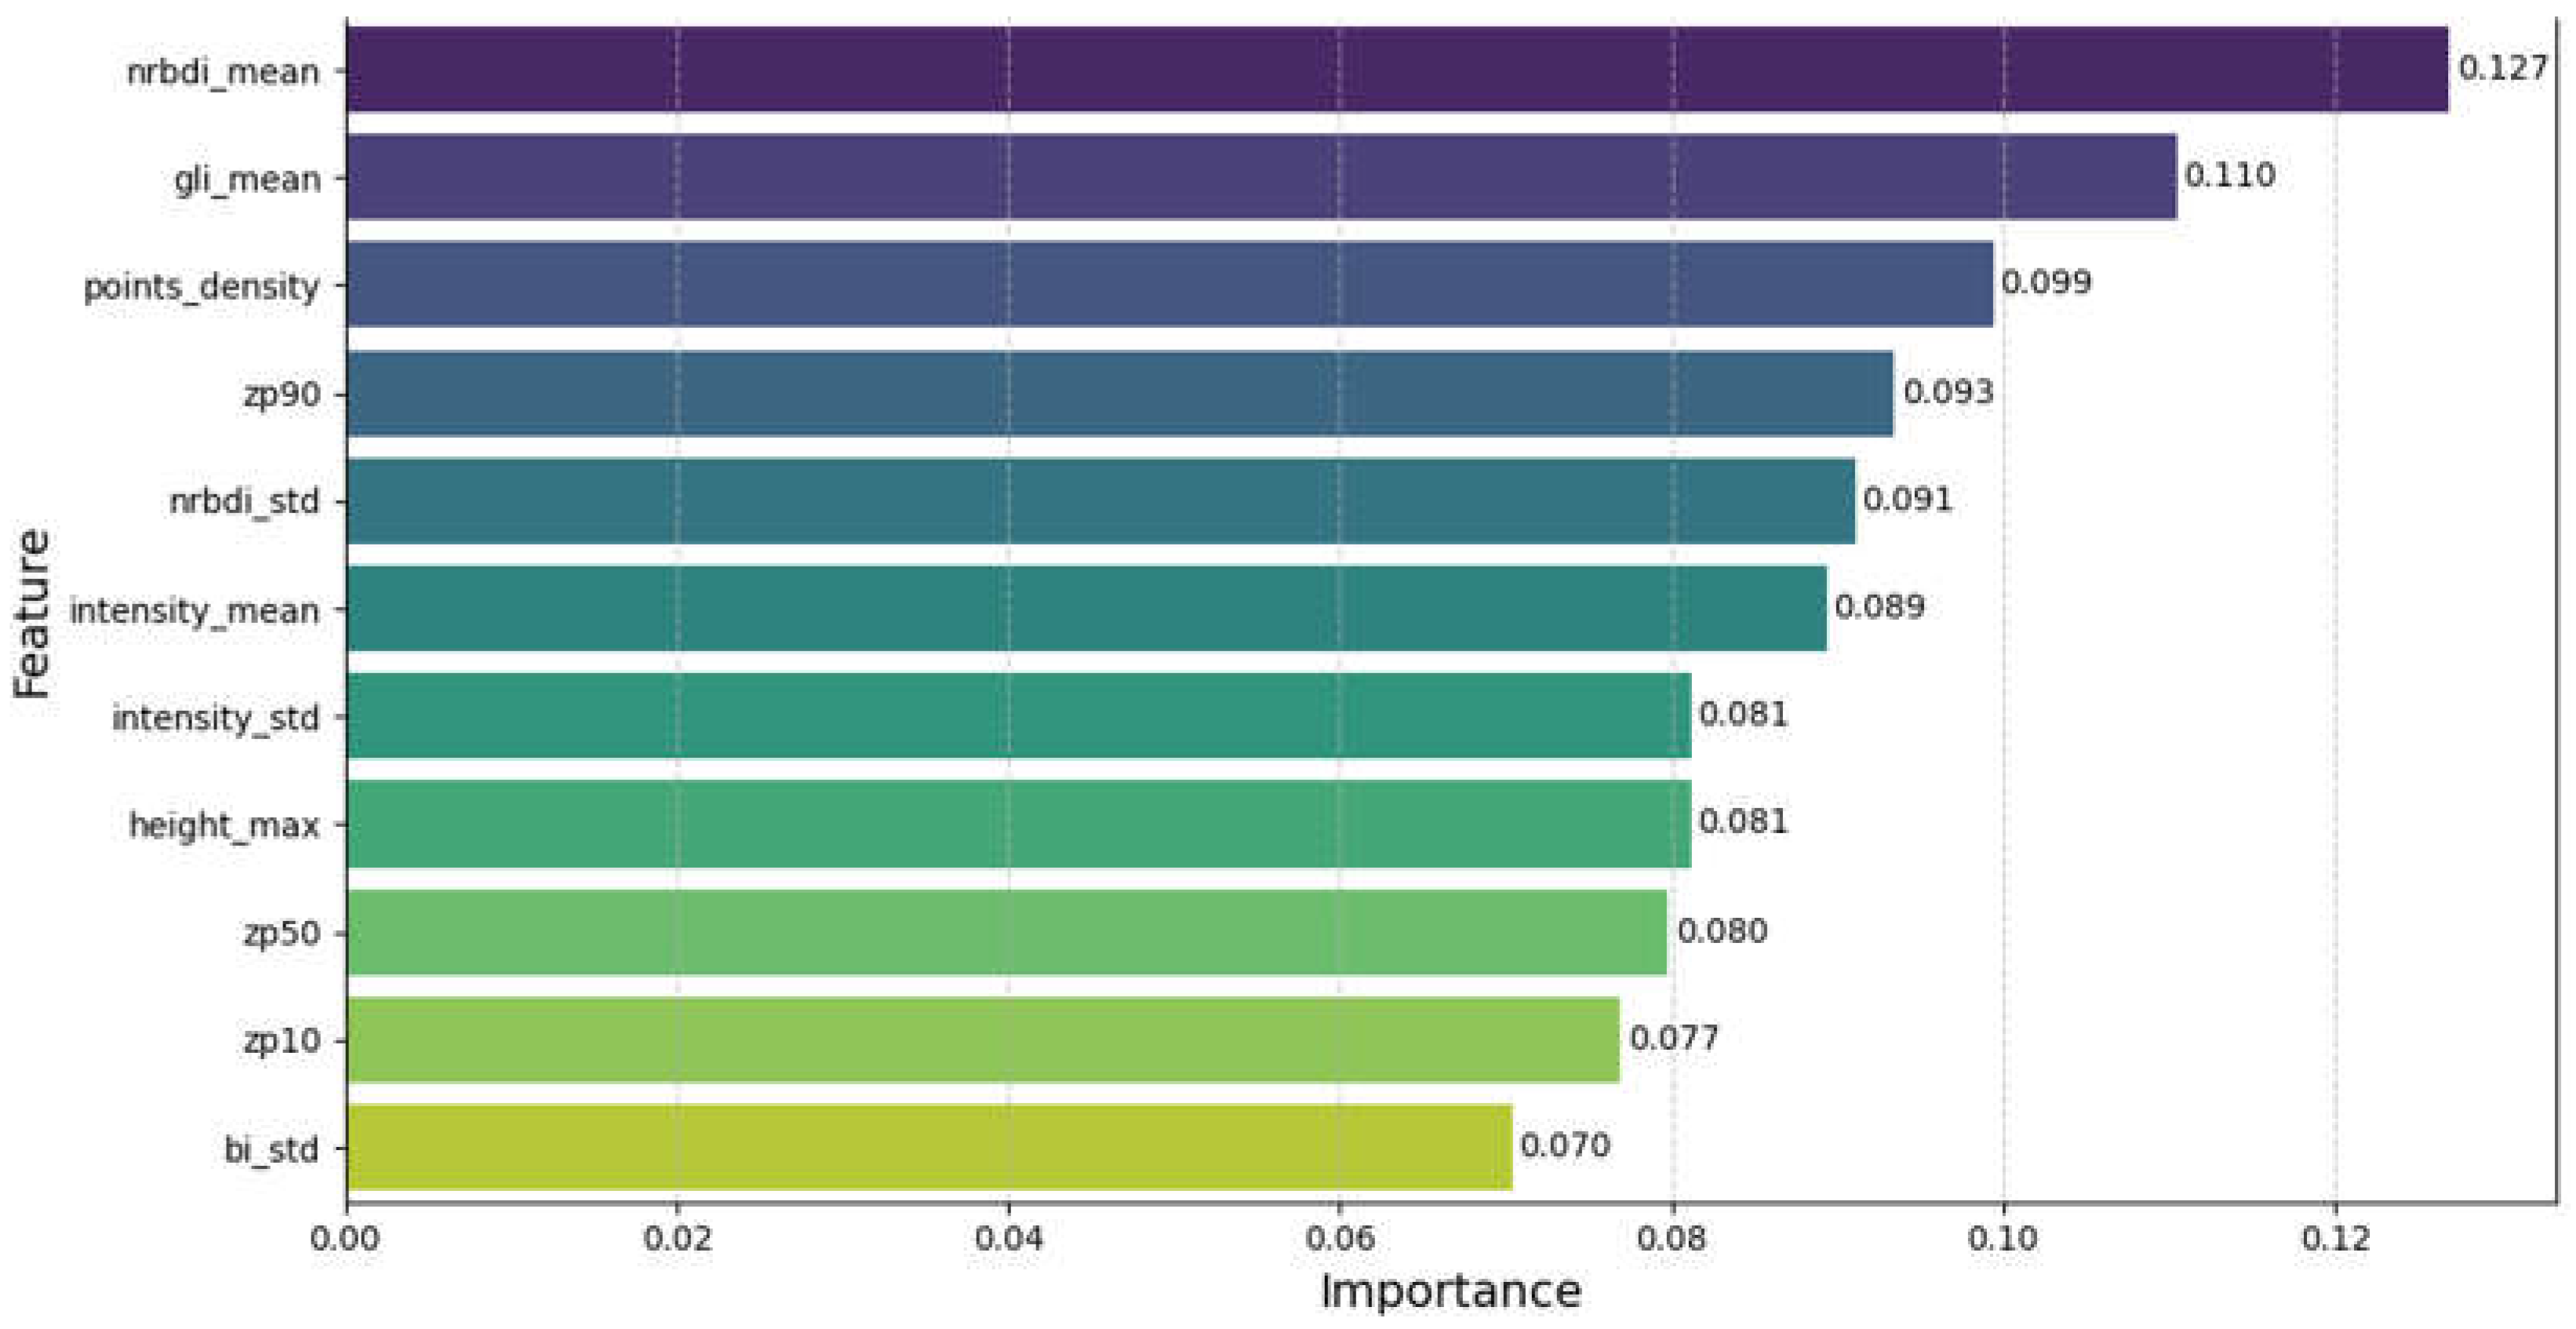
3.1. Model Accuracy and Feature Importance Using RF
3.2. Classification Probabilities Using RF
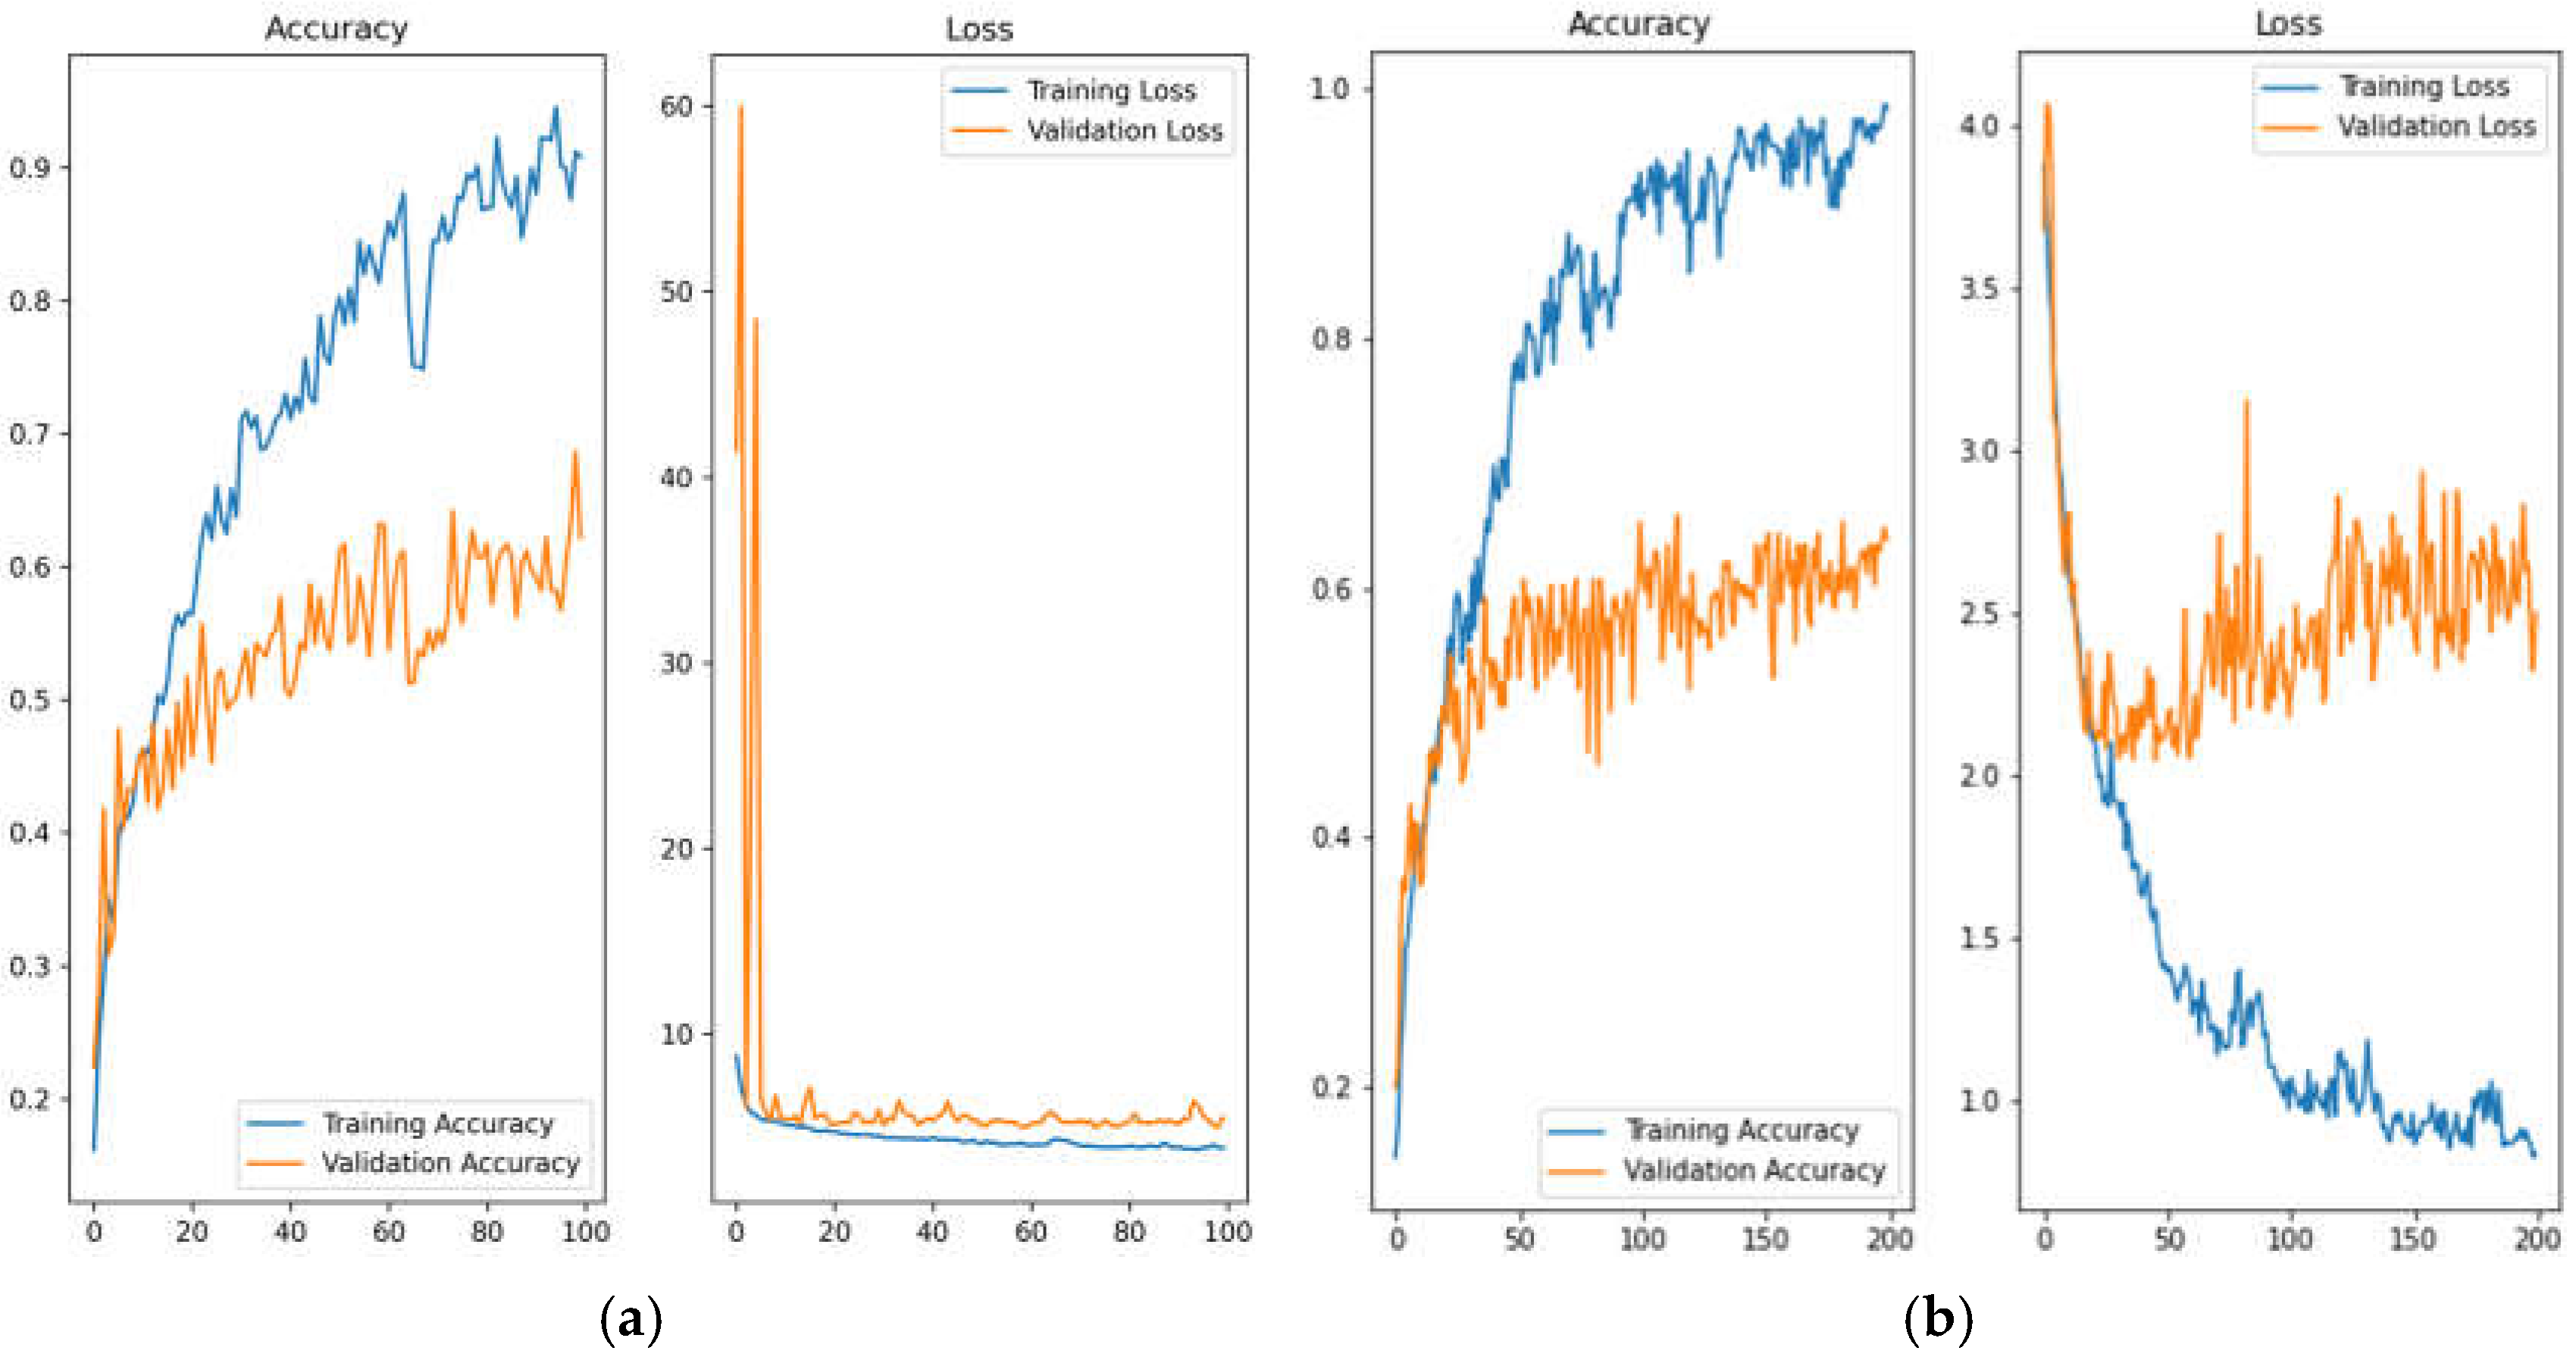
3.3. Classification Results with PointNet and PointNet++
4. Discussion
4.1. Limitations
4.2. Opportunities
4.3. Models and Classes Performance
4.4. Feature Importance
5. Conclusions
Supplementary Materials
Author Contributions
Funding
Data Availability Statement
Acknowledgments
Conflicts of Interest
References
- Liu, J.; Wang, X.; Wang, T. Classification of Tree Species and Stock Volume Estimation in Ground Forest Images Using Deep Learning. Comput. Electron. Agric. 2019, 166, 105012. [Google Scholar] [CrossRef]
- Pu, R. Mapping Tree Species Using Advanced Remote Sensing Technologies: A State-of-the-Art Review and Perspective. J. Remote Sens. 2021, 2021, 9812624. [Google Scholar] [CrossRef]
- Liu, B.; Chen, S.; Huang, H.; Tian, X. Tree Species Classification of Backpack Laser Scanning Data Using the PointNet++ Point Cloud Deep Learning Method. Remote Sens. 2022, 14, 3809. [Google Scholar] [CrossRef]
- Rieckmann, M.; Adomßent, M.; Härdtle, W.; Aguirre, P. Sustainable Development and Conservation of Biodiversity Hotspots in Latin America: The Case of Ecuador. In Biodiversity Hotspots; Springer: Berlin/Heidelberg, Germany, 2011; pp. 435–452. [Google Scholar]
- MAE; FAO. Especies Forestales Leñosas Arbóreas y Arbustivas de Los Bosques Montanos Del Ecuador; MAE/FAO: Quito, Ecuador, 2015.
- Jadán, O.; Donoso, D.A.; Cedillo, H.; Bermúdez, F.; Cabrera, O. Floristic Groups, and Changes in Diversity and Structure of Trees, in Tropical Montane Forests in the Southern Andes of Ecuador. Diversity 2021, 13, 400. [Google Scholar] [CrossRef]
- Aguirre, Z.; Valencia, E.; Veintimilla, D.; Pardo, S.; Jaramillo, N. Floristic Diversity, Structure, and Endemism of the Woody Component in the Lower Montane Evergreen Forest of Valladolid Parish, Zamora Chinchipe, Ecuador. Rev. Cienc. Tecnol. 2024, 20, 121–134. [Google Scholar] [CrossRef]
- Cuesta, F.; Peralvo, M.; Merino-Viteri, A.; Bustamante, M.; Baquero, F.; Freile, J.F.; Muriel, P.; Torres-Carvajal, O. Priority Areas for Biodiversity Conservation in Mainland Ecuador. Neotrop. Biodivers. 2017, 3, 93–106. [Google Scholar] [CrossRef]
- FAO. Global Forest Resources Assessment 2020; FAO: Rome, Italy, 2020; ISBN 978-92-5-132581-0.
- Lian, X.; Zhang, H.; Xiao, W.; Lei, Y.; Ge, L.; Qin, K.; He, Y.; Dong, Q.; Li, L.; Han, Y.; et al. Biomass Calculations of Individual Trees Based on Unmanned Aerial Vehicle Multispectral Imagery and Laser Scanning Combined with Terrestrial Laser Scanning in Complex Stands. Remote Sens. 2022, 14, 4715. [Google Scholar] [CrossRef]
- Chen, J.; Chen, Y.; Liu, Z. Classification of Typical Tree Species in Laser Point Cloud Based on Deep Learning. Remote Sens. 2021, 13, 4750. [Google Scholar] [CrossRef]
- Fan, Z.; Wei, J.; Zhang, R.; Zhang, W. Tree Species Classification Based on PointNet++ and Airborne Laser Survey Point Cloud Data Enhancement. Forests 2023, 14, 1246. [Google Scholar] [CrossRef]
- Ma, Z.; Pang, Y.; Wang, D.; Liang, X.; Chen, B.; Lu, H.; Weinacker, H.; Koch, B. Individual Tree Crown Segmentation of a Larch Plantation Using Airborne Laser Scanning Data Based on Region Growing and Canopy Morphology Features. Remote Sens. 2020, 12, 1078. [Google Scholar] [CrossRef]
- Seidel, D.; Annighöfer, P.; Thielman, A.; Seifert, Q.E.; Thauer, J.-H.; Glatthorn, J.; Ehbrecht, M.; Kneib, T.; Ammer, C. Predicting Tree Species From 3D Laser Scanning Point Clouds Using Deep Learning. Front. Plant Sci. 2021, 12, 635440. [Google Scholar] [CrossRef]
- Hartling, S.; Sagan, V.; Sidike, P.; Maimaitijiang, M.; Carron, J. Urban Tree Species Classification Using a Worldview-2/3 and LiDAR Data Fusion Approach and Deep Learning. Sensors 2019, 19, 1284. [Google Scholar] [CrossRef]
- Shi, Y.; Wang, T.; Skidmore, A.K.; Heurich, M. Important LiDAR Metrics for Discriminating Forest Tree Species in Central Europe. ISPRS J. Photogramm. Remote Sens. 2018, 137, 163–174. [Google Scholar] [CrossRef]
- Pacheco-Prado, D.; Bravo-López, E.; Ruiz, L.Á. Tree Species Identification in Urban Environments Using TensorFlow Lite and a Transfer Learning Approach. Forests 2023, 14, 1050. [Google Scholar] [CrossRef]
- Diez, Y.; Kentsch, S.; Fukuda, M.; López Cáceres, M.L.; Moritake, K.; Cabezas, M. Deep Learning in Forestry Using UAV-Acquired RGB Data: A Practical Review. Remote Sens. 2021, 13, 2837. [Google Scholar] [CrossRef]
- Guimarães, N.; Pádua, L.; Marques, P.; Silva, N.; Peres, E.; Sousa, J.J. Forestry Remote Sensing from Unmanned Aerial Vehicles: A Review Focusing on the Data, Processing and Potentialities. Remote Sens. 2020, 12, 1046. [Google Scholar] [CrossRef]
- Lines, E.R.; Fischer, F.J.; Owen, H.J.F.; Jucker, T. The Shape of Trees: Reimagining Forest Ecology in Three Dimensions with Remote Sensing. J. Ecol. 2022, 110, 1730–1745. [Google Scholar] [CrossRef]
- Atkins, J.W.; Bhatt, P.; Carrasco, L.; Francis, E.; Garabedian, J.E.; Hakkenberg, C.R.; Hardiman, B.S.; Jung, J.; Koirala, A.; LaRue, E.A.; et al. Integrating Forest Structural Diversity Measurement into Ecological Research. Ecosphere 2023, 14, e4633. [Google Scholar] [CrossRef]
- Mouafik, M.; Chakhchar, A.; Fouad, M.; El Aboudi, A. Remote Sensing Technologies for Monitoring Argane Forest Stands: A Comprehensive Review. Geographies 2024, 4, 441–461. [Google Scholar] [CrossRef]
- Ecke, S.; Stehr, F.; Frey, J.; Tiede, D.; Dempewolf, J.; Klemmt, H.J.; Endres, E.; Seifert, T. Towards Operational UAV-Based Forest Health Monitoring: Species Identification and Crown Condition Assessment by Means of Deep Learning. Comput. Electron. Agric. 2024, 219, 108785. [Google Scholar] [CrossRef]
- Li, X.; Zheng, Z.; Xu, C.; Zhao, P.; Chen, J.; Wu, J.; Zhao, X.; Mu, X.; Zhao, D.; Zeng, Y. Individual Tree-Based Forest Species Diversity Estimation by Classification and Clustering Methods Using UAV Data. Front. Ecol. Evol. 2023, 11, 1139458. [Google Scholar] [CrossRef]
- Onishi, M.; Ise, T. Explainable Identification and Mapping of Trees Using UAV RGB Image and Deep Learning. Sci. Rep. 2021, 11, 903. [Google Scholar] [CrossRef] [PubMed]
- Feng, X.; Li, P. A Tree Species Mapping Method from UAV Images over Urban Area Using Similarity in Tree-Crown Object Histograms. Remote Sens. 2019, 11, 1982. [Google Scholar] [CrossRef]
- Xu, Z.; Shen, X.; Cao, L.; Coops, N.C.; Goodbody, T.R.H.; Zhong, T.; Zhao, W.; Sun, Q.; Ba, S.; Zhang, Z.; et al. Tree Species Classification Using UAS-Based Digital Aerial Photogrammetry Point Clouds and Multispectral Imageries in Subtropical Natural Forests. Int. J. Appl. Earth Obs. Geoinf. 2020, 92, 102173. [Google Scholar] [CrossRef]
- Briechle, S.; Krzystek, P.; Vosselman, G. Classification of Tree Species and Standing Dead Trees by Fusing UAV-Based LiDAR Data and Multispectral Imagery in the 3D Deep Neural Network Pointnet++. ISPRS Ann. Photogramm. Remote Sens. Spat. Inf. Sci. 2020, V-2–2020, 203–210. [Google Scholar] [CrossRef]
- Sothe, C.; Dalponte, M.; de Almeida, C.M.; Schimalski, M.B.; Lima, C.L.; Liesenberg, V.; Takahashi Miyoshi, G.; Garcia Tommaselli, A.M. Tree Species Classification in a Highly Diverse Subtropical Forest Integrating UAV-Based Photogrammetric Point Cloud and Hyperspectral Data. Remote Sens. 2019, 11, 1338. [Google Scholar] [CrossRef]
- Nevalainen, O.; Honkavaara, E.; Tuominen, S.; Viljanen, N.; Hakala, T.; Yu, X.; Hyyppä, J.; Saari, H.; Pölönen, I.; Imai, N.; et al. Individual Tree Detection and Classification with UAV-Based Photogrammetric Point Clouds and Hyperspectral Imaging. Remote Sens. 2017, 9, 185. [Google Scholar] [CrossRef]
- Kovanič, Ľ.; Topitzer, B.; Peťovský, P.; Blišťan, P.; Gergeľová, M.B.; Blišťanová, M. Review of Photogrammetric and LiDAR Applications of UAV. Appl. Sci. 2023, 13, 6732. [Google Scholar] [CrossRef]
- Chen, J.; Liang, X.; Liu, Z.; Gong, W.; Chen, Y.; Hyyppä, J.; Kukko, A.; Wang, Y. Tree Species Recognition from Close-Range Sensing: A Review. Remote Sens. Environ. 2024, 313, 114337. [Google Scholar] [CrossRef]
- Pleşoianu, A.I.; Stupariu, M.S.; Şandric, I.; Pătru-Stupariu, I.; Drăguţ, L. Individual Tree-Crown Detection and Species Classification in Very High-Resolution Remote Sensing Imagery Using a Deep Learning Ensemble Model. Remote Sens. 2020, 12, 2426. [Google Scholar] [CrossRef]
- Remondino, F.; Barazzetti, L.; Nex, F.; Scaioni, M.; Sarazzi, D. UAV Photogrammetry for Mapping and 3d Modeling–Current Status and Future Perspectives. Int. Arch. Photogramm. Remote Sens. Spat. Inf. Sci. 2011, 38-1/C22, 25–31. [Google Scholar] [CrossRef]
- Cetin, Z.; Yastikli, N. The Use of Machine Learning Algorithms in Urban Tree Species Classification. ISPRS Int. J. Geoinf. 2022, 11, 226. [Google Scholar] [CrossRef]
- Fassnacht, F.E.; White, J.C.; Wulder, M.A.; Næsset, E. Remote Sensing in Forestry: Current Challenges, Considerations and Directions. For. Int. J. For. Res. 2024, 97, 11–37. [Google Scholar] [CrossRef]
- Mesas-Carrascosa, F.-J.; de Castro, A.I.; Torres-Sánchez, J.; Triviño-Tarradas, P.; Jiménez-Brenes, F.M.; García-Ferrer, A.; López-Granados, F. Classification of 3D Point Clouds Using Color Vegetation Indices for Precision Viticulture and Digitizing Applications. Remote Sens. 2020, 12, 317. [Google Scholar] [CrossRef]
- Carbonell-Rivera, J.P.; Ruiz, L.Á.; Estornel, J.; Simó-Martí, M.; Quille-Mamani, J.; Torralba, J. Comparación de Biomasa Estimada a Partir de Mediciones Clásicas y Nubes de Puntos UAV Clasificadas Mediante Class3Dp. In Proceedings of the XX Congreso de la Asociación Española de Teledetección. Teledetección y Cambio Global: Retos y Oportunidades para un Crecimiento Azul, Cádiz, Spain, 4–7 June 2024; pp. 219–222. [Google Scholar]
- Picos, J.; Bastos, G.; Míguez, D.; Alonso, L.; Armesto, J. Individual Tree Detection in a Eucalyptus Plantation Using Unmanned Aerial Vehicle (UAV)-LiDAR. Remote Sens. 2020, 12, 885. [Google Scholar] [CrossRef]
- Lindberg, E.; Holmgren, J. Individual Tree Crown Methods for 3D Data from Remote Sensing. Curr. For. Rep. 2017, 3, 19–31. [Google Scholar] [CrossRef]
- Xu, C.; Morgenroth, J.; Manley, B. Integrating Data from Discrete Return Airborne LiDAR and Optical Sensors to Enhance the Accuracy of Forest Description: A Review. Curr. For. Rep. 2015, 1, 206–219. [Google Scholar] [CrossRef]
- Favorskaya, M.; Tkacheva, A.; Danilin, I.M.; Medvedev, E.M. Fusion of Airborne LiDAR and Digital Photography Data for Tree Crowns Segmentation and Measurement. In Proceedings of the Smart Innovation, Systems and Technologies, Sorrento, Italy, 17–19 June 2015; Volume 40. [Google Scholar]
- Tao, W. Multi-View Dense Match for Forest Area. Int. Arch. Photogramm. Remote Sens. Spatial Inf. Sci. 2014, XL-1, 397–400. [Google Scholar] [CrossRef]
- Liu, B.; Huang, H.; Su, Y.; Chen, S.; Li, Z.; Chen, E.; Tian, X. Tree Species Classification Using Ground-Based LiDAR Data by Various Point Cloud Deep Learning Methods. Remote Sens. 2022, 14, 5733. [Google Scholar] [CrossRef]
- Westoby, M.J.; Brasington, J.; Glasser, N.F.; Hambrey, M.J.; Reynolds, J.M. “Structure-from-Motion” Photogrammetry: A Low-Cost, Effective Tool for Geoscience Applications. Geomorphology 2012, 179, 300–314. [Google Scholar] [CrossRef]
- Greco, R.; Barca, E.; Raumonen, P.; Persia, M.; Tartarino, P. Methodology for Measuring Dendrometric Parameters in a Mediterranean Forest with UAVs Flying inside Forest. Int. J. Appl. Earth Obs. Geoinf. 2023, 122, 103426. [Google Scholar] [CrossRef]
- Ke, Y.; Quackenbush, L.J. A Review of Methods for Automatic Individual Tree-Crown Detection and Delineation from Passive Remote Sensing. Int. J. Remote Sens. 2011, 32, 4725–4747. [Google Scholar] [CrossRef]
- Burt, A.; Disney, M.; Calders, K. Extracting Individual Trees from Lidar Point Clouds Using Treeseg. Methods Ecol. Evol. 2019, 10, 438–445. [Google Scholar] [CrossRef]
- Iglhaut, J.; Cabo, C.; Puliti, S.; Piermattei, L.; O’Connor, J.; Rosette, J. Structure from Motion Photogrammetry in Forestry: A Review. Curr. For. Rep. 2019, 5, 155–168. [Google Scholar] [CrossRef]
- Eltner, A.; Sofia, G. Structure from Motion Photogrammetric Technique. In Developments in Earth Surface Processes; Tarolli, P., Mudd, S.M., Eds.; Elsevier: Amsterdam, The Netherlands, 2020; Volume 23, pp. 1–24. ISBN 978-0-444-64178-6. [Google Scholar]
- Alonzo, M.; Andersen, H.E.; Morton, D.C.; Cook, B.D. Quantifying Boreal Forest Structure and Composition Using UAV Structure from Motion. Forests 2018, 9, 119. [Google Scholar] [CrossRef]
- Pacheco-Prado, D.; Bravo-López, E.; Martínez-Urgilés, E. Tree Species Identification Using UAV RGB and Multispectral Cloud Points. In Proceedings of the Emerging Research in Intelligent Systems, Ecuador, South America, 15 March 2024; Olmedo Cifuentes, G.F., Arcos Avilés, D.G., Lara Padilla, H.V., Eds.; Springer Nature: Cham, Switzerland, 2025; pp. 66–79. [Google Scholar]
- Carbonell-Rivera, J.P.; Torralba, J.; Estornell, J.; Ruiz, L.Á.; Crespo-Peremarch, P. Classification of Mediterranean Shrub Species from UAV Point Clouds. Remote Sens. 2022, 14, 199. [Google Scholar] [CrossRef]
- Zeybek, M. Classification of UAV Point Clouds by Random Forest Machine Learning Algorithm. Turk. J. Eng. 2021, 5, 48–57. [Google Scholar] [CrossRef]
- Hartling, S.; Sagan, V.; Maimaitijiang, M. Urban Tree Species Classification Using UAV-Based Multi-Sensor Data Fusion and Machine Learning. GIsci Remote Sens. 2021, 58, 1250–1275. [Google Scholar] [CrossRef]
- Carbonell-Rivera, J.P.; Estornell, J.; Ruiz, L.A.; Torralba, J.; Crespo-Peremarch, P. Classification of UAV-Based Photogrammetric Point Clouds of Riverine Species Using Machine Learning Algorithms: A Case Study in the Palancia River, Spain. Int. Arch. Photogramm. Remote Sens. Spat. Inf. Sci. 2020, XLIII-B2-2020, 659–666. [Google Scholar] [CrossRef]
- Immitzer, M.; Atzberger, C.; Koukal, T. Tree Species Classification with Random Forest Using Very High Spatial Resolution 8-Band WorldView-2 Satellite Data. Remote Sens. 2012, 4, 2661–2693. [Google Scholar] [CrossRef]
- Zhong, H.; Zhang, Z.; Liu, H.; Wu, J.; Lin, W. Individual Tree Species Identification for Complex Coniferous and Broad-Leaved Mixed Forests Based on Deep Learning Combined with UAV LiDAR Data and RGB Images. Forests 2024, 15, 293. [Google Scholar] [CrossRef]
- Zhang, Z.; Liu, X. Support Vector Machines for Tree Species Identification Using LiDAR-Derived Structure and Intensity Variables. Geocarto Int. 2013, 28, 364–378. [Google Scholar] [CrossRef]
- Qi, Y.; Dong, X.; Chen, P.; Lee, K.-H.; Lan, Y.; Lu, X.; Jia, R.; Deng, J.; Zhang, Y. Canopy Volume Extraction of Citrus Reticulate Blanco Cv. Shatangju Trees Using UAV Image-Based Point Cloud Deep Learning. Remote Sens. 2021, 13, 3437. [Google Scholar] [CrossRef]
- Kim, D.H.; Ko, C.U.; Kim, D.G.; Kang, J.T.; Park, J.M.; Cho, H.J. Automated Segmentation of Individual Tree Structures Using Deep Learning over LiDAR Point Cloud Data. Forests 2023, 14, 1159. [Google Scholar] [CrossRef]
- Xu, N.; Qin, R.; Song, S. Point Cloud Registration for LiDAR and Photogrammetric Data: A Critical Synthesis and Performance Analysis on Classic and Deep Learning Algorithms. ISPRS Open J. Photogramm. Remote Sens. 2023, 8, 100032. [Google Scholar] [CrossRef]
- Modzelewska, A.; Fassnacht, F.E.; Stereńczak, K. Tree Species Identification within an Extensive Forest Area with Diverse Management Regimes Using Airborne Hyperspectral Data. Int. J. Appl. Earth Obs. Geoinf. 2020, 84, 101960. [Google Scholar] [CrossRef]
- Rana, P.; St-Onge, B.; Prieur, J.F.; Cristina Budei, B.; Tolvanen, A.; Tokola, T. Effect of Feature Standardization on Reducing the Requirements of Field Samples for Individual Tree Species Classification Using ALS Data. ISPRS J. Photogramm. Remote Sens. 2022, 184, 189–202. [Google Scholar] [CrossRef]
- Shrestha, A.; Mahmood, A. Review of Deep Learning Algorithms and Architectures. IEEE Access 2019, 7, 53040–53065. [Google Scholar] [CrossRef]
- Carbonell-Rivera, J.P.; Estornell, J.; Ruiz, L.Á.; Crespo-Peremarch, P.; Almonacid-Caballer, J.; Torralba, J. Class3Dp: A Supervised Classifier of Vegetation Species from Point Clouds. Environ. Model. Softw. 2024, 171, 105859. [Google Scholar] [CrossRef]
- Pacheco, D.; Ávila, L. Inventario de Parques y Jardines de La Ciudad de Cuenca Con UAV y Smartphones. In Proceedings of the XVI Conferencia de Sistemas de Información Geográfica, Cuenca, Ecuador, 27–29 September 2017; pp. 173–179. [Google Scholar]
- Universidad del Azuay Dashboard Inventario Forestal Cuenca. Available online: https://gis.uazuay.edu.ec/herramientas/iforestal-dashboard/ (accessed on 12 April 2025).
- Song, X.; Wu, F.; Lu, X.; Yang, T.; Ju, C.; Sun, C.; Liu, T. The Classification of Farming Progress in Rice–Wheat Rotation Fields Based on UAV RGB Images and the Regional Mean Model. Agriculture 2022, 12, 124. [Google Scholar] [CrossRef]
- Zhang, X.; Zhang, F.; Qi, Y.; Deng, L.; Wang, X.; Yang, S. New Research Methods for Vegetation Information Extraction Based on Visible Light Remote Sensing Images from an Unmanned Aerial Vehicle (UAV). Int. J. Appl. Earth Obs. Geoinf. 2019, 78, 215–226. [Google Scholar] [CrossRef]
- Gerón, A. Hands-On Machine Learning with Scikit-Learn, Keras & Tensorflow, 2nd ed.; O’Reilly Media: Sebastopol, CA, USA, 2019; ISBN 9781492032649. [Google Scholar]
- Wang, D.; Wan, B.; Qiu, P.; Su, Y.; Guo, Q.; Wang, R.; Sun, F.; Wu, X. Evaluating the Performance of Sentinel-2, Landsat 8 and Pléiades-1 in Mapping Mangrove Extent and Species. Remote Sens. 2018, 10, 1468. [Google Scholar] [CrossRef]
- Zheng, H.; Sherazi, S.W.A.; Son, S.H.; Lee, J.Y. A Deep Convolutional Neural Network-based Multi-class Image Classification for Automatic Wafer Map Failure Recognition in Semiconductor Manufacturing. Appl. Sci. 2021, 11, 9769. [Google Scholar] [CrossRef]
- Sklearn.Metrics.Cohen_Kappa_Score—Scikit-Learn 1.2.1 Documentation. Available online: https://scikit-learn.org/stable/modules/generated/sklearn.metrics.cohen_kappa_score.html (accessed on 1 January 2023).
- Qi, C.R.; Su, H.; Mo, K.; Guibas, L.J. PointNet: Deep Learning on Point Sets for 3D Classification and Segmentation. In Proceedings of the 2017 IEEE Conference on Computer Vision and Pattern Recognition (CVPR), Honolulu, HI, USA, 21–26 July 2017. [Google Scholar]
- García-García, A.; Gómez-Donoso, F.; García-Rodríguez, J.; Orts-Escolano, S.; Cazorla, M.; Azorin-López, J. Pointnet: A 3d Convolutional Neural Network for Real-Time Object Class Recognition. In Proceedings of the 2016 International Joint Conference on Neural Networks (IJCNN), Vancouver, BC, Canada, 24–29 July 2016; pp. 1578–1584. [Google Scholar]
- Hong, Q.; Ge, Z.; Wang, X.; Li, Y.; Xia, X.; Chen, Y. Measuring Canopy Morphology of Saltmarsh Plant Patches Using UAV-Based LiDAR Data. Front. Mar. Sci. 2024, 11, 1378687. [Google Scholar] [CrossRef]
- Man, Q.; Yang, X.; Liu, H.; Zhang, B.; Dong, P.; Wu, J.; Liu, C.; Han, C.; Zhou, C.; Tan, Z.; et al. Comparison of UAV-Based LiDAR and Photogrammetric Point Cloud for Individual Tree Species Classification of Urban Areas. Remote Sens. 2025, 17, 1212. [Google Scholar] [CrossRef]
- Pu, L.; Xv, J.; Deng, F. An Automatic Method for Tree Species Point Cloud Segmentation Based on Deep Learning. J. Indian. Soc. Remote Sens. 2021, 49, 2163–2172. [Google Scholar] [CrossRef]
- Guzmán-Salinas, N.; Jiménez-Pesántez, M.; Minga-Ochoa, D.; Delgado-Inga, O.; Martínez, E. Árboles Urbanos de Cuenca; Casa Editora de la Universidad del Azuay: Cuenca, Ecuador, 2023; ISBN 9789942645180. [Google Scholar]
- Glenn, D.M.; Tabb, A. Evaluation of Five Methods to Measure Normalized Difference Vegetation Index (NDVI) in Apple and Citrus. Int. J. Fruit. Sci. 2019, 19, 191–210. [Google Scholar] [CrossRef]
- Gitelson, A.; Viña, A.; Inoue, Y.; Arkebauer, T.; Schlemmer, M.; Schepers, J. Uncertainty in the Evaluation of Photosynthetic Canopy Traits Using the Green Leaf Area Index. Agric. Meteorol. 2022, 320, 108955. [Google Scholar] [CrossRef]


| Sensor Model | Focal Length (mm) | Maximum Opening |
|---|---|---|
| DJI FC300X | 4 | 2 |
| Parrot Anafi | 4 | - |
| DJI FC6510 | 9 | 2.97 |
| DJI FC6310 | 9 | 2.97 |
| DJI FC6310S | 9 | 2.97 |
| Double 4k/Sony Exmor R IMX377 | 5.4 | - |
| Class | TIC Photography | Zenithal View | Front View |
|---|---|---|---|
| Acacia dealbata Link Code: 089ADE0002 Date: 2019-10-14 Crown Diameter: 8 m Height: 10 m Fuste height: 1.5 m DBH: 35 cm Origin: Introduced |  |  | 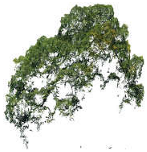 |
| Populus alba L. Code: 033PAL0001 Date: 2017-10-01 Crown Diameter: 5 m Height: 6 m Fuste height: 3.3 m DBH: 30 cm Origin: Introduced | 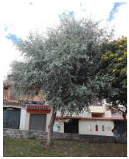 |  |  |
| Melaleuca armillaris (Sol. ex Gaertn.) Sm. Code: 065CPI0004 Date: 2018-12-19 Crown Diameter: 3 m Height: 4 m Fuste height: 1.8 m DBH: 17 cm Origin: Introduced | 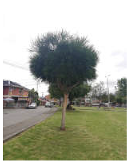 | 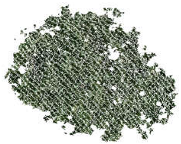 |  |
| Tecoma stans (L.) Juss. ex Kunth Code: 087TST0002 Date: 2019-05-02 Crown Diameter: 5 m Height: 5 m Fuste height: 1.7 m DBH: 10 cm Origin: Native | 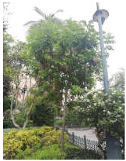 | 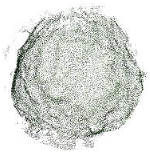 | 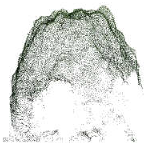 |
| Jacaranda mimosifolia D. Don Code: 123JMI0003 Date: 2022-04-13 Crown Diameter: 5 m Height: 5 m Fuste height: 2 m DBH: 24 cm Origin: Introduced |  | 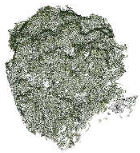 | 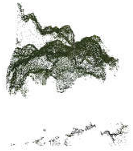 |
| Schinus molle L. Code: 065SMO0001 Date: 2018-12-19 Crown Diameter: 6 m Height: 4.5 m Fuste height: 1.3 m DBH: 38 cm Origin: Introduced | 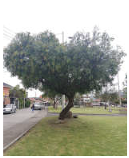 | 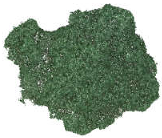 |  |
| Salix humboldtiana Willd. Code: 055SHU0001 Date: 2018-09-21 Crown Diameter: 7 m Height: 12.6 m Fuste height: 2.2 m DBH: 66 cm Origin: Native |  |  |  |
| Fraxinus excelsior L. Code: 065FEX0014 Date: 2018-12-20 Crown Diameter: 12 m Height: 12 m Fuste height: 3 m DBH: 38 cm Origin: Introduced | 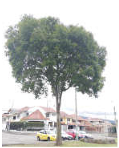 |  | 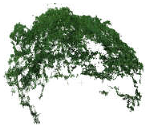 |
| Index | Name | Description/Equation | N |
|---|---|---|---|
| RGB | Red/Green/Blue | Red, green, and blue channels (normalized 0–1) | 12 |
| Intensity | Calculated from RGB colors | 0.21 red + 0.72 green + 0.07 blue | 4 |
| NRBDI | Normalized red–blue difference index [53,69] | (red − blue)/(red + blue) | 4 |
| NGRDI | Normal green–red difference index [37] | (green − red)/(green + red) | 4 |
| GR | Green/red ratio [53] | Green/red | 4 |
| BI | Brightness [53] | green + red + blue | 4 |
| GLI | Green Leaf Index [70] | (2 × green − red − blue)/(2 × green + red + blue) | 4 |
| Name | Description | N | Location |
|---|---|---|---|
| Points number | Number of points at tree level | 1 | Tree sections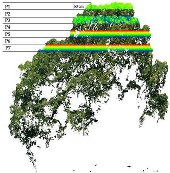 |
| Points density | Number of points per m2 (normalized by class) | 1 | |
| Height Max/Mean | Based on Z normalized coordinate, the maximum and mean value were obtained | 2 | |
| Percentile height | The percentiles of the canopy height distribution (10th, 50th, 90th) in the variables zp10, zp50 y zp90 [27] | 3 | |
| Area tree | Area of the polygon formed by the convex hull of the tree’s point cloud. | 1 | |
| Tree Perimeter | Perimeter of the polygon formed by the convex hull of the tree’s point cloud. | 1 | |
| Tree Volume | Volume of the tree estimated from its point cloud. | 1 | |
| P1-P7 | The perimeter, area, volume, and shape are calculated from the polygon/object formed by the points filtered from the crown down to 0.5 m (P1–P7). This process is repeated, lowering the filtering range incrementally, so that in the final segment, the points between 3 and 3.5 m (P7) below the crown are included. If the tree’s height does not allow for this calculation, a value of 0 is assigned. | 28 |
| Scientific Name | Code | Training | Test | Total |
|---|---|---|---|---|
| Acacia dealbata Link | ADE | 83 | 35 | 118 |
| Populus alba L. | PAL | 60 | 26 | 86 |
| Melaleuca armillaris (Sol. ex Gaertn.) Sm. | CPI | 91 | 39 | 130 |
| Tecoma stans (L.) Juss. ex Kunth | TST | 52 | 22 | 74 |
| Jacaranda mimosifolia D. Don | JMI | 44 | 19 | 63 |
| Schinus molle L. | SMO | 46 | 19 | 65 |
| Salix humboldtiana Willd. | SHU | 89 | 38 | 127 |
| Fraxinus excelsior L. | FEX | 102 | 44 | 146 |
| Hyperparameter | Description | Value |
|---|---|---|
| NUM_POINT | Number of points by tree | 1024, 2048, 3072, 4096, 5120 |
| NUM_CATEGORY | Number of classes | 8 |
| BATCH SIZE | Number of batches in each epoch | 32, 64, 96, 128 |
| EPOCHS | Number of times to the entire training dataset | 20, 50, 100, 200 |
| OPTIMIZER | Algorithm that determines how parameters are updated. | Adam |
| LEARNING RATE | Step size of parameter updates in each iteration | 0.001 |
| Predicted | Report | ||||||||||||
|---|---|---|---|---|---|---|---|---|---|---|---|---|---|
| ADE | PAL | CPI | TST | JMI | SMO | SHU | FEX | Precision | Recall | F1 | N | ||
| Reference | ADE | 25 | 4 | 2 | 0 | 1 | 1 | 0 | 2 | 0.68 | 0.71 | 0.69 | 35 |
| PAL | 3 | 23 | 0 | 0 | 0 | 0 | 0 | 0 | 0.77 | 0.88 | 0.82 | 26 | |
| CPI | 1 | 0 | 35 | 2 | 1 | 0 | 0 | 0 | 0.73 | 0.90 | 0.80 | 39 | |
| TST | 1 | 1 | 0 | 13 | 0 | 1 | 4 | 2 | 0.65 | 0.59 | 0.62 | 22 | |
| JMI | 3 | 0 | 1 | 1 | 7 | 2 | 4 | 1 | 0.58 | 0.37 | 0.45 | 19 | |
| SMO | 2 | 1 | 7 | 1 | 2 | 6 | 0 | 0 | 0.50 | 0.32 | 0.39 | 19 | |
| SHU | 0 | 0 | 1 | 1 | 0 | 1 | 31 | 4 | 0.69 | 0.82 | 0.75 | 38 | |
| FEX | 2 | 1 | 2 | 2 | 1 | 1 | 6 | 29 | 0.76 | 0.66 | 0.71 | 44 | |
| Epochs | 20 | 50 | 100 | 200 | |||||||||||||
|---|---|---|---|---|---|---|---|---|---|---|---|---|---|---|---|---|---|
| Points/BS | 32 | 64 | 96 | 128 | 32 | 64 | 96 | 128 | 32 | 64 | 96 | 128 | 32 | 64 | 96 | 128 | |
| PointNet | 5120 | 0.37 | 0.46 | 0.43 | 0.44 | 0.48 | 0.52 | 0.57 | 0.53 | 0.55 | 0.60 | 0.49 | 0.60 | 0.59 | 0.60 | 0.55 | 0.56 |
| 4096 | 0.45 | 0.54 | 0.54 | 0.47 | 0.46 | 0.49 | 0.53 | 0.55 | 0.54 | 0.58 | 0.62 | 0.61 | 0.44 | 0.57 | 0.61 | 0.61 | |
| 3072 | 0.47 | 0.46 | 0.44 | 0.48 | 0.56 | 0.61 | 0.49 | 0.50 | 0.52 | 0.56 | 0.51 | 0.59 | 0.59 | 0.55 | 0.58 | 0.57 | |
| 2048 | 0.38 | 0.45 | 0.50 | 0.47 | 0.53 | 0.54 | 0.49 | 0.53 | 0.45 | 0.57 | 0.56 | 0.51 | 0.46 | 0.59 | 0.59 | 0.56 | |
| 1024 | 0.45 | 0.50 | 0.45 | 0.52 | 0.43 | 0.57 | 0.50 | 0.57 | 0.48 | 0.51 | 0.54 | 0.55 | 0.54 | 0.54 | 0.57 | 0.51 | |
| PointNet++ | 5120 | 0.41 | 0.49 | 0.41 | 0.41 | 0.49 | 0.50 | 0.49 | 0.52 | 0.47 | 0.55 | 0.53 | 0.53 | 0.58 | 0.58 | 0.55 | 0.59 |
| 4096 | 0.26 | 0.42 | 0.45 | 0.42 | 0.47 | 0.50 | 0.55 | 0.48 | 0.54 | 0.53 | 0.57 | 0.52 | 0.62 | 0.59 | 0.63 | 0.61 | |
| 3072 | 0.47 | 0.47 | 0.41 | 0.50 | 0.52 | 0.60 | 0.42 | 0.60 | 0.61 | 0.58 | 0.55 | 0.63 | 0.56 | 0.56 | 0.55 | 0.64 | |
| 2048 | 0.32 | 0.42 | 0.46 | 0.43 | 0.47 | 0.57 | 0.49 | 0.45 | 0.55 | 0.57 | 0.59 | 0.55 | 0.44 | 0.61 | 0.54 | 0.59 | |
| 1024 | 0.36 | 0.47 | 0.48 | 0.49 | 0.49 | 0.51 | 0.53 | 0.47 | 0.50 | 0.53 | 0.52 | 0.55 | 0.54 | 0.59 | 0.56 | 0.53 | |
| Predicted | Report | |||||||||||||
|---|---|---|---|---|---|---|---|---|---|---|---|---|---|---|
| ADE | PAL | CPI | TST | JMI | SMO | SHU | FEX | Precision | Recall | F1 | N | |||
| Reference | PointNet | ADE | 13 | 5 | 0 | 2 | 4 | 1 | 1 | 2 | 0.72 | 0.46 | 0.57 | 28 |
| PAL | 1 | 19 | 2 | 0 | 1 | 1 | 0 | 0 | 0.68 | 0.79 | 0.73 | 24 | ||
| CPI | 1 | 0 | 28 | 0 | 3 | 0 | 2 | 0 | 0.85 | 0.82 | 0.84 | 34 | ||
| TST | 0 | 0 | 1 | 6 | 4 | 0 | 2 | 2 | 0.43 | 0.40 | 0.41 | 15 | ||
| JMI | 0 | 1 | 1 | 2 | 7 | 0 | 1 | 0 | 0.23 | 0.58 | 0.33 | 12 | ||
| SMO | 1 | 1 | 0 | 1 | 1 | 8 | 1 | 1 | 0.73 | 0.57 | 0.64 | 14 | ||
| SHU | 0 | 1 | 0 | 1 | 6 | 0 | 25 | 2 | 0.62 | 0.71 | 0.67 | 35 | ||
| FEX | 2 | 1 | 1 | 2 | 5 | 1 | 8 | 19 | 0.73 | 0.49 | 0.58 | 39 | ||
| PointNet++ | ADE | 21 | 3 | 0 | 1 | 1 | 2 | 3 | 1 | 0.64 | 0.66 | 0.65 | 32 | |
| PAL | 1 | 22 | 0 | 1 | 0 | 1 | 0 | 0 | 0.81 | 0.88 | 0.85 | 25 | ||
| CPI | 1 | 1 | 27 | 2 | 0 | 2 | 0 | 3 | 0.75 | 0.75 | 0.75 | 36 | ||
| TST | 2 | 0 | 1 | 8 | 1 | 0 | 2 | 1 | 0.38 | 0.53 | 0.44 | 15 | ||
| JMI | 3 | 0 | 1 | 2 | 5 | 0 | 2 | 1 | 0.42 | 0.36 | 0.38 | 14 | ||
| SMO | 2 | 0 | 3 | 1 | 3 | 6 | 1 | 0 | 0.46 | 0.38 | 0.41 | 16 | ||
| SHU | 0 | 0 | 2 | 4 | 0 | 0 | 26 | 5 | 0.65 | 0.70 | 0.68 | 37 | ||
| FEX | 3 | 1 | 2 | 2 | 2 | 2 | 6 | 23 | 0.68 | 0.56 | 0.61 | 41 | ||
Disclaimer/Publisher’s Note: The statements, opinions and data contained in all publications are solely those of the individual author(s) and contributor(s) and not of MDPI and/or the editor(s). MDPI and/or the editor(s) disclaim responsibility for any injury to people or property resulting from any ideas, methods, instructions or products referred to in the content. |
© 2025 by the authors. Licensee MDPI, Basel, Switzerland. This article is an open access article distributed under the terms and conditions of the Creative Commons Attribution (CC BY) license (https://creativecommons.org/licenses/by/4.0/).
Share and Cite
Pacheco-Prado, D.; Bravo-López, E.; Martínez, E.; Ruiz, L.Á. Urban Tree Species Identification Based on Crown RGB Point Clouds Using Random Forest and PointNet. Remote Sens. 2025, 17, 1863. https://doi.org/10.3390/rs17111863
Pacheco-Prado D, Bravo-López E, Martínez E, Ruiz LÁ. Urban Tree Species Identification Based on Crown RGB Point Clouds Using Random Forest and PointNet. Remote Sensing. 2025; 17(11):1863. https://doi.org/10.3390/rs17111863
Chicago/Turabian StylePacheco-Prado, Diego, Esteban Bravo-López, Emanuel Martínez, and Luis Á. Ruiz. 2025. "Urban Tree Species Identification Based on Crown RGB Point Clouds Using Random Forest and PointNet" Remote Sensing 17, no. 11: 1863. https://doi.org/10.3390/rs17111863
APA StylePacheco-Prado, D., Bravo-López, E., Martínez, E., & Ruiz, L. Á. (2025). Urban Tree Species Identification Based on Crown RGB Point Clouds Using Random Forest and PointNet. Remote Sensing, 17(11), 1863. https://doi.org/10.3390/rs17111863