Abstract
Rayleigh lidar equipped on airborne floating platforms has received increasing attention in recent years due to the demand for exploring the middle atmosphere. However, the inevitable attitude fluctuation of the platform affects the measurement accuracy of the photon profile, which greatly affects temperature retrieval. Here, an extensive theoretical analysis model of geometrical transformations between the actual altitude and detection distance under attitude fluctuations was constructed by taking pitch, roll, and observation angles into consideration. Based on this model and measured attitude angles, the influence of platform fluctuation on lidar measurement was analyzed by calculating the deviations between temperature retrieval results and the NRLMSISE-00 model at different observation angles, which demonstrated that the altitude displacement from the variation of pitch angle is a crucial factor in causing temperature retrieval error, especially at large observation angles. Then, an attitude compensation method was designed to eliminate the impact of fluctuations, incorporating the merits of good robustness. Under the observation angle of 45° and average pitch angle of around 4°, the maximum temperature deviation after attitude compensation was reduced from 21.29 K to 0.366 K, a reduction of around two orders of magnitude, indicating that the method can significantly improve the measurement accuracy of Rayleigh lidar.
1. Introduction
Lidar is a versatile technique to measure various atmospheric properties, e.g., clouds, aerosols, relative humidity, wind field, density, and temperature [1]. Rayleigh lidar, which is based on the mechanism of elastic Rayleigh scattering between light and atmospheric molecules, provides a robust approach to characterizing the middle atmosphere over 30 km altitude where the effect of aerosols is negligible [2,3,4,5,6,7,8,9,10,11,12,13,14,15,16,17]. Rayleigh lidar has high spatial and temporal resolution, high signal-to-noise ratio (SNR), and long detection distance, and is independent of atmospheric composition in detecting density, temperature, etc. [18]. At present, Rayleigh lidar equipped on different platforms is playing an increasingly important role in studying the middle atmosphere to meet the significant demand in military, climatology, and weather prediction.
Ground-based Rayleigh lidar is currently the most widely used form and enables high-resolution observations. Examples include the Arctic Lidar for Middle Atmosphere Research (ALOMAR) in Norway [13], the operational ground-based lidars of the observatories at the Maïdo observatory, La Reunion [14,15], and the Compact Rayleigh Autonomous Lidar (CORAL) in Tierra del Fuego, Argentina [16]. The study on lidar atmospheric sounding in China started later, but with huge efforts, several Rayleigh lidars have been built and are now operating in Hefei, Beijing, Wuhan, etc. [2,5]. In addition, the National Space Science Center of the Chinese Academy of Sciences conducted vehicle-mounted Rayleigh Doppler lidar experiments in 2016, which showed the capability of rapid transfer among observation sites [4,11,12]. However, to overcome long detection distance, large optical attenuation, and strong background noise, high-energy laser, large-aperture telescope, narrow-linewidth molecular filter, etc., are necessary to obtain high-SNR echo signals for the ground-based lidar, which leads to high complexity and great cost. Besides, ground-based lidar cannot realize round-the-clock observations because of weather issues.
In addition to enhancing the laser power and aperture of the receiving telescope, another effective option to boost the lidar return signal is to shorten the distance between the lidar and the target area. It can be realized by lidar equipped on floating platforms since the light attenuation in the troposphere is greatly reduced. The Balloon Lidar Experiment (BOLIDE) has demonstrated the advantage of better data quality compared to ground-based instruments of the same size [10]. The powerful Airborne LIdar for Middle Atmosphere research (ALIMA) instrument onboard the German High Altitude and LOng range (HALO) research aircraft has been in operation since September 2019 [17]. Such facilities also offer the possibility of flexible atmospheric detection in a large area and overcome the defects of weather-sensitive ground-based lidar to guarantee continuous monitoring. However, compared with the ground-based lidar, fluctuations of the floating platforms originating from complicated dynamic disturbances in the atmosphere lead to unstable directions of the laser beam. Such fluctuation-induced pointing instability should be considered to ensure the accuracy of the retrieval procedure.
The density and temperature retrieval method for Rayleigh lidar was proposed by Hauchecorne and Chanin [19]. This method sets the initial seed value at the top of the detection range and integrates the relative density profile downward to obtain the temperature profile in terms of the static equilibrium equation and the ideal gas state equation. It has been pointed out that the deviation derived from the top seeding temperature varies the entire temperature profile, and the variation decreases with height. Knobloch et al. [20] synthetically evaluated the deviations of retrieval results caused by the attenuation from Rayleigh extinction, ozone absorption, background noise, signal-induced photon noise, and nonlinearity of the photon-counting detectors, but the platform fluctuation was not mentioned. To the best of our knowledge, the only literature that incorporated platform instability was in [21], which discussed the temperature measurement accuracy at different roll angles of a ship platform. It should be mentioned that the oscillation model of Rayleigh lidar was simplified into a sinusoidal function for convenience, and considering the roll angle only is insufficient for floating platforms since the fluctuation of pitch angle tends to be more pronounced. According to [22], continuous variation of the heading angle results in circular rotation of the laser beam in the horizontal plane. Ideally, this rotation does not produce changes in atmospheric density in the laser beam path, so the impact of the heading angle can be ignored.
This paper focuses on analyzing the deviation of temperature retrieval generated by the laser beam-pointing uncertainty based on airborne floating platforms. A comprehensive model between the actual altitude and the detection distance was constructed by taking the pitch angle, roll angle, and observation angle into consideration simultaneously. The vertical displacement due to attitude change was theoretically analyzed from both the aspects of single-pulse signal and integrated photon number profile. By adopting attitude angle data of a flight test, the measurement accuracy was evaluated by comparing the retrieved temperature with the NRLMSISE-00 model. To eliminate the influence of both the roll and pitch fluctuations, an attitude compensation method was proposed and the effectiveness was verified under different observation angles, integration time, and attitude data.
2. Materials and Methods
2.1. Rayleigh Lidar Equation
Given the integration time Δt and pulse repetition frequency frep, the photon count profiles under a certain number of laser pulses can be expressed as follows:
where NR(λ, R) is the number of received photons at wavelength λ from the detection distance R, E is the pulse energy, h is Planck’s constant, and c is the light speed. The laser beam encounters scattering and absorption by molecules during atmospheric propagation. The Rayleigh backscattering cross-section is σ180(λ, R) = 6.16 × 10⁻³² m−2 [20], n(z, R) is the number density of atmospheric molecules and ΔR is the range resolution. The number of received photons depends on the solid angle of the receiving telescope with the aperture of A. Additionally, the total optical attenuation is determined by the system parameters and atmospheric transmission, where η(λ) is the quantum efficiency of the single-photon detector, Tt and Tr are the optical efficiencies of the transmitter and receiver, respectively, T(λ, R) is the single-pass atmospheric transmittance, and G(R) is the geometric overlap factor. Since Rayleigh scattering is elastic, the double-pass transmission coefficient can be simplified to the square of a single-pass one [23]. Besides, it is assumed that the transmitter and receiver of the lidar is coaxial in this paper, therefore, G(R) is equal to 1. Table 1 lists the simulation parameters of the lidar system.

Table 1.
Simulation parameters of lidar system.
Considering that the physical quantities is dependent on the pointing angle, Equation (1) can be rewritten as [21]:
where NR(λ, z) is the number of received photons at the actual altitude z, ρ(z, R) is the atmospheric density, and C indicates the angle-independent physical quantities. The actual observation angle of lidar varies with the oscillation of the platform, which results in variation of atmospheric density along the laser beam path, and consequently, NR(λ, z) changes. The relationship between z and R will be described in Section 2.2.
2.2. General Fluctuation Model
When a lidar mounted on an airborne floating platform is conducting atmospheric exploration, the attitude and spatial position of the lidar are affected by external excitation disturbances such as wind and atmospheric turbulence. In order to describe the spatial position and motion state of the lidar, we build the carrier coordinate system (o-xbybzb) and geographic coordinate system (o-xgygzg), and their relative relationship is shown in Figure 1.
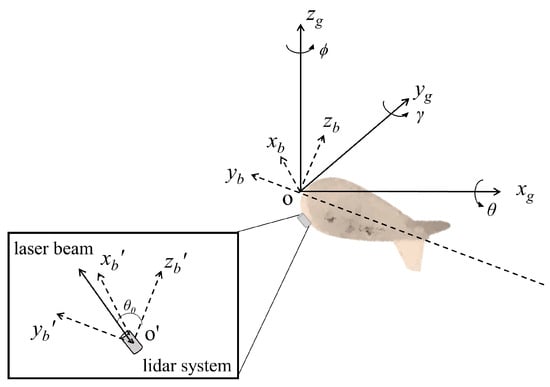
Figure 1.
Coordinate systems for the floating platform and related motion parameters.
The origins of both coordinate systems coincide with the gravity center of the carrier. oxb is positive to the right along the horizontal axis of the carrier, oyb is positive to the front along the vertical axis of the carrier, and ozb is perpendicular to the vertical axis of the carrier and it is positive to up. The o-xgyg plane is parallel to the ground level, where oxg is horizontal and points east, oyg is horizontal and points north, and ozg points towards the zenith. The angular position of the carrier coordinate system relative to the geographic coordinate system, including heading angle (ϕ), pitch angle (θ), and roll angle (γ), can be used to represent the carrier attitude. The geographic coordinate system can rotate in three dimensions in the order of ϕ (around ozg) → θ (around oxg) → γ (around oyg), and then coincides with the carrier coordinate system. Similarly, the backward process (−γ → −θ → −ϕ) can realize the conversion from carrier coordinate system to geographic coordinate system. The relationship between the two coordinate systems is as follows:
where is the transformation matrix from the carrier coordinate system to the geographic coordinate system, which is expressed as follows:
The change in heading angle only involves a circular rotation of the laser beam in the horizontal plane but does not affect the vertical parameters. Next, the heading angle is set to zero, and the simplified equation can be obtained as follows:
Considering the observation angle, a lidar polar coordinate system is designed based on the lidar coordinate system o-xb′yb′zb′, as shown in Figure 2. The line-of-sight distance, azimuth, and zenith angles of the target are represented by R, α, and θ0, respectively. It is worth noting that there is a translation transformation between the lidar coordinate system o-xb′yb′zb′ and the carrier coordinate system o-xbybzb because of rigid connection, as shown in Figure 1. The displacement can be ignored since it is much smaller than the range resolution, and then the following equation is obtained:
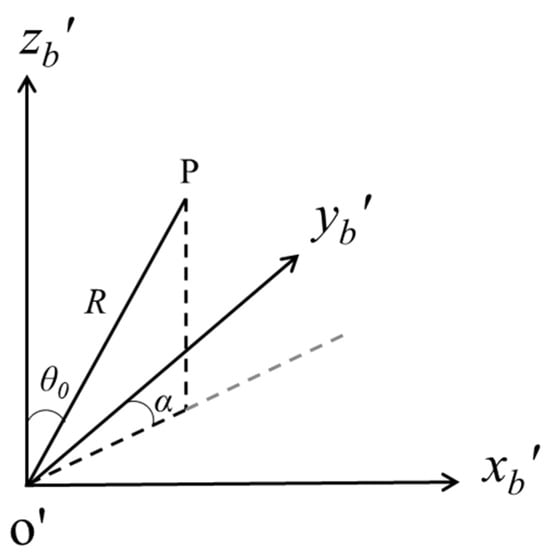
Figure 2.
Display of lidar polar coordinate system.
Through Equations (5) and (6), the relationship between the altitude z and R is given by the following:
Considering a special mounting method that θ0 is always in the yb-o-zb plane, α is always zero, and θ0 is the observation angle, Equation (7) can be simplified into the following:
According to Equation (8), the laser beam path varies at different pointing angles. Under the condition that θ0 = 0° and only θ or γ is concerned, the schematic diagram is shown in Figure 3a. Without platform fluctuation, the lidar points to the vertical direction, the altitude z is equal to the recorded distance R, and the atmospheric density along the beam path is ρ(O)~ρ(Q). If the platform fluctuation is only related to pitch angle or roll angle, the geometric path is formulated as z = Rcosθ or z = Rcosγ. That is, the lidar pointing changes to the direction of OP or OP’. The positive and negative nature of the angle does not affect atmospheric density detection since ρ(P) = ρ(P′). Correspondingly, the density in the altitude scale changes from ρ(O)~ρ(Q) to ρ(O)~ρ(N). It is noteworthy that ρ(Q) is not equal to ρ(N) because the atmospheric density decreases as the altitude increases, which affects the subsequent temperature retrieval.
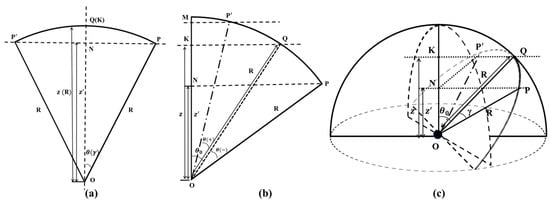
Figure 3.
The schematic diagram of lidar pointing. (a) θ0 = 0°, only θ or γ is considered; (b) θ0 ≠ 0°, γ = 0°; (c) θ0 ≠ 0°, θ = 0°.
Suppose that θ0 ≠ 0° and only θ is considered, the pointing of the lidar is shown in Figure 3b. If the platform does not fluctuate, the lidar points to an angle of θ0 from the vertical direction, the altitude of z equals Rcosθ0, and the atmospheric density along the transmission path is ρ(O)~ρ(K). When the platform fluctuates, the lidar points to OP or OP’, the actual altitude is z = Rcos(θ0−θ), and the corresponding density in altitude scale changes to ρ(O)~ρ(M) or ρ(O)~ρ(N). Under the condition that θ0 ≠ 0° and θ = 0°, the pointing of lidar is shown in Figure 3c. The lidar also points to an angle of θ0 from the vertical direction if the platform does not fluctuate. Otherwise, the lidar pointing changes to OP or OP′, the actual altitude is calculated by z = Rcosθ0cosγ, and the corresponding density in altitude scale changes to ρ(O)~ρ(N). Similarly, a bias is introduced to temperature retrieval.
2.3. Temperature Retrieval
The temperature profile is retrieved from the density profile by substituting the ideal gas law (Equation (9)) into hydrostatic equilibrium (Equation (10)).
where g is the acceleration of gravity, Rd is the gas constant of dry air, and T is the atmospheric temperature at altitude z.
By choosing the reference altitude z0 (generally the upper limit of the detection altitude), the temperature T(z) at altitude z can be obtained by integrating from z to z0.
where ρz0 and Tz0 are the atmospheric density and atmospheric temperature at the reference altitude, respectively.
To evaluate the influence of laser pointing variation on temperature retrieval results, the lidar signal is simulated based on the atmospheric density acquired from the NRLMSISE-00 model [24]. The lidar attitude angle is required to accomplish angle conversion and obtain the corresponding atmospheric density profiles. According to Equation (1), the photon profile incorporating a certain number of laser pulses can be taken as input to produce the atmospheric temperature profile. By comparing the retrieval result with the NRLMSISE-00 model, the temperature deviation caused by platform oscillation is calculated.
2.4. Attitude Compensation
The real-time measurement of platform attitude enabled by an in-situ navigation device lays the foundation of attitude compensation. The procedure is shown in Figure 4. Firstly, the measured attitude-angle data is selected according to integration time, and the abnormal angles are eliminated twice by the Interquartile Range method (IQR) [25]. Then, the interval between the maximum angle and minimum angle in the processed data is judged to ensure that the attitude data after removing the abnormality is concentrated. Considering that a small interval criterion will greatly reduce the amount of data, and a large one will affect the accuracy of attitude compensation, a compromised value of 1° is adopted in this paper. If the interval is larger than 1°, the selected set of measured angles is in the stage of large oscillation, which is supposed to be deserted and chosen again. Otherwise, the actual observations can be approximated by the sum of average attitude angle and jitter. It should be noted that jitter is the difference between two adjacent data points of the recorded attitude angle, which can be ignored after the abnormalities are eliminated. Therefore, the actual observations can be further replaced by the average attitude angle, and substituting into Equation (8) gives the actual vertical altitude. At this point, the attitude compensation is achieved by applying the actual altitude for density and temperature retrieval.
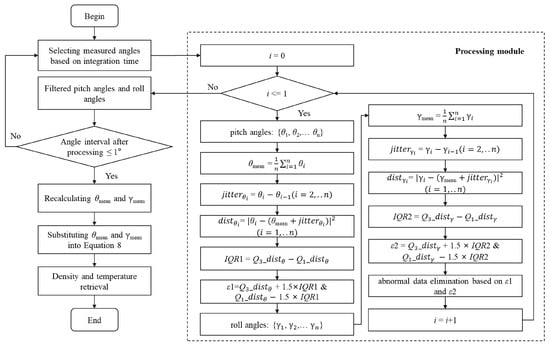
Figure 4.
Scheme of attitude compensation.
3. Results
3.1. Theoretical Analysis of the Effects of Attitude Fluctuation
3.1.1. Effect on Acquisition of Single-Pulse Echo Signal
The relative position of the transceiver equipped on a floating platform changes in both horizontal and vertical directions during laser transmission. Supposing that s = 70 km is the maximum detection distance and v = 10 m s−1 is the movement speed of the platform, the horizontal displacement of the transceiver is 2sv/c = 4.7 mm, which can be ignored compared with the telescope diameter of 350 mm. The vertical displacement can be calculated by this formula:
where V_θ0 indicates the vertical displacement, l = 2.5 m is the length of the lidar, and β is the maximum rate of attitude change of the platform, which is around 1.6°/min according to the measurement results.
As shown in Figure 5, with the increase of settled observation angle, the laser beam path becomes closer to the horizontal plane, and the vertical displacement caused by attitude change becomes larger. The maximum displacement is merely 0.543 μm. In terms of the field of view, it can be considered that the acquisition process of a single-pulse echo signal is not affected by the attitude fluctuation of the floating platform.
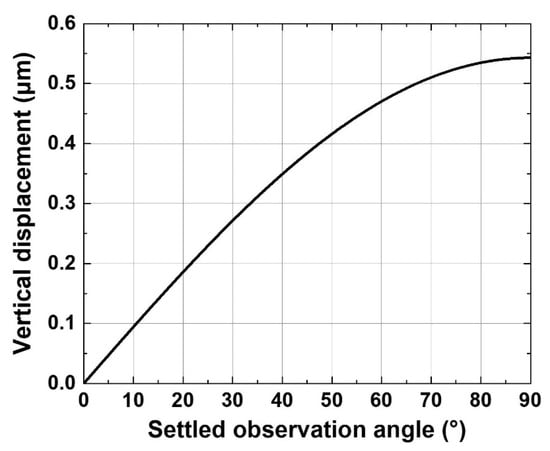
Figure 5.
Vertical displacement within the single-shot time under different settled observation angles.
3.1.2. Effect on Photon Number Profile within the Integration Time
Assuming the integration time Δt = 30 s, the vertical displacement within the detection distance can be expressed as follows:
where V(R, θ0) is the vertical displacement under observation angle θ0 and detection distance R.
The results are shown in Figure 6. Similarly, the vertical displacement becomes larger with the increase of settled observation angle, and it becomes more obvious at the far field of the detection range. The maximum vertical displacement caused by attitude fluctuation reaches 977.4 m at the maximum detection distance. This factor is critical to temperature retrieval accuracy and cannot be ignored.
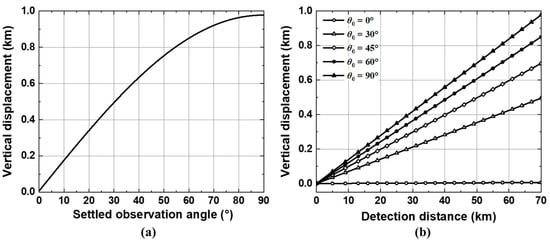
Figure 6.
Vertical displacement during the integration time. (a) Variation with settled observation angle at the detection distance of 70 km; (b) Variation with detection distance at five typical settled observation angles.
3.2. Verification Based on Measured Attitude Data
3.2.1. Data Description
The measured inertial navigation data of a floating platform was collected from 00:00 to 12:00 on 5 April 2022 (time resolution: 1.2 s) at 109.4825°E longitude and 19.1743°N latitude, as shown in Figure 7. According to Figure 7a, the platform reached stable operation at an altitude of 19 km. The data of pitch angle and roll angle during stable operation were adopted to analyze the temperature retrieval deviation caused by the fluctuation of the platform.
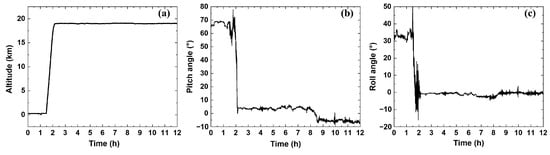
Figure 7.
Measured altitude and attitude data of the floating platform. (a) Inertial navigation altitude data from 00:00 to 12:00; (b) Pitch angle of the platform from 00:00 to 12:00; (c) Roll angle of the platform from 00:00 to 12:00.
3.2.2. Accuracy Check of Retrieval Results
When the settled observation angle is 0° and the platform does not oscillate, the retrieval results are shown in Figure 8. Figure 8a presents that the retrieval results consist of the model basically. In the altitude range of 30–45 km, the temperature increases gradually with altitude on account of the ozone absorption of UV radiation, while the temperature continuously decreases with altitude in the range of 45–70 km. It is worth noting that the positive or negative sign of the deviation in Figure 8b only represents the direction in which the retrieval results deviate from the model. The maximum and average deviations in the range of 30–60 km are 0.342 K and 0.099 K, respectively, by selecting the temperature of 70 km as a reference. The reason for the bias is that the average molecular molar mass is set to an empirical value of 28.9644 g mol−1 when using atmospheric density to retrieve atmospheric temperature. However, during modeling, the number density of each component was adjusted to realize a smooth transition from the mesosphere to the lower thermosphere [24], leading to a decrease in average molecular molar mass (less than the empirical value) above the altitude of 62.5 km. At the time of 23:30:00 on 1 May 2021 and the geographical location of 40.3°N latitude and 117.6°E longitude in the NRLMSISE-00 model, the average mass of the largest molecule at 70 km is reduced by 1.5‰ compared to that at 30 km [21,26]. In the altitude range of 30–70 km, the minimum and maximum temperatures of the model are 221.89 K and 274.12 K, respectively, corresponding to temperature deviations of 0.333 K and 0.411 K, respectively, under the ratio of 1.5‰. Therefore, the maximum temperature deviation in the retrieval results of 0.342 K is reasonable.
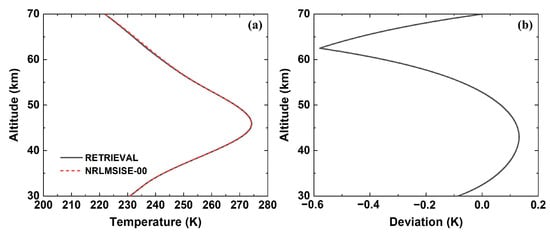
Figure 8.
Retrieval results when the observation angle is 0° and the platform does not oscillate. (a) Comparison with the NRLMSISE-00 model. (b) Corresponding deviations.
3.2.3. Deviation between the Retrieved Temperature and Model with Attitude Fluctuation
Suppose the integration time is 30 s, a set of measured pitch angles ( = 3.62°, σθ = 0.37°) and roll angles ( = −0.64°, σγ = 0.06°) is selected and substituted into Equation (8) to get the corresponding atmospheric density profiles, and then the photon number profiles are obtained. According to the retrieval algorithm, the combined photon number profile is taken as input, and the vertical altitude calculated from the settled observation angle without considering attitude fluctuation is adopted to generate the atmospheric temperature profile.
Figure 9 shows the comparison of temperature profiles between the retrieval results and the NRLMSISE-00 model at different observation angles. When the observation angle is 0°, the retrieved temperature is positively biased relative to the model, and the average and maximum deviations are 0.65 K and 0.76 K, respectively; When the observation angle is 30°, the retrieved temperature is negatively biased relative to the model, and the average and maximum deviations are 10.04 K and 12.47 K, respectively; When the observation angle is 45°, the retrieved temperature is also negatively biased relative to the model, and the average and maximum deviations are 17.39 K and 21.29 K, respectively. Hence, the larger the observation angle, the greater the deviation in retrieved temperature.
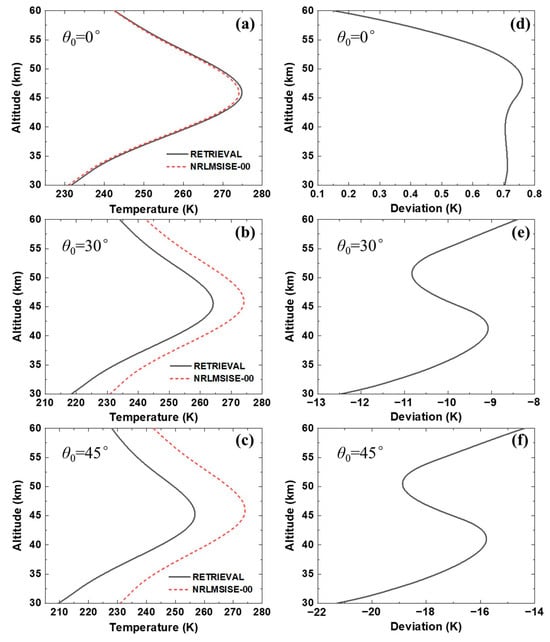
Figure 9.
Comparison of retrieved temperature and the NRLMSISE-00 model. (a–c) are the temperature profiles at θ0 = 0°, θ0 = 30°, and θ0 = 45°, and (d–f) are the deviations between the retrieved temperature and the NRLMSISE-00 model at θ0 = 0°, θ0 = 30°, and θ0 = 45°, respectively.
As shown in Figure 7b,c, the average pitch angle varies from −7.5° to 5.5° and the average roll angle varies from −3.5° to 2.5° under stable operation. Within the variation range of attitude angle, the temperature retrieval deviations of the altitude of 30 km at different pitch and roll angles are calculated, as shown in Figure 10. Horizontally, if the pitch and roll angles are fixed, the larger the observation and deviation angles in the retrieved temperature, which is consistent with the results in Figure 9. With a certain observation angle and roll angle for each subgraph, the temperature deviation rises with the increase of pitch angle. However, with a certain observation angle and pitch angle for each subgraph, the temperature deviation changes slightly with the variation of roll angle. When the observation angle is 45° in Figure 10c, the temperature deviation increases by about 17 K when the pitch angle changes from 0° to −3°, whereas the temperature deviation increases by about 0.7 K when the roll angle changes from 0° to −3°. Therefore, the altitude displacement from variations of pitch angle is a significant factor in causing temperature retrieval inaccuracy, especially at large observation angles.
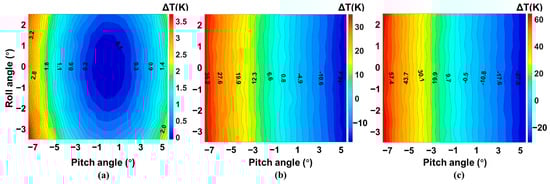
Figure 10.
Deviations in temperature retrieval with the average pitch angle varying from −7.5° to 5.5° and average roll angle varying from −3.5° to 2.5° at θ0 = 0° (a), θ0 = 30° (b), and θ0 = 45° (c).
Next, a deeper investigation is performed to study the effects of pitch angle on the temperature deviation according to the measured attitude angle, as shown in Figure 11. With a certain settled observation angle for each subgraph, the temperature deviation rises with the increase of pitch angle. When the observation angle is 0° in Figure 11a, the retrieved temperature is positively biased relative to the model and the maximum temperature deviation is less than 3 K. Here, the positive and negative nature of the angle does not affect the density. When the observation angle is 30° in Figure 11b, the sign of angle results in inequality in density, which consequently affects the deviation in temperature profiles. If the pitch angle is positive, the laser points towards the zenith direction, and the density is undervalued along the same beam path, leading to negative bias of the retrieved result relative to the model, and vice versa. The maximum temperature deviation reaches 35 K at the maximum average pitch angle of −7.5°. When the observation angle is 45° in Figure 11c, the temperature deviation increases with a larger pitch angle, and the maximum temperature deviation is up to 65 K.
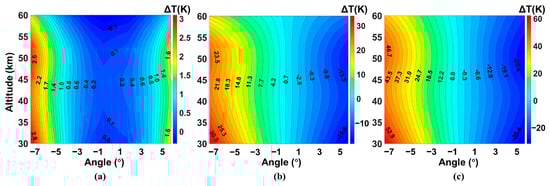
Figure 11.
Deviations in temperature retrieval with the average value of measured pitch angle varying from −7.5° to 5.5° at θ0 = 0° (a), θ0 = 30° (b), and θ0 = 45° (c).
3.2.4. Deviation between Retrieved Temperature and Model after Attitude Compensation
The attitude compensation method is described in Section 2.4. To avoid excessive reduction of data after eliminating the abnormal angles twice by the IQR method, the removal amount is controlled within 20% of the total. If more than five angles are abnormal data within the integration time of 30 s, the selected measurement data is considered to be at the stage of large fluctuation and data will be re-selected. After this process, the filtered pitch ( = 3.86°, σθ = 0.15°) and roll angles ( = −0.65°, σγ = 0.01°) are acquired. By substituting into Equations (1) and (8), the photon number profile is obtained. Taking the photon number profile as the input, the actual vertical altitude calculated via the average attitude angle is adopted to generate the atmospheric temperature profile. Figure 12 illustrates the consequence of attitude compensation for temperature retrieval results with observation angles of 0°, 30°, and 45°. From the vertical perspective, the effect of attitude compensation is remarkable. Among all three observation angles, the temperature deviations after attitude compensation are at the level of 0.1 K (maximum value: 0.366 K). Note that when the observation angle of the lidar is 0° and the platform does not oscillate, the maximum deviation is 0.342 K, as demonstrated in Section 3.2.2. The slight difference of 0.03 K is introduced after attitude compensation. Undoubtedly, this error is acceptable.
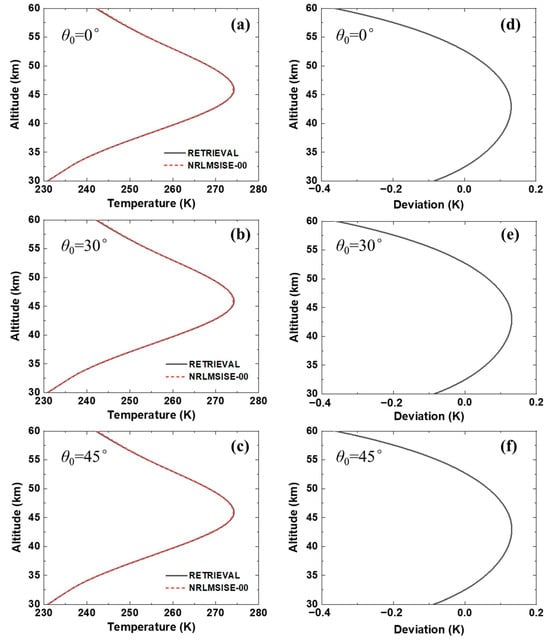
Figure 12.
Comparison of retrieved temperature after attitude compensation and the NRLMSISE-00 model. (a–c) are the temperature profiles at θ0 = 0°, θ0 = 30°, and θ0 = 45°, and (d–f) are the deviations between the retrieved temperature and the NRLMSISE-00 model at θ0 = 0°, θ0 = 30°, and θ0 = 45°, respectively.
4. Discussion
In the following context, the robustness of the attitude compensation method proposed in this paper is discussed. Firstly, the temperature deviations at θ0 = 45° under different integration times without attitude compensation were calculated. Taking the integration time of 30 s used in Figure 9 as a reference, the data of 60 s, 180 s, 300 s, and 600 s were intercepted again. Since the attitude changes under different integration times, the retrieval bias and the statistical attitude data are summarized in Table 2. The results show that without attitude compensation, there will be a large retrieval deviation no matter how long the integration time is, and the retrieval deviation will depend more on the pitch angle. By comparing Row 2 and Row 5 in Table 2, when the average pitch angle is constant, the larger the average roll angle, the larger the retrieval deviation. Then, the effect of attitude compensation was estimated at integration time periods from 30 s to 600 s and different average pitch angles of around 4° and 5°, respectively. The compensation method based on average attitude angle can effectively eliminate the influence of platform fluctuation on temperature retrieval, as shown in Figure 13a,b. After attitude compensation, the maximum deviation of the retrieved results was less than 0.38 K, and the average value was less than 0.11 K. Simultaneously, the standard deviations of the measured pitch angle under different integration times were calculated to analyze the relationship between the compensation results and the dispersion of the attitude data. For example, when the average pitch angle was about 4°, the standard deviation was 0.15°, 0.13°, 0.07°, 0.08°, and 0.14° under the integration time of 30 s, 60 s, 180 s, 300 s, and 600 s, respectively, which was consistent with the trend of retrieval deviation. The maximum deviations after attitude compensation can be effectively suppressed for attitude data with different dispersion. Therefore, the compensation method has good robustness to different integration times and is not sensitive to the dispersion of attitude data.
Table 2.
Retrieval deviation without attitude compensation and corresponding statistical magnitude under different integration times.
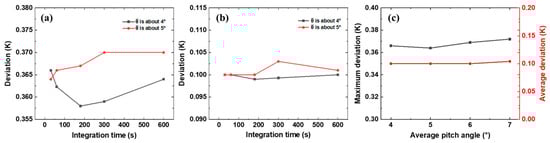
Figure 13.
Deviations between retrieved temperature and the NRLMSISE-00 model at θ0 = 45° after attitude compensation. (a) Maximum and (b) average deviations under different integration times when two average pitch angles of around 4° and 5° are considered. (c) The maximum and average deviations under different average pitch angles when integration time is 30 s, regardless of the sign of the angle.
Furthermore, to verify the robustness of different attitude data, the maximum and average deviations after attitude compensation at average pitch angles of 4°, 5°, −6°, and −7° were obtained as shown in Figure 13c. The positive or negative sign of the pitch angle only represents the direction of the laser change. If the pitch angle is positive, the laser points towards the zenith direction, and vice versa. Since the measured attitude data lacked pitch angle data that is greater than 6° (violent fluctuations), the integration time was set to 30 s. The results showed that the maximum and average deviations of the retrieved results were less than 0.38 K and 0.11 K, respectively. The maximum deviation after attitude compensation can be effectively suppressed for attitude data even in violent fluctuations. Similarly, the standard deviations of the pitch angles in each group of data were calculated to analyze the relationship between the compensation results and the dispersion of the attitude data. The standard deviations were 0.15°, 0.14°, 0.17°, and 0.23° under the average pitch angles of 4°, 5°, −6°, and −7°, respectively, which also matched the trend of retrieval deviation.
5. Conclusions
In this paper, the influence of laser pointing uncertainty of Rayleigh lidar carried by airborne floating platforms on atmospheric temperature detection was studied. A relational model between the actual altitude and the detection distance was constructed by taking the pitch angle, roll angle, and observation angle into consideration. The vertical displacement caused by attitude change was analyzed by theoretical calculation from the aspects of single-pulse signal and integrated photon profiles. The accuracy of the temperature retrieval was acquired by comparing the retrieved results under the observation angles of 0°, 30°, and 45° with the NRLMSISE-00 model. Finally, the attitude compensation method was designed, and its favorable effects on temperature retrieval were illustrated. The conclusions are summarized as follows:
- (1)
- The vertical displacement caused by attitude change becomes larger with the increase of settled observation angle. For single-pulse echo signals, the maximum vertical displacement is negligible, so that it is not affected by attitude fluctuations of the platform. For photon profiles consisting of multiple echo signals within a certain integration time, the maximum vertical displacement cannot be ignored in the temperature retrieval process.
- (2)
- When the attitude (pitch and roll angle) is constant, the larger the observation angle, the greater the average and maximum deviation in the temperature retrieval. When the measured pitch angle is = 3.62° and the roll angle is = −0.64°, the maximum temperature deviations are 1 K, 12.47 K, and 21.29 K at the observation angles of 0°, 30°, and 45°, respectively. The results demonstrate that vertical displacement is a crucial factor in causing temperature retrieval inaccuracy.
- (3)
- When the observation angle is fixed, the temperature deviation rises with the increase of attitude angle. In particular, the altitude displacement caused by variations of pitch angle is a significant factor in causing temperature retrieval inaccuracy. When the observation angle is 0°, the retrieved temperature is positively biased relative to the model, and the maximum temperature deviation is less than 3 K. When the observation angles are 30° and 45°, the sign of angle results in density inequality and then affects the deviation in temperature profiles. Under the condition that the observation angle is 45°, the maximum temperature deviation is up to 65 K when the average pitch angle is −7.5°.
- (4)
- The effect of attitude compensation is remarkable. At the observation angles of 0°, 30°, and 45°, the average temperature deviation after attitude compensation is 0.1 K, and the maximum temperature deviation is 0.366 K. Similar results can be obtained under different integration times. In addition, the method is not sensitive to the variation of attitude data.
In conclusion, it is necessary to conduct attitude compensation for lidar equipped on airborne floating platforms before temperature retrieval to ensure accuracy. The compensation method proposed in this paper has good robustness and is not sensitive to the dispersion of attitude, which is believed to be helpful in lidar signal processing.
Author Contributions
Conceptualization, T.W. and F.L.; methodology, T.W.; software, T.W.; validation, T.W. and X.Z. (Xianzhong Zhang); formal analysis, K.Z.; investigation, T.W. and X.L.; resources, K.Z.; data curation, Z.Y.; writing—original draft preparation, T.W.; writing—review and editing, K.Z. and T.W.; visualization, X.Z. (Xiaojian Zhang); supervision, D.X.; project administration, K.Z. and J.Y.; funding acquisition, K.Z. All authors have read and agreed to the published version of the manuscript.
Funding
This work was supported by the Key Laboratory of Micro Opto-electro Mechanical System Technology, Ministry of Education, under Grant 2023KFKT020.
Data Availability Statement
The datasets presented in this article are not readily available because the data are part of an ongoing study. Requests to access the datasets should be directed to the corresponding author.
Conflicts of Interest
The authors declare no conflicts of interest.
References
- Veerabuthiran, S.; Razdan, A.; Jindal, M.; Dubey, D.; Sharma, R. Mie lidar observations of lower tropospheric aerosols and clouds. Spectrochim. Acta Part A Mol. Biomol. Spectrosc. 2011, 84, 32–36. [Google Scholar] [CrossRef] [PubMed]
- Yue, C.; Yang, G.; Wang, J.; Guan, S.; Du, L.; Cheng, X.; Yang, Y. Lidar observations of the middle atmospheric thermal structure over north China and comparisons with TIMED/SABER. J. Atmos. Sol. Terr. Phys. 2014, 120, 80–87. [Google Scholar] [CrossRef]
- Dou, X.; Han, Y.; Sun, D.; Xia, H.; Shu, Z.; Zhao, R.; Shangguan, M.; Guo, J. Mobile Rayleigh Doppler lidar for wind and temperature measurements in the stratosphere and lower mesosphere. Opt. Express 2014, 22, A1203–A1221. [Google Scholar] [CrossRef]
- Yan, Z.; Hu, X.; Guo, W.; Guo, S.; Cheng, Y.; Gong, J.; Yue, J. Development of a mobile Doppler lidar system for wind and temperature measurements at 30–70 km. J. Quant. Spectrosc. Radiat. Transf. 2017, 188, 52–59. [Google Scholar] [CrossRef]
- Chang, Q.; Yang, G.; Song, J.; Gong, S. Studying the stability of the middle atmosphere (30–60 km) over Wuhan by Rayleigh lidar. Chin. Sci. Bull. 2006, 51, 2657–2661. [Google Scholar] [CrossRef]
- Xia, H.; Shangguan, M.; Wang, C.; Shentu, G.; Qiu, J.; Zhang, Q.; Dou, X.; Pan, J. Micro-pulse upconversion Doppler lidar for wind and visibility detection in the atmospheric boundary layer. Opt. Lett. 2016, 41, 5218–5221. [Google Scholar] [CrossRef]
- Taori, A.; Kamalakar, V.; Raghunath, K.; Rao, S.; Russell, J., III. Simultaneous Rayleigh lidar and airglow measurements of middle atmospheric waves over low latitudes in India. J. Atmos. Sol. Terr. Phys. 2012, 78, 62–69. [Google Scholar] [CrossRef]
- Suzuki, S.; Lübken, F.-J.; Baumgarten, G.; Kaifler, N.; Eixmann, R.; Williams, B.P.; Nakamura, T. Vertical propagation of a mesoscale gravity wave from the lower to the upper atmosphere. J. Atmos. Sol. Terr. Phys. 2013, 97, 29–36. [Google Scholar] [CrossRef]
- Sox, L.; Wickwar, V.B.; Yuan, T.; Criddle, N.R. Simultaneous Rayleigh-scatter and sodium resonance lidar temperature comparisons in the mesosphere-lower thermosphere. J. Geophys. Res. Atmos. 2018, 123, 10–688. [Google Scholar] [CrossRef]
- Kaifler, B.; Rempel, D.; Roßi, P.; Büdenbender, C.; Kaifler, N.; Baturkin, V. A technical description of the Balloon Lidar Experiment (BOLIDE). Atmos. Meas. Tech. 2020, 13, 5681–5695. [Google Scholar] [CrossRef]
- Zhao, W.; Hu, X.; Pan, W.; Yan, Z.; Guo, W. Mesospheric Gravity Wave Potential Energy Density Observed by Rayleigh Lidar above Golmud (36.25° N, 94.54° E), Tibetan Plateau. Atmosphere 2022, 13, 1084. [Google Scholar] [CrossRef]
- Zhao, W.; Hu, X.; Yan, Z.; Pan, W.; Guo, W.; Yang, J.; Du, X. Atmospheric Gravity Wave Potential Energy Observed by Rayleigh Lidar above Jiuquan (40° N, 95° E), China. Atmosphere 2022, 13, 1098. [Google Scholar] [CrossRef]
- Von Zahn, U.; Von Cossart, G.; Fiedler, J.; Fricke, K.; Nelke, G.; Baumgarten, G.; Rees, D.; Hauchecorne, A.; Adolfsen, K. The ALOMAR Rayleigh/Mie/Raman lidar: Objectives, configuration, and performance. Ann. Geophys. 2000, 18, 815–833. [Google Scholar] [CrossRef]
- Baray, J.-L.; Courcoux, Y.; Keckhut, P.; Portafaix, T.; Tulet, P.; Cammas, J.-P.; Hauchecorne, A.; Godin Beekmann, S.; De Mazière, M.; Hermans, C. Maïdo observatory: A new high-altitude station facility at Reunion Island (21 S, 55 E) for long-term atmospheric remote sensing and in situ measurements. Atmos. Meas. Tech. 2013, 6, 2865–2877. [Google Scholar] [CrossRef]
- Keckhut, P.; Courcoux, Y.; Baray, J.-L.; Porteneuve, J.; Vérèmes, H.; Hauchecorne, A.; Dionisi, D.; Posny, F.; Cammas, J.-P.; Payen, G. Introduction to the Maïdo Lidar Calibration Campaign dedicated to the validation of upper air meteorological parameters. J. Appl. Remote Sens. 2015, 9, 094099. [Google Scholar] [CrossRef][Green Version]
- Kaifler, B.; Kaifler, N. A Compact Rayleigh Autonomous Lidar (CORAL) for the middle atmosphere. Atmos. Meas. Tech. 2021, 14, 1715–1732. [Google Scholar] [CrossRef]
- Rapp, M.; Kaifler, B.; Dörnbrack, A.; Gisinger, S.; Mixa, T.; Reichert, R.; Kaifler, N.; Knobloch, S.; Eckert, R.; Wildmann, N. SOUTHTRAC-GW: An airborne field campaign to explore gravity wave dynamics at the world’s strongest hotspot. Bull. Am. Meteorol. Soc. 2021, 102, E871–E893. [Google Scholar] [CrossRef]
- Li, H.; Chang, J.; Xu, F.; Liu, Z.; Yang, Z.; Zhang, L.; Zhang, S.; Mao, R.; Dou, X.; Liu, B. Efficient lidar signal denoising algorithm using variational mode decomposition combined with a whale optimization algorithm. Remote Sens. 2019, 11, 126. [Google Scholar] [CrossRef]
- Hauchecorne, A.; Chanin, M.L. Density and temperature profiles obtained by lidar between 35 and 70 km. Geophys. Res. Lett. 1980, 7, 565–568. [Google Scholar] [CrossRef]
- Knobloch, S.; Kaifler, B.; Rapp, M. Estimating the uncertainty of middle-atmospheric temperatures retrieved from airborne Rayleigh lidar measurements. Atmos. Meas. Tech. Discuss. 2022, 2022, 1–27. [Google Scholar]
- Chen, Z.; Yan, Z.; Zhang, B.; Hu, X.; Cheng, X.; Guo, W. Research on the Measurement Accuracy of Shipborne Rayleigh Scattering Lidar. Remote Sens. 2022, 14, 5033. [Google Scholar] [CrossRef]
- Kaifler, N.; Kaifler, B.; Rapp, M.; Fritts, D.C. The polar mesospheric cloud dataset of the Balloon Lidar Experiment (BOLIDE). Earth Syst. Sci. Data 2022, 14, 4923–4934. [Google Scholar] [CrossRef]
- Khanna, J. Atmospheric Temperature Retrievals from Lidar Measurements Using Techniques of Non-Linear Mathematical Inversion; The University of Western Ontario: London, ON, Canada, 2011. [Google Scholar]
- Picone, J.; Hedin, A.; Drob, D.P.; Aikin, A. NRLMSISE-00 empirical model of the atmosphere: Statistical comparisons and scientific issues. J. Geophys. Res. Space Phys. 2002, 107, SIA 15-11–SIA 15-16. [Google Scholar] [CrossRef]
- Vinutha, H.; Poornima, B.; Sagar, B. Detection of outliers using interquartile range technique from intrusion dataset. In Proceedings of the Information and Decision Sciences: Proceedings of the 6th International Conference on FICTA; Springer: Singapore, 2018. [Google Scholar]
- Argall, P. Upper altitude limit for Rayleigh lidar. Ann. Geophys. 2007, 25, 19–25. [Google Scholar] [CrossRef]
Disclaimer/Publisher’s Note: The statements, opinions and data contained in all publications are solely those of the individual author(s) and contributor(s) and not of MDPI and/or the editor(s). MDPI and/or the editor(s) disclaim responsibility for any injury to people or property resulting from any ideas, methods, instructions or products referred to in the content. |
© 2024 by the authors. Licensee MDPI, Basel, Switzerland. This article is an open access article distributed under the terms and conditions of the Creative Commons Attribution (CC BY) license (https://creativecommons.org/licenses/by/4.0/).