Abstract
Atmospheric water vapor is not only a key element of the global hydrological cycle but also the most abundant greenhouse gas. The phase transition and transportation of water vapor are essential for maintaining global energy balance and regulating hydrological processes. However, due to insufficient meteorological observational data, climate research in Africa faces significant limitations despite its substantial contribution to changes in global precipitable water vapor (PWV). In this study, we used MODIS near-infrared (NIR) PWV products and Berkeley temperature data to depict the spatial–temporal variability in PWV across Africa from 2001 to 2020. The results reveal a significant increasing trend in PWV over Africa, with an increase of 0.0158 cm/year. Nearly 99.96% of Africa shows an increase in PWV, with 88.95% of these areas experiencing statistically significant changes, particularly in central regions of Africa. The increase in PWV is more pronounced in high-value months compared to low-value months. The equatorial region of the Congo Basin exhibits higher PWV, which gradually decreases as latitude increases. Despite significant warming (0.0162 °C/year) in Africa, there is no consistent positive correlation between temperature and water vapor. A positive relationship between PWV and temperature is observed in western Africa, while a negative relationship is noted in eastern and southern Africa on an annual scale. Additionally, an increasing trend in precipitation (4.6669 mm/year) is observed, with a significant positive correlation between PWV and precipitation across most of Africa, although this relationship varies by month. These findings provide valuable insights into the comprehension of the hydrothermal variation in Africa amidst climate warming.
1. Introduction
Although atmospheric water vapor accounts for only 1.53% of the global water volume, it is a key parameter in the global hydrological cycle and energy balance. Moisture transportation and atmospheric water vapor phase transition play key roles in the global climate system [,,]. The atmospheric water cycle is the most active part of the Earth’s water cycle. Its rapid periodic change is crucial for the energy budget between the surface and the atmosphere [,]. The changes in atmospheric water vapor directly affect the intensity, frequency, and duration of precipitation, which is crucial to the maintenance of life on Earth []. As the most abundant greenhouse gas in the atmosphere, atmospheric water vapor has a much greater greenhouse effect than other greenhouse gasses in absorbing long-wave radiation from the ground []. The increase in atmospheric water vapor content would further strengthen the greenhouse effect and aggravate climate warming [,,].
Under the background of global warming, the global distribution pattern of hydrology and water resources is changing [,]. Multiple climate responses tightly correspond to the temperature response, with many of them being associated with lower-tropospheric water vapor []. According to the Clausius–Clapeyron (CC) equation, the saturation water pressure increases by 7% per K as the temperature rises []. This indicates that temperature is closely related to water vapor. Previous studies have shown that their relationship is particularly strong over the ocean, and the variations in PWV are positively related to changes in SSTs [,]. Nevertheless, several studies have revealed that the strength of water vapor changes does not scale with Clausius–Clapeyron, especially in continent regions [,,].
Africa, the second largest and the second most populous continent, is a lowland of atmospheric water vapor relative to other land areas at the same latitude. However, it contributed the most (29.1%) to the continental PWV increase for 2000–2017 []. An increase in temperature was observed over the northern, southern, and eastern parts of Africa [,]. The impact of climate change on Africa is already becoming apparent because of its high exposure and huge constraints on resources [,]. On the one hand, the limited distribution of stations makes it difficult to study large-scale atmospheric water vapor temporal and spatial changes [,,]. On the other hand, due to the poor maintenance of facilities and failures of measuring stations, the spatial distribution of meteorological stations in Africa is uneven, and the continuity of measured meteorological data is difficult to meet the requirement of long-term research [,,]. It is an urgent problem to study how the spatial and temporal pattern of atmospheric water vapor responds to climate change. At present, atmospheric water vapor data retrieved by satellite remote sensing have a long time series sufficient for climate research [,,], and satellite observation is more suitable for the dynamic monitoring of atmospheric water vapor on a large scale. MODIS PWV (precipitable water vapor) product is a good remote sensing water vapor product integrating time series length, spatial coverage, and temporal and spatial resolution. Its near-infrared water vapor products are suitable for studying the temporal and spatial variation in atmospheric water vapor [,,,].
This study used MODIS C061 NIR PWV products to portray the spatial and temporal pattern of atmospheric water vapor in Africa. The study objectives include the following: (i) to obtain the change in PWV time series at annual, seasonal, and monthly scales in Africa; (ii) to portray the spatial distribution of multi-year average PWV and its long-term trend; and (iii) to analyze the interaction between PWV and temperature as well as between PWV and precipitation. This study is helpful to elucidate the temporal and spatial variation in atmospheric water vapor over Africa in the past two decades under climate warming conditions. These objectives provided the structural sub-headings used for the remainder of this paper: Materials and Methods, Results and Discussions, and Conclusion sections.
2. Materials and Methods
2.1. Study Area
Africa is the second largest continent (after Asia), and its total land area is approximately 30.3 million km2. It can be considered a plateau continent. There are higher areas in the south and east and lower elevation in the western and northern parts of the continent. The climate of Africa varies widely due to its large latitudinal extent. It has a diverse climate condition, including tropical, temperate, and arid climate zones (Figure 1). The three climate zones account for 33%, 9%, and 58% of Africa []. The mean annual temperature varied from 10 to 30 °C for 1981–2010. There are lower values in the northern part of Africa and a high temperature in the southern regions. Most of the precipitation in Africa during 1981–2010 appeared between 10°N and 20°N. North Africa received about 200–500 mm/year, and west Africa and Central Africa received around 3000 mm/year. Areas in the Sahara had minimal rainfall, ranging from 25 to 100 mm/year [,,].
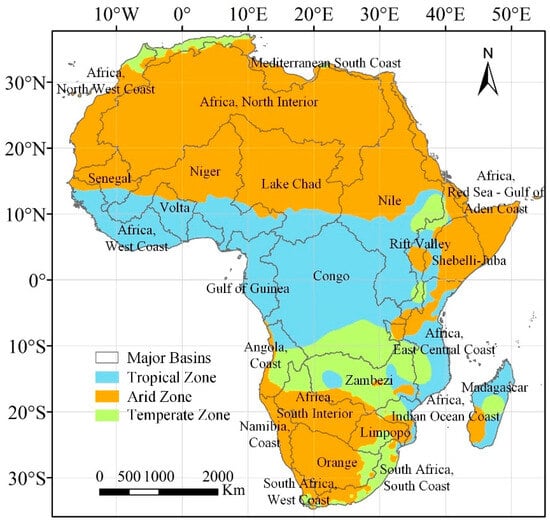
Figure 1.
The climate zones and major basins in Africa. The climate zones include tropical zone, arid zone, and temperate zone.
2.2. Materials and Preprocessing
The PWV data used in this study were obtained from MODIS. MODIS sensors onboarded on the TERRA and AQUA satellites cover 36 bands from visible to infrared (0.25~1 µm) at resolutions of 250 m, 500 m, and 1000 m. High spatiotemporal and spectral resolution enables it to realize the long-term observation of the atmosphere [,,]. PWV can be retrieved by near-infrared (NIR) or thermal infrared (TIR). Only TERRA MODIS was selected due to data similarities. The derived MODIS PWV products include MOD05, MOD07, and MOD08. As calibrated and positioned Level 2 products, 1 × 1 km MOD05 and 5 × 5 km MOD07 PWV products are swath products based on NIR and TIR, respectively [,,]. Level 3 MOD08 is generated from Level 2 product with a resolution of 1° × 1°. It is a collection of various grided SDSs (Scientific Data Sets) such as water vapor, aerosol, and cloud. Previous research showed that MODIS NIR retrieved PWV data that exhibited a higher accuracy compared with that of TIR []. MODIS NIR PWV products demonstrate good performance in agreement with the ground observational data in Africa (Supplementary Materials). Therefore, this study selected the monthly MOD08 SDS named ‘Water_Vapor_Near_Infrared_Clear_Mean’ to analyze the changes in PWV over Africa for 2001–2020.
The 1° × 1° monthly temperature (T) data were obtained from the Berkeley Earth Surface Temperature (BEST), generated based on more than 39,000 sites in total [,,]. The 0.1° × 0.1° monthly precipitation (P) data were available from the Global Satellite Mapping of Precipitation (GSMaP), derived from a combination of microwave data and infrared data from multiple satellites [,,]. The precipitation products were resampled to a resolution of 1° × 1° in order to align with the PWV products. Climate indices data were acquired from the NOAA Climate Prediction Center (CPC). These indices included the Tropical Northern Atlantic Index (TNA), Tropical Southern Atlantic Index (TSA), North Atlantic Oscillation (NAO), Atlantic Multidecadal Oscillation (AMO), Pacific Decadal Oscillation (PDO), Pacific North American Index (PNA), Southern Oscillation Index (SOI), Trans-Niño Index (TNI), Extreme Eastern Tropical Pacific Sea Surface Temperature (SST) (Niño 1.2), Central Tropical Pacific SST (Niño 4), East Central Tropical Pacific SST (Niño 3.4), Multivariate ENSO Index (MEI), Arctic Oscillation (AO), and Antarctic Oscillation (AAO).
2.3. The Calculation of PWV Change
Linear regression was used to identify the changing trend in variables during the study period. The trends were tested for significance with the 95% confidence level. MODIS NIR products were adopted to calculate the spatial pattern and temporal trend in PWV. A convergent projection deformation along geographic latitude exists in calculating the regional average PWV. Transformation coefficients were calculated as follows []:
where Wm is the weighted mean variable of a region, Wi is the variable of the i pixel, Ci is the weight of individual i pixels, and n is the total pixel number of the region. Lu and Ld are the upper and the lower latitudes of a pixel, and N is the pixel number at a latitude of (=180).
2.4. The Identification of Impact Climate Indices
The Random Forest (RF) algorithm was applied to discern the predominant climate index that influences the variations in PWV. It is an ensemble learning method that constructs multiple decision trees and merges their predictions to improve accuracy. The variable importance ranking enables the assessment of each feature’s contribution to the model’s prediction, helping to identify the variables with a significant impact on the outcome []. In this study, the candidate climate indices include TNA, TSA, NAO, AMO, PDO, PNA, SOI, TNI, Niño 1.2, Niño 4, Niño 3.4, MEI, AO, and AAO. The higher values of variable importance scores indicate a stronger impact on the variations in PWV.
3. Results and Discussion
3.1. Spatial Distribution of PWV in Africa for 2001–2020
Figure 2 shows the spatial distribution of multi-year average annual and seasonal PWV for 2001–2020. The multi-year average of PWV was 2.94 ± 0.11 cm. The distribution of average PWV presented a spatial pattern of high values in the middle regions and low values in the north and south regions in Africa (Figure 2a). The high PWV regions (>4 cm) were more located in the Congo Basin, the coastal areas of the Gulf of Guinea and Africa, West Coast. Equally, the low PWV regions (<2 cm) were distributed in the Sahara Desert in northern Africa and the Kalahari Desert in southern Africa. Regarding the regions in the same latitude, PWV in the Congo Basin was larger than that in the eastern African plateau. This indicated that altitude and the types of underlying surface may determine the abundance of PWV []. The tropical climate zone had the highest annual average PWV (3.95 ± 0.13 cm), followed by the temperate climate zone (2.68 ± 0.08 cm), and the arid climate zone had the lowest annual average PWV (2.44 ± 0.10 cm). Seasonally, tropical zones and arid zones both reached the highest value in JJA (4.24 cm and 3.07 cm) and obtained the lowest value in DJF (3.3 cm and 1.88 cm). Relatively, the largest value over temperate zones appeared in DJF (3.46 cm), while the smallest value occurred in JJA (1.79 cm). This coincides with the southern hemisphere’s summer.
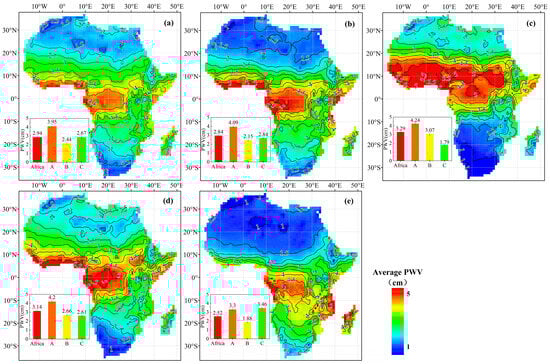
Figure 2.
Spatial distribution of (a) multi-year average annual and (b) MAM, (c) JJA, (d) SON, and (e) DJF seasonal PWV for 2001–2020. MAM is from March to May, JJA is from June to August, SON is from September to November, and DJF is from December to February. A, B, and C represent the climate zones of tropical, arid, and temperate, respectively.
Although the distribution of PWV varied with seasons, it showed a similar spatial pattern of high in the middle regions and low in the north and south regions. In MAM (March, April, and May), high PWV was centered in the regions near the equator (Figure 2b). Regions with PWV greater than 4.5 cm covered 10.61% of Africa, and regions with PWV less than 2 cm accounted for 39.03% of Africa. In JJA (June, July, and August), the capacity of the atmosphere to hold water vapor in the northern Africa increased as temperature rose. High PWV centers moved north to 10°N (Figure 2c). Areas with high PWV (>4.5 cm) accounted for 24.84% of Africa, and areas with low PWV (<2 cm) accounted for 22.79% of Africa. Additionally, the areas with low PWV (<2 cm) were more distributed in the plateau area of southern Africa. In SON (September, October, and November), the high PWV center returned to the equator (Figure 2d). Pixels with high PWV (>4.5 cm) covered 13.02% of Africa, and pixels with low PWV (<2 cm) covered 16.92% of Africa. Compared with other seasons, pixels with middle PWV (2 cm < PWV < 4.5 cm) in SON were most prevalent in Africa (70.06%). In DJF (December, January, and February), the atmospheric water-holding capacity of southern Africa increased. The high PWV center moved south to 5°S (Figure 2e). Pixels with PWV greater than 4.5 cm covered 6.99% of Africa, and pixels with PWV less than 2 cm covered 51% of Africa. Moreover, the low PWV regions in DJF were more distributed in northern Africa.
Figure 3 shows the spatial distribution of the multi-year average of PWV in Africa from January to December for 2001–2020. The multi-year average of PWV in each month also exhibited a similar spatial pattern of high values in the middle of Africa and low values in northern and southern Africa. The proportion of the high value (PWV > 4.5 cm) reached a minimum (6%) in February. At this month, the area with high PWV values (>4.5 cm) were located at 0°–5°S. Then, the high PWV values (>4.5 cm) gradually migrated to the northern hemisphere, where the range continued to expand. In August, the area with high PWV (>4.5 cm) reached the northernmost (5°N–20°N), and the corresponding coverage also reached the maximum (30%). After that, the area with a high PWV value (>4.5) migrated back to the southern hemisphere, and the coverage area also shrank. As for the low PWV values (<2 cm), the proportion reached a maximum (53%) in January. In January, the low PWV values (<2 cm) were mainly located north of 10°N, and only a few were found south of 30°S. After that, the low-value area in northern Africa gradually shrank northward, while the low-value area in southern Africa gradually expanded northward. Until October, the area of low PWV value reached a minimum (15%). The migrations of high PWV followed the change in solar radiation. This indicated that solar radiations were also one of the factors determining the spatial distributions of PWV [,].
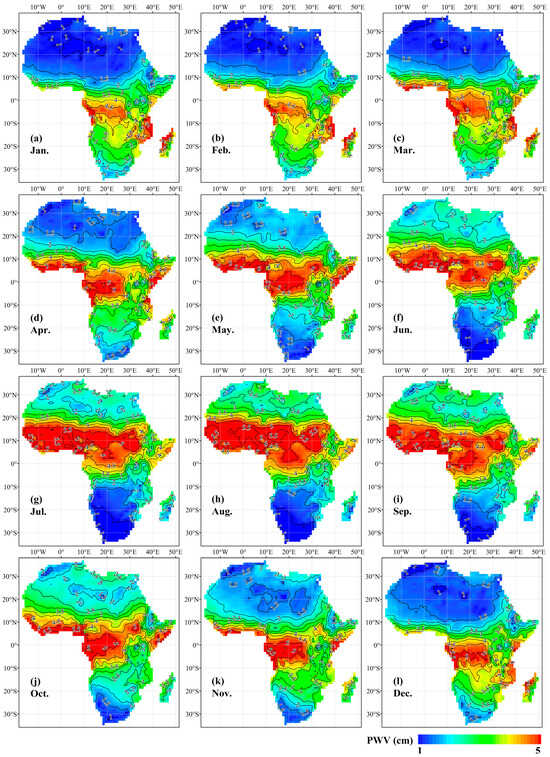
Figure 3.
Spatial distribution of multi-year average of PWV in Africa from January to December for 2001–2020.
3.2. Time Series of PWV in Africa for 2001–2020
3.2.1. Annual Change
Figure 4 shows the time series of annual average PWV in Africa for 2001–2020. There was a significant increasing trend with a rate of 0.0158 cm/year in Africa for 2001–2020 (p < 0.05) (Figure 4a). The maximum value of PWV was 3.14 cm in 2020, and the minimum value was 2.75 cm in 2001. Additionally, an obvious PWV peak occurred in 2010, where the value was 3.08 cm. The PWV in the three climate zones all showed a significant increasing trend. The largest change rate was over tropical zones (0.0199 cm/year), followed by arid zones (0.0147 cm/year). The temperate zones exhibited the smallest change rate at 0.0111 cm/year (Figure 4b).
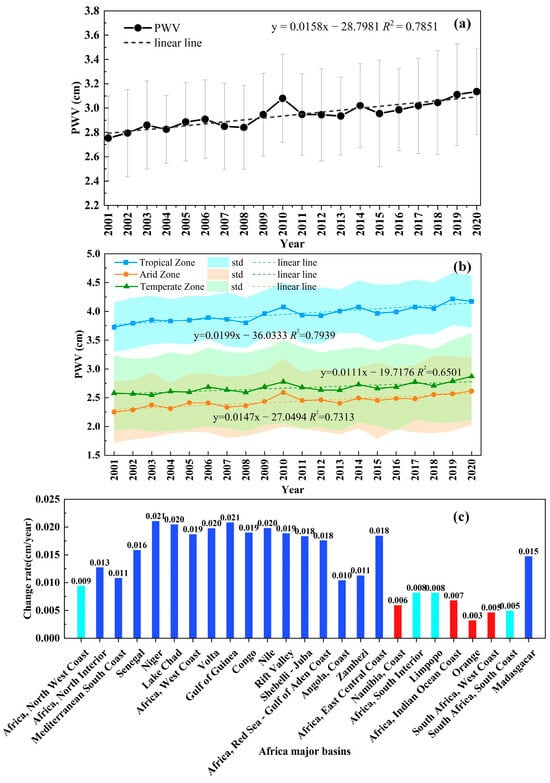
Figure 4.
Time series of annual average PWV in Africa for 2001–2020. The time series of the annual average PWV of (a) whole Africa and (b) climate zones (tropical, arid, and temperate climate zones). Linear trend is represented by a dashed line. (c) is the bar of the change rate of major basins in Africa. The red bar that represents the trend is not significant. The light blue bar and dark blue bar mean that the trend is significant at the 95% and 99% confidence levels, respectively.
Moreover, the PWV in the major basins of Africa all showed a positive trend (Figure 4c). Among these basins, the trend in PWV was not significant over Namibia, Coast, Africa, Indian Ocean Coast, Orange and South Africa, and West Coast (p > 0.05). These basins were mainly located in the arid climate zone over southern Africa (Figure 1). In the basins of Africa, North West Coast, Africa, South Interior, Limpopo, South Africa, and South Coast, PWV exhibited an obvious change at a significance level of 0.05 (p < 0.05). The increasing trend in PWV in the other basins was significant at the level of 0.01. In addition, the Gulf of Guinea, Lake Chad, and Niger displayed a high change rate, where the value was 0.0208 cm/year, 0.0205 cm/year, and 0.0211 cm/year, respectively, which were all greater than 0.02 cm/year. For basins located in the northern hemisphere, such as Africa, North Interior, Africa, North West Coast, Africa, Red Sea—Gulf of Aden Coast, Africa, West Coast, Lake Chad, Mediterranean South Coast, Niger, Senegal, and Volta, they all showed an abrupt change with transition time in 2009–2010. For the other basins in the southern hemisphere, they all showed a change of decreasing first and then increasing.
3.2.2. Seasonal Changes in PWV
Figure 5 shows the seasonal change in PWV over Africa for 2001–2020. For the whole of Africa, PWV exhibited a significant positive trend for all seasons (p < 0.01). PWV in JJA (0.0188 cm/year) showed the greatest positive trend, followed by MAM (0.0186 cm/year), and DJF (0.0080 cm/year) exhibited the smallest trend. For tropical zones in Africa, PWV in MAM (0.0260 cm/year) had the largest change rate, followed by SON (0.0203 cm/year), and DJF (0.0128 cm/year) showed the smallest value. In arid zones of Africa, PWV displayed the most obvious change in JJA (0.022 cm/year), followed by SON (0.0154 cm/year), and the change in DJF (0.0035 cm/year) was not noticeable. Regarding temperate zones, PWV exhibited an evident change in MAM (0.0192 cm/year), followed by DJF (0.0161 cm/year), and a slight change in JJA (0.0040 cm/year).
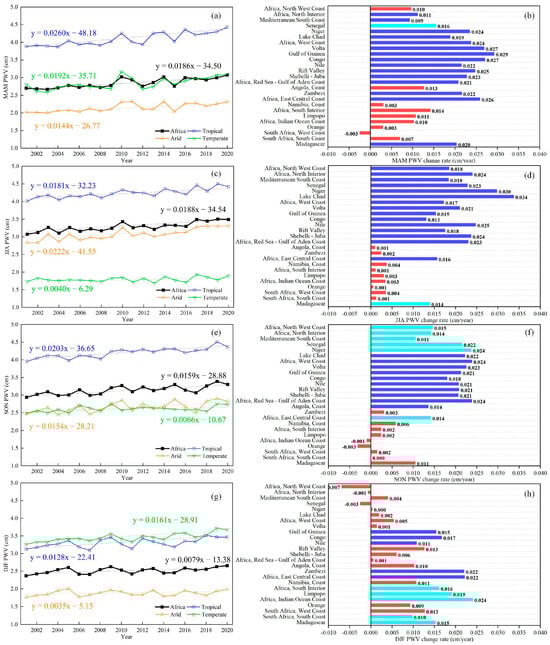
Figure 5.
Seasonal change in PWV over Africa for 2001–2020. The time series of seasonal average of PWV over Africa (black lines), tropical zones (blue lines), arid zones (orange lines), and temperate zones (green lines) in (a) MAM, (c) JJA, (e) SON, and (g) DJF. Bar of change rate for PWV over African major basins in (b) MAM, (d) JJA, (f) SON, and (h) DJF. Dark blue bars and light blue bars represent the change rate where the levels of significance are at 0.01 and 0.05, respectively. Red bars represent that the change in PWV is not significant.
A clear difference also existed in PWV changes at the basin scale (Figure 5). The basins of Africa, North Interior, Mediterranean South Coast, Senegal, Niger, Lake Chad, Africa, West Coast, Volta, Shebelli—Juba and Africa, and Red Sea—Gulf of Aden Coast, which are in the north of the equator and almost belong to an arid climate, showed a significant increasing trend in PWV (p < 0.05) in MAM, JJA, and SON. Among these basins, the Mediterranean South Coast, Niger, Lake Chad, Africa, West Coast, and Volta showed an insignificant increasing trend. Relatively, Africa, North Interior, and Senegal exhibited an insignificant negative trend. The Gulf of Guinea, Congo, Nile, and Rift Valley lie around the equator and are almost tropical climate, and they displayed a significant increasing trend in all seasons. Namibia, Coast, Africa, South Interior, Limpopo, Africa, Indian Ocean Coast, Orange, South Africa, West Coast, South Africa, and South Coast are located south of the equator, and no significant changes in PWV were observed in MAM, JJA, and SON. However, in Africa, the East Central Coast lies south of the equator and showed a significant increasing trend in all seasons. Zambezi regions exhibited a predominantly temperate climate, with a notable increase in PWV observed across all seasons, but only significantly in MAM and DJF. The island of Madagascar is situated off the mainland, and there PWV showed an increasing trend in all seasons, but only significantly in MAM, JJA, and DJF.
3.2.3. Monthly Changes in PWV
Figure 6 shows the temporal variations in annual and monthly PWV values over Africa for 2001–2020. In the monthly heatmaps of PWV, it showed an increasing trend from January to December for Africa and three climate zones. This suggests that PWV was increasing in Africa in all months but at different magnitudes. Regarding the whole of Africa, PWV in January also showed an increasing trend, but this was not significant (p = 0.1886) (Table 1). PWV did not display the highest value in May (3.01 cm); however, it showed the largest increasing trend (0.0243 cm/year). January exhibited the smallest increasing trend in PWV (0.0069 cm/year) with the smallest annual average PWV. August (0.0211 cm/year) and September (0.0206 cm/year) not only had high PWV values but also a larger increasing rate, both greater than 0.02 cm/year (Table 1). The largest trend in PWV in tropical and temperate climate zones also occurred in May (0.0320 cm/year and 0.0254 cm/year), while the highest value in the arid climate zone occurred in August (0.0279 cm/year). The smallest increasing trend in tropical and arid climate zones appeared in January (0.0107 cm/year and 0.0037 cm/year), while the lowest growth rate in the temperate climate zone occurred in June. This indicated that the PWV increased more in the month with high PWV, while the PWV increased less in the month with low PWV. In other words, from the perspective of the time variation, PWV increases more in the high value period and less in the low value period (Figure 6) [].
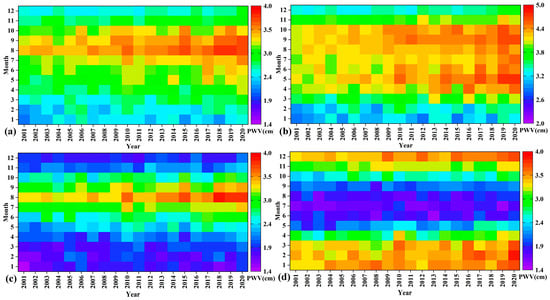
Figure 6.
Temporal variations in PWV in Africa on both annual and monthly scales for 2001–2020. Heatmaps for (a) whole of Africa, (b) tropical climate zones, (c) arid climate zones, and (d) temperate climate zones.

Table 1.
Statistical metrics of linear regression of PWV in Africa for 2001–2020.
3.3. The Changes in PWV over Africa for 2001–2020
Figure 7 shows the spatial distribution of variations in annual and seasonal PWV for 2001–2020. The change rate of PWV demonstrated a similar spatial distribution with multi-year average PWV, characterized by high values in the central regions and low values in the northern and southern regions. The majority of African regions exhibited a significant increasing trend in PWV (88.95%), with only the areas south of 20°S showing an insignificant increasing trend (11.01%). In addition, there was an insignificant decreasing trend in PWV in the Kalahari Desert region of southern Africa (0.04%). The seasonal scale exhibited a greater variation in PWV compared to the annual scale. During the MAM period, nearly 24.48% of Africa experienced a change rate greater than 0.025 cm/year, while negative rates were observed in about 1.89% of Africa. In JJA, areas with a larger change rate (>0.025 cm/year) covered 26.41% of Africa, and regions exhibiting decreasing trend accounted for 5.14% of Africa. As for the SON, the proportion of African regions experiencing an increase in PWV greater than 0.025 cm/year decreased to 10.65%, while areas with declines in PWV constituted about 5.63% of Africa. In addition, the decrease in PWV of MAM, JJA, and SON all occurred in southern Africa. Comparatively, in DJF, regions with a high change rate (>0.025 cm/year) accounted for 4.38% of Africa’s total area, with an increased proportion (25.2%) of pixels exhibiting decreasing trend. Moreover, while northern Africa experienced a decline in PWV during DJF, southern Africa observed an increase.
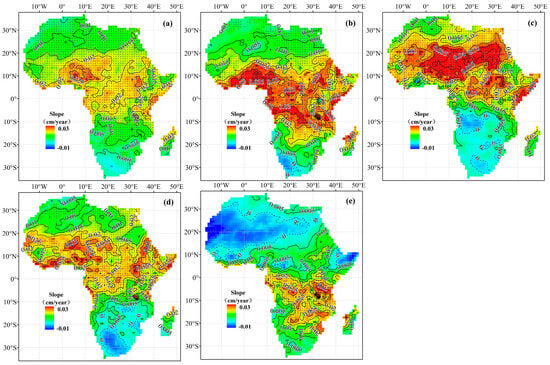
Figure 7.
Spatial distribution of change rate (a) annual and (b–e) seasonal PWV for 2001–2020. The change rate on the pixel basis is the slope of the linear regression of the time series, and the pixel of significance change (p ≤ 0.05) is marked by gray points. Dashed lines are zero and negative contours and solid lines are positive contours.
In terms of the spatial distribution of the PWV change rate for each month, areas with high PWV values experienced a greater increase, while areas with low PWV values showed a smaller increase or even a decrease (Figure 8). The PWV change rate on the monthly scale was higher compared to that on the annual scale. The high change rate of PWV (>0.015 cm/year) also exhibited a north–south migration. The regions near the equator showed a consistent increasing trend in PWV throughout each month. In May, areas with an increasing PWV trend accounted for the largest coverage (99.16%), while those with a decreasing PWV trend had the smallest coverage (0.84%). This was also corresponding to the results that the PWV time series had the largest rate of change in May. Relatively, the greatest coverage of the areas with a decreasing trend (18.97%) and the smallest coverage of the areas with an increasing trend (81.03%) both occurred in December.
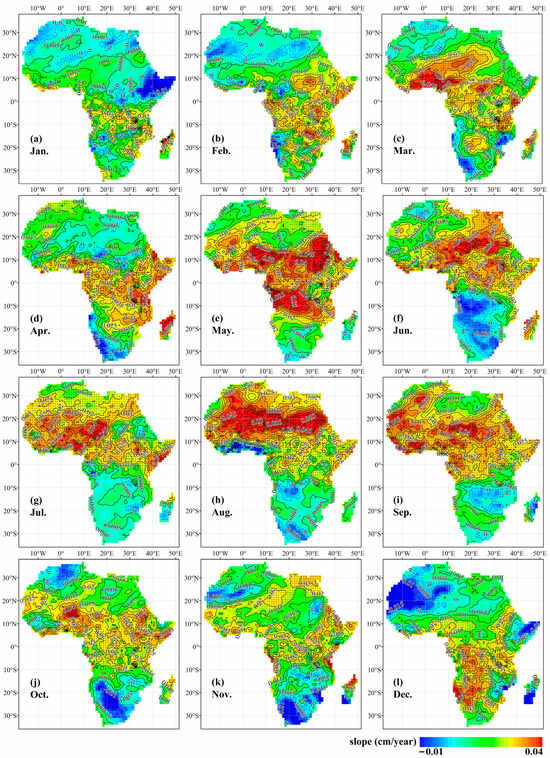
Figure 8.
Spatial distribution of PWV change rate from January to December for 2001–2020. The change rate on the pixel basis is the slope of the linear regression of the time series, and the pixel of significance change (p ≤ 0.05) is marked by gray points. Dashed lines are zero and negative contours and solid lines are positive contours.
3.4. The Relationship between PWV and Temperature over Africa for 2001–2020
Figure 9 shows the linear regression results of PWV–T and PWV–P on an annual scale for 2001–2020. Temperature and precipitation in Africa both showed a significant increasing trend, where the rates were 0.0162 °C/year (p < 0.05) and 4.6669 mm/year (p < 0.05), respectively. PWV and temperature in Africa demonstrated consistent annual average time series changes, where Pearson’s r value was 0.65 (p < 0.05). The consistency between PWV and precipitation in Africa also exhibited a relatively high correlation, as indicated by Pearson’s correlation coefficient of 0.69 (p < 0.05). However, the consistency of PWV and temperature was quite different around 2010 []. PWV and temperature were more consistent for 2001–2010, with a large Pearson’s value of 0.86 (p = 0.001). There was poor agreement between PWV and temperature for 2011–2020, with a small Pearson’s value of 0.49 (p = 0.15). The 2010–2011 La Niña and 2015–2016 El Niño events are two of the top five warm and cold non-overlapping events that have occurred since 1979. These two super-strong ENSO (El Niño-Southern Oscillation) events may account for the inconsistency between PWV and temperature after 2010. This is the dominant mode of global climate variability, exerting the most significant influence on southern Africa during summer [,,]. The results in Figure 10 further support that AMO exerted a predominant influence on northern and southern Africa, while ENSO played a dominant role in influencing PWV patterns in southern Africa. Regional circulation patterns also play an important role in regulating precipitation during ENSO events by influencing moisture convergence. The anomalous weakening of the Angola low and the South Indian Ocean high in early austral summer of 2015/2016, combined with a strengthened mid-level Botswana high, resulted in unfavorable conditions for rainfall over southern Africa [,].
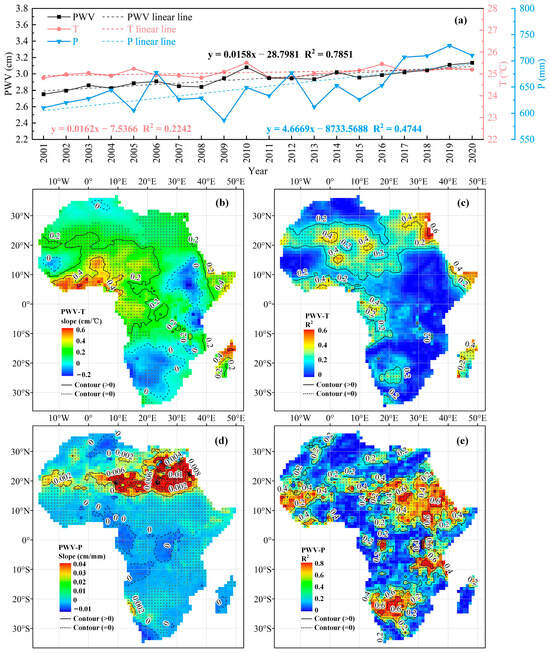
Figure 9.
The relationship between PWV and temperature and precipitation on an annual scale for 2001–2020. (a) Time series of the annual average of PWV, temperature, and precipitation. Linear trend is represented by dashed line. The slope of the linear regression on the pixel basis for (b) PWV and temperature and (d) PWV and precipitation. The correlation coefficient (R2) for (c) PWV and temperature and (e) PWV and precipitation. Significant relationships (p < 0.05) are marked by gray points. Dashed lines are zero and negative contours and solid lines are positive contours.

Figure 10.
Spatial distribution of the controlling climate indices of PWV for 2001–2020. The climate indices include TNA (Tropical Northern Atlantic Index), TSA (Tropical Southern Atlantic Index), NAO (North Atlantic Oscillation), AMO (Atlantic Multidecadal Oscillation), PDO (Pacific Decadal Oscillation), PNA (Pacific North American Index), SOI (Southern Oscillation Index), TNI (Trans-Niño Index), Niño 1.2 (Extreme Eastern Tropical Pacific Sea Surface Temperature), Niño 4 (Central Tropical Pacific Sea Surface Temperature), Niño 3.4 (East Central Tropical Pacific Sea Surface Temperature), MEI (Multivariate ENSO Index), AO (Arctic Oscillation), and AAO (Antarctic Oscillation).
In Figure 9b,c, the results of the regression analysis are calculated with annual average temperature as the independent variable and annual average PWV as the dependent variable. A significant negative slope value and higher correlation coefficient were observed in the Kalahari Desert (South Interior of Africa, Limpopo, Namibia, and Orange), indicating a strong inverse relationship between PWV and temperature (Figure 9b,c). A significant positive slope value and larger correlation coefficient in the coastal areas of Africa, West Coast, and Volta, and northeastern Madagascar, indicated a robust positive relationship (Figure 9b,c). The slope and correlation coefficients between PWV and precipitation are presented in Figure 9d,e. In the regions of West Coast, Nile, East Central Coast, and Orange, a significant positive slope value was observed, along with a higher correlation coefficient, indicating a strong positive relationship between PWV and precipitation (Figure 9d,e). Conversely, only small areas in the Gulf of Guinea exhibited a significant negative slope value accompanied by a high correlation coefficient, suggesting a robust inverse relationship (Figure 9d,e). The spatial correlation patterns between PWV and temperature in November, December, January, and February exhibited similarities to those observed on an annual scale, while an inverse correlation pattern was observed from April to October (Figure 11). Regarding the monthly correlation between PWV and precipitation, similar patterns were observed in October to December and January to March compared to the annual scale. In the remaining months, positive correlations were also found in the South Interior, Zambezi, and East Central Coast regions (Figure 12).
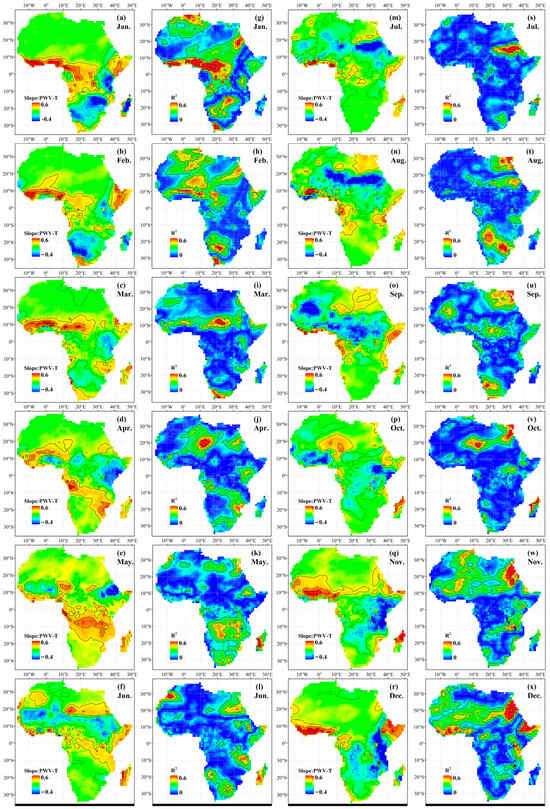
Figure 11.
Spatial distribution of the relationship between PWV and temperature on a monthly scale for 2001–2020. (a–f) and (m–r) represent the slope of the linear regression at each pixel level, while (g–l) and (s–x) indicate the correlation coefficient between PWV and temperature at each pixel level. Grey points denote the pixel with significant relationships (p < 0.05). Dashed lines represent zero and negative contours, while solid lines represent positive contours.
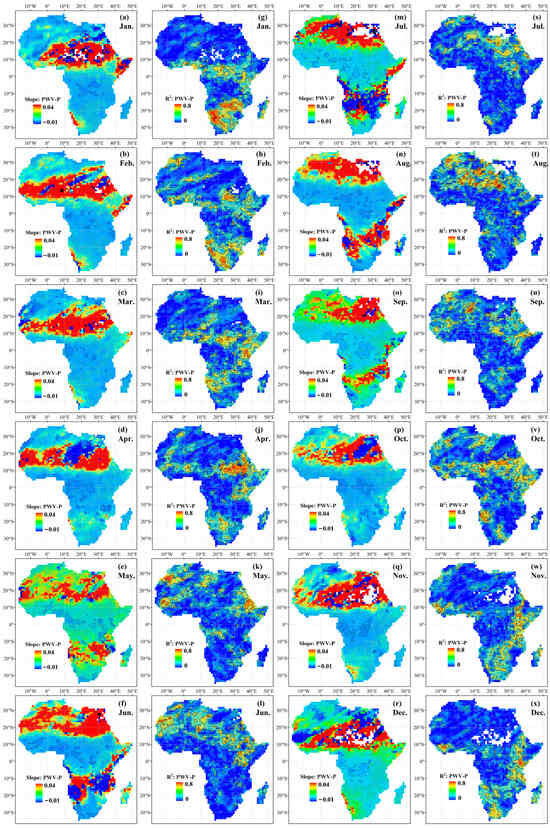
Figure 12.
Spatial distribution of the relationship between PWV and precipitation on a monthly scale for 2001–2020. (a–f) and (m–r) represent the slope of the linear regression at each pixel level, while (g–l) and (s–x) indicate the correlation coefficient between PWV and temperature at each pixel level. Grey points denote the pixel with significant relationships (p < 0.05). Dashed lines represent zero and negative contours, while solid lines represent positive contours.
4. Conclusions
This study used MODIS C061 NIR PWV products to calculate the spatial and temporal variation in atmospheric water vapor in Africa for 2001–2020. For the whole of Africa, the multi-year average of PWV was 2.94 ± 0.11 cm for 2001–2020. A significant increasing trend with a change rate was 0.0158 cm/year (p < 0.05) (Figure 4a). The tropical, temperate, and arid climate zones exhibited increasing trends were 0.0199 cm/year, 0.0111 cm/year, and 0.0147 cm/year, respectively (Figure 4b). The 25 major basins all showed increasing change, and only the basins of Africa, Indian Ocean Coast, Namibia, Coast, Orange, South Africa, and West Coast had no significant trend. On the monthly scale, May presented the greatest PWV increase (0.0243 cm/year), while January showed the smallest growth (0.0069 cm/year) (Table 1). This suggested that PWV increased more in high-value months than in low-value months over Africa on the time scale.
In a spatial dimension, the high PWV regions (>4 cm) were in the Congo Basin and the coastal areas of the Gulf of Guinea. The low PWV regions (<2 cm) centered in the Sahara Desert in northern Africa, the Kalahari Desert in southern Africa, and the Ethiopian Plateau in northeastern Africa. On the yearly scale, PWV showed a significant increasing trend over most parts of Africa, except regions in the south of 20°S. The largest increase was in the southeastern Niger River basin (>0.025 cm/year). On the seasonal scale, the decrease in PWV in MAM, JJA, and SON all occurred in southern Africa. Areas with a change rate greater than 0.025 cm/year had the largest percentage in JJA (26.41%) and smallest percentage in DJF (4.38%). In addition, areas with a negative change rate account for the most in DJF (25.2%) and the least in MAM (1.89%).
Considering the interaction between PWV and temperature, consistent annual average time series changes were demonstrated with a significant Pearson’s r value of 0.65 (p < 0.05). Moreover, a relatively high correlation was observed between PWV and precipitation in Africa, as indicated by a significant Pearson’s correlation coefficient of 0.69 (p < 0.05). Unlike the high PWV regions that were distributed in the Congo Basin near the equator, high-temperature regions (>28 °C) were in the southern Sahara Desert at 10°N to 20°N, which was more to the north. This indicated that temperature may affect the convergence and divergence of PWV through the climate system.
The present study portrays the spatial and temporal variation in atmospheric water vapor over Africa for twenty recent years, offering an improved understanding of the interaction between hydrothermal variation in Africa under climate change conditions.
Supplementary Materials
The following supporting information can be downloaded at: https://www.mdpi.com/article/10.3390/rs16162875/s1, Figure S1: Spatial distribution of the radiosonde sites and the AERONET sites, Figure S2: Frequency distribution of statistical metrics (a) R2, (b) ARE, (c) RMSE, and (d) SD between MODIS C61_NIR and radiosonde PWV for data pairs in Africa for 2001–2020, Figure S3: Frequency distribution of statistical metrics (a) R2, (b) ARE, (c) RMSE, and (d) SD between MODIS C61_NIR and sunphotometer PWV for data pairs in Africa for 2001–2020.
Author Contributions
Conceptualization, R.W. (Ruonan Wang), Y.L. (Yuanbo Liu) and G.W.; methodology, R.W. (Ruonan Wang), R.W. (Rong Wang), Y.L. (Yongwei Liu) and X.F.; software, R.W. (Ruonan Wang), Y.L. (Yongwei Liu) and R.W. (Rong Wang); validation, G.W., X.F. and R.W. (Ruonan Wang); investigation, R.W. (Ruonan Wang), R.W. (Rong Wang) and Y.L. (Yongwei Liu); visualization, R.W. (Ruonan Wang) and G.W.; writing—original draft, R.W. (Ruonan Wang); writing—review and editing, Y.L. (Yuanbo Liu), G.W., X.F. and Y.L. (Yongwei Liu); supervision, Y.L. (Yuanbo Liu) and G.W.; funding acquisition, R.W. (Ruonan Wang) and Y.L. (Yuanbo Liu). All authors have read and agreed to the published version of the manuscript.
Funding
This work was financially supported by the National Natural Science Foundation of China (42201430 and 42230112), the National Key Research and Development Program of China (2018YFE0105900), and the Jiangsu Entrepreneurship and Innovation Doctor Project (2023000015).
Data Availability Statement
The MODIS precipitable water vapor products that support the findings of this study are available at https://ladsweb.modaps.eosdis.nasa.gov (accessed on 10 March 2023); the Berkely temperature data that support the findings of this study are available at http://berkeleyearth.org/data/ (accessed on 6 May 2022).
Acknowledgments
We thank the NASA MODIS Science Team for providing precipitable water vapor products. We are grateful to the Berkeley Earth Group for providing temperature data. We thank the Japan Science and Technology Agency and Japan Aerospace Exploration Agency for providing precipitation data. We extend our appreciation to the NOAA Climate Prediction Center for providing climate indices data. We also express our gratitude to the editorial team of Remote Sensing.
Conflicts of Interest
The authors declare no conflicts of interest.
References
- Kummerow, C.; Barnes, W.; Kozu, T.; Shiue, J.; Simpson, J. The Tropical Rainfall Measuring Mission (TRMM) Sensor Package. J. Atmos. Ocean. Technol. 1998, 15, 809–817. [Google Scholar] [CrossRef]
- Naud, C.M.; Miller, J.R.; Landry, C. Using satellites to investigate the sensitivity of longwave downward radiation to water vapor at high elevations. J. Geophys. Res. Atmos. 2012, 117, D05101. [Google Scholar] [CrossRef]
- Schneider, T.; O’Gorman, P.A.; Levine, X.J. Water Vapor and the Dynamics of Climate Changes. Rev. Geophys. 2010, 48, RG3001. [Google Scholar] [CrossRef]
- Sherwood, S.C.; Ingram, W.; Tsushima, Y.; Satoh, M.; Roberts, M.; Vidale, P.L.; O’Gorman, P.A. Relative humidity changes in a warmer climate. J. Geophys. Res. Atmos. 2010, 115, D09104. [Google Scholar] [CrossRef]
- Trenberth, K.E.; Davis, C.A.; Fasullo, J. Water and energy budgets of hurricanes: Case studies of Ivan and Katrina. J. Geophys. Res. Atmos. 2007, 112, D23106. [Google Scholar] [CrossRef]
- Becker, A.; Finger, P.; Meyer-Christoffer, A.; Rudolf, B.; Schamm, K.; Schneider, U.; Ziese, M. A description of the global land-surface precipitation data products of the Global Precipitation Climatology Centre with sample applications including centennial (trend) analysis from 1901–present. Earth Syst. Sci. Data 2013, 5, 71–99. [Google Scholar] [CrossRef]
- Randall, D.A.; Wood, R.A.; Bony, S.; Colman, R.; Fichefet, T.; Fyfe, J.; Kattsov, V.; Pitman, A.; Shukla, J.; Srinivasan, J. Climate models and their evaluation. In Climate Change 2007: The Physical Science Basis. Contribution of Working Group I to the Fourth Assessment Report of the IPCC (FAR); Cambridge University Press: Cambridge, UK, 2007; pp. 589–662. [Google Scholar]
- Ramanathan, V.; Cess, R.; Harrison, E.; Minnis, P.; Barkstrom, B.; Ahmad, E.; Hartmann, D. Cloud-radiative forcing and climate: Results from the Earth Radiation Budget Experiment. Science 1989, 243, 57–63. [Google Scholar] [CrossRef]
- Soden, B.J.; Wetherald, R.T.; Stenchikov, G.L.; Robock, A. Global Cooling After the Eruption of Mount Pinatubo: A Test of Climate Feedback by Water Vapor. Science 2002, 296, 727–730. [Google Scholar] [CrossRef]
- Cess, R.D. Water vapor feedback in climate models. Science 2005, 310, 795–796. [Google Scholar] [CrossRef]
- Qian, W.; Fu, J.; Yan, Z. Decrease of light rain events in summer associated with a warming environment in China during 1961–2005. Geophys. Res. Lett. 2007, 34, L11705. [Google Scholar] [CrossRef]
- Liu, S.C.; Fu, C.; Shiu, C.-J.; Chen, J.-P.; Wu, F. Temperature dependence of global precipitation extremes. Geophys. Res. Lett. 2009, 36, L17702. [Google Scholar] [CrossRef]
- Held, I.M.; Soden, B.J. Robust responses of the hydrological cycle to global warming. J. Clim. 2006, 19, 5686–5699. [Google Scholar] [CrossRef]
- Trenberth, K.E.; Fasullo, J.; Smith, L. Trends and variability in column-integrated atmospheric water vapor. Clim. Dyn. 2005, 24, 741–758. [Google Scholar] [CrossRef]
- Wang, J.; Dai, A.; Mears, C. Global Water Vapor Trend from 1988 to 2011 and Its Diurnal Asymmetry Based on GPS, Radiosonde, and Microwave Satellite Measurements. J. Clim. 2016, 29, 5205–5222. [Google Scholar] [CrossRef]
- Allan, R.P.; Willett, K.M.; John, V.O.; Trent, T. Global Changes in Water Vapor 1979–2020. J. Geophys. Res. Atmos. 2022, 127, e2022JD036728. [Google Scholar] [CrossRef]
- Dai, A. Recent Climatology, Variability, and Trends in Global Surface Humidity. J. Clim. 2006, 19, 3589–3606. [Google Scholar] [CrossRef]
- Bernet, L.; Brockmann, E.; von Clarmann, T.; Kämpfer, N.; Mahieu, E.; Mätzler, C.; Stober, G.; Hocke, K. Trends of atmospheric water vapour in Switzerland from ground-based radiometry, FTIR and GNSS data. Atmos. Chem. Phys. 2020, 20, 11223–11244. [Google Scholar] [CrossRef]
- Wang, R.; Liu, Y. Recent declines in global water vapor from MODIS products: Artifact or real trend? Remote Sens. Environ. 2020, 247, 111896. [Google Scholar] [CrossRef]
- Barkhordarian, A.; Bhend, J.; von Storch, H. Consistency of observed near surface temperature trends with climate change projections over the Mediterranean region. Clim. Dyn. 2012, 38, 1695–1702. [Google Scholar] [CrossRef]
- Serdeczny, O.; Adams, S.; Baarsch, F.; Coumou, D.; Robinson, A.; Hare, W.; Schaeffer, M.; Perrette, M.; Reinhardt, J. Climate change impacts in Sub-Saharan Africa: From physical changes to their social repercussions. Reg. Environ. Chang. 2017, 17, 1585–1600. [Google Scholar] [CrossRef]
- Beck, L.; Bernauer, T. How will combined changes in water demand and climate affect water availability in the Zambezi river basin? Glob. Environ. Chang. 2011, 21, 1061–1072. [Google Scholar] [CrossRef]
- NourEldeen, N.; Mao, K.; Yuan, Z.; Shen, X.; Xu, T.; Qin, Z. Analysis of the Spatiotemporal Change in Land Surface Temperature for a Long-Term Sequence in Africa (2003–2017). Remote Sens. 2020, 12, 488. [Google Scholar] [CrossRef]
- Holben, B.N.; Eck, T.F.; Slutsker, I.; Tanré, D.; Buis, J.P.; Setzer, A.; Vermote, E.; Reagan, J.A.; Kaufman, Y.J.; Nakajima, T.; et al. AERONET—A Federated Instrument Network and Data Archive for Aerosol Characterization. Remote Sens. Environ. 1998, 66, 1–16. [Google Scholar] [CrossRef]
- Durre, I.; Vose, R.S.; Wuertz, D.B. Overview of the Integrated Global Radiosonde Archive. J. Clim. 2006, 19, 53–68. [Google Scholar] [CrossRef]
- Pérez-Ramírez, D.; Whiteman, D.N.; Smirnov, A.; Lyamani, H.; Holben, B.N.; Pinker, R.; Andrade, M.; Alados-Arboledas, L. Evaluation of AERONET precipitable water vapor versus microwave radiometry, GPS, and radiosondes at ARM sites. J. Geophys. Res. Atmos. 2014, 119, 9596–9613. [Google Scholar] [CrossRef]
- Wheater, H.S. Modelling hydrological processes in arid and semi-arid areas: An introduction. In Hydrological Modelling in Arid and Semi-Arid Areas; Wheater, H., Sharma, K.D., Sorooshian, S., Eds.; International Hydrology Series; Cambridge University Press: Cambridge, UK, 2007; pp. 1–20. [Google Scholar]
- Karamage, F.; Liu, Y.; Liu, Y. Data Construction and Spatiotemporal Trend Attribution of Runoff over the African Continent (1981–2016). J. Hydrometeorol. 2021, 22, 1949–1971. [Google Scholar] [CrossRef]
- Hughes, D.A. Facing a future water resources management crisis in sub-Saharan Africa. J. Hydrol. Reg. Stud. 2019, 23, 100600. [Google Scholar] [CrossRef]
- Schulz, J.; Albert, P.; Behr, H.D.; Caprion, D.; Deneke, H.; Dewitte, S.; Dürr, B.; Fuchs, P.; Gratzki, A.; Hechler, P.; et al. Operational climate monitoring from space: The EUMETSAT Satellite Application Facility on Climate Monitoring (CM-SAF). Atmos. Chem. Phys. 2009, 9, 1687–1709. [Google Scholar] [CrossRef]
- Vonder Haar, T.H.; Bytheway, J.L.; Forsythe, J.M. Weather and climate analyses using improved global water vapor observations. Geophys. Res. Lett. 2012, 39, L15802. [Google Scholar] [CrossRef]
- Lu, N.; Qin, J.; Yang, K.; Gao, Y.; Xu, X.; Koike, T. On the use of GPS measurements for Moderate Resolution Imaging Spectrometer precipitable water vapor evaluation over southern Tibet. J. Geophys. Res. Atmos. 2011, 116, D23117. [Google Scholar] [CrossRef]
- Gurbuz, G.; Jin, S. Long-time variations of precipitable water vapour estimated from GPS, MODIS and radiosonde observations in Turkey. Int. J. Climatol. 2017, 37, 5170–5180. [Google Scholar] [CrossRef]
- Wang, Y.; Yang, K.; Pan, Z.; Qin, J.; Chen, D.; Lin, C.; Chen, Y.; Lazhu; Tang, W.; Han, M.; et al. Evaluation of Precipitable Water Vapor from Four Satellite Products and Four Reanalysis Datasets against GPS Measurements on the Southern Tibetan Plateau. J. Clim. 2017, 30, 5699–5713. [Google Scholar] [CrossRef]
- Lehner, B.; Grill, G. Global river hydrography and network routing: Baseline data and new approaches to study the world’s large river systems. Hydrol. Process. 2013, 27, 2171–2186. [Google Scholar] [CrossRef]
- Almazroui, M.; Saeed, F.; Saeed, S.; Nazrul Islam, M.; Ismail, M.; Klutse, N.A.B.; Siddiqui, M.H. Projected Change in Temperature and Precipitation Over Africa from CMIP6. Earth Syst. Environ. 2020, 4, 455–475. [Google Scholar] [CrossRef]
- Shongwe, M.E.; van Oldenborgh, G.J.; van den Hurk, B.; van Aalst, M. Projected Changes in Mean and Extreme Precipitation in Africa under Global Warming. Part II: East Africa. J. Clim. 2011, 24, 3718–3733. [Google Scholar] [CrossRef]
- Shongwe, M.E.; van Oldenborgh, G.J.; van den Hurk, B.J.J.M.; de Boer, B.; Coelho, C.A.S.; van Aalst, M.K. Projected Changes in Mean and Extreme Precipitation in Africa under Global Warming. Part I: Southern Africa. J. Clim. 2009, 22, 3819–3837. [Google Scholar] [CrossRef]
- King, M.D.; Menzel, W.P.; Kaufman, Y.J.; Tanre, D.; Bo-Cai, G.; Platnick, S.; Ackerman, S.A.; Remer, L.A.; Pincus, R.; Hubanks, P.A. Cloud and aerosol properties, precipitable water, and profiles of temperature and water vapor from MODIS. IEEE Trans. Geosci. Remote Sens. 2003, 41, 442–458. [Google Scholar] [CrossRef]
- Kaufman, Y.J.; Gao, B. Remote sensing of water vapor in the near IR from EOS/MODIS. IEEE Trans. Geosci. Remote Sens. 1992, 30, 871–884. [Google Scholar] [CrossRef]
- Gao, B.-C.; Kaufman, Y.J. Water vapor retrievals using Moderate Resolution Imaging Spectroradiometer (MODIS) near-infrared channels. J. Geophys. Res. Atmos. 2003, 108, 4389. [Google Scholar] [CrossRef]
- King, M.D.; Kaufman, Y.J.; Menzel, W.P.; Tanre, D. Remote sensing of cloud, aerosol, and water vapor properties from the moderate resolution imaging spectrometer (MODIS). IEEE Trans. Geosci. Remote Sens. 1992, 30, 2–27. [Google Scholar] [CrossRef]
- Seemann, S.W.; Li, J.; Menzel, W.P.; Gumley, L.E. Operational Retrieval of Atmospheric Temperature, Moisture, and Ozone from MODIS Infrared Radiances. J. Appl. Meteorol. 2003, 42, 1072–1091. [Google Scholar] [CrossRef]
- Seemann, S.W.; Borbas, E.E.; Knuteson, R.O.; Stephenson, G.R.; Huang, H.-L. Development of a Global Infrared Land Surface Emissivity Database for Application to Clear Sky Sounding Retrievals from Multispectral Satellite Radiance Measurements. J. Appl. Meteorol. Climatol. 2008, 47, 108–123. [Google Scholar] [CrossRef]
- Rohde, R. Comparison of Berkeley Earth, NASA GISS, and Hadley CRU averaging techniques on ideal synthetic data. Berkeley Earth Memo January 2013, 2, 013. [Google Scholar]
- Rohde, R.; Muller, R.; Jacobsen, R.; Muller, E.; Perlmutter, S.; Rosenfeld, A.; Wurtele, J.; Groom, D.; Wickham, C. A New Estimate of the Average Earth Surface Land Temperature Spanning 1753 to 2011. Geoinform. Geostat. 2013, 7, 2. [Google Scholar] [CrossRef]
- Rohde, R.; Muller, R.; Jacobsen, R.; Perlmutter, S.; Rosenfeld, A.; Wurtele, J.; Curry, J.; Wickhams, C.; Mosher, S. Berkeley Earth Temperature Averaging Process. Geoinform. Geostat. 2013, 1, 20–100. [Google Scholar] [CrossRef]
- Kubota, T.; Shige, S.; Hashizume, H.; Aonashi, K.; Takahashi, N.; Seto, S.; Hirose, M.; Takayabu, Y.N.; Ushio, T.; Nakagawa, K.; et al. Global Precipitation Map Using Satellite-Borne Microwave Radiometers by the GSMaP Project: Production and Validation. IEEE Trans. Geosci. Remote Sens. 2007, 45, 2259–2275. [Google Scholar] [CrossRef]
- Ushio, T.; Sasashige, K.; Kubota, T.; Shige, S.; Okamoto, K.; Aonashi, K.; Inoue, T.; Takahashi, N.; Iguchi, T.; Kachi, M.; et al. A Kalman Filter Approach to the Global Satellite Mapping of Precipitation (GSMaP) from Combined Passive Microwave and Infrared Radiometric Data. J. Meteorol. Soc. Japan. Ser. II 2009, 87A, 137–151. [Google Scholar] [CrossRef]
- Kachi, M.; Kubota, T.; Ushio, T.; Shige, S.; Kida, S.; Aonashi, K.; Okamoto, K.; Oki, R. Development and Utilization of “JAXA Global Rainfall Watch” System based on Combined Microwave and Infrared Radiometers Aboard Satellites. IEEJ Trans. Fundam. Mater. 2011, 131, 729–737. [Google Scholar] [CrossRef]
- Bugayevskiy, L.M. Map Projections: A Reference Manual, 1st ed.; Routledge: London, UK, 1995. [Google Scholar]
- Breiman, L. Random Forest. Mach. Learn. 2001, 45, 5–32. [Google Scholar] [CrossRef]
- Trenberth, K.E.; Fasullo, J.T.; Kiehl, J. Earth’s Global Energy Budget. Bull. Am. Meteorol. Soc. 2009, 90, 311–324. [Google Scholar] [CrossRef]
- Hartmann, D.L. Global Physical Climatology, 2nd ed.; Elsevier: Amsterdam, The Netherlands, 2016; p. 485. [Google Scholar]
- Baldysz, Z.; Nykiel, G.; Latos, B.; Baranowski, D.B.; Figurski, M. Interannual Variability of the GNSS Precipitable Water Vapor in the Global Tropics. Atmosphere 2021, 12, 1698. [Google Scholar] [CrossRef]
- Reason, C.J.C.; Jagadheesha, D. A model investigation of recent ENSO impacts over southern Africa. Meteorol. Atmos. Phys. 2005, 89, 181–205. [Google Scholar] [CrossRef]
- Lindesay, J.A. South African rainfall, the Southern Oscillation and a Southern Hemisphere semi-annual cycle. J. Climatol. 1988, 8, 17–30. [Google Scholar] [CrossRef]
- Blamey, R.C.; Kolusu, S.R.; Mahlalela, P.; Todd, M.C.; Reason, C.J.C. The role of regional circulation features in regulating El Niño climate impacts over southern Africa: A comparison of the 2015/2016 drought with previous events. Int. J. Climatol. 2018, 38, 4276–4295. [Google Scholar] [CrossRef]
- Ratnam, J.V.; Behera, S.K.; Masumoto, Y.; Yamagata, T. Remote Effects of El Niño and Modoki Events on the Austral Summer Precipitation of Southern Africa. J. Clim. 2014, 27, 3802–3815. [Google Scholar] [CrossRef]
Disclaimer/Publisher’s Note: The statements, opinions and data contained in all publications are solely those of the individual author(s) and contributor(s) and not of MDPI and/or the editor(s). MDPI and/or the editor(s) disclaim responsibility for any injury to people or property resulting from any ideas, methods, instructions or products referred to in the content. |
© 2024 by the authors. Licensee MDPI, Basel, Switzerland. This article is an open access article distributed under the terms and conditions of the Creative Commons Attribution (CC BY) license (https://creativecommons.org/licenses/by/4.0/).