Abstract
Monitoring sea ice in the Arctic region is crucial for polar maritime activities. The Canadian Ice Service (CIS) wants to augment its manual interpretation with machine learning-based approaches due to the increasing data volume received from newly launched synthetic aperture radar (SAR) satellites. However, fully supervised machine learning models require large training datasets, which are usually limited in the sea ice classification field. To address this issue, we propose a semi-supervised interactive system to classify sea ice in dual-pol RADARSAT-2 imagery using limited training samples. First, the SAR image is oversegmented into homogeneous regions. Then, a graph is constructed based on the segmentation results, and the feature set of each node is characterized by a convolutional neural network. Finally, a graph convolutional network (GCN) is employed to classify the whole graph using limited labeled nodes automatically. The proposed method is evaluated on a published dataset. Compared with referenced algorithms, this new method outperforms in both qualitative and quantitative aspects.
1. Introduction
Arctic sea ice plays a vital role in the global climate and local ecosystems. It significantly influences the earth’s radiation balance through its high albedo effect, which involves reflecting a substantial portion of the incoming solar radiation back into the atmosphere. This reflective capability not only reduces energy absorption by the oceans but also mitigates the warming of the polar regions. Furthermore, this dynamic interaction between sea ice and solar radiation helps to stabilize global temperatures and maintain regional climate patterns [1]. Local communities and marine mammals rely on sea ice for hunting, traveling, and other daily activities [2]. Due to global warming, the hlArctic sea ice extent has declined rapidly, at a rate of 13% per decade [3]. The 15 lowest sea ice extent yearly minima on record have all occurred in the past 15 years [4,5]. Nevertheless, with less ice covering the Arctic Ocean, shipping routes that were once inaccessible or dangerous have become more viable, bringing remarkable economic benefits for ocean transportation [6]. The safety of Arctic shipping requires the accurate monitoring of sea ice as well. Therefore, the continuous mapping of sea ice extent and how it changes over time has become a crucial research topic.
Among data collected from different space-borne remote sensors, synthetic aperture radar (SAR) imagery has been demonstrated to be reliable for sea ice remote sensing [7,8]. As an active radar, SAR offers moderate spatial resolution and expansive coverage regardless of polar darkness and weather conditions. To date, national ice agencies, such as the Canadian Ice Service (CIS) in Ottawa, Canada, the US National Ice Center (NIC) in Suitland, USA, and the Greenland Ice Service affiliated to Danish Meteorological Institute (DMI), in Copenhagen, Denmark rely mainly on SAR data to provide information on ice conditions to users in the form of ice charts. A manually drawn ice chart usually covers the ice concentration, stage of development, and form of ice for the matched SAR image. Data collected from sources (e.g., passive microwave data, environmental reanalysis data, and in situ observations) are also used as references for producing ice charts. Although the quality of ice charts is well controlled by ice analysts, the labeling process is labor-intensive and time-consuming, and thus, the number of ice charts that can be produced from SAR images on a given day is limited [9]. Therefore, to produce more ice maps that cover a larger area with higher temporal resolution, it is desirable to have a process in place that can either fully or partially automate the analysis of SAR sea ice imagery [10].
As one of the most important tasks for sea ice mapping, sea ice classification consists of two steps: ice cover detection and ice typing [11]. Although numerous studies for automatic/semi-automatic sea ice cover detection (i.e., ice–water classification) have been presented with high reported classification rates, distinguishing different ice types is a more challenging step. One of the main challenges is the overlapping of backscattering signatures of different sea ice types. For example, at C-band, the HH-polarized microwave backscatter coefficient increases from grey to grey-white ice and then decreases as the ice grows [12]. This indicates that using only backscatter intensity is not sufficient to discriminate sea ice types. Moreover, the statistical non-stationarity introduced by the change in backscatter intensity as a function of the incidence angle causes backscatter variation of any particular sea ice type across the SAR scene [13]. During freeze-up and melt periods, classification becomes increasingly difficult due to wet snow lowering the radar penetration depth, snow metamorphism, and increased ice dynamics [14].
To develop an automatic/partially automatic and robust sea ice classification system that overcomes the aforementioned challenges, researchers have been applying machine learning methods with features extracted from SAR imagery. Polarimetric and textural features derived from the gray-level co-occurrence matrix (GLCM) [15] have been used with classifiers such as the Bayesian classifier [16], decision tree [17], support vector machine (SVM) [18,19], conditional random field (CRF) [20,21,22,23], and Markov random field (MRF) [24]. In recent years, deep learning has become popular in remote sensing from SAR imagery. Among different data-driven deep learning models, convolutional neural networks (CNNs) are widely adopted for sea ice classification [25,26,27,28,29,30,31] and sea ice concentration estimation [9,32,33,34,35]. The ability to learn robust features automatically from a large volume of training data makes the CNN-based model a more preferable choice for sea ice classification compared with traditional machine learning.
However, so far, hlfew CNN-based methods for sea ice classification have been applied for operational sea ice mapping. One reason is that their classification is conducted on a pixel-wise level, which is inconsistent with the ‘polygon’-based format of operational ice charts. Specifically, the ice analyst manually demarcates the full SAR scene into appropriate spatial regions called polygons. Then, the analyst interprets each polygon, assigning codes to define ice concentration and stages of development according to the sea ice nomenclature defined by the World Meteorological Organisation (WMO) in Geneva, Switzerland [36]. Another reason is that due to a lack of sufficient ground-truth pixel-based samples, those CNN-based methods are trained using limited SAR samples. Whether they can produce reliable predictions over the data collected from different times and locations is uncertain. In contrast, an ice chart is required for review by multiple experts before distributing to the public, and an amended or corrected version will be released if necessary [37], which further ensures its reliability.
In contrast to the pixel-level automatic classification that specifies which pixel belongs to which class without quality control, it is worthwhile to pursue a method that provides regional-level (i.e., polygon-based) labels that specify which type of ice is contained in a region. With polygon-based information from ice charts, the region labels are more robust to identification errors and easier to acquire [38]. To tackle with the issue of limited training data, semi-supervised learning has been introduced [39]. Various publications demonstrate that semi-supervised methods, including self-training [40], semi-supervised SVM [41], shared subspace learning [42], and graph-based neural networks [43,44], achieve robust performance when dealing with limited labeled training data. Li et al. [22] presented an ice–water classification method called ST-IRGS, which integrates semantic segmentation, global merging, and self-training. The algorithm outperformed the Gaussian maximum likelihood classier and Gauss-Markov random field on a dual-pol RADARSAT-2 dataset with scarce training samples. Khaleghian et al. [45] reported a teacher–student-based semi-supervised deep learning method to discriminate sea ice types. The proposed method learned sea ice characteristics from limited labeled samples and massive unlabeled samples.
Graph-based neural networks, especially graph convolutional networks (GCNs) [46], stand out from the rest of the semi-supervised methods for classification in remote sensing imagery. Specifically, pixel-based methods cannot capture the inherent geometry and distinct structure in the remote sensing data space. The vertices and edges in a graph naturally represent the topological relationships in the remote sensing imagery, and GCNs can extract non-Euclidean features from each vertex. Moreover, the graph structure in a GCN allows for significant computational cost reduction compared with pixel-based methods. Zhang et al. [47] developed a GCN-based model named SPGCN for hyperspectral image classification. A spatial pooling layer was introduced to the model to reduce the patch size and graph size after each convolutional layer. The model’s performance was evaluated on three hyperspectral datasets, and the results illustrated that SPGCN can achieve competitive accuracy compared with CNN-based models with less runtime. Wang et al. [48] applied broad learning as a fully connected layer to GCN and used an intra-class divergence matrix and an inter-class divergence matrix to train it. The proposed model considered both the inter-class and intra-class spacing of sample features and improved the classification accuracy for hyperspectral images compared with that of a classic GCN.
Therefore, to address these challenges and provide a more robust and efficient pipeline for sea ice monitoring, we propose an interactive sea ice classification method to identify water and three ice types. The method integrates a convolutional neural network (CNN) into a graph convolutional network (GCN) and is named IceGCN. Compared with traditional handcrafted features, e.g., GLCM features, applying the features extracted by CNN improves the classification accuracy and reduces the processing time of feature extraction. Moreover, boundaries between ice and different ice types are preserved by introducing the Iterative Region Growing with Semantics (IRGS) unsupervised segmentation algorithm. Unlike the supervised models used in other studies, a semi-supervised GCN is employed to combine the spatial context features and produce reliable sea ice classification maps using limited labeled samples for operational purposes. The performance of the proposed method is evaluated and compared with benchmark methods on a dual-pol RADARSAT-2 dataset.
2. Materials and Methods
In this section, we present a semi-supervised method that seamlessly combines local spatial characteristics extracted through CNN with global spatial features derived from GCN for the purpose of classifying sea ice. The workflow of our proposed method, named IceGCN, is illustrated in Figure 1. First, the input HH/HV scenes are oversegmented into small homogeneous regions (superpixels) by employing the IRGS algorithm [49]. Subsequently, a graph can be constructed upon these superpixels, wherein the weights between adjacent superpixels are determined by edge strength. Following this step, a pre-trained CNN extracts pixel-level features that are then aggregated by pooling to generate an array of feature vectors, each representing the essence of an individual superpixel. Later, two graph convolutional layers are deployed to study the spatial relationships between superpixels, utilizing a limited amount of labeled data. Finally, a softmax layer is introduced to ingest the outputs of the graph convolutional layers and assign the sea-ice label for each superpixel.
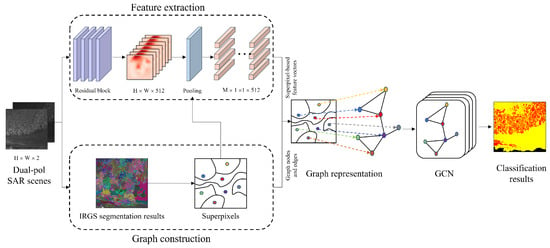
Figure 1.
Workflow diagram of the proposed IceGCN.
2.1. Superpixel Generation
SAR imagery that is commonly utilized for sea ice monitoring often covers broad spatial expanses, with pixel dimensions reaching up to 10,000 by 10,000. Building a graph on such an enormous number of pixels becomes impractical. Thus, we divide the SAR imagery into smaller regions known as superpixels, composed of pixels sharing highly similar characteristics. By constructing a graph on these superpixels, we significantly decrease the required memory space and computational power. The IRGS method, a Markov random field (MRF)-based algorithm specifically designed to provide reliable segmentation in SAR imagery, is utilized to generate superpixels in this study. The segmentation is performed by minimizing an energy function that blends the Gaussian mixture distribution and edge strength. The energy function is defined as follows [49]:
where depicts the Gaussian statistics for pixels x inside regions R generated by the initial watershed segmentation, and accounts for the edge strength between adjacent regions (connected regions).
The original IRGS is applied to the whole SAR scene. However, with the spatial size increases, the incidence angle varies considerably across the SAR scene, causing statistical non-stationarities for each class. Luckily, these non-stationarities only pose issues at larger scales. This characteristic inspires processing SAR images on smaller scales to mitigate incidence angle variation-related challenges. Therefore, a segmentation strategy called ‘glocal’ [50], which combines local details and global statistics, is combined with original IRGS and applied to SAR scenes to generate superpixels.
First, the entire scene is divided into smaller regions, called autopolygons [50], using a modified watershed algorithm [49] with seeds from a 12 × 12 grid. Then, IRGS is applied to each autopolygon individually to produce an oversegmentation, which is the local step of the glocal. Lastly, the global step glues the oversegmentation regions across the full scene, creating larger regions. Such a glocal strategy can provide robust segmentation and divide the full scene into homogeneous regions, called superpixels, with high homogeneity and compactness. Consequently, each superpixel is regarded as a homogeneous entity, representing a node in the graph.
Given a SAR image, , where denotes the HH and HV polarizations for pixels, while N is the number of pixels in the SAR image. The IRGS segmentation algorithm divides the SAR image X into a superpixel set , where is the mth superpixel. represents the number of pixels in the superpixel , and M is the number of superpixels.
In summary, introducing superpixels reduces the computational cost and the processing time of sea ice classification. It also preserves the local structure between homogeneous regions, as the adjacent superpixels with similar features are likely to have the same ice type. Furthermore, the process of generating superpixels and assigning labels to them mirrors the pipeline of creating ice charts: dividing the SAR scene into polygons and determining the ice concentration and stage of development within them.
2.2. CNN-Based Feature Extractor
Upon generating superpixels through the glocal-based IRGS, feature vectors for each superpixel are extracted. Applying the CNN model for feature extraction in the proposed IceGCN is ideal due to its capacity for learning high-level spatial relationships via hierarchical convolutional layers. Generally, the performance and depth of a CNN exhibit a positive correlation. However, as the number of layers increases, minor gradient changes may amplify during backpropagation, resulting in exploding and vanishing gradients. Various alternative models, such as the renowned ResNet [51], have been proposed to address performance degradation in classic CNNs.
ResNet introduces the residual block and identity mapping to tackle the performance degradation issues found in traditional CNNs with deeper architectures. To extract adequate high-level features characterizing the sea ice stage of development for each pixel in the SAR image, the depth of the CNN-based feature extractor must be substantial. There are two main residual blocks, basic block and bottleneck. The bottleneck block is chosen to construct the feature extractor backbone because the bottleneck has fewer trainable parameters and demands less computational power [51]. Figure 2 illustrates the feature extraction module’s architecture and the bottleneck block’s structure as utilized in this study. This architecture bears similarity to the previous research [52], which underwent evaluation for ice–water classification. Owing to the intricate nature of differentiating different sea ice types, the number of output channels of each residual block is quadrupled compared to the input channels, enhancing the model’s complexity. The loss function for this model is the cross-entropy cost function, which is defined as follows
where n is the number of samples in a batch, while y and denote the true and predicted labels, respectively. It is crucial to emphasize that, before integrating with IceGCN, the CNN-based feature extraction module needs to be pre-trained on a distinct dataset.
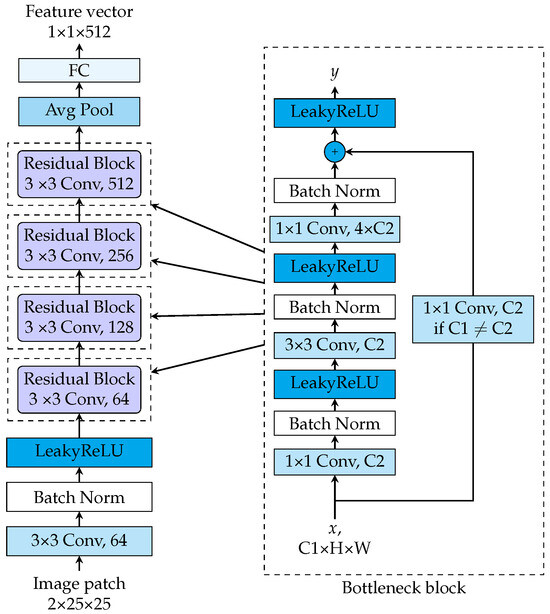
Figure 2.
Architecture of feature extraction module in IceGCN.
2.3. Graph Construction
Given the generated superpixels and the corresponding feature vectors, the specific steps for constructing the graph are described in this subsection.
Unlike images, which are exhibited in the form of a rectangular lattice in the Euclidean plane, graphs usually have irregular shapes and consist of a set of nodes and connecting edges. Let represent an undirected graph, where V is a group of vertices (nodes), and E is a set of edges connecting them. A symmetric sparse matrix called the adjacency matrix (similarity matrix) is used to describe edges between nodes. If any two nodes and are connected by an edge directly, and are considered to be adjacent. represents the weight of between vertices and . The most commonly used definitions of are connectivity and distance. However, neither of these can sufficiently address the relationship between the adjacent vertices. Therefore, a similarity function is proposed to measure the weight between and . in this study is defined as follows:
where and ∈ V, and M is the number of nodes in the graph. is a function that evaluates the similarity between and . Because the Gaussian distribution is often used to model the distribution of the backscatter intensity of sea ice in SAR imagery, relative entropy [53] is selected as the function for , which is defined as follows:
where and are the probability distributions of vertices and . Since we assume that the backscatter intensity of different sea ice types obeys Gaussian distributions in IRGS segmentation, Equation (4) can be rewritten as
where , , , and are means and variances of and , respectively.
2.4. Graph Convolutional Network
After constructing the graph and calculating the feature vectors of vertices, the unlabeled vertices are classified using the label information propagated from the limited labeled ones. A graph convolutional network [46] is applied for label propagation in this study. The computation inside a basic graph convolutional layer is given by:
where and are the input and output of the l-th layer, respectively. denotes the learnable weight matrix of the l-th layer. represents the activation function, which is the rectified linear unit (ReLU) in the proposed model. represents the combinatorial Laplacian matrix, which is defined as
Here, is the diagonal degree matrix of , where . The introduction of adds features of the node itself to the computation when summing up feature vectors of adjacent nodes. However, the combinatorial Laplacian matrix is usually unnormalized, and therefore, the impact of nodes with more neighbors will be amplified when multiplying with all the feature vectors of adjacent nodes. Hence, , a variant of , also known as the symmetric normalized Laplacian matrix, is introduced to replace
where is the adjacency matrix A with added self-looping. is the identity matrix, and denotes the degree matrix of . Therefore, (6) can be rewritten as:
Let feature set represent the extracted features of the superpixel set S, where is the number of features extracted. The feature vector for the mth superpixel is defined as the aggregation of the feature vectors of every pixel inside using averaging pooling. The definition of is elaborated as follows:
In summary, the GCN incorporated in the IceGCN consists of two graph convolutional layers and a softmax layer. Assuming the output of GCN, a vector of sea ice stage of development for superpixels S, is , the architecture of GCN can be formulated as follows:
3. Results and Discussion
In this section, the RADARSAT-2 dual-pol dataset used in this study is delineated, along with the training and testing strategies. The performance of the proposed method is then evaluated and compared with benchmark methods.
3.1. Data Overview
The dataset utilized in this study comprises 18 dual-polarized WideScan RADARSAT-2 scenes. This is the same dataset that has been extensively employed in previous research efforts [50,52], underscoring its proven reliability and relevance to the field. The Beaufort Sea has been one of the most significant areas of Arctic multi-year ice decline during the past few decades, which is a key area for conducting sea ice-related research [54]. The choice of this particular dataset was driven by its detailed ice chart annotations, which were carefully prepared by a retired ice analyst from CIS. These annotations feature smaller polygon sizes and more detailed classifications compared to standard CIS ice charts, significantly enhancing the precision of labeling for training and testing purposes in our study. The robust validation of this dataset in prior studies further assures its suitability for developing and testing advanced classification methods like those presented in our research. Figure 3 presents the geographical distribution of the dataset. Table 1 shows the scene ID, acquisition date and time, and the orbit of the 18 scenes. The incidence angle in each scene varies from to . The size of the original images is around 10,000 by 10,000 pixels. To enhance computational efficiency, 4 × 4 block averaging reduces the image sizes. Post-downsampling, the nominal pixel spacing is 200 m, which still contains much more details than human-created ice charts. The training samples are carefully picked at the superpixel level according to the corresponding ice charts provided by a Canadian Ice Service (CIS) ice analyst. We categorize sea ice as multi-year ice (MYI), first-year ice (FYI), young ice (YI), and open water (OW) in this study.
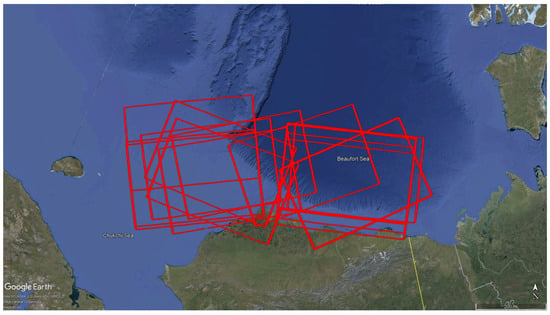
Figure 3.
Location of the Beaufort Sea. Footprints of the 18 RADARSAT-2 scenes used in this work are shown in red.

Table 1.
List of SAR scenes used in this work.
3.2. Sea Ice Appearance in the Dataset
The appearance of sea ice in SAR imagery depends on many factors, including environmental conditions, SAR imaging parameters, and the characteristics of the sea ice itself [55]. Figure 4 shows patch samples of different ice types in HH and HV polarized scenes of the dataset used in this study. Since the SAR sensor transmits horizontal linear microwave and receives both horizontal and vertical returns, the co-polarization (HH) backscatter typically is higher (brighter in the scene) than that of cross-polarization (HV) [56]. OW appears relatively dark in both polarized scenes, particularly in the HV image. This is because the sea reflects most of the microwave signal. Since YI is newly formed and unstable, its surface structures are complex. As shown in Figure 4c,d, there can be numerous fissures and ridges presented in a sample of YI. Fissures and ridges are still noticeable for first-year ice, and ice floes start to appear in the scene. Compared with other sea ice types, MYI is recognizable in both polarized scenes, particularly in HV images. As sea ice ages, it naturally drains brine to decrease its salinity. Such a change allows the C-band SAR signal to penetrate the ice and generate volume scattering that characterizes the older ice.
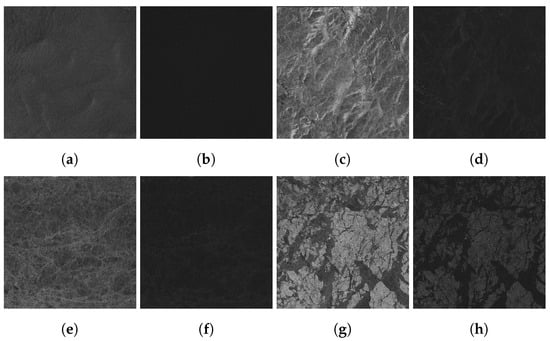
Figure 4.
Different stages of development of ice in patches cropped from HH an HV polarized scenes in the same location. Open water in HH (a) and HV (b). Young ice in HH (c) and HV (d). First-year ice in HH (e) and HV (f). Multi-year ice in HH (g) and HV (h).
In addition, influences such as temperature and humidity changes may create melt ponds that obscure ice completely. The presence of wet snow will also affect the penetration depth of microwaves, also which will also mask the ice backscatter characteristics. Wind over open water increases its roughness and backscatter characteristics [57]. Lower temperature contributes to higher backscatter, while the presence of wet snow caused by higher temperature usually reduces it [55].
3.3. Experimental Setup
Experiments are conducted on a workstation with an Intel(R) Core(TM) i9-9920X CPU @ 3.50 GHz × 24 threads, 128 GB RAM, and three GeForce GTX 2080Ti GPUs with 12 GB of memory. All the deep learning models are implemented using PyTorch, and the IRGS segmentation algorithm is delivered by the MAp-Guided Ice Classification (MAGIC) system [58].
For the development and validation of the IceGCN model, we strategically divide the 18-scene dataset into two subsets to ensure robust training and validation while preventing bias from using samples from the same scene for both training and testing. Dataset-1, which includes 13 scenes, is used for training, validating, and testing the feature extraction module integral to IceGCN. This division allows the feature extraction module to learn diverse features representative of general sea ice conditions without the risk of overfitting to specific scenes.
Dataset-2, consisting of the remaining five scenes, is designated for the final evaluation of the IceGCN and for comparison with other methods. This separation ensures that IceGCN is tested on completely unseen data, thereby providing a genuine measure of its generalization capabilities. To prepare for evaluation, SAR scenes in Dataset-2 are segmented into homogeneous superpixels. A random selection of these superpixels is then labeled for use in testing the model’s performance. Details regarding the number of superpixels used for training and testing within Dataset-2 are outlined in Table 2.

Table 2.
Number of superpixels for training and testing in Dataset-2.
The accuracy of the IceGCN model is evaluated using a semi-supervised training approach. In this setup, IceGCN is trained using labeled samples from Dataset-2, while its feature extraction module is pre-trained on Dataset-1. This arrangement leverages the pre-learned features effectively while avoiding data leakage. The model’s performance is assessed on each scene in Dataset-2, denoted as C, by comparing its classifications with the ground truth labels and quantifying the results using overall accuracy. The overall accuracy is defined as the ratio of correctly predicted observations to the total observations and is particularly valuable in sea ice classification settings. It gives a straightforward indication of the model’s ability to classify each scene correctly.
In contrast, benchmarking methods that employ fully supervised learning are initially trained on Dataset-1 and subsequently fine-tuned with samples from Dataset-2. This structured approach ensures that all models are evaluated under equivalent conditions, allowing for a fair and comprehensive comparison of their ability to classify sea ice from SAR imagery.
Classification models trained using a random forest (RF) algorithm and a CNN (ResNet) are chosen for comparison with the proposed methods in this study. The ResNet model shares the same architecture as the feature extraction module in IceGCN, except a softmax layer is added to ResNet for predicting. To train the RF-based model, GLCM features are extracted, which consist of angular second moment, contrast, correlation, dissimilarity, entropy, homogeneity, inverse moment, mean, and standard deviation with receptive field and step sizes listed in Table 3. The hyperparameters of RF are set as follows using a cross-validation-based grid search [52]: the number of trees = 250, max depth = 10, and minimum samples per leaf = 2.

Table 3.
GLCM parameters used to train the RF model in the study.
3.4. Experimental Results
The experimental results are presented in two ways. First, the classification accuracy of RF, IRGS-RF [52], ResNet, IRGS-ResNet [59], and IceGCN is computed based on the correctly classified sample pixel count, providing a quantitative performance evaluation of the proposed methods against benchmarking methods. Second, a visual analysis of the classification maps generated by RF, IRGS-RF, ResNet, IRGS-ResNet, and IceGCN offers insights into the qualitative performance of IceGCN and the comparative methods for real-world operational applications.
The quantitative results obtained by RF, IRGS-RF, ResNet, IRGS-ResNet, and IceGCN are reported in terms of classification accuracy in Table 4, where the highest accuracies among all methods for each scene are highlighted in bold for each row. In general, the proposed IceGCN achieves the best classification performance with an average/overall accuracy of 95.54%, where the accuracies of each scene are 91.20%, 97.52%, 96.39%, 95.61%, and 95.77%, respectively. Unsurprisingly, the performance of IceGCN is generally superior to that of the comparison methods because both local and global spatial information is utilized for classification. IceGCN outperforms other methods in all scenes in the test dataset (Dataset-2), demonstrating the robustness of the proposed method.

Table 4.
Classification accuracy of RF, IRGS-RF, ResNet, IRGS-ResNet, and IceGCN.
Comparing the two benchmark methods shows that the ResNet outperforms RF in three out of four scenes. In detail, RF acquires an overall accuracy of 80.00%, where the accuracies of each scene are 68.35%, 87.08%, 82.46%, 83.57%, and 72.44%, respectively. Although RF delivers relatively good results in distinguishing FYI and OW, it misclassifies MYI to FYI in most scenes, especially the scene captured on 18 April 2010. In contrast, ResNet achieves an overall accuracy of 84.56% without a significant performance drop in any sea ice type. The classification accuracies of each scene are 83.30%, 82.62%, 87.42%, 85.94%, and 86.12%, respectively. The quantitative results indicate that ResNet is a better method when only considering pixel-wise classifiers for operational sea ice monitoring. For two-stage models, IRGS-ResNet achieves better classification performance than IRGS-RF, with an overall accuracy of 86.09%.
Since quantitative classification rates are calculated using limited labeled data, visually inspecting classification maps provides an intuitive basis for performance evaluation. Classification results of the scene acquired on 18 April 2010 are presented in Figure 5. Because RF and ResNet do not have any prior knowledge about the testing scene, they treat each scene equally. RF and ResNet misclassify some regions into YI, which does not appear in this scene. In contrast, IceGCN does not suffer from this problem, owing to the prior knowledge introduced by the limited labeled sample of the scene, i.e., human interactions. Figure 5d demonstrates that significant misclassifications of MYI are presented in the classification maps produced by RF, especially in the upper part of the scene.
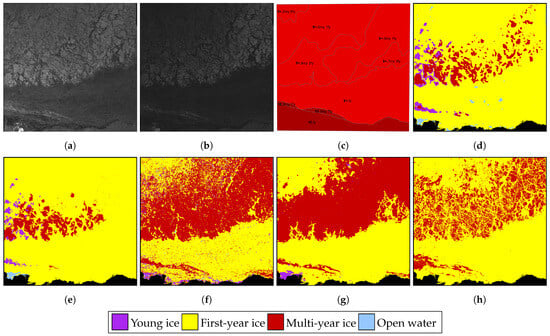
Figure 5.
Classification results for the scene obtained on 18 April 2010 (scene ID: 20100418). (a) HH polarization, (b) HV polarization, (c) Ice chart, (d) RF, (e) IRGS-RF, (f) ResNet, (g) IRGS-ResNet, (h) IceGCN.
Although IRGS-RF enhances the quality of the sea ice map in Figure 5e by properly classifying regions near sea ice boundaries and suppressing the misclassification of YI, the classification maps produced by RF-based models have the worst visual quality. This reveals that the RF with handcrafted features is inadequate for discriminating sea ice types in complex scenes. The classification map of ResNet in Figure 5f is improved compared with that of RF. However, large-scale salt-and-pepper-like classification errors appear over the whole image, which is caused by the fact that ResNet does not capture the contextual information of the center pixel. After integrating with segmentation results, IRGS-ResNet eliminates most salt-and-pepper classification noise in Figure 5g. However, the FYI formed from frozen leads among MYI is missing since it is not preserved in the results of ResNet. Compared with other methods, the proposed IceGCN removes salt-and-pepper classification noise while preserving the edges and boundaries between different sea ice types that are accurately labeled.
Figure 6 shows the results of the scene collected on 24 May 2010. The misclassifications of YI arise again in the classification maps of RF and ResNet. The salt-and-pepper classification noise is severe in the result of ResNet, though the outlines of major sea ice regions are mostly preserved. These similar classification errors are also present in the classification map of IRGS-ResNet since the proposed method’s infrastructure is based on ResNet. Fortunately, the superpixels generated by IRGS suppress the salt-and-pepper classification noise and contribute to a smoother, more appealing result than that of ResNet. The result of RF containing much less noise-like misclassification is attributed to the multi-scale spatial context information captured in the GLCM features.
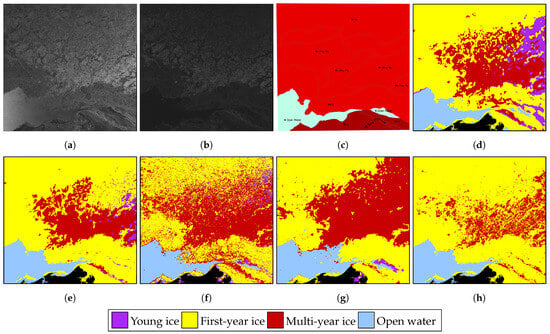
Figure 6.
Classification results for the scene obtained on 24 May 2010 (scene ID: 20100524). (a) HH polarization, (b) HV polarization, (c) Ice chart, (d) RF, (e) IRGS-RF, (f) ResNet, (g) IRGS-ResNet, and (h) IceGCN.
Figure 7 presents another instance underscoring the superiority of IceGCN. Captured during the freeze-up season on 27 October 2010, this scene exhibits considerable incidence angle variation. Notably, water, more susceptible to incidence angle variation than sea ice, appears markedly brighter at lower incidence angles (left side of the scene) compared to higher incidence angles (right side of the scene). The ice-covered area features fissures, ridges, and freezing-up leads, complicating the differentiation of YI and FYI for benchmarking methods. RF faces challenges in distinguishing YI, misclassifying nearly half of it as FYI, although IRGS-RF slightly mitigates the misclassification. ResNet and IRGS-ResNet more effectively classify YI but falter in predicting MYI due to the sparse presence of MYI in the scene and the similar backscatter characteristics of MYI and YI. In contrast, IceGCN attains significantly higher accuracy in classifying YI, owing to the human interaction that eliminates FYI from the training data. Nonetheless, the limited MYI samples—five for training and eleven for testing—result in a suboptimal classification accuracy of 65.15% for MYI. Despite this, IceGCN still surpasses the benchmarking methods by a substantial margin in overall accuracy.
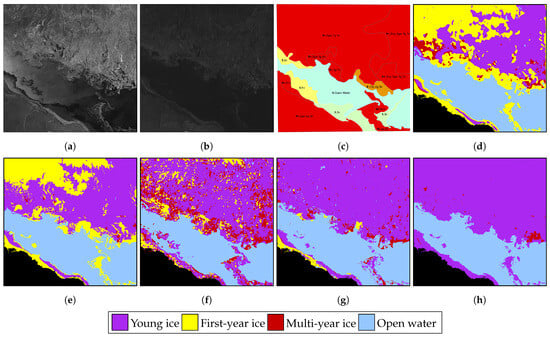
Figure 7.
Classification results for the scene obtained on 27 October 2010 (scene ID: 20101027). (a) HH polarization, (b) HV polarization, (c) Ice chart, (d) RF, (e) IRGS-RF, (f) ResNet, (g) IRGS-ResNet, and (h) IceGCN.
The performance of IceGCN is also assessed using various training sample quantities. Training samples per class are randomly chosen, ranging from 20% to 100% of the available samples, in increments of 20%. Figure 8 illustrates the classification accuracies. A marked enhancement in classification accuracy is discernible as the training sample ratio advances from 20% to 60%. Beyond the 60% threshold, the increasing trend plateaus—except for MYI in scene 20101027, where an extremely limited number of samples exist. These findings demonstrate that IceGCN can produce remarkable classification outcomes even when constrained by a limited pool of labeled samples.
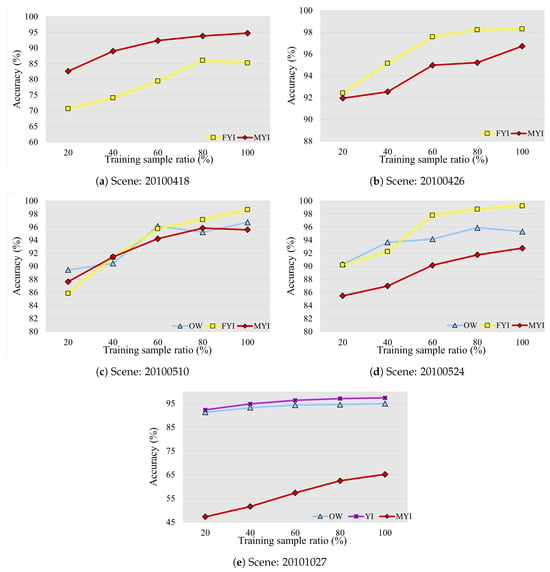
Figure 8.
Classification accuracy of IceGCN on Dataset-2 with different training sample ratios.
4. Conclusions
The IRGS segmentation-generated superpixels maintain homogeneity, preserving edges and boundaries among various sea ice types. Additionally, GCN propagates feature information from labeled nodes, classifying unlabeled nodes in the graph. Consequently, a graph-based method, IceGCN, is demonstrated to improve the sea ice classification accuracy using RADARSAT-2 duel-pol scenes. IceGCN consists of three primary components: superpixel generation, feature extraction, and graph convolution. The experimental results demonstrate that the proposed method outperforms the other comparison methods in both quantitative and qualitative assessments.
Due to the semi-supervised nature of IceGCN, human involvement is necessary to supply the initial training samples for each SAR image. This process constrains the distribution of sea ice within the scene and minimizes the misclassification of non-existent sea ice types. This characteristic is similar to the procedure of how human experts generate sea ice charts. Experimental findings indicate that classification maps created by IceGCN are more natural, precise, and potentially better suited for operational use than those generated by benchmarking methods. Furthermore, IceGCN demands only a limited number of training samples to predict a SAR scene. Typically, the labeling process takes an ice expert under five minutes, resulting in a substantial time reduction compared to the prevailing human-centric pipeline.
In future work, more ablation studies can be conducted to investigate the contributions of the components in IceGCN. Potential investigations may involve testing different superpixel generation and feature extraction algorithms. Moreover, IceGCN currently focuses on local relations for adjacency matrix construction, so exploring the integration of local and global information for graph construction may prove insightful.
Author Contributions
Conceptualization, M.J. and X.C.; methodology, M.J. and X.C.; software, M.J.; validation, M.J.; formal analysis, M.J.; investigation, M.J.; resources, M.J.; data curation, M.J.; writing—original draft preparation, M.J.; writing—review and editing, X.C.; visualization, M.J.; supervision, L.X. and D.A.C.; project administration, D.A.C.; funding acquisition, D.A.C. All authors have read and agreed to the published version of the manuscript.
Funding
This research was funded by the Natural Sciences and Engineering Research Council of Canada (NSERC) under Grant RGPIN-2017-04869, Grant DGDND-2017-00078, Grant RGPAS2017-50794 and Grant RGPIN-2019-06744.
Data Availability Statement
The RADARSAT-2 dataset used in this article is the copyright of MacDonald, Dettwiler and Associates Limited (MDA) and not publicly accessible at this time. However, the authors are discussing with MDA to release the dataset for research purposes.
Conflicts of Interest
The authors declare no conflicts of interest.
References
- Hudson, S.R. Estimating the global radiative impact of the sea ice–albedo feedback in the Arctic. J. Geophys. Res. Atmos. 2011, 116, 16. [Google Scholar] [CrossRef]
- Vihma, T. Effects of Arctic sea ice decline on weather and climate: A review. Surv. Geophys. 2014, 35, 1175–1214. [Google Scholar] [CrossRef]
- Bobylev, L.P.; Miles, M.W. Sea ice in the Arctic paleoenvironments. In Sea Ice in the Arctic; Springer: Berlin/Heidelberg, Germany, 2020; pp. 9–56. [Google Scholar] [CrossRef]
- Perovich, D.; Meier, W.; Tschudi, M.; Hendricks, S.; Petty, A.; Divine, D.; Farrell, S.; Gerland, S.; Haas, C.; Kaleschke, L.; et al. Arctic Report Card 2020: Sea Ice; Technical Report; National Oceanic and Atmospheric Administration: Washington, DC, USA, 2020. [CrossRef]
- Moon, T.A.; Druckenmiller, M.L.; Thoman, R.L. 2021: Arctic Report Card; Technical Report; National Oceanic and Atmospheric Administration: Washington, DC, USA, 2021. [CrossRef]
- Li, X.M.; Qiu, Y.; Wang, Y.; Huang, B.; Lu, H.; Chu, M.; Fu, H.; Hui, F. Light from space illuminating the polar silk road. Int. J. Digit. Earth 2022, 15, 2028–2045. [Google Scholar] [CrossRef]
- Walker, N.P.; Partington, K.C.; Van Woert, M.L.; Street, T.L. Arctic sea ice type and concentration mapping using passive and active microwave sensors. IEEE Trans. Geosci. Remote Sens. 2006, 44, 3574–3584. [Google Scholar] [CrossRef]
- Karvonen, J. Baltic sea ice concentration estimation using Sentinel-1 SAR and AMSR2 microwave radiometer data. IEEE Trans. Geosci. Remote Sens. 2017, 55, 2871–2883. [Google Scholar] [CrossRef]
- Malmgren-Hansen, D.; Pedersen, L.T.; Nielsen, A.A.; Kreiner, M.B.; Saldo, R.; Skriver, H.; Lavelle, J.; Buus-Hinkler, J.; Krane, K.H. A convolutional neural network architecture for Sentinel-1 and AMSR2 data fusion. IEEE Trans. Geosci. Remote Sens. 2020, 59, 1890–1902. [Google Scholar] [CrossRef]
- Asadi, N.; Scott, K.A.; Komarov, A.S.; Buehner, M.; Clausi, D.A. Evaluation of a Neural Network With Uncertainty for Detection of Ice and Water in SAR Imagery. IEEE Trans. Geosci. Remote Sens. 2020, 59, 247–259. [Google Scholar] [CrossRef]
- Lyu, H.; Huang, W.; Mahdianpari, M. A Meta-Analysis of Sea Ice Monitoring Using Spaceborne Polarimetric SAR: Advances in the Last Decade. IEEE J. Sel. Topics Appl. Earth Observ. Remote Sens. 2022, 15, 6158–6179. [Google Scholar] [CrossRef]
- Mahmud, M.S.; Nandan, V.; Singha, S.; Howell, S.E.; Geldsetzer, T.; Yackel, J.; Montpetit, B. C-and L-band SAR signatures of Arctic sea ice during freeze-up. Remote Sens. Environ. 2022, 279, 113129. [Google Scholar] [CrossRef]
- Makynen, M.; Manninen, A.T.; Simila, M.; Karvonen, J.A.; Hallikainen, M.T. Incidence angle dependence of the statistical properties of C-band HH-polarization backscattering signatures of the Baltic Sea ice. IEEE Trans. Geosci. Remote Sens. 2002, 40, 2593–2605. [Google Scholar] [CrossRef]
- Kortum, K.; Singha, S.; Spreen, G. Robust Multiseasonal Ice Classification From High-Resolution X-Band SAR. IEEE Trans. Geosci. Remote Sens. 2022, 60, 1–12. [Google Scholar] [CrossRef]
- Clausi, D.A. An analysis of co-occurrence texture statistics as a function of grey level quantization. Can. J. Remote Sens. 2002, 28, 45–62. [Google Scholar] [CrossRef]
- Lohse, J.; Doulgeris, A.P.; Dierking, W. Mapping sea-ice types from Sentinel-1 considering the surface-type dependent effect of incidence angle. Ann. Glaciol. 2020, 61, 260–270. [Google Scholar] [CrossRef]
- Lohse, J.; Doulgeris, A.P.; Dierking, W. An optimal decision-tree design strategy and its application to sea ice classification from SAR imagery. Remote Sens. 2019, 11, 1574. [Google Scholar] [CrossRef]
- Liu, H.; Guo, H.; Zhang, L. SVM-based sea ice classification using textural features and concentration from RADARSAT-2 dual-pol ScanSAR data. IEEE J. Sel. Top. Appl. Earth Observ. Remote Sens. 2014, 8, 1601–1613. [Google Scholar] [CrossRef]
- Zakhvatkina, N.; Korosov, A.; Muckenhuber, S.; Sandven, S.; Babiker, M. Operational algorithm for ice–water classification on dual-polarized RADARSAT-2 images. Cryosphere 2017, 11, 33–46. [Google Scholar] [CrossRef]
- Zhu, T.; Li, F.; Heygster, G.; Zhang, S. Antarctic Sea-Ice Classification Based on Conditional Random Fields From RADARSAT-2 Dual-Polarization Satellite Images. IEEE J. Sel. Top. Appl. Earth Observ. Remote Sens. 2016, 9, 2451–2467. [Google Scholar] [CrossRef]
- Wang, L.; Wong, A.; Clausi, D.A.; Scott, A.K.; Xu, L.; Shafiee, M.J.; Li, F. Sea ice concentration estimation from satellite SAR imagery using convolutional neural network and stochastic fully connected conditional random field. In Proceedings of the CVPR 2015 Earthvision Workshop, Citeseer, Boston, MA, USA, 11–12 June 2015. [Google Scholar]
- Li, F.; Clausi, D.A.; Wang, L.; Xu, L. A semi-supervised approach for ice-water classification using dual-polarization SAR satellite imagery. In Proceedings of the IEEE Conference on Computer Vision and Pattern Recognition Workshops, Boston, MA, USA, 7–12 June 2015; pp. 28–35. [Google Scholar] [CrossRef]
- Zhang, Y.; Zhu, T.; Spreen, G.; Melsheimer, C.; Huntemann, M.; Hughes, N.; Zhang, S.; Li, F. Sea ice and water classification on dual-polarized Sentinel-1 imagery during melting season. Cryosphere Discuss. 2021, 2021, 1–26. [Google Scholar] [CrossRef]
- Ochilov, S.; Clausi, D.A. Operational SAR sea-ice image classification. IEEE Trans. Geosci. Remote Sens. 2012, 50, 4397. [Google Scholar] [CrossRef]
- Boulze, H.; Korosov, A.; Brajard, J. Classification of sea ice types in Sentinel-1 SAR data using convolutional neural networks. Remote Sens. 2020, 12, 2165. [Google Scholar] [CrossRef]
- Han, Y.; Liu, Y.; Hong, Z.; Zhang, Y.; Yang, S.; Wang, J. Sea Ice Image Classification Based on Heterogeneous Data Fusion and Deep Learning. Remote Sens. 2021, 13, 592. [Google Scholar] [CrossRef]
- De Gelis, I.; Colin, A.; Longépé, N. Prediction of categorized Sea Ice Concentration from Sentinel-1 SAR images based on a Fully Convolutional Network. IEEE J. Sel. Top. Appl. Earth Observ. Remote Sens. 2021, 14, 5831–5841. [Google Scholar] [CrossRef]
- Khaleghian, S.; Ullah, H.; Kræmer, T.; Hughes, N.; Eltoft, T.; Marinoni, A. Sea Ice Classification of SAR Imagery Based on Convolution Neural Networks. Remote Sens. 2021, 13, 1734. [Google Scholar] [CrossRef]
- Zhang, J.; Zhang, W.; Hu, Y.; Chu, Q.; Liu, L. An improved sea ice classification algorithm with Gaofen-3 dual-polarization SAR data based on deep convolutional neural networks. Remote Sens. 2022, 14, 906. [Google Scholar] [CrossRef]
- Song, W.; Li, M.; Gao, W.; Huang, D.; Ma, Z.; Liotta, A.; Perra, C. Automatic Sea-Ice Classification of SAR Images Based on Spatial and Temporal Features Learning. IEEE Trans. Geosci. Remote Sens. 2021, 59, 9887–9901. [Google Scholar] [CrossRef]
- Chen, X.; Scott, K.A.; Jiang, M.; Fang, Y.; Xu, L.; Clausi, D.A. Sea ice classification with dual-polarized SAR imagery: A hierarchical pipeline. In Proceedings of the IEEE/CVF Winter Conference on Applications of Computer Vision, Waikoloa, HI, USA, 2–7 January 2023; pp. 224–232. [Google Scholar]
- Stokholm, A.; Wulf, T.; Kucik, A.; Saldo, R.; Buus-Hinkler, J.; Hvidegaard, S.M. AI4SeaIce: Toward Solving Ambiguous SAR Textures in Convolutional Neural Networks for Automatic Sea Ice Concentration Charting. IEEE Trans. Geosci. Remote Sens. 2022, 60, 1–13. [Google Scholar] [CrossRef]
- Kucik, A.; Stokholm, A. AI4SeaIce: Selecting loss functions for automated SAR sea ice concentration charting. Sci. Rep. 2023, 13, 5962. [Google Scholar] [CrossRef]
- Karvonen, J. Baltic Sea Ice Concentration Estimation From C-Band Dual-Polarized SAR Imagery by Image Segmentation and Convolutional Neural Networks. IEEE Trans. Geosci. Remote Sens. 2021, 60, 1–11. [Google Scholar] [CrossRef]
- Yan, Q.; Huang, W. Sea ice sensing from GNSS-R data using convolutional neural networks. IEEE Geosci. Remote Sens. Lett. 2018, 15, 1510–1514. [Google Scholar] [CrossRef]
- Joint WMO-IOC Technical Commission for Oceanography and Marine Meteorology. Ice chart colour code standard, version 1.0, 2014. In Technical Report (WMO TD: 1215b); World Meteorological Organization & Intergovernmental Oceanographic Commission: Geneva, Switzerland, 2014. [Google Scholar] [CrossRef]
- Manual of Ice (MANICE). Chapter 5: Ice Analysis Charts. 2016. Available online: https://www.canada.ca/en/environment-climate-change/services/weather-manuals-documentation/manice-manual-of-ice/chapter-5.html (accessed on 25 December 2021).
- Xu, L.; Clausi, D.A.; Li, F.; Wong, A. Weakly supervised classification of remotely sensed imagery using label constraint and edge penalty. IEEE Trans. Geosci. Remote Sens. 2016, 55, 1424–1436. [Google Scholar] [CrossRef]
- Hong, D.; Yokoya, N.; Xia, G.S.; Chanussot, J.; Zhu, X.X. X-ModalNet: A semi-supervised deep cross-modal network for classification of remote sensing data. ISPRS J. Photogramm. Remote Sens. 2020, 167, 12–23. [Google Scholar] [CrossRef] [PubMed]
- Wu, Y.; Mu, G.; Qin, C.; Miao, Q.; Ma, W.; Zhang, X. Semi-supervised hyperspectral image classification via spatial-regulated self-training. Remote Sens. 2020, 12, 159. [Google Scholar] [CrossRef]
- Yang, L.; Yang, S.; Jin, P.; Zhang, R. Semi-supervised hyperspectral image classification using spatio-spectral Laplacian support vector machine. IEEE Geosci. Remote Sens. Lett. 2013, 11, 651–655. [Google Scholar] [CrossRef]
- Zhao, X.; Liu, L.; Wang, Y.; Zhang, L.; Plaza, A. DS4L: Deep Semisupervised Shared Subspace Learning for Hyperspectral Image Classification. IEEE Trans. Geosci. Remote Sens. 2021, 60, 1–14. [Google Scholar] [CrossRef]
- Shao, Y.; Sang, N.; Gao, C.; Ma, L. Spatial and class structure regularized sparse representation graph for semi-supervised hyperspectral image classification. Pattern Recognit. 2018, 81, 81–94. [Google Scholar] [CrossRef]
- Zhao, Y.; Su, F.; Yan, F. Novel semi-supervised hyperspectral image classification based on a superpixel graph and discrete potential method. Remote Sens. 2020, 12, 1528. [Google Scholar] [CrossRef]
- Khaleghian, S.; Ullah, H.; Krmer, T.; Eltoft, T.; Marinoni, A. Deep Semi-Supervised Teacher-Student Model based on Label Propagation for Sea Ice Classification. IEEE J. Sel. Top. Appl. Earth Observ. Remote Sens. 2021, 14, 10761–10772. [Google Scholar] [CrossRef]
- Kipf, T.N.; Welling, M. Semi-supervised classification with graph convolutional networks. arXiv 2016, arXiv:1609.02907. [Google Scholar]
- Zhang, X.; Chen, S.; Zhu, P.; Tang, X.; Feng, J.; Jiao, L. Spatial Pooling Graph Convolutional Network for Hyperspectral Image Classification. IEEE Trans. Geosci. Remote Sens. 2022, 60, 1–15. [Google Scholar] [CrossRef]
- Wang, Z.; Li, J.; Zhang, T.; Yuan, S. Spectral–spatial discriminative broad graph convolution networks for hyperspectral image classification. Int. J. Mach. Learn. Cybern. 2022, 14, 1–15. [Google Scholar] [CrossRef]
- Yu, Q.; Clausi, D.A. IRGS: Image segmentation using edge penalties and region growing. IEEE Trans. Pattern Anal. Mach. Intell. 2008, 30, 2126–2139. [Google Scholar] [CrossRef] [PubMed]
- Leigh, S.; Wang, Z.; Clausi, D.A. Automated ice–water classification using dual polarization SAR satellite imagery. IEEE Trans. Geosci. Remote Sens. 2014, 52, 5529–5539. [Google Scholar] [CrossRef]
- He, K.; Zhang, X.; Ren, S.; Sun, J. Deep residual learning for image recognition. In Proceedings of the IEEE Conference on Computer Vision and Pattern Recognition (CVPR), Honolulu, HI, USA, 18–20 June 2016; pp. 770–778. [Google Scholar]
- Jiang, M.; Clausi, D.A.; Xu, L. Sea Ice Mapping of RADARSAT-2 Imagery by Integrating Spatial Contexture with Textural Features. IEEE J. Sel. Top. Appl. Earth Observ. Remote Sens. 2022, 15, 7964–7977. [Google Scholar] [CrossRef]
- Kullback, S.; Leibler, R.A. On information and sufficiency. Ann. Math. Stat. 1951, 22, 79–86. [Google Scholar] [CrossRef]
- Huang, Y.; Ren, Y.; Li, X. Deep learning techniques for enhanced sea-ice types classification in the Beaufort Sea via SAR imagery. Remote Sens. Environ. 2024, 308, 114204. [Google Scholar] [CrossRef]
- Hall, D. Remote Sensing of Ice and Snow; Springer Science & Business Media: Berlin/Heidelberg, Germany, 2012. [Google Scholar] [CrossRef]
- Johannessen, O.M. Annex: SAR sea ice interpretation guide. In Sea Ice in the Arctic; Springer: Berlin/Heidelberg, Germany, 2020; pp. 507–573. [Google Scholar] [CrossRef]
- Massom, R.; Lubin, D. Polar Remote Sensing; Springer: Berlin/Heidelberg, Germany, 2006; Volume 2. [Google Scholar] [CrossRef]
- Clausi, D.; Qin, A.; Chowdhury, M.; Yu, P.; Maillard, P. MAGIC: MAp-guided ice classification system. Can. J. Remote Sens. 2010, 36, S13–S25. [Google Scholar] [CrossRef]
- Jiang, M.; Xu, L.; Clausi, D.A. Sea Ice–Water Classification of RADARSAT-2 Imagery Based on Residual Neural Networks (ResNet) with Regional Pooling. Remote Sens. 2022, 14, 3025. [Google Scholar] [CrossRef]
Disclaimer/Publisher’s Note: The statements, opinions and data contained in all publications are solely those of the individual author(s) and contributor(s) and not of MDPI and/or the editor(s). MDPI and/or the editor(s) disclaim responsibility for any injury to people or property resulting from any ideas, methods, instructions or products referred to in the content. |
© 2024 by the authors. Licensee MDPI, Basel, Switzerland. This article is an open access article distributed under the terms and conditions of the Creative Commons Attribution (CC BY) license (https://creativecommons.org/licenses/by/4.0/).