Abstract
Understanding on the spatiotemporal interactions between ecosystem services (ESs) and social–ecological drivers is crucial for the design of sustainable development strategies for coastal wetlands. In this paper, we took the Yellow River Delta (YRD) as a case study, based on multiple evaluation methods to study the spatiotemporal dynamics of ESs in the YRD from 1980 to 2020. With the help of principal component analysis (PCA) for identification of multiple drivers, we researched the spatiotemporal differentiation and influence mechanism of drivers on ESs, using the coupling coordination degree (CCD) model and geographically and temporally weighted regression (GTWR) model, and subsequently provided the development strategy for each district in Dongying City. The results showed that (1) the patterns of ESs were spatially heterogeneous, with a fluctuating upward trend from 1980 to 2020, which was mainly affected by regulating service. (2) Our spatiotemporal analysis of ES interactions identified that cultural service was mainly disorder with other ESs. Nevertheless, in wetlands, various ESs can basically develop in a coordinated manner. (3) We integrated multiple drivers into five principal components by PCA, to which the response of ESs had spatial heterogeneity. (4) Consequently, we integrated spatiotemporal knowledge on ES interactions and their drivers into spatial planning.
1. Introduction
Coastal wetland ecosystems provide a wealth of ecosystem goods and services to human societies [1], and directly or indirectly may facilitate sustainable human well-being [2,3], but coastal wetland ecosystems are also under serious threat from natural and human disturbances [4,5], such as sea level rise, reclamation [6], overuse [5], pollution, coastal erosion [7], and biological invasion [8]. Parallel with that, coastal wetland ecosystem services (ESs) are at risk of developmental dissonance between them [9], which not only results in the loss of coastal wetland ecosystem diversity [7], but also seriously weakens coastal wetland ESs [10]. In order to ensure the ability to provide human well-being continuously and examine the coordinated development level of urbanization and ESs, it is of great significance to assess the value of coastal wetland ESs scientifically [11], and explore the impact of social–ecological drivers on ESs, whose spatial heterogeneity can be conducive to a more efficient coastal resources development strategy, to ensure the better sustainable use of coastal resources [12].
Dongying City, located in the north of Shandong Province, is in the junction region of rivers, land, and sea, as a typical ecological transition zone. Over the past decades of reform and opening up, the land use/land cover (LULC) of Dongying City has undergone tremendous changes, and is currently the petrochemical base of Shandong Province, with a large number of industrial construction lands [11]. In particular, with strong human interference, as an important part of the Yellow River Delta (YRD), Dongying City has the social–economic conditions directly relating to the Yellow River estuary and also has a great impact on the whole Shandong Province, which faces major ecological problems, such as salinization and vegetation destruction [11,13]. Therefore, this paper selected Dongying City, a typical municipal area where the YRD is located, as the study area.
The previous studies on the trade-offs/synergies between ESs poorly understood the spatial dynamics of coupled coordination among complex systems, so the coordination degree between ESs has not yet been fully investigated [14]. In view of this research gap, this study evaluated the interactions and coupled coordination of ESs in the YRD from 1980 to 2020 using the coupled coordination degree (CCD) model. Moreover, the correlation between drivers has largely been ignored by previous studies [15,16], which may lead to information redundancy, resulting in the complexity and uncertainty of subsequent analysis. Principal component analysis (PCA) can transform a group of related variables into a group of unrelated principal components (PCs), reducing information redundancy while maintaining the original information as much as possible, which reduces the calculation workload and increases the accuracy of subsequent analysis [17]. Consequently, multiple drivers summarized by this paper were transformed into several unrelated PCs by PCA, eliminating the impact of correlation between them. In addition, the analysis of coastal wetland ESs should consider not only the spatial heterogeneity of regionalization process variables, but also their temporal unsteadiness, which was what previous studies [18,19,20] lacked for comprehensive consideration. This study incorporated the geographically and temporally weighted regression (GTWR) model, which could reveal the spatiotemporal response characteristics of the regional ESs to the drivers more comprehensively [21], so as to provide theoretical support for the development of regionally ecological conservation measures.
The objectives of this study were to (1) reveal the spatiotemporal dynamics of ESs in the YRD from 1980 to 2020; (2) determine the spatial heterogeneity of trade-offs/synergies and CCD between ESs; (3) identify the dominant social–ecological drivers of ESs, as well as their spatial heterogeneity; (4) provide insights into the spatial planning and management strategies of Dongying City. The research framework diagram of this study is shown in Figure 1.
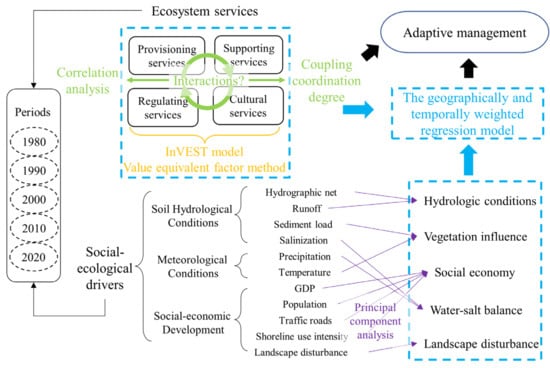
Figure 1.
Research framework diagram. Green symbols represent the estimation method of the interaction of ecosystem services; yellow symbols represent the estimation method of ecosystem services; purple symbols represent principal component analysis; blue symbols represent geographically and temporally weighted regression model.
2. Materials and Methods
2.1. Study Area
Considering the integrity of the administrative region and the availability of research data, the entire Dongying city was taken as the study area in this study (Figure 2).
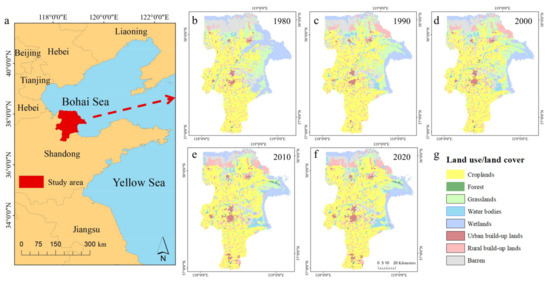
Figure 2.
The location of Dongying city and its land use/land cover (LULC). (a) The location of Dongying city. (b–f) The LULC of Dongying city in 1980, 1990, 2000, 2010, and 2020, which was adopted from remote sensing monitoring data of LULC in China (http://www.dsac.cn/DataProduct/Detail/200804) (accessed on 1 February 2023). (g) The legends of LULC.
In terms of administrative division, 93% of the YRD belongs to Dongying City and 7% to Binzhou City [11]. Consequently, previous research on the YRD mostly focused on the whole Dongying City (118°7′~119°10′E, 36°55′~38°10′N), including Dongying District, Hekou District, Kenli County, Lijin County, and Guangrao County.
The YRD is a new land formed by the deposition of the Yellow River in the past hundred years, and has a continental monsoon climate. The terrain of the YRD inclines from southwest to northeast along the Yellow River trend, and the natural gradient is 1/8000~1/12,000, due to which a large amount of sediment is deposited in the Yellow River, forming the “suspended river on the ground”. This area has large groundwater mineralization, high soil salinity, few woody plants, and a meadow landscape as the main body. The distribution of vegetation is mainly restricted by water, soil salinity, phreatic water level, landform type, and human activities [11].
2.2. Data Sources
The data sources for the assessment of ESs and social–ecological drivers are shown in Table 1. According to the research purpose and regional characteristics, LULC is divided into eight categories: croplands, forest, grasslands, water bodies, wetlands, urban built-up lands, rural built-up lands, and barren. After obtaining data for 1980, 1990, 2000, 2010, and 2020 in Table 1, all raster data with different spatial resolutions were resampled to 30 m × 30 m resolution to ensure the accuracy of the regional research by referring to relevant research [13,22].

Table 1.
Summary of the primary data.
2.3. ES Assessment
We identified 10 ESs based on the following criteria: (1) consistency with the classification of ESs by Millennium Ecological Assessment (MEA) [26] and previous studies [27]; (2) representativeness of ESs for social–economic conditions in the study area; (3) availability and feasibility of data. According to the characteristics of the YRD and the classification of ESs in the MEA [26], the YRD wetland ESs were classified as supporting service (SS), regulating service (RS), provisioning service (PS), and cultural service (CS) (Table 2). The final evaluation system included 10 indicators, namely food production (FP), raw material (RM), soil conservation (SC), carbon storage (Ca.), habitat quality (HQ), gas regulation (GR), climate regulation (CR), water yield (WY), waste treatment (WT), and relaxation (Re.). Firstly, the ESs in 1980, 1990, 2000, 2010, and 2020 were quantified in monetary form. For the subsequent analysis, we superimposed all ESs classifications into four categories, namely SS, RS, SS, and CS.

Table 2.
Overview of ecosystem services assessed in this study.
2.3.1. Equivalent Value Factors (EVF) Method
Xie et al. proposed the equivalent value factors of ESs applicable to China [27] (Table S1). Some researchers [34,35] poorly understood the regional differences and directly adopted the EVF. Referring to correlational research [27,36], this paper performed unit value equivalent correction in the YRD based on grain price changes.
First, we made the correction through grain prices. Many scholars considered natural grain production as equal to 1/7 of actual grain production [36,37]. In this paper, the average prices of three major food grains were used as the basis, and the average net profit of farmlands excluding human input costs was used as the standard equivalence factor. The ratio of urban unit grain production in the YRD to national unit area grain production in the same period was used as the correction factor [38], which was further corrected for grain prices using the consumer food price index for residents to take inflation into account. Eventually, the economic value of equivalent factors for the YRD was determined.
where is the equivalent value of a standard unit; , , and are the prices of wheat, corn, and rice, respectively (yuan); and are the local food production per unit area and the national food production per unit area in the same time, respectively; and is the consumer food price index for residents.
In this paper, according to the corrected grain price and the equivalent value factors of ESs applicable to China [27] (Table S1), we compiled the ES value factor equivalents per unit area for each LULC in the YRD, which was used to estimate the value of Re, WT, FP, CR, GR, and RW.
2.3.2. WY
The WY of each grid is the difference between the input water (precipitation) and output water (evapotranspiration and surface runoff) of each grid unit. The WY is calculated with Equation (2) [39].
where is the WY in cell i; is the mean reference evapotranspiration every year; is the mean precipitation every year; is the value of WY; and is the cost of unit reservoir capacity [33]. The calculation methods of related factors are presented in the Supplementary Materials.
2.3.3. Ca
The Carbon Storage and Sequestration model multiplies the area of each LULC by its carbon density and then sums them to obtain the total carbon storage of the study area, as shown in Equation (3).
where is the total carbon density (kg/km2); is the carbon density of aboveground carbon storage (kg/km2); is the carbon density of underground carbon storage (kg/km2); is the carbon density in soil (kg/km2); and is the carbon density of litter (kg/km2). The carbon densities of the YRD were adopted from the correction equation, which is presented in the Supplementary Materials.
The Ca. value is as follows.
where is the value of Ca. (CNY); is the total carbon density (kg/km2); and is the carbon fixation price (kg/CNY) [31].
2.3.4. SC
The seduction delivery ratio module mainly makes use of universal soil loss equation (USLE), as shown in Equation (5) [40].
where is rainfall erosion; is soil erodibility; is the factor of slope and slope length; is the vegetation coverage factor; is the management factor; and , and are the soil erosion amount every year, the potential soil erosion amount and the soil conservation amount, respectively. The calculation methods of the above-mentioned factors are presented in the Supplementary Materials.
Wetland soil loss takes away a large amount of nutrients, and the value of wetland conservation soil can be replaced by the value of wetland reduction of soil fertility loss. In this paper, we mainly selected nutrients such as nitrogen, phosphorus, and potassium, which are easily soluble in water or easily separated from the soil by external forces, and cannot be recovered with the lost soil. The average values of nutrient contents of soils in the YRD [28] are shown in Table 3.

Table 3.
Average nutrient content of soils in the Yellow River Delta.
The value of soil fertility was used to estimate the value of SC.
where is total nitrogen, phosphorus, and potassium nutrients in unit mass of soil [28,29]; and is average price of nitrogen, phosphorus, and potassium fertilizers [30].
2.3.5. GR
In the ecosystem, vegetation synthesizes organic matter through photosynthesis and also releases O2. According to the equation of photosynthesis and respiration of plants, 1.19 g of O2 is released for every 1 g of dry matter produced. In this study, we downloaded the NPP data of ecosystems in the study area (http://www.geodoi.ac.cn) (accessed on 3 February 2023), and the material masses of O2 released from 1980 to 2020 were converted separately.
where is the value of GR (CNY); NPP is the annual net primary productivity (kg/km2); and is the price of oxygen (CNY/kg) [32].
2.4. Quantification of Correlations between ESs
2.4.1. Correlation Analysis
Since data on various types of ESs showed a non-normal distribution, we used Spearman’s non-parametric correlation analysis to determine trade-offs/synergies between ESs [41,42]. A positive correlation between ESs indicates a synergy, while a negative correlation indicates a trade-off.
2.4.2. CCD Model
The CCD model was used to analyze the coordinated development level of things [43]. It is widely used in studying the coupling coordination relationship of multiple systems, and can also be used to discuss the coupling coordination relationship between ESs and economic development [43].
Although correlation can reflect the interaction between ESs, it is difficult to reflect the overall coordination level of the two systems. The CCD refers to the degree of coordinated development between systems, which reflects the state of the coupling degree. Consequently, CCD was introduced to reflect the overall coordination level of ESs. In order to eliminate differences in scales, ESs were standardized, followed by the above-mentioned model analysis to analyze the level of synchronization and coordination of the two ESs.
The standardized formula is as follows.
where demotes the value of ES i; demotes the standardized data; and and are the maximum and minimum values, respectively.
The formula of the CCD model is as below [44,45]:
where D is the CCD, taking the value of [0, 1], with a larger D indicating a more coordinated development level of the two ESs; C is the coupling degree, taking the value of [0, 1], with a larger C indicating a better coupling state of the two systems, and a smaller C indicating the worse, which will tend to disorderly development; T is the composite coordination index of the two systems; and and are the values of two ESs, whose weights are a and b. In this study, we have no prejudice on the importance of ESs, each of which is equally important to human beings, so a = b = 0.5 [43,44,45].
In order to study the development stage of the CCD clearly, according to the relevant study [43,46], we determined the 10 grading standards of the degrees (Table 4).

Table 4.
Classification of coupling coordination degrees.
2.5. Social–Ecological Drivers of ESs
2.5.1. Selection of Social–Ecological Drivers
The ESs in the YRD are not only affected by local drivers, but also by the huge amount of water and sediment brought by the Yellow River and the influence from the ocean [19]. According to the relevant literature [16] and the particularity of the study area, three types of drivers were considered, for which 11 specific drivers were proposed, which are shown in Table 5. Meteorological conditions are the basis for the stability of the structure and function of the coastal wetland ecosystem, whose environmental bases are soil and hydrological conditions, while social–economic development is the external driver for the evolution of the coastal wetland. The formulae and reference studies for specific indicators are shown in the Supplementary Materials.

Table 5.
Social–economic drivers and their sources in the Yellow River Delta.
2.5.2. PCA
PCA can transform a group of related variables into a group of unrelated PCs, which reduces the calculation workload and increases the accuracy of subsequent analysis [26]. Through ArcGIS10.2, 11 multivariate drivers in the YRD from 1980 to 2020 were extracted. On account of the large number of drivers and the correlation between them, it was necessary to reduce the dimensionality of these 11 drivers as well as the interference of data redundancy.
2.5.3. The GTWR Model
The GTWR model introduces the time dimension into the geographically weighted regression (GWR) model, which can obtain the dual information of time and space, making the estimation results more effective [13,47]. The formula of the GTWR model is as follows [48]:
where and are the latitude and longitude coordinates of the center of gravity; is the spatiotemporal coordinate of the ith sample point; is the regression constant at point i; is the kth regression parameter at point i; is the value of the independent variable at point i; and is the residual term of the model.
PCA of multiple drivers was performed using ArcGIS 10.2, whose results were used to identify spatial interactions with ESs by the GTWR model.
3. Results
3.1. Spatiotemporal Variations of ESs
3.1.1. Spatiotemporal Variations
The temporal variability and change rate of ESs in the YRD from 1980 to 2020 is shown in Figure 3. ESs in the YRD in 1980, 1990, 2000, 2010, and 2020 were CNY 37.01, 48.89, 42.47, 48.30, and 50.49 billion, respectively, with an overall fluctuating upward trend, where RS generated the largest share, followed by SS, which was consistent with previous studies [13,49]. In RS, GR accounted for the largest share, followed by WY and WT. PS and CS showed a fluctuating upward trend, while RS and SS remained relatively unchanged, which indicated that the ESs provided by artificial ecosystems increased. The change rates of SS and CS from 2000 to 2010 were relatively high, while WY had the highest rate between 1980 and 1990, followed by SC between 2010 and 2020.
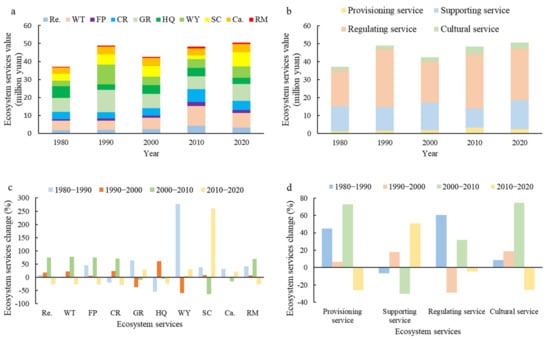
Figure 3.
The temporal variability and change rate of ecosystem services (ESs) in the Yellow River Delta (YRD) from 1980 to 2020. (a,b) The temporal variability of ESs in the YRD from 1980 to 2020. (c,d) The change rate of ESs in the YRD from 1980 to 2020. (FP: food production, RM: raw material, SC: soil conservation, Ca.: carbon storage, HQ: habitat quality, GR: gas regulation, CR: climate regulation, WY: water yield, WT: waste treatment, Re.: relaxation.)
The results indicated that the pattern of ESs in the YRD showed spatial heterogeneity, while remaining relatively similar and stable (Figure 4). The high supply areas of PS and SS were mainly located in the southwest of the croplands, while the high supply areas of RS and CS were mainly located in the wetlands. Specifically, the spatial pattern of RS showed a gradient distribution from southwest to northeast.
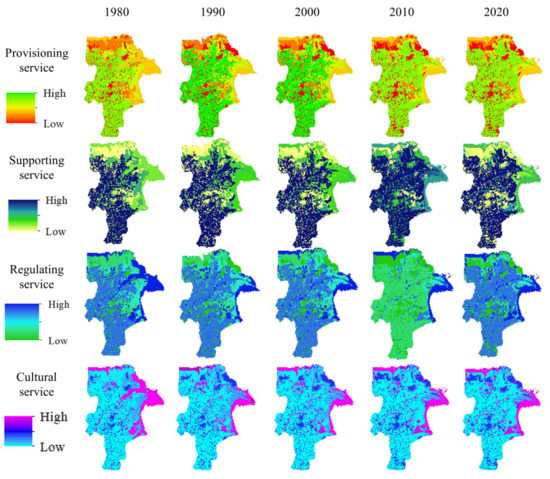
Figure 4.
The spatiotemporal patterns of ecosystem services in the Yellow River Delta from 1980 to 2020.
3.1.2. Trade-Offs and Synergies between ESs
A total of 45 correlations were identified between 10 ESs per year, whose correlations were statistically significant (p < 0.05) (Figure 5). There were similarities in the correlations in all 5 years. First of all, the relationships between Re. and other ESs were basically negative, with higher trade-offs between FP, RM, CS, and WY. Secondly, other ES were basically positive correlations, among which WT, FP, CR, RM, HQ, and CS had high synergies.
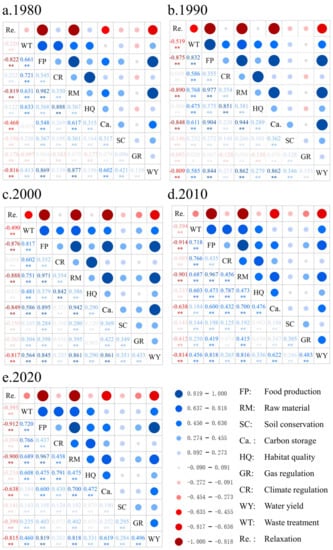
Figure 5.
Correlations among 10 types of ecosystem services (** represents p < 0.01) in the Yellow River Delta, 1980–2020. The lower left part of each panel shows the Spearman’s correlation coefficients. The blue and red symbols represent positive and negative correlations, respectively.
3.2. CCD Evaluation
The CCD of ESs in the YRD from 1980 to 2020 is shown in Figure 6. The results showed that the mean values of CCD among ESs from 1980 to 2020 fluctuated slightly in the range of 0.4–0.6 and 0.1–0.3, respectively. The average CCD of the PS–SS was the highest, followed by RS–SS and PS–RS, both between 0.4 and 0.6, indicating that these ESs were in the high coupling, generally in a moderate coordination state. The average CCD of the PS–CS was the lowest, followed by CS–SS and RS–CS, which were both between 0.1 and 0.3, indicating that the CS and other ESs were generally in a low coordination state, leading to a dysfunctional state. Combined with the results of the correlation analysis, it showed that the CS was always strongly associated with other ESs while the coordination effect was weak.
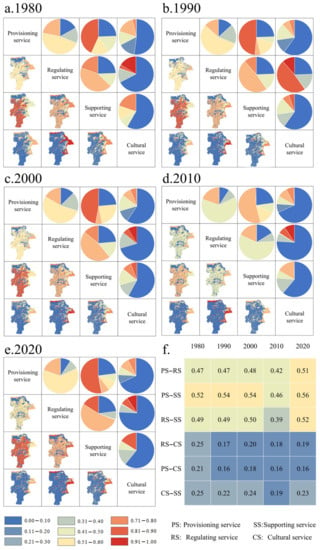
Figure 6.
The coupling coordination degree (CCD) of ecosystem services (ESs) in the Yellow River Delta from 1980 to 2020. (a–e) The pie charts showed the area share of different CCD between ESs. (f) The temporal variability of mean value of CCD between ESs.
The spatial heterogeneity of CCD between ESs was obvious, while the trend was relatively stable, and the difference had a great relationship with LULC.
3.3. GTWR Analysis of Multiple Drivers and ESs
3.3.1. PCA
Firstly, the Kaiser–Meyer–Olkin (KMO) and Bartlett tests for the 11 drivers showed that the KMO value was >0.5 and the p value of the Bartlett test was <0.001, indicating that these 11 indicators could be analyzed by PCA. Secondly, the cumulative contribution of the first five eigenvalues reached 73.484%, as shown in Table 6, which generally indicated a more satisfactory cumulative above 70%.

Table 6.
Total variance explained.
It can be seen from Table 7 that, in the first PC, the absolute value of the hydrographic net and runoff loads was relatively large, indicating that these variables had high correlation coefficients with the first PC, which can be named hydrologic conditions. In the second PC, the absolute value of temperature and sediment loads were relatively large. Since temperature is one of the important factors for vegetation growth, which is an important factor for sediment transport, the second PC can be called vegetation influence. In the third PC, the absolute value of population, GDP, traffic roads, and shoreline use intensity loads were large, so the third PC was called social economy. In the fourth PC, the absolute values of precipitation and salinization loads were large. Considering that the cause of salinization is strongly associated with precipitation, the fourth PC was consequently called water–salt balance. In the fifth PC, the absolute value of landscape disturbance load was large, so the fifth PC was called landscape disturbance. The spatial pattern of PCs of social–economic drivers in the YRD from 1980 to 2020 is shown in Figure 7.

Table 7.
Component matrix.
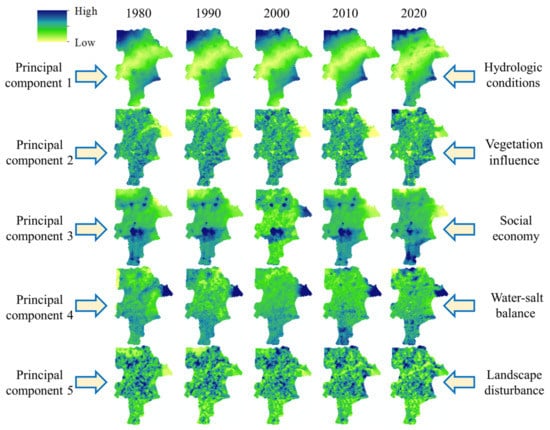
Figure 7.
Principal components of social–economic drivers in the Yellow River Delta, 1980–2020.
3.3.2. GTWR Analysis
Using the GTWR plug-in for ArcGIS 10.2 (with automatic optimal settings for bandwidth) produced by Huang et al. [48], the regression results can explain the relation between PCs and ESs. A parameter greater than 0 indicated that the explanatory variables were driving ESs, with a larger parameter indicating a stronger driving effect, while a parameter less than 0 indicated that the explanatory variables were inhibiting ESs, with a larger absolute value indicating a stronger inhibiting effect. The natural breakpoint method was used to classify the effects of each PC on ESs into six categories: weak positive effect, middle positive effect, strong positive effect, weak negative effect, middle negative effect, and strong negative effect, and finally the spatiotemporal variation was plotted, as shown in Figure 8.
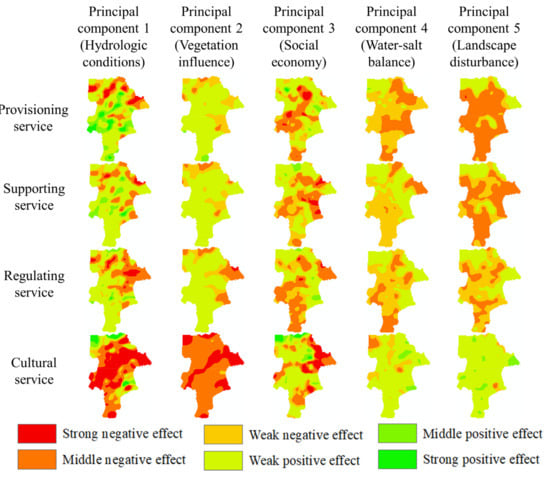
Figure 8.
Spatiotemporal variation in the impact of principal components on ecosystem services.
For SS, PS, and RS, the vegetation influence was a positive driver while water–salt balance and landscape disturbance were basically negative drivers. The driving effect of hydrographic net was opposite to that of social economy. The former had a strong negative driving effect in the northeast and a strong positive driving effect in the southwest, while the latter had an opposite effect. The role of each PC for CS was opposite to that of the other ESs. Landscape disturbance and water–salt balance on CS were the positive drivers, while vegetation influence was negative.
4. Discussion
4.1. Reasons for Spatiotemporal Variation of ESs
From 1968 to 2020, the precipitation in Dongying City decreased by 66.31 mm/a, especially in the late 20th century, when the annual precipitation was the lowest. The precipitation in 1990 reached 893.76 mm, which was the extreme value of precipitation during this period [50]. Moreover, parallel with that, there were fewer urban-up lands but more forest and grasslands, so the value of WY was high, which in turn affected the total ES value in 1990. Previous studies have shown that vegetation has a deep connection with RS [11,47]. From 1996 to 2001, the unified water transfer in the Yellow River basin was initiated, resulting in the decrease of bare lands and the increase of croplands [51]. Dongying City took this opportunity effectively to restore a large number of wetlands, which not only increased carbon storage, but also reduced soil erosion and flooding [52]. To sum up, the change of vegetation and wetlands led to an overall fluctuating upward trend in RS in Dongying City.
4.2. Trade-Offs/Synergies Based on the CCD Model and Correlation
The trade-offs/synergies between ESs were identified by the CCD model and correlation in our research, which showed that CS and other ESs were basically in a state of trade-off and imbalance, while the other ESs were basically in a state of synergy and coordinated development. We found large similarities between the results of the CCD model and correlation (Figure 6 and Figure 9) while there was little discrepancy in the respective change, which suggested that the relationships between ESs were relatively stable [53].
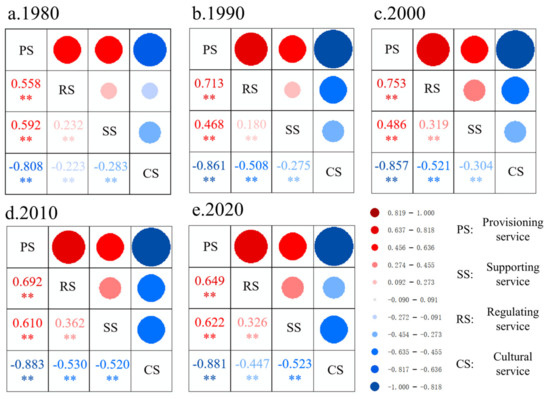
Figure 9.
Correlations of four categories of ecosystem services (** represents p < 0.01) in the Yellow River Delta, 1980–2020. The lower left part of each panel shows the Spearman’s correlation coefficients. The blue and red symbols represent negative and positive correlations, respectively.
The spatial pattern of the CCD of ES in the YRD from 1980 to 2020 showed spatial heterogeneity. CS and the other ESs were basically in a state of coordination in wetlands, which in other LULCs were in a state of imbalance, which is generally consistent with previous studies [54,55]. In wetlands, all kinds of ESs can basically develop in a coordinated way, while in build-up lands and barren they cannot. Consequently, Dongying City needs to control urbanization and industrialization to maintain the sustainable supply of key ESs [56], which is consistent with previous studies [57,58]. To sum up, the results indicate that there is still more room to improve the ES status in urban and bare lands for sustainable development of regional ESs. The results of the correlation analysis lack spatial description, while the CCD model can remedy the flaw, providing a new way of thinking the relationships between ESs and monitoring the sustainable supply of ESs, because of the deep connection between the spatial distribution and temporal dynamics of ESs [59,60]. Hence, long-term monitoring of the supply of ESs is essential to identify the development relationship between ESs in different regions, to avoid unnecessary trade-offs and ensure the sustainable supply of ESs [61].
4.3. Response of ESs to Multiple Drivers
We found that the responses of PS, SS, and RS to multiple drivers were parallelism because of their similarities [62], while the response of CS was opposite to other ESs. Playing a pivotal role in ESs, vegetation was a positive driver for ESs. Social economy played a positive driver for CS and a negative driver for other ESs in the southwest where the Dongying District is located, a region with high economic development and population concentrations. Landscape disturbance had a deep connection with the intensity of human activities, so that it was positive driver for CS and a negative driver for the other ESs in areas where human activities were more frequent, such as build-up lands and croplands.
The results suggest that there are three main aspects of sustainable supply about ESs, which are limiting the expansion of artificial landscapes, improving agricultural techniques, and promoting wetland conservation and restoration [63,64].
4.4. Spatial Planning and Management
Accurately identifying the social–ecological drivers of ESs will not only help to formulate corresponding spatial management and planning strategies [65,66], but also provide insights for improving the versatility of territorial space and regional sustainable development.
The structure of ESs in the YRD is shown in Figure 10. We integrated the above-mentioned results to propose spatial planning and development strategies for each district in Dongying City. Located in inland areas, Lijin County is largely consistent with Guangrao County, both having few ES values and more croplands, which suggest that measures should be taken to protect basic farmland and improve agricultural water facilities and soil quality. Hekou District has large similarities with Kenli District, which are both in the coastal area, with few croplands, more grasslands, and high ES values. Consequently, the industrial structure and the treatment of saline land should be improved. Dongying District, which has large build-up lands, is the central urban area and the location of Shengli Petroleum Administration organs, whose treatment measures should be mainly focused on industrial development, oil–land integration, innovation, and improvement of people’s livelihoods.
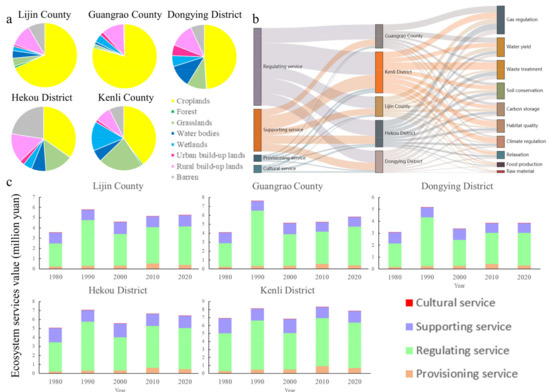
Figure 10.
Structure of ecosystem services (ESs) in the Yellow River Delta (YRD). (a) Average share of land use/land cover in different administrative regions of the YRD, 1980–2020. (b) Sankey diagram of ESs in different administrative regions of the YRD, 1980–2020. (c) Temporal changes of ESs in different administrative regions of the YRD, 1980–2020.
4.5. Limitations and Prospects
While this study has provided insights into the interaction of ESs in the YRD and the response of ESs to social–ecological drivers, it is necessary to pay attention to the following limitations: (1) some ecological processes in the InVEST model are comparatively simple [67], being an important question for future investigation, so that our next challenge is to find more suitable ecological models to estimate ESs. (2) In the WY module, the water quantity only takes into account two factors: precision and evapotranspiration [68], while no consideration is given to groundwater [69,70], which will be our understudied and important potential next frontier. (3) The seduction delivery ratio module mainly makes use of USLE, whose effect is limited although widely used [70]. Only water erosion is taken into account to estimate soil loss, while no consideration is given to the other types of soil erosion [71]. Inevitably, more empirical studies are needed to obtain applicable data of soil erosion to the study area in future research. (4) The carbon storage module assumes that the only change of carbon storage is due to LULCs [69,70], without considering the variability of carbon storage in specific LULCs and soil type [72]. Hence, more accurate data will be important for future investigation.
5. Conclusions
Threatened by natural and human disturbances, coastal wetland ecosystems face the risk of uncoordinated development. Accordingly, it is necessary to evaluate dynamic changes of coastal wetland ESs scientifically, identify their coordinated development status, and explore the spatial heterogeneity about response of ESs to social–ecological drivers, to ensure the better sustainable use of coastal resources.
The key findings that emerged from this study were that: (1) from 1980 to 2020, the ESs of YRD showed an overall upward trend, which were mainly affected by the GR, WY, and WT of RS. (2) CS was disordered with other ESs, but, even so, various ESs could basically develop in a coordinated manner in wetlands. The empirical results of this study provide a new understanding about the role of wetlands in ESs, which showed that wetlands not only provide a variety of resources for human beings, but also have huge environmental functions and benefits. We should protect wetlands better and use the prominent role of wetlands in coordinating ESs. (3) Through PCA, 11 social–economic drivers were integrated into 5 PCs, namely hydrologic conditions, vegetation influence, social economy, water–salt balance, and landscape disturbance, which reduced the information redundancy and the calculation workload for the subsequent analysis, increasing the accuracy and stability of the results. (4) This study provides a deep insight into the response of wetland ESs to social–economic drivers through the GTER model, which has spatial heterogeneity, suggesting that ES management in different regions should have its own priority rather than generalization.
The knowledge gained in this study can be of help to provide a basis for the sustainable development of the regional ESs and the improvement of human well-being. Despite the limitations, to a large extent, our results cast a new light on more comprehensive management for ESs, to achieve more efficient and rational decision-making.
Supplementary Materials
The following supporting information can be downloaded at: https://www.mdpi.com/article/10.3390/rs15071866/s1, The method of ecosystem services assessment and social–ecological drivers of ESs. Table S1: Equivalent value factors of ecosystem services per unit area in China. Table S2: The root depth and evapotranspiration coefficient of each land use/land cover. Table S3: The carbon density of each land use/land cover (Mg∙ha−1). Table S4: The management factor expressed by P of different LULCs. References [15,25,27,72,73,74,75,76,77,78,79,80,81,82,83,84,85,86,87,88,89,90,91,92,93,94,95,96] are cited in the supplementary materials.
Author Contributions
Conceptualization, L.Y. and D.D.; data curation, H.S.; methodology, H.S.; resources, Y.W.; writing—original draft, L.Y.; writing—review & editing, L.Y. and W.Z. All authors have read and agreed to the published version of the manuscript.
Funding
This research was supported by Laoshan Laboratory (LSKJ 202203900), National Natural Science Foundation of China (No. U1806214) and the National Key Research and Development Program of China (No. 2018YFD0900806).
Data Availability Statement
Some or all data, models, or code generated or used during the study are available from the corresponding author by request.
Conflicts of Interest
The authors declare that they have no known competing financial interest or personal relationship that could have appeared to influence the work reported in this paper.
References
- Temmink, R.J.M.; Lamers, L.P.M.; Angelini, C.; Bouma, T.J.; Fritz, C.; van de Koppel, J.; Lexmond, R.; Rietkerk, M.; Silliman, B.R.; Joosten, H.; et al. Recovering Wetland Biogeomorphic Feedbacks to Restore the World’s Biotic Carbon Hotspots. Science 2022, 376, eabn1479. [Google Scholar] [CrossRef] [PubMed]
- Bratman, G.; Anderson, C.; Berman, M.; Cochran, B.; de Vries, S.; Flanders, J.; Folke, C.; Frumkin, H.; Gross, J.; Hartig, T.; et al. Nature and Mental Health: An Ecosystem Service Perspective. Sci. Adv. 2019, 5, eaax0903. [Google Scholar] [CrossRef] [PubMed]
- Costanza, R.; de Groot, R.; Braat, L.; Kubiszewski, I.; Fioramonti, L.; Sutton, P.; Farber, S.; Grasso, M. Twenty Years of Ecosystem Services: How Far Have we Come and How Far Do we Still Need to Go? Ecosyst. Serv. 2017, 28, 1–16. [Google Scholar] [CrossRef]
- Murray, N.J.; Worthington, T.A.; Bunting, P.; Duce, S.; Hagger, V.; Lovelock, C.E.; Lucas, R.; Saunders, M.I.; Sheaves, M.; Spalding, M.; et al. High-Resolution Mapping of Losses and Gains of Earth’s Tidal Wetlands. Science 2022, 376, 744–749. [Google Scholar] [CrossRef] [PubMed]
- Fluet-Chouinard, E.; Stocker, B.D.; Zhang, Z.; Malhotra, A.; Melton, J.R.; Poulter, B.; Kaplan, J.O.; Goldewijk, K.K.; Siebert, S.; Minayeva, T.; et al. Extensive Global Wetland Loss over the Past Three Centuries. Nature 2023, 614, 281–286. [Google Scholar] [CrossRef] [PubMed]
- Sun, Z.; Sun, W.; Tong, C.; Zeng, C.; Yu, X.; Mou, X. China’s Coastal Wetlands: Conservation History, Implementation Efforts, Existing Issues and Strategies for Future Improvement. Environ. Int. 2015, 79, 25–41. [Google Scholar] [CrossRef]
- Lopes, R.; Videira, N. Valuing Marine and Coastal Ecosystem Services: An Integrated Participatory Framework. Ocean. Coast. Manag. 2013, 84, 153–163. [Google Scholar] [CrossRef]
- Ren, J.; Chen, J.; Xu, C.; van de Koppel, J.; Thomsen, M.S.; Qiu, S.; Cheng, F.; Song, W.; Liu, Q.; Xu, C.; et al. An Invasive Species Erodes the Performance of Coastal Wetland Protected Areas. Sci. Adv. 2021, 7, eabi8943. [Google Scholar] [CrossRef]
- Fu, Q.; Hou, Y.; Wang, B.; Bi, X.; Li, B.; Zhang, X. Scenario Analysis of Ecosystem Service Changes and Interactions in a Mountain-Oasis-Desert System: A Case Study in Altay Prefecture, China. Sci. Rep. 2018, 8, 12939. [Google Scholar] [CrossRef]
- Yin, L.; Zheng, W.; Shi, H.; Ding, D. Ecosystem Services Assessment and Sensitivity Analysis Based on ANN Model and Spatial Data: A Case Study in Miaodao Archipelago. Ecol. Indic. 2022, 135, 108511. [Google Scholar] [CrossRef]
- Zhang, T.; Zhang, S.; Cao, Q.; Wang, H.; Li, Y. The Spatiotemporal Dynamics of Ecosystem Services Bundles and the Social-Economic-Ecological Drivers in the Yellow River Delta Region. Ecol. Indic. 2022, 135, 108573. [Google Scholar] [CrossRef]
- Su, S.; Xiao, R.; Jiang, Z.; Zhang, Y. Characterizing Landscape Pattern and Ecosystem Service Value Changes for Urbanization Impacts at an Eco-Regional Scale. Appl. Geogr. 2012, 34, 295–305. [Google Scholar] [CrossRef]
- Wang, C.; Li, X.; Yu, H.; Wang, Y. Tracing the Spatial Variation and Value Change of Ecosystem Services in Yellow River Delta, China. Ecol. Indic. 2019, 96, 270–277. [Google Scholar] [CrossRef]
- Ma, M.; Tang, J. Interactive Coercive Relationship and Spatio-Temporal Coupling Coordination Degree Between Tourism Urbanization and Eco-Environment: A Case Study in Western China. Ecol. Indic. 2022, 142, 109149. [Google Scholar] [CrossRef]
- Shi, H.; Yin, L.; Gao, M. Landscape Changes and their Ecological Effects of Miaodao Archipelago with Human Disturbances and Under Natural Conditions in the Past 30 Years. J. Oceanol. Limnol. 2021, 39, 955–978. [Google Scholar] [CrossRef]
- Chi, Y.; Shi, H.; Sun, J.; Li, J.; Yang, F.; Fu, Z. Spatio-Temporal Characteristics and Main Influencing Factors of Vegetation Net Primary Productivity in the Yellow River Delta in Recent 30 Years. Acta Ecol. Sin. 2018, 38, 2683–2697. [Google Scholar]
- Liu, R.X.; Kuang, J.; Gong, Q.; Hou, X.L. Principal Component Regression Analysis with SPSS. Comput. Methods Programs Biomed. 2003, 71, 141–147. [Google Scholar] [CrossRef] [PubMed]
- Chi, Y.; Shi, H.; Zheng, W.; Sun, J.; Fu, Z. Spatiotemporal Characteristics and Ecological Effects of the Human Interference Index of the Yellow River Delta in the Last 30 Years. Ecol. Indic. 2018, 89, 880–892. [Google Scholar] [CrossRef]
- Chi, Y.; Zheng, W.; Shi, H.; Sun, J.; Fu, Z. Spatial Heterogeneity of Estuarine Wetland Ecosystem Health Influenced by Complex Natural and Anthropogenic Factors. Sci. Total Environ. 2018, 634, 1445–1462. [Google Scholar] [CrossRef]
- Schröter, D.; Cramer, W.; Leemans, R.; Prentice, I.; Araújo, M.; Arnell, N.; Bondeau, A.; Bugmann, H.; Carter, T.; Gracia, C.; et al. Ecosystem Service Supply and Vulnerability to Global Change in Europe. Science 2005, 310, 1333–1337. [Google Scholar] [CrossRef]
- Li, J.; Gong, Y.; Jiang, C. Spatio-Temporal Differentiation and Policy Optimization of Ecological Well-Being in the Yellow River Delta High-Efficiency Eco-Economic Zone. J. Clean. Prod. 2022, 339, 130717. [Google Scholar] [CrossRef]
- Zhang, X.; Wang, G.; Xue, B.; Zhang, M.; Tan, Z. Dynamic Landscapes and the Driving Forces in the Yellow River Delta Wetland Region in the Past Four Decades. Sci. Total Environ. 2021, 787, 147644. [Google Scholar] [CrossRef] [PubMed]
- Fick, S.E.; Hijmans, R.J. WorldClim 2: New 1Km Spatial Resolution Climate Surfaces for Global Land Areas. Int. J. Climatol. 2017, 37, 4302–4315. [Google Scholar] [CrossRef]
- Harris, I.; Jones, P.; Osborn, T.; Lister, D. Updated High-Resolution Grids of Monthly Climatic Observations—The CRU TS3.10 Dataset. Int. J. Climatol. 2014, 34, 623–642. [Google Scholar] [CrossRef]
- Yue, T.; Yin, S.; Xie, Y.; Yu, B.; Liu, B. Rainfall Erosivity Mapping Over Mainland China Based on High-Density Hourly Rainfall Records. Earth Syst. Sci. Data 2022, 14, 665–682. [Google Scholar] [CrossRef]
- Millennium Ecological Assessment. Ecosystems and Human Well-Being: A Framework for Assessment; Island Press: Washington, DC, USA, 2005. [Google Scholar]
- Xie, G.D.; Zhen, L.; Lu, C.X.; Xiao, Y.; Chen, C. Expert Knowledge Based Valuation Method of Ecosystem Services in China. J. Nat. Resour. 2008, 23, 911–919. [Google Scholar]
- Tian, J.; Jia, W. Study of Biodiversity in the Yellow River Delta; Qingdao Press: Qingdao, China, 1999. (In Chinese) [Google Scholar]
- Song, C.Y.; Liu, G.; Liu, Q.; Cao, M.; Huang, C. Distribution Patterns of Plant Communities in the Yellow River Delta and Related Affecting Factors. Chin. J. Ecol. 2008, 27, 2042–2048. [Google Scholar]
- He, H.; Pan, Y.; Zhu, W.; Liu, X.; Zhang, Q.; Zhu, X. Measurement of Terrestrial Ecosystem Service Value in China. J. Appl. Ecol. 2005, 16, 1122–1127. [Google Scholar]
- State Environmental Protection Administration. China Biodiversity Country Study; China Environmental Science Press: Beijing, China, 1997. (In Chinese) [Google Scholar]
- State Forestry Administration. Forest Ecosystem Service Function Evaluation Specification; China Standard Press: Beijing, China, 2008. (In Chinese) [Google Scholar]
- Ouyang, Z.Y.; Wang, X.; Miao, H. A Primary Study on Chinese Terrestrial Ecosystem Services and their Ecological-Economic Values. Acta Ecol. Sin. 1999, 10, 606–613. [Google Scholar]
- Li, F.; Zhang, B.; Zhang, S.Q. Ecosystem Service Valuation of Sanjiang Plain. J. Arid. Land Resour. Environ. 2004, 18, 19–23. [Google Scholar]
- Chun, Z. Loss Assessment of the Ecosystem Service Values of the Sanjiang Plain from 1954 to 2005. Syst. Sci. Compr. Stud. Agric. 2011, 27, 240–247. [Google Scholar]
- Sun, Y.; Liu, S.; Dong, Y.; An, Y.; Shi, F.; Dong, S.; Liu, G. Spatio-Temporal Evolution Scenarios and the Coupling Analysis of Ecosystem Services with Land Use Change in China. Sci. Total Environ. 2019, 681, 211–225. [Google Scholar] [CrossRef] [PubMed]
- Grimm, N.; Faeth, S.; Golubiewski, N.; Redman, C.; Wu, J.; Bai, X.; Briggs, J. Global Change and the Ecology of Cities. Science 2008, 319, 756–760. [Google Scholar] [CrossRef]
- Bo, N.; Zihan, Y.; Xu, B. Spatial-Temporal Correlation Analysis of Ecosystem Services Value and Human Activities: A Case Study of Huayang Lakes Area in the Middle Reaches of Yangtze River. China Environ. Sci. 2018, 38, 3531–3541. [Google Scholar]
- Fuh, B.P. On the Calculation of the Evaporation From Land Surface. Sci. Atmos. Sin. 1981, 5, 23–31, (In Chinese with English Abstract). [Google Scholar]
- Wischmeier, W.; Smith, D. Rainfall Energy and its Relation to Soil Loss. Trans. Am. Geophys. Union 1958, 39, 285. [Google Scholar] [CrossRef]
- Lyu, R.; Clarke, K.; Zhang, J.; Feng, J.; Jia, X.; Li, J. Spatial Correlations Among Ecosystem Services and their Socio-Ecological Driving Factors: A Case Study in the City Belt along the Yellow River in Ningxia, China. Appl. Geogr. 2019, 108, 64–73. [Google Scholar] [CrossRef]
- Huashun, D.; Li, X.; Li, S.; Dang, D.; Li, X.; Lyu, X.; Li, M.; Liu, S. Mapping Ecosystem Services Bundles for Analyzing Spatial Trade-Offs in Inner Mongolia, China. J. Clean. Prod. 2020, 256, 120444. [Google Scholar]
- Jiang, L.; Wu, Y.; He, X.; Fu, Q.; Wang, Z.; Jiang, Q. Dynamic Simulation and Coupling Coordination Evaluation of Water Footprint Sustainability System in Heilongjiang Province, China: A Combined System Dynamics and Coupled Coordination Degree Model. J. Clean. Prod. 2022, 380, 135044. [Google Scholar] [CrossRef]
- Chen, P.; Shi, X. Dynamic Evaluation of China’s Ecological Civilization Construction Based on Target Correlation Degree and Coupling Coordination Degree. Environ. Impact Assess. Rev. 2022, 93, 106734. [Google Scholar] [CrossRef]
- Dong, F.; Li, W. Research on the Coupling Coordination Degree of “Upstream-Midstream-Downstream” of China’s Wind Power Industry Chain. J. Clean. Prod. 2021, 283, 124633. [Google Scholar] [CrossRef]
- Wang, R.; Tan, J. Exploring the Coupling and Forecasting of Financial Development, Technological Innovation, and Economic Growth. Technol. Forecast. Soc. Chang. 2021, 163, 120466. [Google Scholar] [CrossRef]
- Crouzat, E.; Mouchet, M.; Turkelboom, F.; Byczek, C.; Meersmans, J.; Berger, F.; Verkerk, H.; Lavorel, S. Assessing Bundles of Ecosystem Services From Regional to Landscape Scale: Insights From the French Alps. J. Appl. Ecol. 2015, 52, 1145–1155. [Google Scholar] [CrossRef]
- Huang, B.; Wu, B.; Barry, M. Geographically and Temporally Weighted Regression for Modeling Spatio-Temporal Variation in House Prices. Int. J. Geogr. Inf. Sci. 2010, 24, 383–401. [Google Scholar] [CrossRef]
- Zhang, X.; He, S.; Yang, Y. Evaluation of Wetland Ecosystem Services Value of the Yellow River Delta. Environ. Monit. Assess. 2021, 193, 6. [Google Scholar] [CrossRef]
- Liu, Y.; Han, M.; Ni, J. Analysis of Precipitation Change Characteristics in Dongying City in the Past 46 Years. Sci. Technol. Bull. 2017, 33, 18–23. (In Chinese) [Google Scholar]
- Wu, D.; Liu, J.; He, T.; Wang, S.; Wang, R. A Loss and Gain Analysis of Ecological Service Value in the Yellow River Delta Based On Land Use Change. J. Agric. Eng. 2009, 25, 256–261. (In Chinese) [Google Scholar]
- Yang, Q.; Liu, G.; Hao, Y.; Zhang, L.; Giannetti, B.F.; Wang, J.; Casazza, M. Donor-Side Evaluation of Coastal and Marine Ecosystem Services. Water Res. 2019, 166, 115028. [Google Scholar] [CrossRef]
- Renard, D.; Rhemtulla, J.; Bennett, E. Historical Dynamics in Ecosystem Service Bundles. Proc. Natl. Acad. Sci. USA 2015, 112, 13411–13416. [Google Scholar] [CrossRef]
- Maes, J.; Paracchini, M.P.; Zulian, G.; Alkemade, R.; Dunbar, M. Synergies and Trade-Offs between Ecosystem Service Supply, Biodiversity, and Habitat Conservation Status in Europe. Biol. Conserv. 2012, 155, 1–12. [Google Scholar] [CrossRef]
- Wang, J.; Peng, J.; Zhao, M.; Liu, Y.; Chen, Y. Significant Trade-Off for the Impact of Grain-for-Green Programme on Ecosystem Services in North-western Yunnan, China. Sci. Total Environ. 2017, 574, 57–64. [Google Scholar] [CrossRef]
- Hu, M.; Li, Z.; Wang, Y.; Jiao, M.; Li, M.; Xia, B. Spatio-Temporal Changes in Ecosystem Service Value in Response to Land-Use/Cover Changes in the Pearl River Delta. Resour. Conserv. Recycl. 2019, 149, 106–114. [Google Scholar] [CrossRef]
- Baró, F.; Gómez-Baggethun, E.; Haase, D. Ecosystem Service Bundles Along the Urban-Rural Gradient: Insights for Landscape Planning and Management. Ecosyst. Serv. 2017, 24, 147–159. [Google Scholar] [CrossRef]
- Lorilla, R.; Poirazidis, K.; Kalogirou, S.; Detsis, V.; Martinis, A. Assessment of the Spatial Dynamics and Interactions among Multiple Ecosystem Services to Promote Effective Policy Making Across Mediterranean Island Landscapes. Sustainability 2018, 10, 3285. [Google Scholar] [CrossRef]
- Tomscha, S.; Gergel, S. Ecosystem Service Trade-Offs and Synergies Misunderstood without Landscape History. Ecol. Soc. 2016, 21, 43. [Google Scholar] [CrossRef]
- Spake, R.; Lasseur, R.; Crouzat, E.; Bullock, J.; Lavorel, S.; Parks, K.; Schaafsma, M.; Bennett, E.; Maes, J.; Mulligan, M.; et al. Unpacking Ecosystem Service Bundles: Towards Predictive Mapping of Synergies and Trade-Offs Between Ecosystem Services. Glob. Environ. Chang. 2017, 47, 37–50. [Google Scholar] [CrossRef]
- Peng, J.; Hu, X.; Zhao, M.; Liu, Y.; Tian, L. Research Progress On Ecosystem Service Trade-Offs: From Cognition to Decision-Making. Acta Geogr. Sin. 2017, 72, 960–973. [Google Scholar]
- Xia, H.; Yuan, S.; Prishchepov, A.V. Spatial-Temporal Heterogeneity of Ecosystem Service Interactions and their Social-Ecological Drivers: Implications for Spatial Planning and Management. Resour. Conserv. Recycl. 2023, 189, 106767. [Google Scholar] [CrossRef]
- Pan, J.; Chen, Y.; Zhang, Y.; Chen, M.; Fennell, S.; Luan, B.; Wang, F.; Meng, D.; Liu, Y.; Jiao, L.; et al. Spatial-Temporal Dynamics of Grain Yield and the Potential Driving Factors at the County Level in China. J. Clean. Prod. 2020, 255, 120312. [Google Scholar] [CrossRef]
- Shen, J.; Li, S.; Liang, Z.; Liu, L.; Li, D.; Wu, S. Exploring the Heterogeneity and Nonlinearity of Trade-Offs and Synergies among Ecosystem Services Bundles in the Beijing-Tianjin-Hebei Urban Agglomeration. Ecosyst. Serv. 2020, 43, 101103. [Google Scholar] [CrossRef]
- Dittrich, A.; Seppelt, R.; Václavík, T.; Cord, A. Integrating Ecosystem Service Bundles and Socio-Environmental Conditions—A National Scale Analysis from Germany. Ecosyst. Serv. 2017, 28, 273–282. [Google Scholar] [CrossRef]
- Shen, J.; Li, S.; Liu, L.; Liang, Z.; Wang, Y.; Wang, H.; Wu, S. Uncovering the Relationships Between Ecosystem Services and Social-Ecological Drivers at Different Spatial Scales in the Beijing-Tianjin-Hebei Region. J. Clean. Prod. 2020, 290, 125193. [Google Scholar] [CrossRef]
- Sharp, R.; Tallis, H.T.; Ricketts, T.; Guerry, A.D.; Wood, S.A.; Chaplin-Kramer, R.; Nelson, E.; Ennaanay, D.; Wolny, S.; Olwero, N.; et al. VEST 3.3.0 User’s Guide; The Natural Capital Project; Stanford University; University of Minnesota; The Nature Conservancy and World Wildlife Fund: Stanford, CA, USA, 2016. [Google Scholar]
- Chen, J.; Cui, T.; Wang, H.; Liu, G.; Gilfedder, M.; Bai, Y. Spatio-Temporal Evolution of Water-Related Ecosystem Services: Taihu Basin, China. PeerJ 2018, 6, e5041. [Google Scholar] [CrossRef] [PubMed]
- Agudelo, C.A.R.; Bustos, S.L.H.; Moreno, C.A.P. Modeling Interactions among Multiple Ecosystem Services. A Critical Review. Ecol. Model. 2020, 429, 109103. [Google Scholar] [CrossRef]
- Sun, X.; Lu, Z.; Li, F.; Crittenden, J.C. Analyzing Spatio-Temporal Changes and Trade-Offs to Support the Supply of Multiple Ecosystem Services in Beijing, China. Ecol. Indic. 2018, 94, 117–129. [Google Scholar] [CrossRef]
- Wilkinson, S.N.; Dougall, C.; Kinsey-Henderson, A.E.; Searle, R.D.; Ellis, R.J.; Bartley, R. Development of a Time-Stepping Sediment Budget Model for Assessing Land Use Impacts in Large River Basins. Sci. Total Environ. 2014, 468–469, 1210–1224. [Google Scholar] [CrossRef]
- Duarte, G.T.; Ribeiro, M.C.; Paglia, A.P. Ecosystem Services Modeling as a Tool for Defining Priority Areas for Conservation. PLoS ONE 2016, 11, e154573. [Google Scholar] [CrossRef]
- Zhang, L.; Yu, X.; Jiang, M.; Xue, Z.; Lu, X.; Zou, Y. A Consistent Ecosystem Services Valuation Method Based On Total Economic Value and Equivalent Value Factors: A Case Study in the Sanjiang Plain, Northeast China. Ecol. Complex. 2017, 29, 40–48. [Google Scholar] [CrossRef]
- Suo, A.; Yu, Y.; Han, F. Evaluation of Ecological Service Value Function of Coastal Zone Around Bohai Sea. Mar. Dev. Manag. 2011, 28, 67–73. (in Chinese). [Google Scholar]
- Thomas, A. Development and Properties of 0.25-Degree Gridded Evapotranspiration Data Fields of China for Hydrological Studies. J. Hydrol. 2008, 358, 145–158. [Google Scholar] [CrossRef]
- Gao, G.; Chen, D.L.; Ren, G.Y.; Chen, Y.; Liao, Y.M. Trends in Potential Evapotranspiration in China From 1956 to 2000. Geogr. Stud. 2006, 378–387. (in Chinese). [Google Scholar]
- Yu, X.X.; Lu, S.W.; Jin, F.; Chen, L.H.; Rao, L.Y. Valuation of Forest Ecosystem Service Functions in China. J. Ecol. 2005, 2096–2102. (in Chinese). [Google Scholar]
- Chadli, K. Estimation of Soil Loss Using RUSLE Model for Sebou Watershed (Morocco). Model. Earth Syst. Environ. 2016, 2, 2. [Google Scholar] [CrossRef]
- Huang, J.; Hong, H.; Zhang, L.; Du, P. Prediction of Soil Erosion in Jiulong River Basin Based On GIS and USLE. J. Soil Water Conserv. 2004, 5, 75–79. (in Chinese). [Google Scholar]
- Helmi, A.M. Quantifying Catchments Sediment Release in Arid Regions Using GIS-based Universal Soil Loss Equation (USLE). Ain Shams Eng. J. 2022, 102038. [Google Scholar] [CrossRef]
- Zhang, T. Study On Spatiotemporal Dynamics and Driving Mechanism of Ecosystem Services in the Yellow River Delta; Shandong University: Jinan, China, 2022. [Google Scholar]
- USDA-ARS. Science Documentation: Revised Universal Soil Loss Equation Version 2 (RUSLE2); USDA-Agricultural Research Service: Washington, DC, USA, 2013.
- Williams, J.; Renard, K.; Dyke, P. EPIC, Method for Assessing Erosion’s Effects On Soil Productivity. J. Soil Water Conserv. 1983, 38, 381–383. [Google Scholar]
- Zang, S.; Liang, X.; Zhang, S. GIS-based Analysis of Ecological Risk on Land-Use in Daqing City. J. Nat. Disasters 2005, 4, 141–145. [Google Scholar]
- Xie, H.L. Spatial Characteristic Analysis of Land Use Eco-Risk Based On Landscape Structure: A Case Study in the Xingguo County, Jiangxi Province. China Environ. Sci. 2011, 31, 688–695, (In Chinese with English Abstract). [Google Scholar]
- Yue, T.; Liu, J.; Jørgensen, S.E.; Ye, Q. Landscape Change Detection of the Newly Created Wetland in Yellow River Delta. Ecol. Model. 2003, 164, 21–31. [Google Scholar] [CrossRef]
- Zhang, T.; Zeng, S.; Gao, Y.; Ouyang, Z.; Li, B.; Fang, C.; Zhao, B. Assessing Impact of Land Uses On Land Salinization in the Yellow River Delta, China Using an Integrated and Spatial Statistical Model. Land Use Policy 2011, 28, 857–866. [Google Scholar] [CrossRef]
- Yu, J.; Li, Y.; Han, G.; Zhou, D.; Fu, Y.; Guan, B.; Wang, G.; Ning, K.; Wu, H.; Wang, J. The Spatial Distribution Characteristics of Soil Salinity in Coastal Zone of the Yellow River Delta. Environ. Earth Sci. 2014, 72, 589–599. [Google Scholar] [CrossRef]
- Gao, Y.; Wang, J.; Guo, S.; Hu, Y.; Li, T.; Mao, R.; Zeng, D. Effects of Salinization and Crude Oil Contamination On Soil Bacterial Community Structure in the Yellow River Delta Region, China. Appl. Soil Ecol. 2015, 86, 165–173. [Google Scholar] [CrossRef]
- Feng, J.; Ding, J.; Yang, A.; Cai, L. Remote Sensing Modeling of Soil Salinity Information in Arid Areas. Agric. Res. Arid. Reg. 2018, 36, 266–273. (in Chinese). [Google Scholar]
- Wang, J. Characterization of Soil Salinization Changes in the Yellow River Delta Based On High-Resolution Remote Sensing; Jinan University: Guangzhou, China, 2020. [Google Scholar]
- Cui, B.; Li, X. Coastline Change of the Yellow River Estuary and its Response to the Sediment and Runoff (1976–2005). Geomorphology 2011, 127, 32–40. [Google Scholar] [CrossRef]
- Yu, J.; Fu, Y.; Li, Y.; Han, G.; Wang, Y.; Zhou, D.; Sun, W.; Gao, Y.; Meixner, F. Effects of Water Discharge and Sediment Load On Evolution of Modern Yellow River Delta, China, Over the Period From 1976 to 2009. Biogeosci. Discuss. 2011, 8, 2427–2435. [Google Scholar] [CrossRef]
- Haregeweyn, N.; Poesen, J.; Verstraeten, G.; Govers, G.; de Vente, J.; Nyssen, J.; Deckers, J.; Moeyersons, J. Assessing the Performance of a Spatially Distributed Soil Erosion and Sediment Delivery Model (Watem/Sedementation) in Northern Ethiopia. Land Degrad. Dev. 2013, 24, 188–204. [Google Scholar] [CrossRef]
- Bracken, L.; Wainwright, J.; Ali, G.; Tetzlaff, D.; Smith, M.; Reaney, S.; Roy, A.G. Concepts of Hydrological Connectivity: Research Approaches, Pathways and Future Agendas. Earth-Sci. Rev. 2013, 119, 17–34. [Google Scholar] [CrossRef]
- Borselli, L.; Cassi, P.; Torri, D. Prolegomena to Sediment and Flow Connectivity in the Landscape: A GIS and Field Numerical Assessment. CATENA 2008, 75, 268–277. [Google Scholar] [CrossRef]
Disclaimer/Publisher’s Note: The statements, opinions and data contained in all publications are solely those of the individual author(s) and contributor(s) and not of MDPI and/or the editor(s). MDPI and/or the editor(s) disclaim responsibility for any injury to people or property resulting from any ideas, methods, instructions or products referred to in the content. |
© 2023 by the authors. Licensee MDPI, Basel, Switzerland. This article is an open access article distributed under the terms and conditions of the Creative Commons Attribution (CC BY) license (https://creativecommons.org/licenses/by/4.0/).