Abstract
The effectiveness of landslide disaster prevention depends largely on the quality of early identification of potential hazards, and how to comprehensively, deeply, and accurately identify such hazards has become a major difficulty in landslide disaster management. Existing deep learning methods for potential landslide hazard identification often use fixed-size window modeling and ignore the different window sizes required by landslides of different scales. To address this problem, we propose an adaptive identification method for potential landslide hazards based on multisource data. Taking Yongping County, China, as the study area, we create a multisource factor dataset based on the landslide disaster background in terms of topography, geology, human activities, hydrology, and vegetation as the sample for the identification model after processing. Moreover, we combine differential interferometric synthetic aperture radar (D-InSAR) and multitemporal InSAR (MT-InSAR) to process the surface deformation of the study area, and we measure the deformation richness based on the average of the pixel deformation difference within the current window of a pixel point in the image. Therefore, convolutional neural networks (CNNs) with different window sizes are adaptively selected. The results show that the precision of adaptive identification of potential landslide hazards in the study area is 85.30%, the recall is 83.03%, and the F1 score is 84.15%. The recognition rate for potential hazards reaches 80%, which is better than the fixed-window modeling result and proves the effectiveness of the proposed method. This method can help to improve intelligent identification systems for potential landslide hazards, and also contribute to the identification of other potential geological hazards, such as mudslides and collapses.
1. Introduction
Landslides are one of the most common natural geological hazards, having significant socioeconomic impact worldwide and seriously threatening the safety of local people’s lives and properties [1], as well as constraining local resource and economic development [2,3]. Due to the current development of geological surveys and evaluation, the identification of potential geological hazards, including landslides, is still not accurate or comprehensive. In China, where geological hazards are frequent, only about 20% of the geological hazards occurring each year fall within the potential hazard zones that have been identified [4,5]. It is particularly important and necessary to make full use of multiple sources of data, including geological data, optical remote sensing data, and radar data, and to combine various processing techniques and intelligent identification methods to further improve the breadth, depth, and accuracy of potential hazard identification so as to protect people’s lives and properties to a greater extent [6,7,8].
Scientists have used geophysical exploration, geologically related methods, optical remote sensing, microwave remote sensing, and airborne light detection and ranging (LiDAR) to recognize landslides from their morphology, deformation, form, etc., to intelligently identify potential landslide hazards [7,9,10,11,12,13,14,15,16]. Geophysical exploration methods and geologically related methods focus on landslide structures and their motion processes using displacement models, critical acceleration models, semiempirical approaches, numerical methods, and related physical exploration equipment to determine the distribution of potential landslide hazards [13,16,17,18,19,20]. However, due to the limitations of physical exploration equipment, these methods cannot easily meet the requirements of rapid and high-precision detection of potentially unstable slopes [9]. Optical remote sensing methods mainly rely on image visual interpretation, change detection, or mutual correlation techniques to achieve landslide identification, and were applied as early as the 1980s [10,21]. The optical image correlation method is suitable for the identification of potential landslide hazards with obvious deformation and large range, and its recognition accuracy is affected by the spatial resolution of images, surface vegetation, and image repetition period [10,22]. InSAR techniques in microwave remote sensing are capable of tracking tiny surface deformations continuously over a large area, which makes related techniques (e.g., persistent scatterer InSAR and small baseline subset InSAR) increasingly important in the early identification of potential landslides [6,10,23,24]. However, different InSAR techniques have their own advantages and disadvantages in potential landslide hazard identification, and combining multiple InSAR techniques can achieve hazard identification on a vast majority of deformation scales [25]. Airborne LiDAR is capable of rapidly scanning a wide range of 3D surface features to obtain centimeter-level or even higher-accuracy surface deformation information, and has been used for geological hazard monitoring, but it cannot easily identify large-scale, slow-change landslides and it has relatively low operational efficiency [10,26].
To make up for the shortcomings of single-source data and techniques, optical remote sensing, microwave remote sensing, and their combined integrated detection methods seem to have been more widely used in recent years [6,27,28,29,30]. In particular, based on the landslide background and formation conditions, the combined use of remote sensing interpretation and InSAR techniques, and modeling by deep learning models such as CNNs, recurrent neural networks (RNNs), deep belief networks (DBNs), and long short-term memory (LSTM) networks, have achieved better potential landslide hazard identification in an efficient and less costly manner [9,31,32,33,34]. For example, Dong et al. [31] combined the InSAR technique with the geohazard background indicators of the study area and completed modeling with the help of CNN-LSTM to identify geohazards in the Badong section of the Three Gorges reservoir area in China. With a final success rate of 78.9%, they demonstrated the feasibility of this method of identifying geohazards. Similarly, Zheng, He [6] used InSAR deformation monitoring data and high-resolution optical remote sensing data to characterize the morphological and textural features of landslides in combination with 17 landslide influencing factors, and verified the feasibility of using different machine learning models to combine deformation information and multisource landslide influencing factors for the early identification of landslide hazards. In addition, Long et al. [35] achieved landslide hazard identification in several typical areas in Hebei Province by constructing a hazard identification index system and CNN models, and demonstrated that the obtained identification results were more accurate than the surface deformation monitoring results using InSAR technology alone. Compared with traditional machine learning methods such as logistic regression (LR), decision tree (DT), random forest (RF), and support vector machine (SVM), the deep learning method can fit multiple complex interactions or nonlinear relationships, thus distinguishing more accurately whether the deformation areas belong to landslide or non-landslide hazards. However, for the current deep learning models used for potential landslide hazard identification, scholars tend to use fixed-size windows such as 8 × 8, 16 × 16, or 32 × 32 px for modeling [34,36], or directly preset and use multiple window sizes subjectively from the perspective of data volume requirement or accuracy comparison of the models [33,37,38]. Models have not yet been developed that consider the need for window sizes that differ from the original landslide scale. Specifically, if the set window size is too large, the recognition effect will be poor due to too few landslide pixels within it. Conversely, this will lead to too much computation in the region. Assigning windows of different sizes would theoretically yield better recognition results or improve recognition efficiency, but this has not been fully achieved.
In order to make up for the shortage of fixed-size window models in the intelligent recognition of potential landslide hazards, in this study we propose an adaptive identification method for potential landslide hazards based on multisource data. The framework of the paper is as follows. Section 2 presents an introduction to the data and methodologies used in the paper. Section 3 shows the detailed results, including the processing results for the multisource factor dataset, the surface deformation results for the study area obtained by combining D-InSAR, PS-InSAR, and SBAS-InSAR techniques, and the results for the adaptive identification of landslide hazards using CNNs. Discussions and conclusions are given in Section 4, as well as plans for future work.
2. Study Area and Data
2.1. Study Area
Yongping County (99°17′E–99°56′E, 25°03′N–25°45′N), Yunnan Province, China, where landslide hazards are frequent, was used as a case-study area (Figure 1) in which to carry out experiments on the adaptive identification of potential landslide hazards. The complex topography and geomorphology of the study area, the development of tectonic fractures, and the fragile geological environmental conditions, together with unreasonable human engineering activities, have led to the strong development of geological hazards [39,40]. According to the field investigation of Shandong GEO Surveying and Mapping Institute, the types of geological hazards in the study area mainly include landslides, mudslides, collapses, and ground subsidence, among which the numbers of landslides and mudslides are the most significant. The prevention and control of geological hazards such as landslides has become a key issue in respect of the economic development, social stability, and safety of people’s lives and properties in the study area [40].
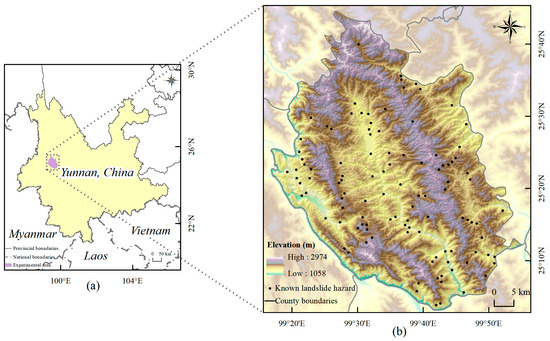
Figure 1.
Location (a) and topography (b) of Yongping County in Yunnan, southwest China.
2.2. Data Sources
The spatially scaled consistent datasets used in this study include the following.
(1) Multisource factor dataset (Figure 2): specifically, 11 topographic and geological factors (elevation, slope, aspect, curvature, plane curvature, profile curvature, roughness, relief, topographic wetness index (TWI), lithology, and distance from fault). Elevations were obtained from the shuttle radar topography mission digital elevation model (SRTM DEM) (http://gdex.cr.usgs.gov/gdex/ (accessed on 20 December 2022)) [41], from which the rest of the topographic factors were calculated. The lithology and distances from faults were obtained from the 1:50,000 lithology remote sensing interpretation map of the study area. One human activity factor (distance from road) was calculated from the road data of the National Catalogue Service for Geographic Information (https://www.webmap.cn (accessed on 20 December 2022)) [42]. There were two hydrological factors (distance from river and rainfall), of which distance from river was calculated from the river data of the National Catalogue Service for Geographic Information [42] and rainfall data were obtained from the WorldClim dataset (https://www.worldclim.org/ (accessed on 20 December 2022)) [43]. One vegetation factor (normalized difference vegetative index, NDVI) was calculated from Landsat 8 OLI/TIRS surface reflectance (https://www.usgs.gov/landsat-missions/landsat-normalized-difference-vegetation-index (accessed on 20 December 2022)) [44].
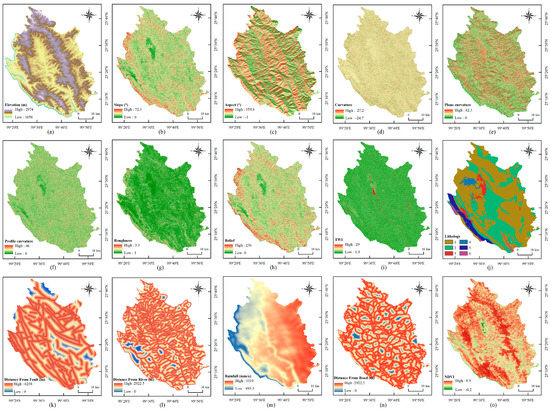
Figure 2.
Multisource factor dataset: (a) elevation, (b) slope, (c) aspect, (d) curvature, (e) plane curvature, (f) profile curvature, (g) roughness, (h) relief, (i) topographic wetness index (TWI), (j) lithology (1, medium– to thick–bedded harder rock formations interspersed with thin–bedded softer rock formations; 2, thin– to medium–thick–bedded softer rock formations interspersed with medium–thick–bedded harder rock formations; 3, soil bodies (loose rock formations); 4, massive, fractured magmatic hard rock formations; 5, thin–bedded metamorphic harder rock formations; 6, massive, medium– to thick–bedded weakly karst hard rock formations), (k) distance from fault, (l) distance from river, (m) rainfall, (n) distance from road, and (o) normalized difference vegetative index (NDVI).
(2) InSAR surface deformation monitoring data: Sentinel-1 SAR images from January 2019 to December 2020 were used to generate deformation monitoring data with a resolution of 30 m. Gaofen-1 images of a similar period were used for surface deformation monitoring result correction.
(3) Data in respect of known landslide hazards and potential hazards: Spatial distribution data in respect of landslide hazards (http://www.resdc.cn/data.aspx?DATAID=290 (accessed on 20 December 2022)), published by the Resource and Environment Science and Data Center, Institute of Geographic Sciences and Natural Resources Research of the Chinese Academy of Sciences [45], were used. A total of 124 known landslide hazards in the study area were identified, and 102 of them were retained after screening. These were used to train the deep learning model for adaptive identification of potential landslide hazards. In addition, 56 potential landslide hazards (with obvious deformation) in the study area were identified from the field investigation data provided by Shandong GEO Surveying and Mapping Institute. These were used to test the identification effect of the deep learning model.
3. Methods
3.1. Multisource Factor Dataset Processing
The basic premise of multisource factor dataset processing is that it has the same spatial resolution. Therefore, firstly, nearest-neighbor interpolation was used to resample all the factor rasters to a 30 m resolution as the basic unit of a multisource dataset [46]. In addition, the number of ranks of multisource factor layers needed to be unified in order to carry out factor filtering processing. For factor resolution, the most appropriate spatial resolution for describing landslide attribute values varies among environmental factors, and there is currently no uniform standard for the most suitable spatial resolution for the predictive modeling of susceptibility, and contradictory results have been obtained in some research literature [14]. Therefore, we chose the factor data with the more widely used resolution of 30 m to ensure the accuracy of the data, while taking into account the computational cost of the model.
Then, linear transformation of the original multisource factor dataset and data filtering were realized using spatial principal component analysis (SPCA) [47]. Specifically, the SPCA of each factor layer was completed using the ArcGIS principal components tool, and from the analysis results, several principal components corresponding to feature vectors with a cumulative contribution rate higher than 95% were selected, thus ensuring that the most informative information was retained while the data were downscaled [47,48]. Finally, a multiband, multisource factor dataset was produced based on the retained principal components and used as a sample source for the deep learning model.
3.2. Combined Multiple InSAR Techniques for Surface Deformation Monitoring
Combined D-InSAR and MT-InSAR (PS-InSAR, SBAS-InSA) techniques were used to process Sentinel-1A data and to synthesize and analyze the ascending and descending orbit observation results, which effectively complemented the single-orbit deformation detection capability and thus ensured the comprehensiveness and reliability of deformation results to the maximum extent [49,50]. During the data processing, SAR data parameters, DEM correction parameters, orbital parameters, atmospheric parameters, and elevation parameters were appropriately adjusted according to the distribution characteristics of known landslide hazards in the study area to ensure reasonable and standardized surface deformation monitoring results. Finally, the best surface deformation monitoring results were selected to obtain the deformation values and deformation rates in the study area.
3.3. Adaptive Identification of Potential Landslide Hazards Based on Multisource Data
3.3.1. Network Structure of the CNN Used
Using the processed multisource dataset as the sample source, a CNN was selected as the intelligent model for the adaptive identification of potential landslide hazards. The CNN proposed by LeCun, Bottou [51] is a multilayer supervised learning neural network that reduces training parameters and computational complexity through parameter sharing and sparse connectivity, avoids the complicated process of manual feature extraction and data reconstruction in traditional recognition methods, and facilitates the efficient capture of local features of images. It has been widely used in the field of image processing and has become a successful representative model in deep learning [12,33,34,52].
The network structure of the CNN model we used is shown in Figure 3. Firstly, we input the processed multisource remote sensing factor dataset (multichannel images, each channel represents a different factor data) to the CNN model. Then, feature extraction of the input data was realized by convolutional layer and sampling processing of the feature map realized by pooling layer so as to reduce the amount of data while retaining useful information and enhancing the generalization ability of the model. Finally, the features extracted through layer-by-layer transformation and mapping were processed using a fully connected layer and passed to the output layer to output the identification results about landslide (potential hazards) or non-landslide (potential hazards). As for parameter settings, we selected cross-entropy as the loss function to measure the difference between the output and true values of the model, Adam as the optimizer, and set the learning rate to 0.01.
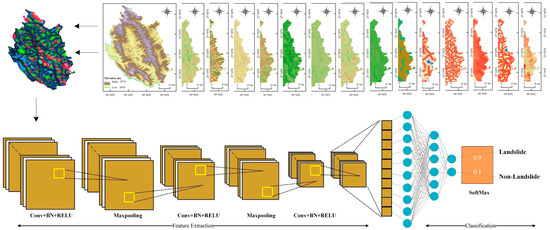
Figure 3.
Model structure used.
In addition to the innovative use of CNN models based on adaptive windows to identify potential landslide hazards, we also tested the effectiveness of CNN models using only 48 × 48, 32 × 32, 16 × 16, and 8 × 8 px fixed windows and SVM. SVM is able to transform the initial input space into a higher-dimension feature space and select the ideal separating hyperplane from the feature space during the modeling phase, thus separating landslide data from non-landslide data [53,54]. SVM has shown good performance in many tasks, including landslide identification and detection, and is a representative machine learning model that is applicable when the dataset is small and the statistical distribution is unknown [6,55].
3.3.2. Main Process of Adaptive Identification
Referring to the idea of adaptive stereo matching, which takes texture features into account [56,57], we adjusted the window size of the model to identify potential landslide hazards according to the degree of deformation within it, specifically by using (the difference between the neighboring pixel deformation variables and the central pixel deformation variables in the local window. The calculation is shown in Equation (1) to measure the richness of deformation information in the window:
where is the window centered on point p, q is a point in the window other than point p, and n is the number of pixel points in the window.
The specific process is shown in Figure 4. Firstly, a relatively large window is initialized for all pixels, and the need to reduce the window size is judged by calculating for each pixel and comparing it with the threshold value T. When > T, this means that the current window of point p contains rich deformation information for the region, there is no need to reduce the window size, and the relatively large window can be directly used for modeling to reduce the calculation of the whole region and improve the efficiency of the algorithm. Conversely, for an area with little deformation, when the window size is too large, most of the reference pixels within it come from the background, which affects the discriminative effect in respect of potential landslide hazards within the window. It is necessary to reduce the window size, then calculate and judge it until the current window size M is equal to the set minimum window size Mmin so as to obtain more useful reference pixels and improve the identification accuracy.
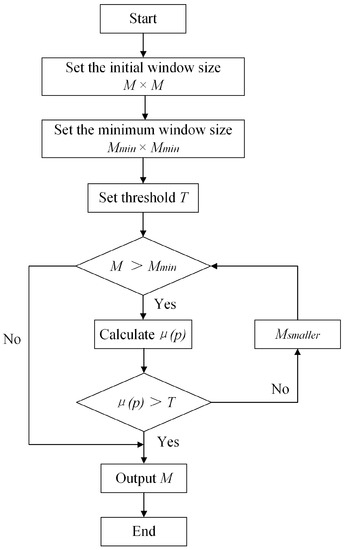
Figure 4.
Adaptive identification flowchart.
4. Results and Discussion
4.1. Multisource Factor Dataset Processing Results
The results of the SPCA of the multisource factor dataset (Table 1, retaining only two decimal points) show that the cumulative contribution of the first five independent principal components is already higher than 95% (up to 99%), indicating that they can represent the whole factor dataset to a great extent. Therefore, based on this observation, multisource data synthesized from the first five bands (Figure 5) were produced as the input to the deep learning model for the adaptive identification of potential landslide hazards.

Table 1.
Percentages and cumulative eigenvalues.
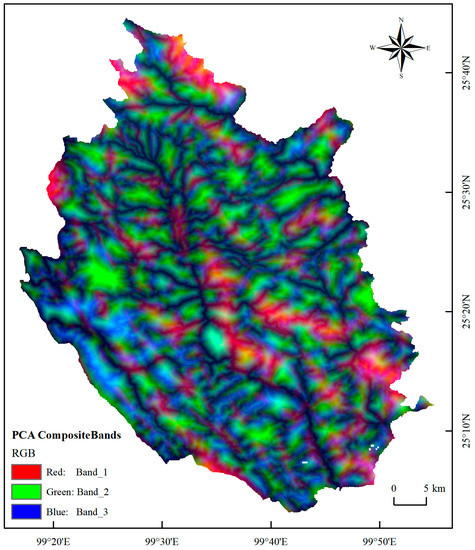
Figure 5.
Synthetic multisource factor dataset after processing by SPCA.
4.2. InSAR Surface Deformation Monitoring Results
Combining the deformation distribution and related experience, we set the deformation rate threshold to 20 mm/a [58]. For the visual grading display of deformation rate results, we divided the deformation results into 6 grades according to < −20, (−20–−10), (−10–0), (0–10), (10–20), and >20, and obtained the InSAR surface deformation monitoring results for the study area (Figure 6). On this basis, the area and percentage of surface deformation monitoring results in different thresholds for ascending and descending orbits were counted (Table 2 and Table 3, respectively). The results show that most of the locations in the study area have stable deformation, and the deformation rate is within the normal range of −20–20 mm/a, with the area accounting for 97.04% of the ascending results and 98.15% of the descending results. A few areas have larger deformation rates, with the absolute value of the deformation rate higher than 20 mm/a, with the area accounting for 2.96% of the ascending results and 1.85% of the descending results. This belongs to the area of heavy deformation, which may have a potential risk of landslide and therefore needs to be given attention. Based on the surface deformation monitoring results, combined with the background and formation conditions of landslides, deformation samples with different window sizes were circled for the initial screening of potential landslide hazard locations.
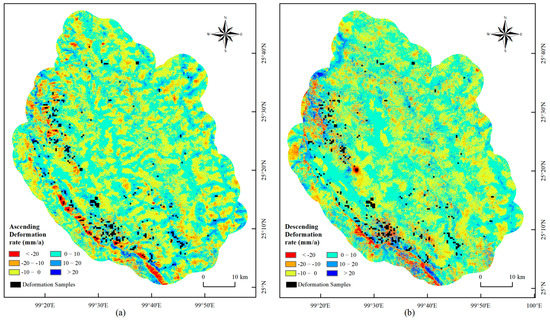
Figure 6.
Monitoring results of ascending (a) and descending (b) surface deformation.
Table 2.
Statistics for InSAR surface deformation anomaly information in the study area (ascending).
Table 3.
Statistics for InSAR surface deformation anomaly information in the study area (descending).
4.3. Adaptive Identification Results of Potential Landslide Hazards
Before the start of the potential landslide hazard adaptive identification experiment, as a comparison, we first constructed CNNs using 48 × 48, 32 × 32, 16 × 16, or 8 × 8 px fixed windows alone. The results show that the model using the 16 × 16 px window alone has the best identification effect, with 76.51% for precision, 74.38% for recall, and 75.43% for F1 score. Then, we carried out experiments on potential landslide hazard identification with different window sizes adaptively adjusted based on , and the results are as follows.
Using 102 landslide samples compiled from multisource data and 352 randomly selected non-landslide samples, the CNN for the 48 × 48 px window was trained and used to identify 120 samples with significant deformation within the 48 × 48 px window, among which a total of 30 landslide samples with significant deformation were identified (taking the 48 × 48 px window as an example, the corresponding samples and their values are shown in Table 4). The quadratic threshold T48 = 0.013 was set, and only the 7 samples with ≥ 0.013 were retained and expanded to some extent using data enhancement techniques. The selected sample dataset was entered into the model for training and the results (Table 4) show that the precision was 79.42%, recall was 77.80%, and F1 score was 78.60%.
Table 4.
48 × 48 px samples of landslides with significant deformation .
Using 310 landslide samples compiled from multisource data and 942 randomly selected non-landslide samples, the CNN with a 32 × 32 px window was trained and used to identify 150 samples with significant deformation within the 32 × 32 px window. Among the landslide samples with significant deformation in the 32 × 32 px window, the 32 × 32 px samples at the location of the above 7 retained 48 × 48 px samples were excluded, so 37 32 × 32 px samples were substantially retained, and a trisection threshold T32 = 0.007 was set, from which only 12 32 × 32 px samples with ≥ 0.007 were further screened. Then, the data enhancement technique was used for some degree of expansion. The selected sample dataset was input into the model for training, and the results (Table 5) show that the precision was 83.63%, recall was 82.92%, and F1 score was 83.27%.
Table 5.
Accuracy evaluation results of adaptive identification.
Using 1040 landslide samples compiled from multisource data and 3168 randomly selected non-landslide samples, the CNN with a 16 × 16 px window was trained and used to identify 300 samples with significant deformation within the 16 × 16 px window. Among the landslide samples with significant deformation in the 16 × 16 px window, the above 12 retained 32 × 32 px samples at the location of the 16 × 16 px samples were excluded, so 69 16 × 16 px samples were substantially retained, and the dichotomous threshold T16 = 0.0038 was set, from which only 35 16 × 16 px samples with ≥ 0.038 were further filtered. Then, after data enhancement of the 140 samples, the number of samples was further expanded using the oversampling technique. The selected sample dataset was input into the model for training, and the results (Table 5) show that the precision was 87.56%, recall was 85.06%, and F1 score was 86.29%.
Using 3744 landslide samples compiled from multisource data and 12,672 randomly selected non-landslide samples, the CNN with an 8 × 8 px window was trained and used to identify 500 samples with significant deformation within the 8 × 8 px window. Among the landslide samples with significant deformation in the 8 × 8 px window, the above 35 retained 8 × 8 px samples at the location of the 16 × 16 px samples were excluded, so 122 8 × 8 px samples were substantially retained. Then, after data enhancement, 488 samples were obtained, and the number of samples was further expanded using the oversampling technique. The selected sample dataset was input into the model for training, and the results (Table 5) show that the precision was 90.57%, recall was 86.35%, and F1 score was 88.41%.
Combining the above adaptive identification results for landslides of different scales, the final identification results were calculated as 85.30% for the precision, 83.03% for the recall, and 84.15% for the F1 score. As shown in Table 6, this result outperforms the identification effect of the 16 × 16 px preferred fixed-window CNN model (compared to the models with 48 × 48, 32 × 32, 16 × 16, and 8 × 8 px fixed windows, which we have found through previous studies [59] to be optimal in this study area) and the traditional machine learning model SVM. Thus, we have demonstrated the effectiveness of the adaptive identification method of potential landslide hazards proposed in this study. These results are better than the recognition effect of the fixed-window CNN [6,33], which proves the effectiveness of the adaptive identification method for potential landslide hazards proposed in this study. In addition, using the potential landslide hazard data provided by Shandong GEO Surveying and Mapping Institute for the study area (56 potential hazards with deformation, of which 20 were covered by deformation samples) for practical testing, a total of 16 potential landslide hazards were identified using the method in this study (Figure 7), and the identification rate was 80%.
Table 6.
Comparison of accuracy evaluation results of different models.
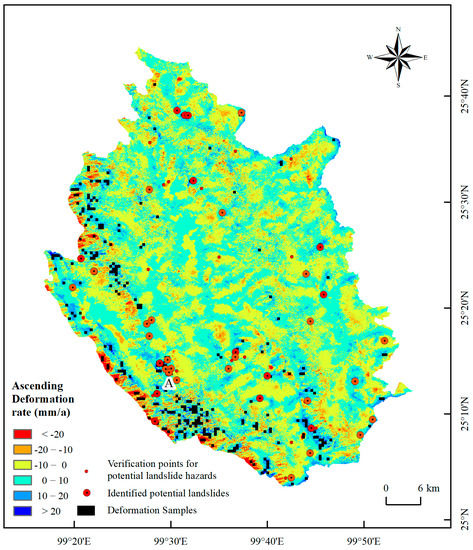
Figure 7.
Results of adaptive identification of potential landslide hazards in the study area.
The information in respect of the potential landslide hazards was further verified through detailed field verification data from Shandong GEO Surveying and Mapping Institute. For example, potential hazard A (99°30′E, 25°14′N) in Figure 7 is located in Songpo Village, Suyang Town, Yongping County. In terms of topography and geomorphology, the elevation range of this potential hazard is 1783–1925 m, with an elevation difference of 142 m. It is a mountain slope terrain, with a slope gradient of about 20° and a slope direction of about 285°. The slope is transformed into cultivated land, with less vegetation cover, bare surface at the back edge, broken surface at the front edge, a large elevation difference, and heavy shadow. The geomorphology comprises a tectonic denudation geomorphic unit, with dense river valleys and gullies, strong weathering of the rock body, mainly denudation, and multilevel razor planes distributed at different elevations. In terms of lithology and geological structure, it belongs to the medium-to-thick laminated harder rock group sandwiched by the thin laminated softer rock group, with a fine-grained structure dominant, joint fissure development, weak weathering resistance of the joint fissure surface, and a soft rock interlayer prone to landslide formation. In terms of hydrology, the topography of the landslide area has a large slope, with slope surface step-like spreading, which is not conducive to the rapid drainage of rainfall at the surface; rainfall is able to fully infiltrate to recharge the underground pore water, creating down-slope runoff, resulting in pore water pressure. At the same time, groundwater infiltration converges at the bedrock surface, softening the clay layer, reducing its shear strength, and forming a potential weak zone, which directly leads to the formation of landslide deformation and settlement under the action of gravity. The optical image is characterized by an overall irregular shape, with clear front and back edges and perimeter. The left lower side of the landslide body has broken topography and has collapsed, with clear steep canyons; the right lower-image texture is blurred, with deformation of terraces and a creeping phenomenon; the left upper-middle has landslide steps and uneven traps. The InSAR deformation is characterized by the deformation rate exceeding the threshold value of 20 mm/a in both the ascending and descending results. Through field verification (Figure 8), it was found that the overall slope of the potential landslide hazard is about 20°, the slide direction is about 285°, the terraces in the middle of the slope are locally slippery, the surface texture of the back edge is rough, the front edge is sloped and unsupported, there are many landslide steps, and the main signs of deformation are located in the middle and lower parts. Through the field investigation, the reliability of this study on the adaptive identification of potential landslide hazards based on multisource factor dataset and multiple InSAR monitoring techniques was once again proved. Inevitably, the identification results we obtained are not always accurate. For example, the deformation rate at B (99°40′E, 25°13′N) in Figure 7 slightly exceeds the threshold value of 20 mm/a. Also, the adaptive modeling results based on the landslide formation context and generation conditions indicate that it can be classified as the potential landslide hazard. However, it was found that this identification result was not accurate enough through field verification. The site did once have a geological hazard potential due to the construction of the road, but the corresponding local hazards have all stabilized at present and the geological environment conditions in its vicinity have improved significantly. Therefore, it is no longer necessary to give priority to its prevention and control as a potential hazard site.
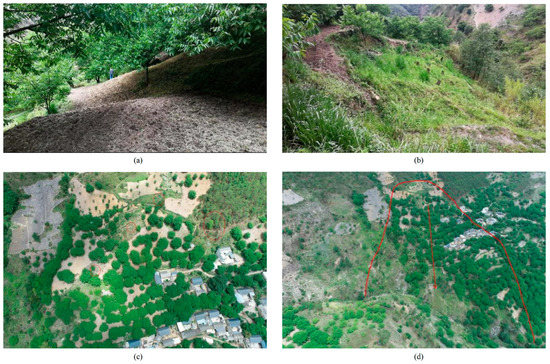
Figure 8.
Field verification survey photos of potential landslide hazard site A: (a) partial decline of terraces, (b) leading edge, (c) trailing edge, and (d) full view.
5. Conclusions
InSAR is an important technical tool for acquiring surface deformation data. Limitations caused by errors in the processing of deformation data make it difficult to identify potential landslide hazards at various deformation scales using only one InSAR technique [19], and the results obtained may not be comprehensive enough [49,50]. Therefore, in this study, the techniques D-InSAR, PS-InSAR, and SBAS-InSAR were jointly used for processing to ensure the reliability of deformation results to the maximum extent. In addition, especially for mountainous study areas with complex topography, areas with large deformation variables or fast deformation rates, which may result from the interference of other factors, need to be analyzed jointly with the geological hazards themselves [31]. In this regard, we developed a multisource factor dataset (covering the main aspects of topography and geology, human activities, hydrology, and vegetation) that can characterize the background and formation conditions of landslides. This has many advantages over the use of traditional geological data, such as a large monitoring range, fast access to information, and a short cycle [30].
In the intelligent identification of potential landslide hazards, the traditional approach of using fixed-size windows to construct deep learning models ignores the different window size requirements of landslides of different scales. Therefore, we proposed an adaptive identification method for potential landslide hazards based on multisource data. In this method, based on the processed multisource dataset and the surface deformation results obtained by combining multiple techniques, the difference between the neighboring pixel deformation variables and the central pixel deformation variables in the local window is used to measure the richness of the deformation information of the window, and then the CNN with different window sizes is adaptively selected to achieve the adaptive identification of potential landslide hazards. The obtained results (precision = 85.30%, recall = 83.03%, F1 score = 84.15%) outperform the optimal model using the 16 × 16 px fixed window and related studies [6,33], demonstrating the effectiveness of the proposed method.
For the proposed method, 16 potential landslide hazards in the study area were effectively identified, and although this identification result is still far from the total number of potential landslides (56), the model was able to better identify 20 of the potential hazards that were covered by the deformation samples. Most of the unidentified potential hazards originate from old landslides with low risk, especially old landslides that have been modified, whose spectra are almost identical to the environment, which greatly increases the difficulty of identification. In the future, a multisource three-dimensional observation system with the integration of sky–air–ground can be achieved using more platform machines, more levels of observation, more sources of data, and more technical means [8] with the help of a multisource three-dimensional observation system composed of satellite platforms (high-resolution optical satellite, InSAR), airborne platforms (airborne LiDAR, unmanned aerial vehicle photogrammetry), and ground platforms (slope surface and internal observation), to achieve more accurate identification of major geological hazards [60].
Author Contributions
Conceptualization, Y.X. and W.Y.; methodology, Y.X. and W.Y.; software, W.Y.; validation, Y.X. and X.Z.; formal analysis, W.Y.; investigation, C.N.; resources, Y.B.; data curation, L.Z. and D.M.; writing—original draft preparation, W.Y.; writing—review and editing, Y.X. and W.Y.; visualization, S.Z.; supervision, Y.X.; project administration, C.N.; funding acquisition, C.N. All authors have read and agreed to the published version of the manuscript.
Funding
This work was supported in part by the Key Technology Research and Development Program of Shandong Provincial Bureau of Geology and Mineral Resources (SDGM) under grant KY202224.
Data Availability Statement
Not applicable.
Acknowledgments
The authors thank all data providers for their efforts in making the data available: SRTM DEM from the National Aeronautics and Space Administration (NASA) and the National Imagery and Mapping Agency (NIMA) of the United States; road and river data from the National Geomatics Center of China; spatial distribution data in respect of landslide hazards published by the Resource and Environment Science and Data Center, Institute of Geographic Sciences and Natural Resources Research of the Chinese Academy of Sciences.
Conflicts of Interest
The authors declare no conflict of interest.
References
- Alimohammadlou, Y.; Tanyu, B.F.; Abbaspour, A.; Delamater, P.L. Automated landslide detection model to delineate the extent of existing landslides. Nat. Hazards 2021, 107, 1639–1656. [Google Scholar] [CrossRef]
- Quesada-Román, A. Landslide risk index map at the municipal scale for Costa Rica. Int. J. Disast. Risk Reduct. 2021, 56, 102144. [Google Scholar] [CrossRef]
- Zhang, T.Y.; Li, Y.N.; Wang, T.; Wang, H.Y.; Chen, T.Q.; Sun, Z.H.; Luo, D.; Li, C.; Han, L. Evaluation of different machine learning models and novel deep learning-based algorithm for landslide susceptibility mapping. Geosci. Lett. 2022, 9, 1–16. [Google Scholar] [CrossRef]
- Deng, L.Z.; Yuan, H.Y.; Zhang, M.Z.; Chen, J.G. Research progress on landslide deformation monitoring and early warning technology. J. Tsinghua Univ. 2022, 63, 1–16. [Google Scholar] [CrossRef]
- Cui, P. Progress and prospects in research on mountain hazards in China. Prog. Geogr. 2014, 33, 145–152. [Google Scholar] [CrossRef]
- Zheng, X.X.; He, G.J.; Wang, S.S.; Wang, Y.; Wang, G.Z.; Yang, Z.Y.; Yu, J.C.; Wang, N. Comparison of machine learning methods for potential active landslide hazards identification with multi-source data. ISPRS Int. J. Geo-Inf. 2021, 10, 253. [Google Scholar] [CrossRef]
- Lissak, C.; Bartsch, A.; Michele, D.M.; Gomez, C.; Maquaire, O.; Raucoules, D.; Roulland, T. Remote sensing for assessing landslides and associated hazards. Surv. Geophys. 2020, 41, 1391–1435. [Google Scholar] [CrossRef]
- Xu, Q.; Guo, C.; Dong, X.J. Application status and prospect of aerial remote sensing technology for geohazards. Acta Geod. Et Cartogr. Sin. 2022, 51, 2020–2033. [Google Scholar] [CrossRef]
- Xu, Q.; Lu, H.Y.; Li, W.L.; Dong, X.J.; Guo, C. Types of potential landslide and corresponding identification technologies. Geomat. Inf. Sci. Wuhan Univ. 2022, 47, 377–387. [Google Scholar] [CrossRef]
- Zhang, Q.; Zhao, C.Y.; Chen, X.R. Technical progress and development trend of geological hazards early identification with multi-source remote sensing. Acta Geod. Et Cartogr. Sin. 2022, 51, 885–896. [Google Scholar] [CrossRef]
- Zhong, C.; Liu, Y.; Gao, P.; Chen, W.L.; Li, H.; Hou, Y.; Nuremanguli, T.; Ma, H.J. Landslide mapping with remote sensing: Challenges and opportunities. Int. J. Remote Sens. 2020, 41, 1555–1581. [Google Scholar] [CrossRef]
- Wang, H.J.; Zhang, L.M.; Yin, K.; Luo, H.Y.; Li, J.H. Landslide identification using machine learning. Geosci. Front. 2021, 12, 351–364. [Google Scholar] [CrossRef]
- Kumar, N.; Verma, A.K.; Sardana, S.; Sarkar, K.; Singh, T.N. Comparative analysis of limit equilibrium and numerical methods for prediction of a landslide. Bull. Eng. Geol. Environ. 2018, 77, 595–608. [Google Scholar] [CrossRef]
- Sardana, S.; Verma, A.K.; Verma, R.; Singh, T.N. Rock slope stability along road cut of Kulikawn to Saikhamakawn of Aizawl, Mizoram, India. Nat. Hazards 2019, 99, 753–767. [Google Scholar] [CrossRef]
- Metternicht, G.; Hurni, L.; Gogu, R. Remote sensing of landslides: An analysis of the potential contribution to geo-spatial systems for hazard assessment in mountainous environments. Remote Sens. Environ. 2005, 98, 284–303. [Google Scholar] [CrossRef]
- Chambers, J.E.; Wilkinson, P.B.; Kuras, O.; Ford, J.R.; Gunn, D.A.; Meldrum, P.I.; Pennington, C.V.L.; Weller, A.L.; Hobbs, P.R.N.; Ogilvy, R.D. Three-dimensional geophysical anatomy of an active landslide in Lias Group mudrocks, Cleveland Basin, UK. Geomorphology 2011, 125, 472–484. [Google Scholar] [CrossRef]
- Lo, C.M.; Feng, Z.Y.; Chang, K.T. Landslide hazard zoning based on numerical simulation and hazard assessment. Geomat. Nat. Hazards Risk 2018, 9, 368–388. [Google Scholar] [CrossRef]
- Li, C.; Su, L.J. Influence of critical acceleration model on assessments of potential earthquake–induced landslide hazards in Shimian County, Sichuan Province, China. Landslides 2021, 18, 1659–1674. [Google Scholar] [CrossRef]
- Sardana, S.; Sinha, R.K.; Verma, A.K.; Jaswal, M.; Singh, T.N. A semi-empirical approach for rockfall prediction along the Lengpui-Aizawl highway Mizoram, India. Geotech. Geol. Eng. 2022, 40, 5507–5525. [Google Scholar] [CrossRef]
- Verma, A.K.; Sardana, S.; Sharma, P.; Dinpuia, L.; Singh, T.N. Investigation of rockfall-prone road cut slope near Lengpui Airport, Mizoram, India. JRMGE 2019, 11, 146–158. [Google Scholar] [CrossRef]
- Huang, Q.Q.; Wang, C.Y.; Meng, Y.; Chen, J.B.; Yue, A.Z. Landslide monitoring using change detection in multitemporal optical imagery. IEEE Geosci. Remote Sens. 2019, 17, 312–316. [Google Scholar] [CrossRef]
- Travelletti, J.; Delacourt, C.; Allemand, P.; Malet, J.P.; Schmittbuhl, J.; Toussaint, R.; Bastard, M. Correlation of multi-temporal ground-based optical images for landslide monitoring: Application, potential and limitations. ISPRS-J. Photogramm. Remote Sens. 2012, 70, 39–55. [Google Scholar] [CrossRef]
- Lu, P.; Casagli, N.; Catani, F.; Tofani, V. Persistent scatterers interferometry hotspot and cluster analysis (PSI-HCA) for detection of extremely slow-moving landslides. Int. J. Remote Sens. 2012, 33, 466–489. [Google Scholar] [CrossRef]
- Luzi, G.; Pieraccini, M.; Mecatti, D.; Noferini, L.; Guidi, G.; Moia, F.; Atzeni, C. Ground-based radar interferometry for landslides monitoring: Atmospheric and instrumental decorrelation sources on experimental data. T-GRS 2004, 42, 2454–2466. [Google Scholar] [CrossRef]
- Wang, Z.D.; Wen, X.H.; Tang, W.; Liu, H.; Wang, D.F. Early detection of geological hazards in Longmenshan-Dadu river area using various InSAR techniques. Geomat. Inf. Sci. Wuhan Univ. 2020, 45, 451–459. [Google Scholar] [CrossRef]
- Abdulwahid, W.M.; Pradhan, B. Landslide vulnerability and risk assessment for multi-hazard scenarios using airborne laser scanning data (LiDAR). Landslides 2017, 14, 1057–1076. [Google Scholar] [CrossRef]
- Zhou, S.; Ouyang, C.J.; Huang, Y. An InSAR and depth-integrated coupled model for potential landslide hazard assessment. Acta Geotech. 2022, 17, 3613–3632. [Google Scholar] [CrossRef]
- Zhang, Y.; Meng, X.M.; Dijkstra, T.A.; Jordan, C.J.; Chen, G.; Zeng, R.Q.; Novellinod, A. Forecasting the magnitude of potential landslides based on InSAR techniques. Remote Sens. Environ. 2020, 241, 111738. [Google Scholar] [CrossRef]
- Zhang, L.L.; Dai, K.; Deng, J.; Ge, D.Q.; Liang, R.B.; Li, W.L.; Xu, Q. Identifying potential landslides by stacking-InSAR in southwestern China and its performance comparison with SBAS-InSAR. Remote Sens. 2021, 13, 3662. [Google Scholar] [CrossRef]
- Zhao, C.Y.; Lu, Z. Remote sensing of landslides—A review. Remote Sens. 2018, 10, 279. [Google Scholar] [CrossRef]
- Dong, J.H.; Niu, R.Q.; Qi, M.R.; Ding, Z.; Xu, H.; He, R. Identification of geological hazards based on the combination of InSAR technology and disaster background indicators. Bull. Geol. Sci. Technol. 2022, 41, 187–196. [Google Scholar] [CrossRef]
- Huang, H.F.; Xue, R.H.; Zhao, B.B.; Yi, W.; Deng, Y.H.; Dong, Z.H.; Liu, Q.; Yi, Q.L.; Zhang, G.D. The bedding rock landslide identification in the head area of the Three Gorges Reservoir combined with disaster pregnant mechanism and comprehensive remote sensing method. Acta Geod. Et Cartogr. Sin. 2022, 51, 2056–2068. [Google Scholar] [CrossRef]
- Yi, Y.N.; Zhang, Z.J.; Zhang, W.C.; Jia, H.H.; Zhang, J.Q. Landslide susceptibility mapping using multiscale sampling strategy and convolutional neural network: A case study in Jiuzhaigou region. Catena 2020, 195, 104851. [Google Scholar] [CrossRef]
- Yang, X.; Liu, R.; Yang, M.; Chen, J.J.; Liu, T.Q.; Yang, Y.T.; Chen, W.; Wang, Y.T. Incorporating landslide spatial information and correlated features among conditioning factors for landslide susceptibility mapping. Remote Sens. 2021, 13, 2166. [Google Scholar] [CrossRef]
- Long, X.Y.; Li, H.; Bai, X.S.; Zhai, X.; Wang, X.M.; Pan, Y. Automatic identification of man-made potential landslides by deep learning. Yangtze River 2023, 54, 1–10. Available online: http://kns.cnki.net/kcms/detail/42.1202.TV.20230130.1435.013.html (accessed on 20 January 2023).
- Huang, W.B.; Ding, M.T.; Wang, D.; Jiang, L.W.; Li, Z.H. Evaluation of landslide susceptibility based on layer adaptive weighted convolutional neural network model along sichuan-tibet traffic corridor. Earth Sci. 2022, 47, 2015–2030. [Google Scholar] [CrossRef]
- Soares, L.P.; Dias, H.C.; Garcia, G.P.B.; Grohmann, C.H. Landslide segmentation with deep learning: Evaluating model generalization in rainfall-induced landslides in Brazil. Remote Sens. 2022, 14, 2237. [Google Scholar] [CrossRef]
- Ghorbanzadeh, O.; Blaschke, T.; Gholamnia, K.; Meena, S.R.; Tiede, D.; Aryal, J. Evaluation of different machine learning methods and deep-learning convolutional neural networks for landslide detection. Remote Sens. 2019, 11, 196. [Google Scholar] [CrossRef]
- Baidu Encyclopedia. Yongping County. 2022. Available online: https://baike.baidu.com/item/%E6%B0%B8%E5%B9%B3%E5%8E%BF/3556662?fr=aladdin (accessed on 20 December 2022).
- Yongping County People’s Government Office. Yongping Overview. 2022. Available online: http://www.ypx.gov.cn/ypxrmzf/c102483/zjyp.shtml (accessed on 20 December 2022).
- Farr, T.G.; Kobrick, M. Shuttle radar topography mission produces a wealth of data. Eos Trans. Amer. Geophys. Union 2000, 81, 583–585. [Google Scholar] [CrossRef]
- National Geomatics Center of China. 1:250,000 National Basic Geographic Database. 2022. Available online: https://www.webmap.cn/commres.do?method=result25W (accessed on 20 December 2022).
- Fick, S.E.; Hijmans, R.J. WorldClim 2: New 1-km spatial resolution climate surfaces for global land areas. Int. J. Climatol. 2017, 37, 4302–4315. [Google Scholar] [CrossRef]
- Vermote, E.; Justice, C.; Claverie, M.; Franch, B. Preliminary analysis of the performance of the Landsat 8/OLI land surface reflectance product. Remote Sens. Environ. 2016, 185, 46–56. [Google Scholar] [CrossRef] [PubMed]
- Sajadi, P.; Sang, Y.F.; Gholamnia, M.; Bonafoni, S.; Brocca, L.; Pradhan, B.; Singh, A. Performance evaluation of long NDVI timeseries from AVHRR, MODIS and landsat sensors over landslide-prone locations in Qinghai-Tibetan Plateau. Remote Sens. 2021, 13, 3172. [Google Scholar] [CrossRef]
- Zhang, X.; Yin, W.P.; Xie, F.; Fan, H.; Chen, F. Habitat suitability evaluation of Asian elephants in the Yuanjiang-Lixianjiang River Basin based on meta-analysis and remote sensing big data. Acta Ecol. Sin. 2022, 42, 5067–5078. [Google Scholar] [CrossRef]
- Artoni, F.; Delorme, A.; Makeig, S. Applying dimension reduction to EEG data by Principal Component Analysis reduces the quality of its subsequent Independent Component decomposition. NeuroImage 2018, 175, 176–187. [Google Scholar] [CrossRef] [PubMed]
- Li, H.H.; Ma, T.H.; Wang, K.; Tan, M.; Liang, J.F. Construction of ecological security pattern in northern Peixian based on MCR and SPCA. J. Ecol. Rural Environ. 2020, 36, 1036–1045. [Google Scholar] [CrossRef]
- Zou, T.; Yoshino, K. Environmental vulnerability evaluation using a spatial principal components approach in the Daxing’anling region, China. Ecol. Indic. 2017, 78, 405–415. [Google Scholar] [CrossRef]
- Zheng, Z.Z.; Xie, C.H.; He, Y.; Zhu, M.C.; Huang, W.F.; Shao, T.M. Monitoring potential geological hazards with different InSAR algorithms: The case of western Sichuan. Remote Sens. 2022, 14, 2049. [Google Scholar] [CrossRef]
- LeCun, Y.; Bottou, L.; Bengio, Y.; Haffner, P. Gradient-based learning applied to document recognition. Proc. IEEE 1998, 86, 2278–2324. [Google Scholar] [CrossRef]
- Ding, A.Z.; Zhang, Q.Y.; Zhou, X.M.; Dai, B.C. Automatic recognition of landslide based on CNN and texture change detection. In Proceedings of the 2016 31st Youth Academic Annual Conference of Chinese Association of Automation (YAC), Wuhan, China, 11–13 November 2016; pp. 444–448. [Google Scholar]
- Aslam, B.; Zafar, A.; Khalil, U. Development of integrated deep learning and machine learning algorithm for the assessment of landslide hazard potential. Soft Comput. 2021, 25, 13493–13512. [Google Scholar] [CrossRef]
- Kavzoglu, T.; Colkesen, I. A kernel functions analysis for support vector machines for land cover classification. Int. J. Appl. Earth Obs. 2009, 11, 352–359. [Google Scholar] [CrossRef]
- Fang, Z.; Wang, Y.; Duan, H.; Niu, R.; Peng, L. Comparison of general kernel, multiple kernel, infinite ensemble and semi-supervised support vector machines for landslide susceptibility prediction. Stoch. Environ. Res. Risk A 2022, 36, 3535–3556. [Google Scholar] [CrossRef]
- Dong, L. Research and application of patch match stereo matching algorithm based on adaptive window. Wuhan Polytech. Univ. 2022. [Google Scholar] [CrossRef]
- Ma, D.L.; Mao, L.B.; Wu, D.H.; Shi, Z. An adaptive dense matching method considering texture features. Sci. Surv. Mapp. 2022, 47, 70–78, 101. [Google Scholar] [CrossRef]
- Yang, C.S.; Dong, J.H.; Zhu, S.N.; Xiong, G.H. Detection, identification and deformation characteristics of landslide groups by InSAR in Batang section of Jinsha river convergence zone, China. J. Earth Sci. Environ. 2021, 43, 398–408. [Google Scholar] [CrossRef]
- Niu, C.; Yin, W.; Xue, W.; Sui, Y.; Xun, X.; Zhou, X.; Zhang, S.; Xue, Y. Multi-window identification of landslide hazards based on InSAR technology and factors predisposing to disasters. Land 2023, 12, 173. [Google Scholar] [CrossRef]
- Xu, Q.; Dong, X.J.; Li, W.L. Integrated space-air-ground early detection, monitoring and warning system for potential catastrophic geohazards. Geomat. Inf. Sci. Wuhan Univ. 2019, 44, 957–966. [Google Scholar] [CrossRef]
Disclaimer/Publisher’s Note: The statements, opinions and data contained in all publications are solely those of the individual author(s) and contributor(s) and not of MDPI and/or the editor(s). MDPI and/or the editor(s) disclaim responsibility for any injury to people or property resulting from any ideas, methods, instructions or products referred to in the content. |
© 2023 by the authors. Licensee MDPI, Basel, Switzerland. This article is an open access article distributed under the terms and conditions of the Creative Commons Attribution (CC BY) license (https://creativecommons.org/licenses/by/4.0/).