1. Introduction
Chang’E-3 (CE-3), the first Chinese lunar lander and rover mission, was launched at 17:30 on 1 December 2013 (UTC). On 14 December 2013 (UTC), it succeeded in landing on the Moon’s surface, and the Yutu (Jade Rabbit, named from the Chinese mythology) rover was separated from the lander about 8 h later after soft landing on the Moon [
1]. The success of this mission marks the first soft landing on the Moon since 1976. The CE-3 landing site is in northern Mare Imbrium at (44.12
N, 19.51
W), near the boundary of two different geologic units [
2,
3,
4,
5,
6]. The landing site sits on “young” Eratosthenian lava flows that spread several hundred to thousands of kilometers [
3,
5,
7]. These lava flows have an estimated depth ranging from approximately 31 m to 43 m, with an average of around 37 m [
7]. The mare basalts in the landing site are believed to have formed from the lava flows around 2.35 brillion years ago (Ga) based on crater counting [
7], which are significantly younger than all of the lunar samples returned prior to the CE-3 in-situ measurements, dating from 3.1 to 3.8 Ga [
4].
This makes the landing site of great scientific value for investigating the geochemical characteristics of relatively young lunar samples with in-situ detection, the Eratosthenian lava flows, and lunar magma evolution in a later stage.
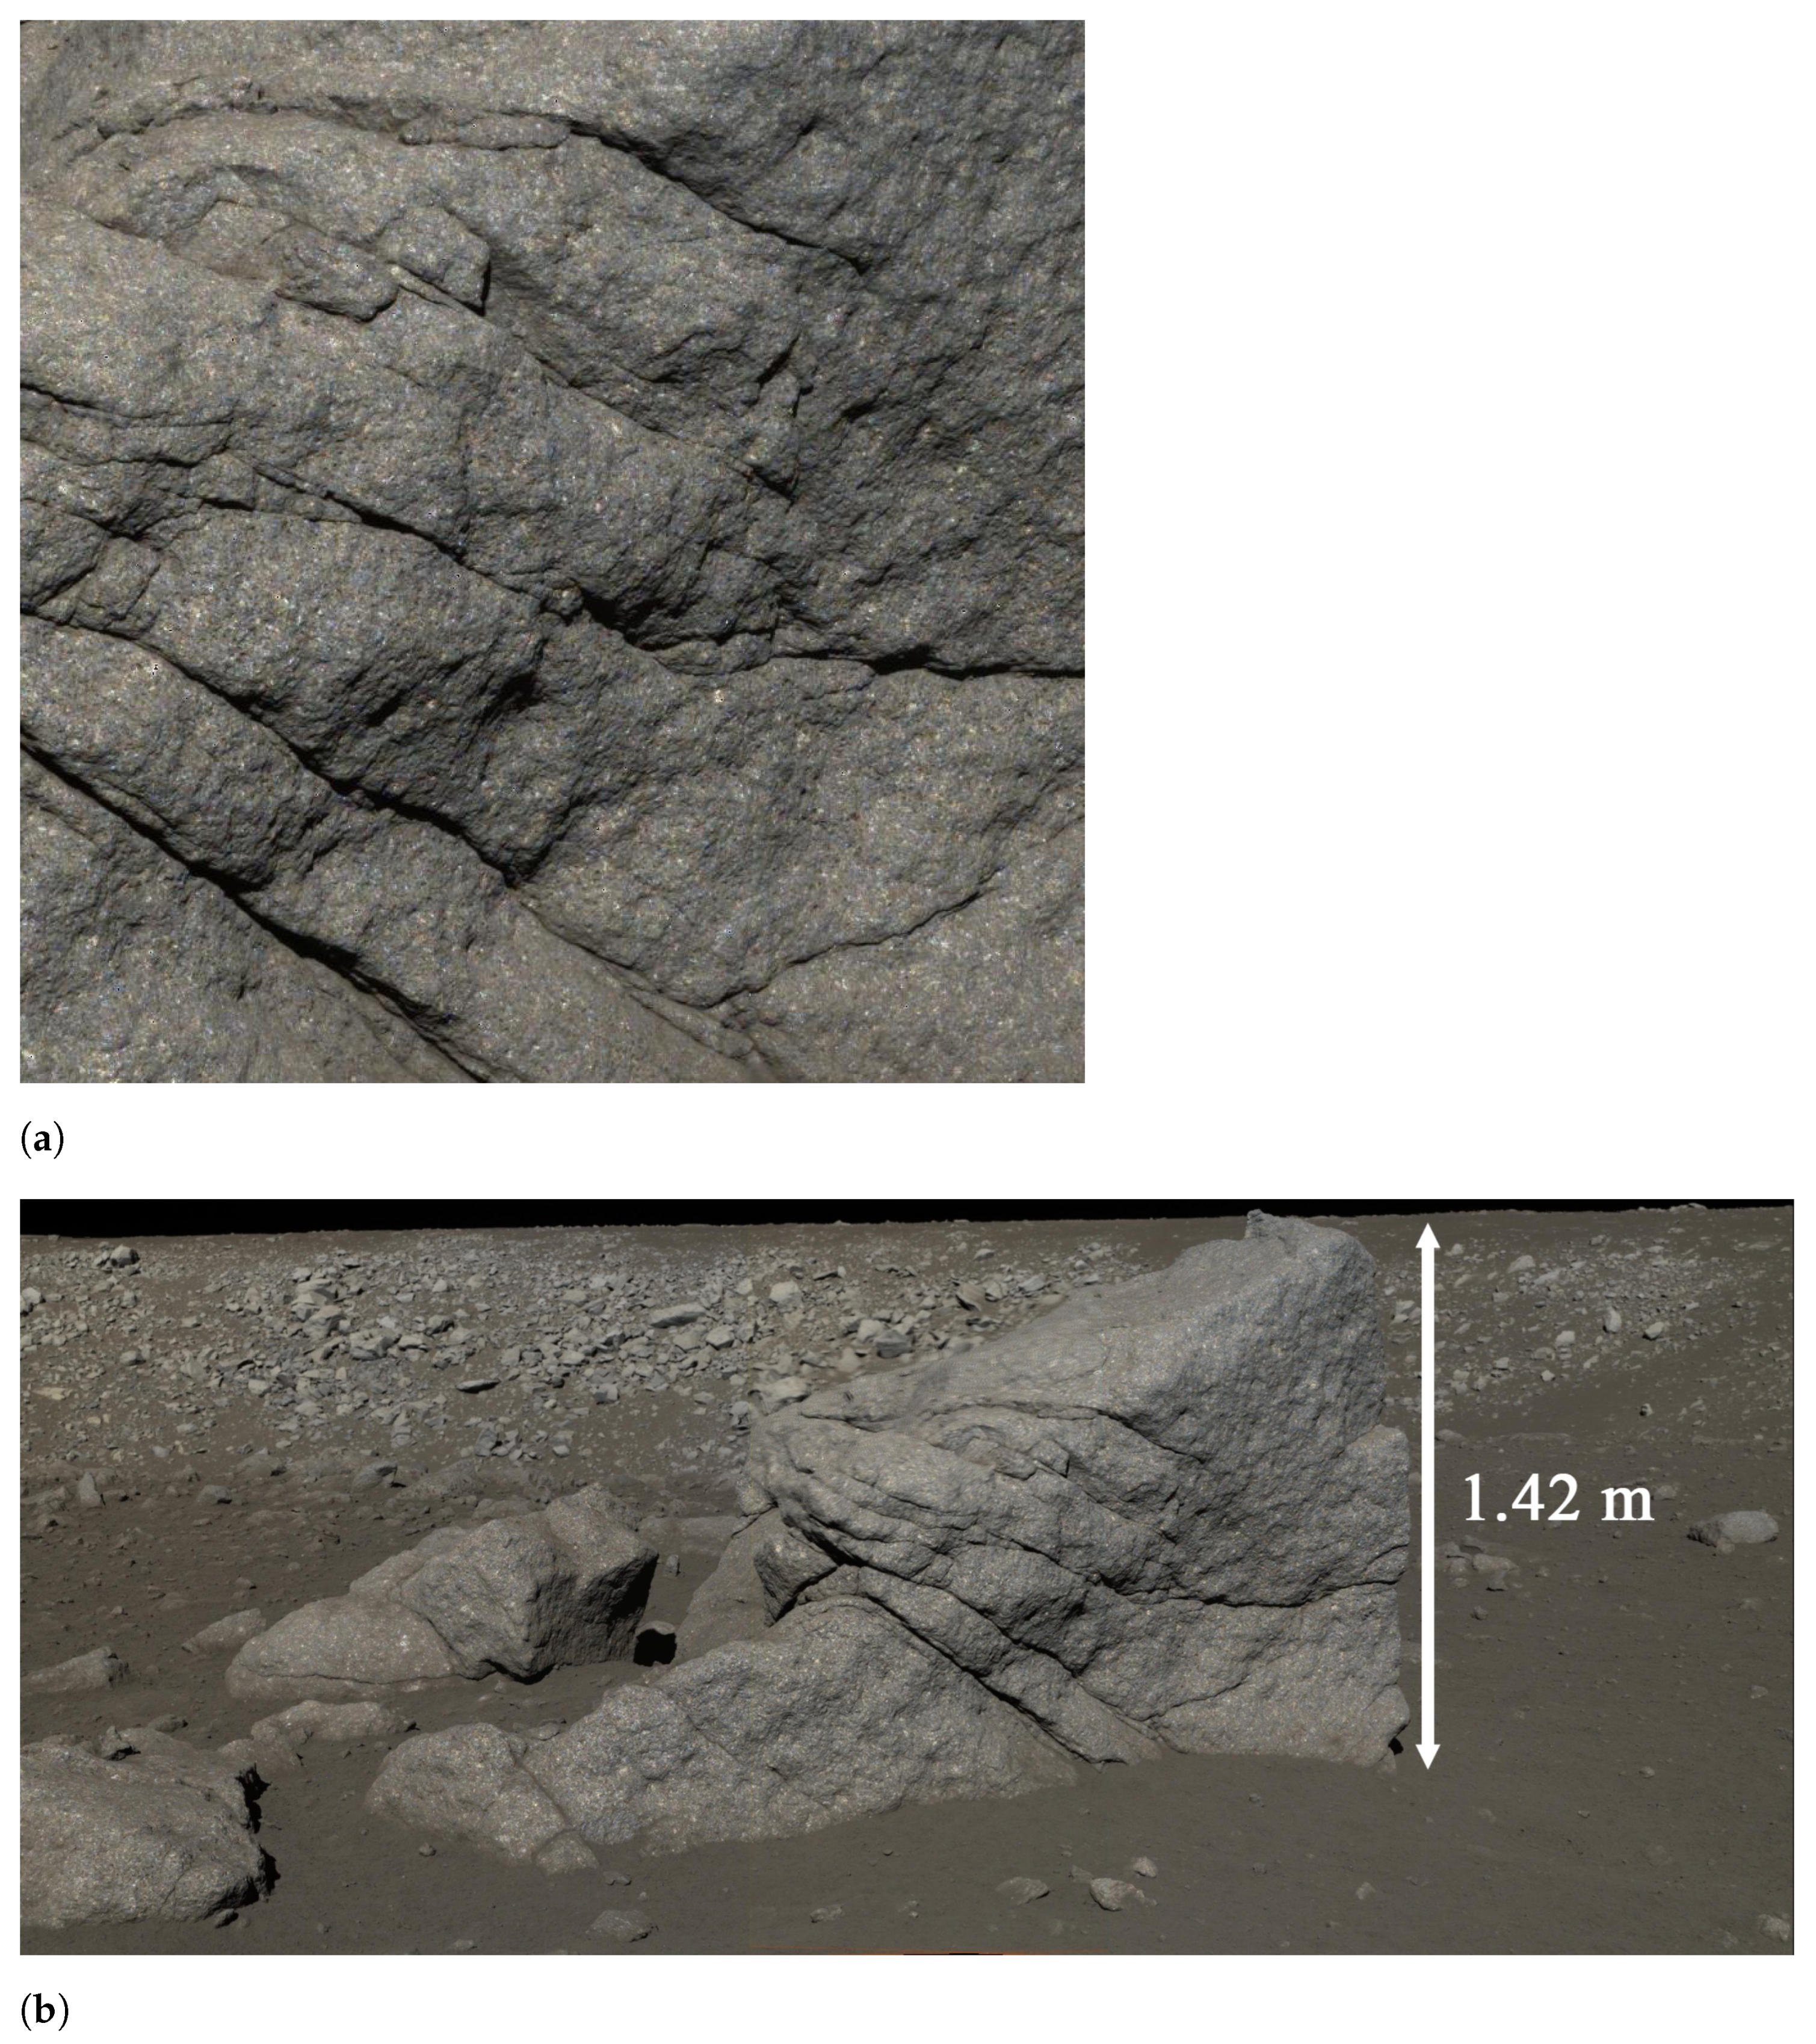
Yutu landed at 50 m away from the eastern ring of a crater Zi Wei, with a diameter of ~450 m (see Figure 1 in [
8] and
Figure 1). Based on the crater counting, crater Zi Wei has a model age of ~27–80 My ago [
8,
9]. Yutu travelled around the rims of crater Zi Wei; the roving area is full of sputtered rocks which are partially bedded under a thin regolith with about 1 m thickness based on the data of Yutu’s Lunar Penetrating Radar (LPR) [
8]. The ejecta layer has a thickness of ~4 m. Under the ejecta layer, a boulder-bearing paleoregolith layer from space weathering and the impact gardening of the Eratosthenian basalts (2.35–2.95 Ga) extends to the depth of ~8 m [
8]. The layer of Eratosthenian basalts extends to the depths of ~50 m followed by a ~10 m paleoregolith formed on top of ~90 m thick Imbrian basalts, which are the latest Imbrian basalts that filled the basin around 3.3 Ga [
5,
8].
In previous lunar missions, a broad region around the CE-3 landing site was investigated by the orbital chemical compositional measurements from the Gamma-Ray Spectrometer (GRS) onboard Lunar Prospector (LP), Ultraviolet/Visible (UV-VIS) camera onboard Clementine, Multispectral Imager (MI) onboard SELENE-1, and Moon Mineralogy Mapper (M) onboard Chandrayaan-1.
Using the remote sensing measurements from LP-GRS, the chemical compositions of the adjacent region of the CE-3 landing site (43.0
–45.0
N, 17.5
–20.0
W) were derived by Prettyman et al., 2006 [
10]. The measurements showed the FeO content of 20.4 wt.% and TiO
content of 5.0 wt.% (2
per pixel binning). However, the spatial resolution of LP-GRS is dependent on the spacecraft’s height above the lunar surface [
11], and is ~60 km/pixel (equal area of 2
2
) [
10,
11,
12], which may not be sufficient for detailed geological analysis. This means the elemental abundance data represent the mean values on a broad regional scale, whereas it still provides us with significant results for valuable information, e.g., characterizing geological units and classifying rock types.
Along with CE-3 mission, which is a landing on Moon after a long period of time since Apollo missions, the remote sensing studies with advanced instruments reported on the CE-3 landing site as well. The Clementine UV-VIS data (average spatial resolution of 115 m/pixel) indicate the FeO content of ~19 wt.% and TiO
content of 5–7 wt.% for the region near the CE-3 landing site, as given by Ling et al., 2015 [
3]. Also, using the highest spatial resolution of about 20 m/pixel data of MI onboard SELENE-1 available, the study area including the CE-3 landing site (see unit Em (Eratosthenian mare materials) in Figure 8 in [
5]) has the abundances of FeO of ~18 wt.% and TiO
of 5–10 wt.%, which is obtained by Zhao et al., 2014 [
5]. It should be noted that there is a slight difference between the results of LP-GRS and MI onboard SELENE-1, given by Prettyman et al., 2006 [
10] and Zhao et al., 2014 [
5], respectively, for the FeO content in particular; additionally, their results for the TiO
content seem at the upper limit of the class of low-Ti mare basalts or should be attributed, to some degree, up to low-intermediate Ti mare basalts. Furthermore, the high spatial resolution of ~140 m/pixel and 85 spectral bands observational data of the M
onboard Chandrayaan-1 were mapped into 83 different spectral units in Mare Imbrium in Thiessen et al., 2014 [
6]. As marked in Figure 2A in [
6], the CE-3 landing site is located within the unit numbered 80, suggesting in favor of high-Ti basalts and confirmed in the 2860 nm map, but adjacent to the southern boundary of the low-Ti unit numbered 8. It also indicates that unit 80 is olivine and/or clinopyroxene richer than unit 8, as shown in the absorption bands minima at 1000 and 2000 nm [
6]. While compared with the above-mentioned remote sensing studies, it is noticed that the abundance of TiO
needs to be accurately identified since it is probably spectral mixing due to regolith formation, as pointed out by Thiessen et al., 2014 [
6]; besides, according to Wang and Wang, 2015 [
13], the two lunar soils in CE-3 landing site are suggested that it may be the fragments of low-Ti mare basalts (<6 wt.% TiO
) based on the APXS data. Herein, in-situ measurements from APXS can provide a much better statistical and spatial resolution data, and thus the APXS onboard Yutu rover can verify the major elements concentrations of the roving area in this study.
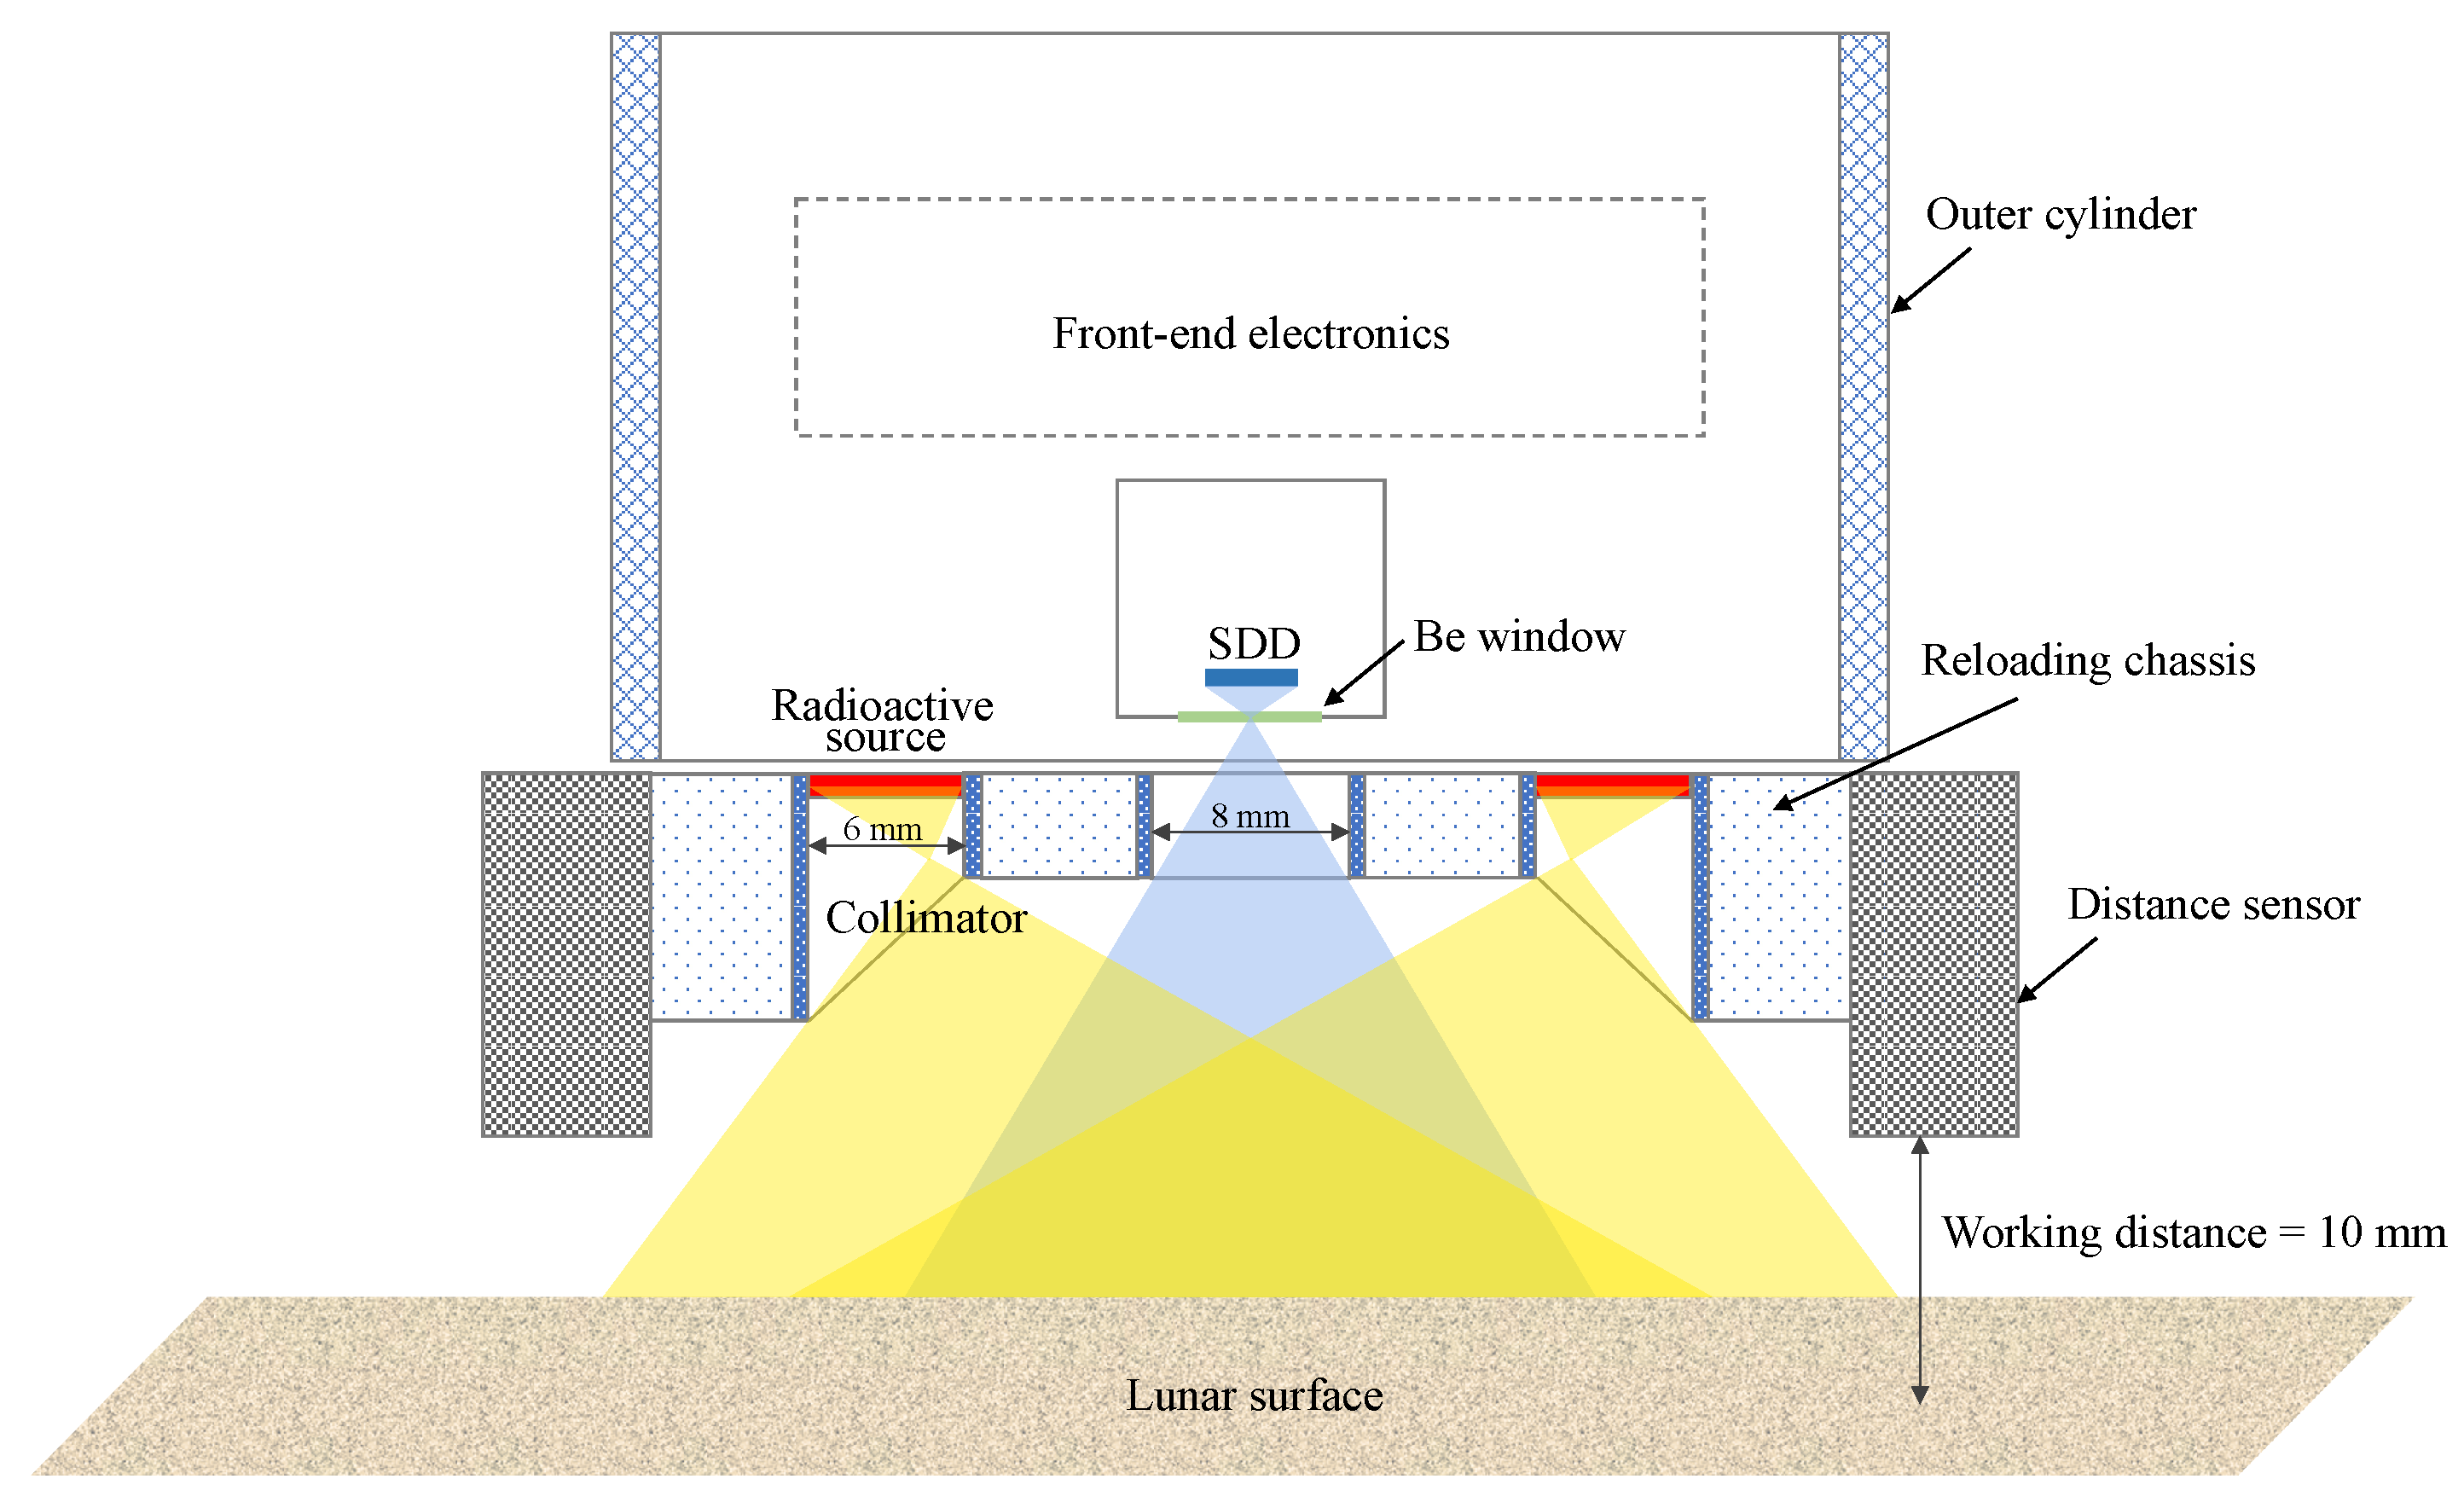
Chemical elements concentrations of the roving area were measured from the Active Particle-induced X-ray Spectrometer (APXS). APXS is the sole payload mounted on the robotic arm of the Yutu rover. It utilizes incident X-rays emitting from radioactive sources to irradiate the surface material, resulting in the production of fluorescent characteristic X-rays. By analyzing the fluorescent X-ray spectra recorded by APXS, one could derive the concentrations of major elements such as Mg, Al, Si, Ca, Ti, and Fe of the measured lunar samples. Zhang et al., 2015 [
2], Ling et al., 2015 [
3], and Wang and Wang, 2015 [
13] utilized the APXS data to derive the elemental concentrations in CE-3 landing site with different methods.
In the following, we will briefly describe the method used in their studies. (1) Zhang et al., 2015 [
2] used a method to derive the elemental concentrations of the CE-3 soil samples by fitting the net peak areas from the spectra. The method involved correcting for background and overlapping peaks and eliminating the effect of the decay of the
Fe and
Cd sources. The calibration was conducted using ground standards and working references. The data analysis were processed using PyMca software. We note that the method is dependent on the calibration by ground laboratory standards upon analysis; besides, the accuracy of the result depends on the calibration by ground laboratory standards, which must have similar geological features, such as porosity, to the lunar soil sample and sufficient amounts, for example, a total of 10 standard samples used in their study [
2]. Additionally, ground instruments are required to conduct the measurement under environmental conditions similar to those on the Moon and have the same working status as the APXS on the Moon. The relative statistical errors resulted from the uncertainties of the peak areas, which are estimated to be <1–3% for Si, K, Ca, Ti, and Fe, <6% for Al, and <15% for Mg. The uncertainties of calibrations are not included upon analysis. (2) Ling et al., 2015 [
3] used the method as follows. One obtained the peak-area ratio of measured samples and calibration target for each element by spectral curve fitting iteratively until convergence using GRAMS software, wherein the spectra underwent background removal. After that, the peak-area ratio was multiplied by the known concentration of the corresponding element in the calibration target. Hence, the elemental concentrations of the CE-3 soil samples were derived. Of note here is that their method is appropriate to the case in a simplified situation because it involved a series of effects during the measurement, such as the detector efficiency, the radioactive source strength, the collimator effect, and the surface effect. (3) Wang and Wang, 2015 [
13] used the method that generally similar to Ling et al., 2015 [
3], but deepened in three aspects: the fitting employed a sensitive nonlinear iterative peak-clipping method (SNIP) as the estimation of continuous background and a nonlinear least-squares fitting method (Hypermet function) to obtain the net area of each characteristic peak; by employing a finite element method, the design of APXS as wedge-shaped was taken into account that the generated fluorescent X-ray is obstructed by the collimator; the correction for surface effects was taken into consideration by increasing the measured characteristic peak area of elements Mg–Cr by 15%, as provided by an evaluation through Monte-Carlo technique in Wu, 2012 [
14], since the X-ray fluorescence intensity changes with respect to the irregular surface of the Moon, though the chemical composition of the calibration target is constant, specifically, the relatively low X-ray energies would significantly decline compared to X-rays with higher energies, and the effect is obvious in the circumstances of large particle size and/or phase angle [
15,
16,
17].
Additionally, we note that the relative errors of the low Z elements are supposedly larger than that of the other relatively high Z elements due to some extent to the limitation of the energy resolution of the APXS, but the results of both Refs. [
3,
13] show a contrary case in their relative errors of MgO and FeO. Moreover, as pointed out by Wang and Wang, 2015 [
13], the content of FeO might be evaluated higher than that of the real situation because of an estimation of continuous background by the SNIP method. We add that the content of TiO
has the same effect in the case too. The determination of the spectrum for the silicon drift detector is a crucial step for the derivation of the major elements concentrations. In the APXS spectrum, it is necessary to account for the asymmetric tail at the low-energy side of the characteristic peak, i.e., tailing effect. This tail includes the exponential tail and the shelf tail, and is detector specific (e.g., thickness, dead layer, front contact composition, sample-source-detector geometry, and collimator). The exponential tail is caused by a known effect in X-ray spectroscopy, called incomplete charge collection (ICC). The shelf tail structure, on the other hand, particularly arises from Compton scattering X-rays and possible radiative Auger effect (RAE), and its contribution is generally considered part of the background. It is noted here that the shortcomings of the SNIP method for estimating background is discussed in detail at the end of
Section 2.2. The asymmetric tail cannot be described by a simple analytical function (cf. Equations (
4) and (
5)) [
18,
19,
20,
21]. If the tail contribution is neglected, it gives rise to uncertainties in the spectrum fit because of the superposition with the continuous background, which affects the estimation of those chemical contents when their elemental peaks are superimposed by the low-energy shelf tail of a major peak [
18].
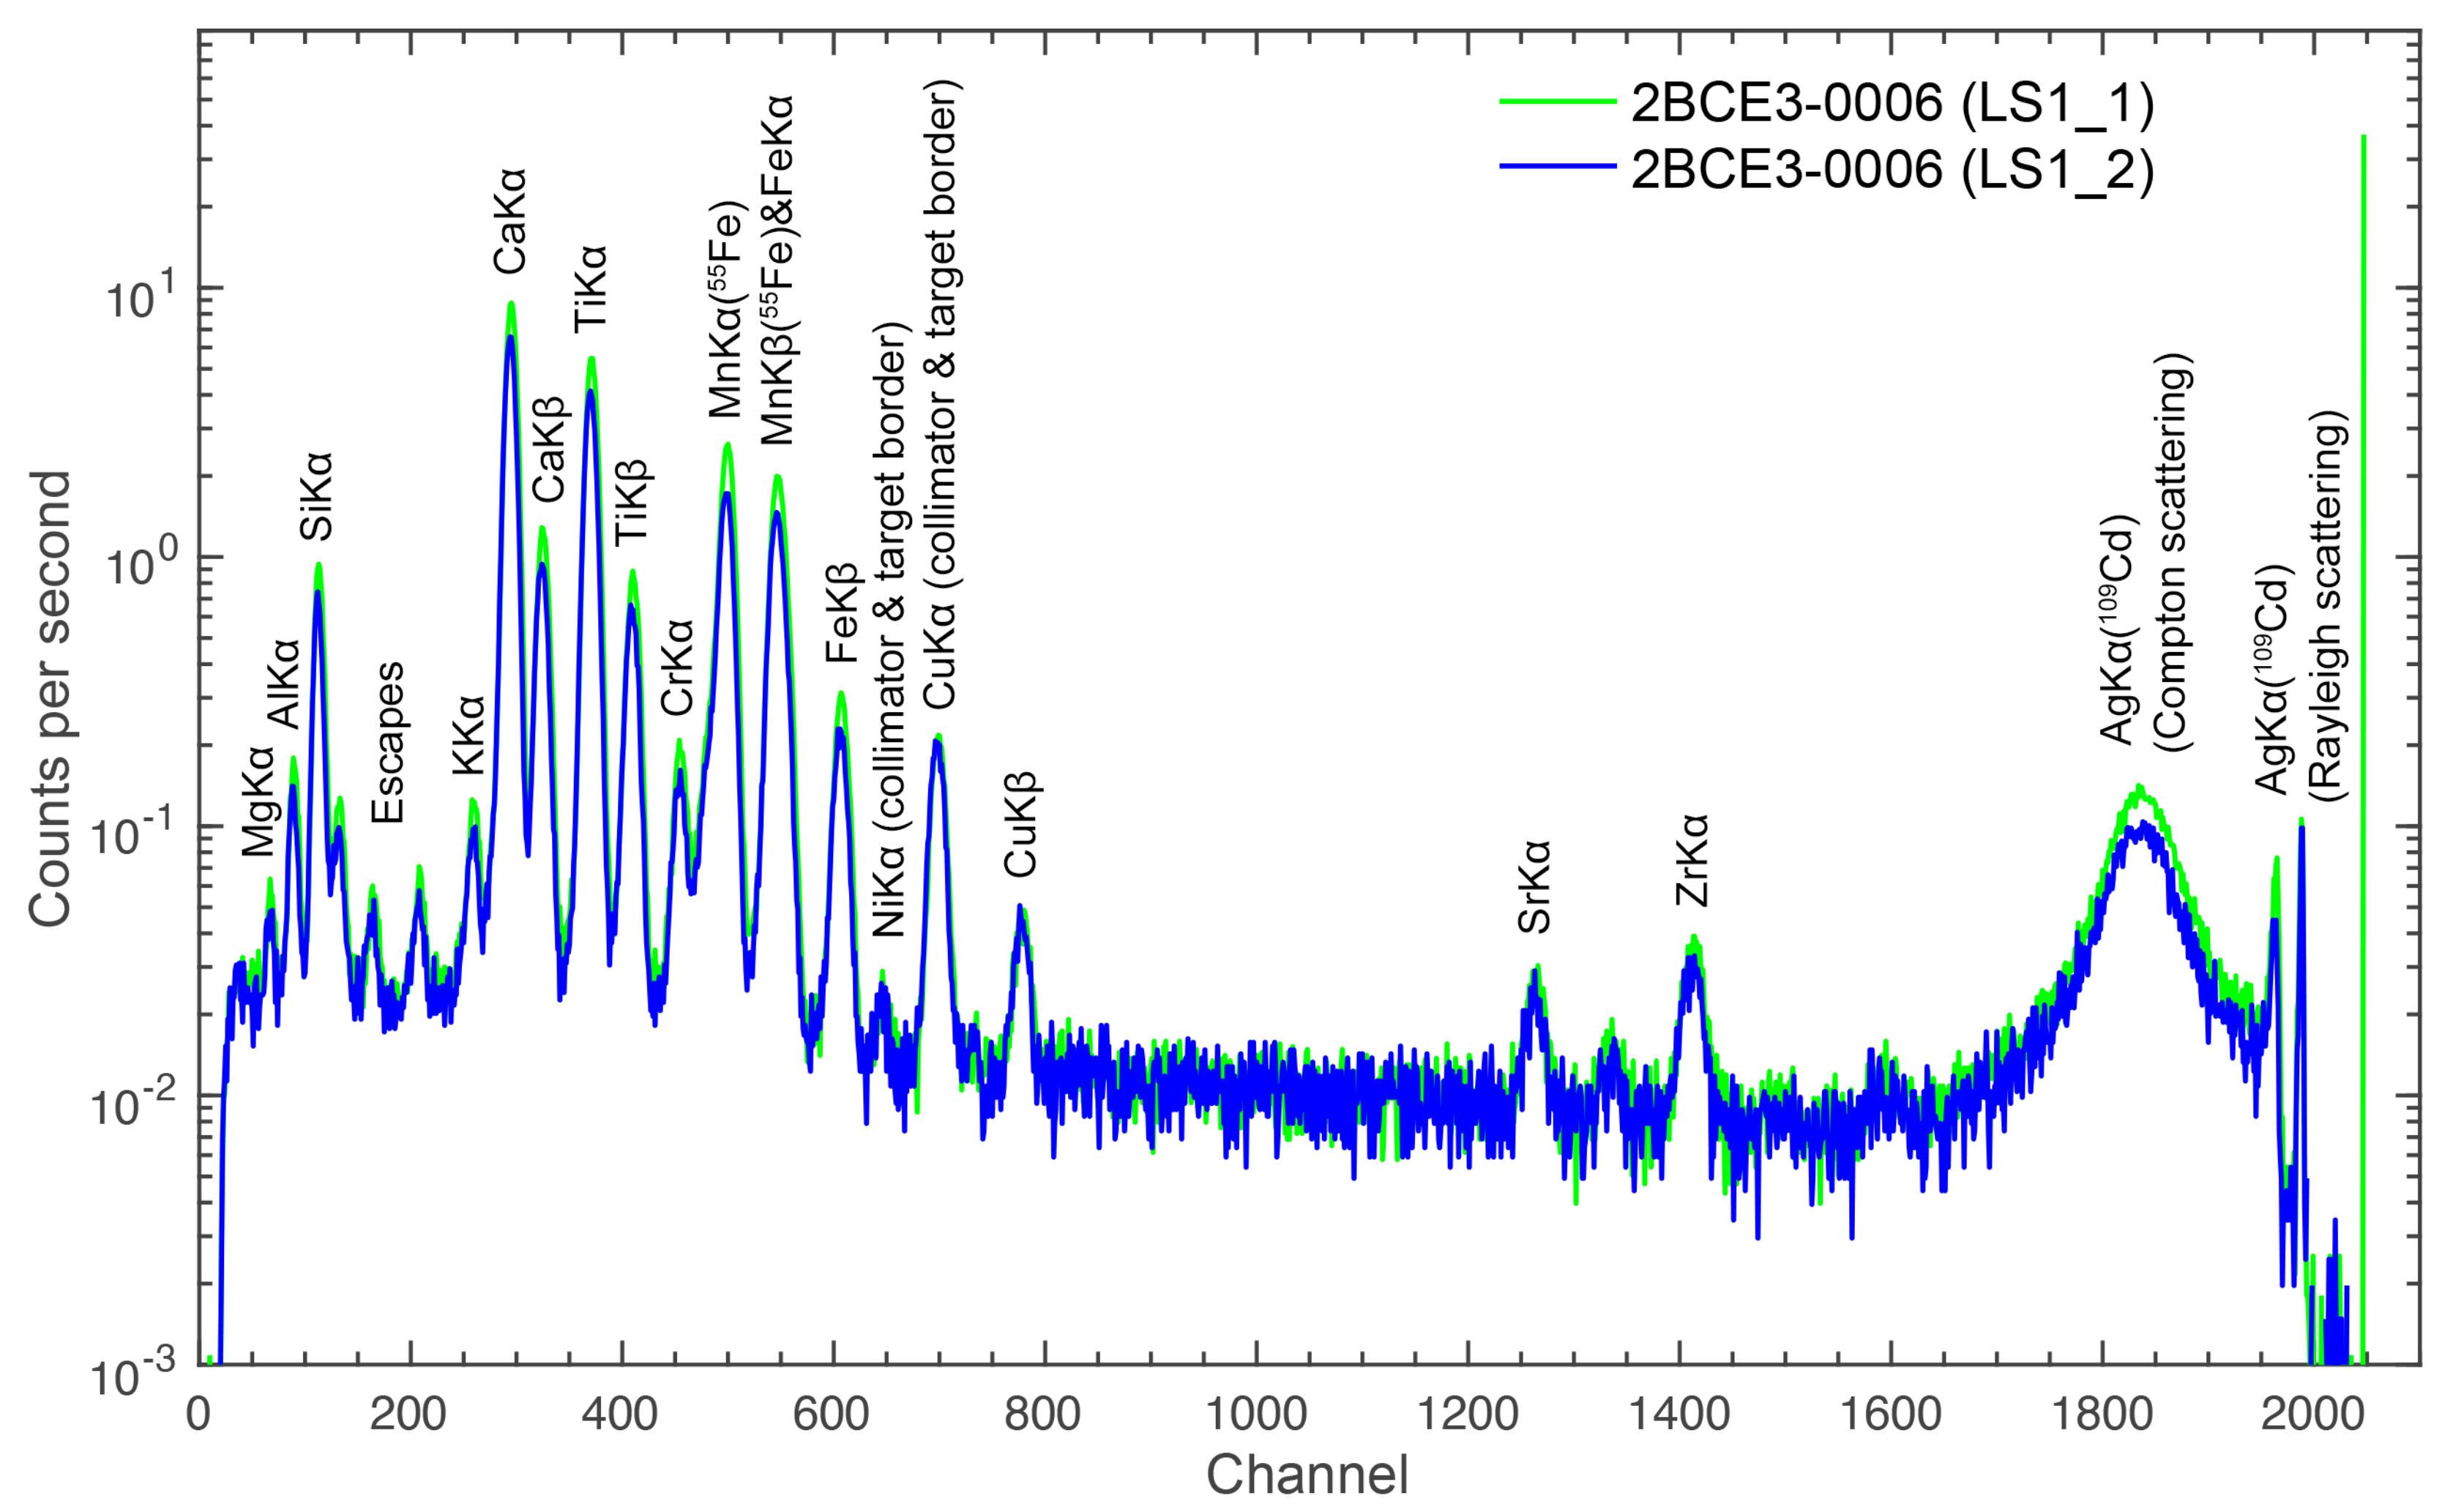
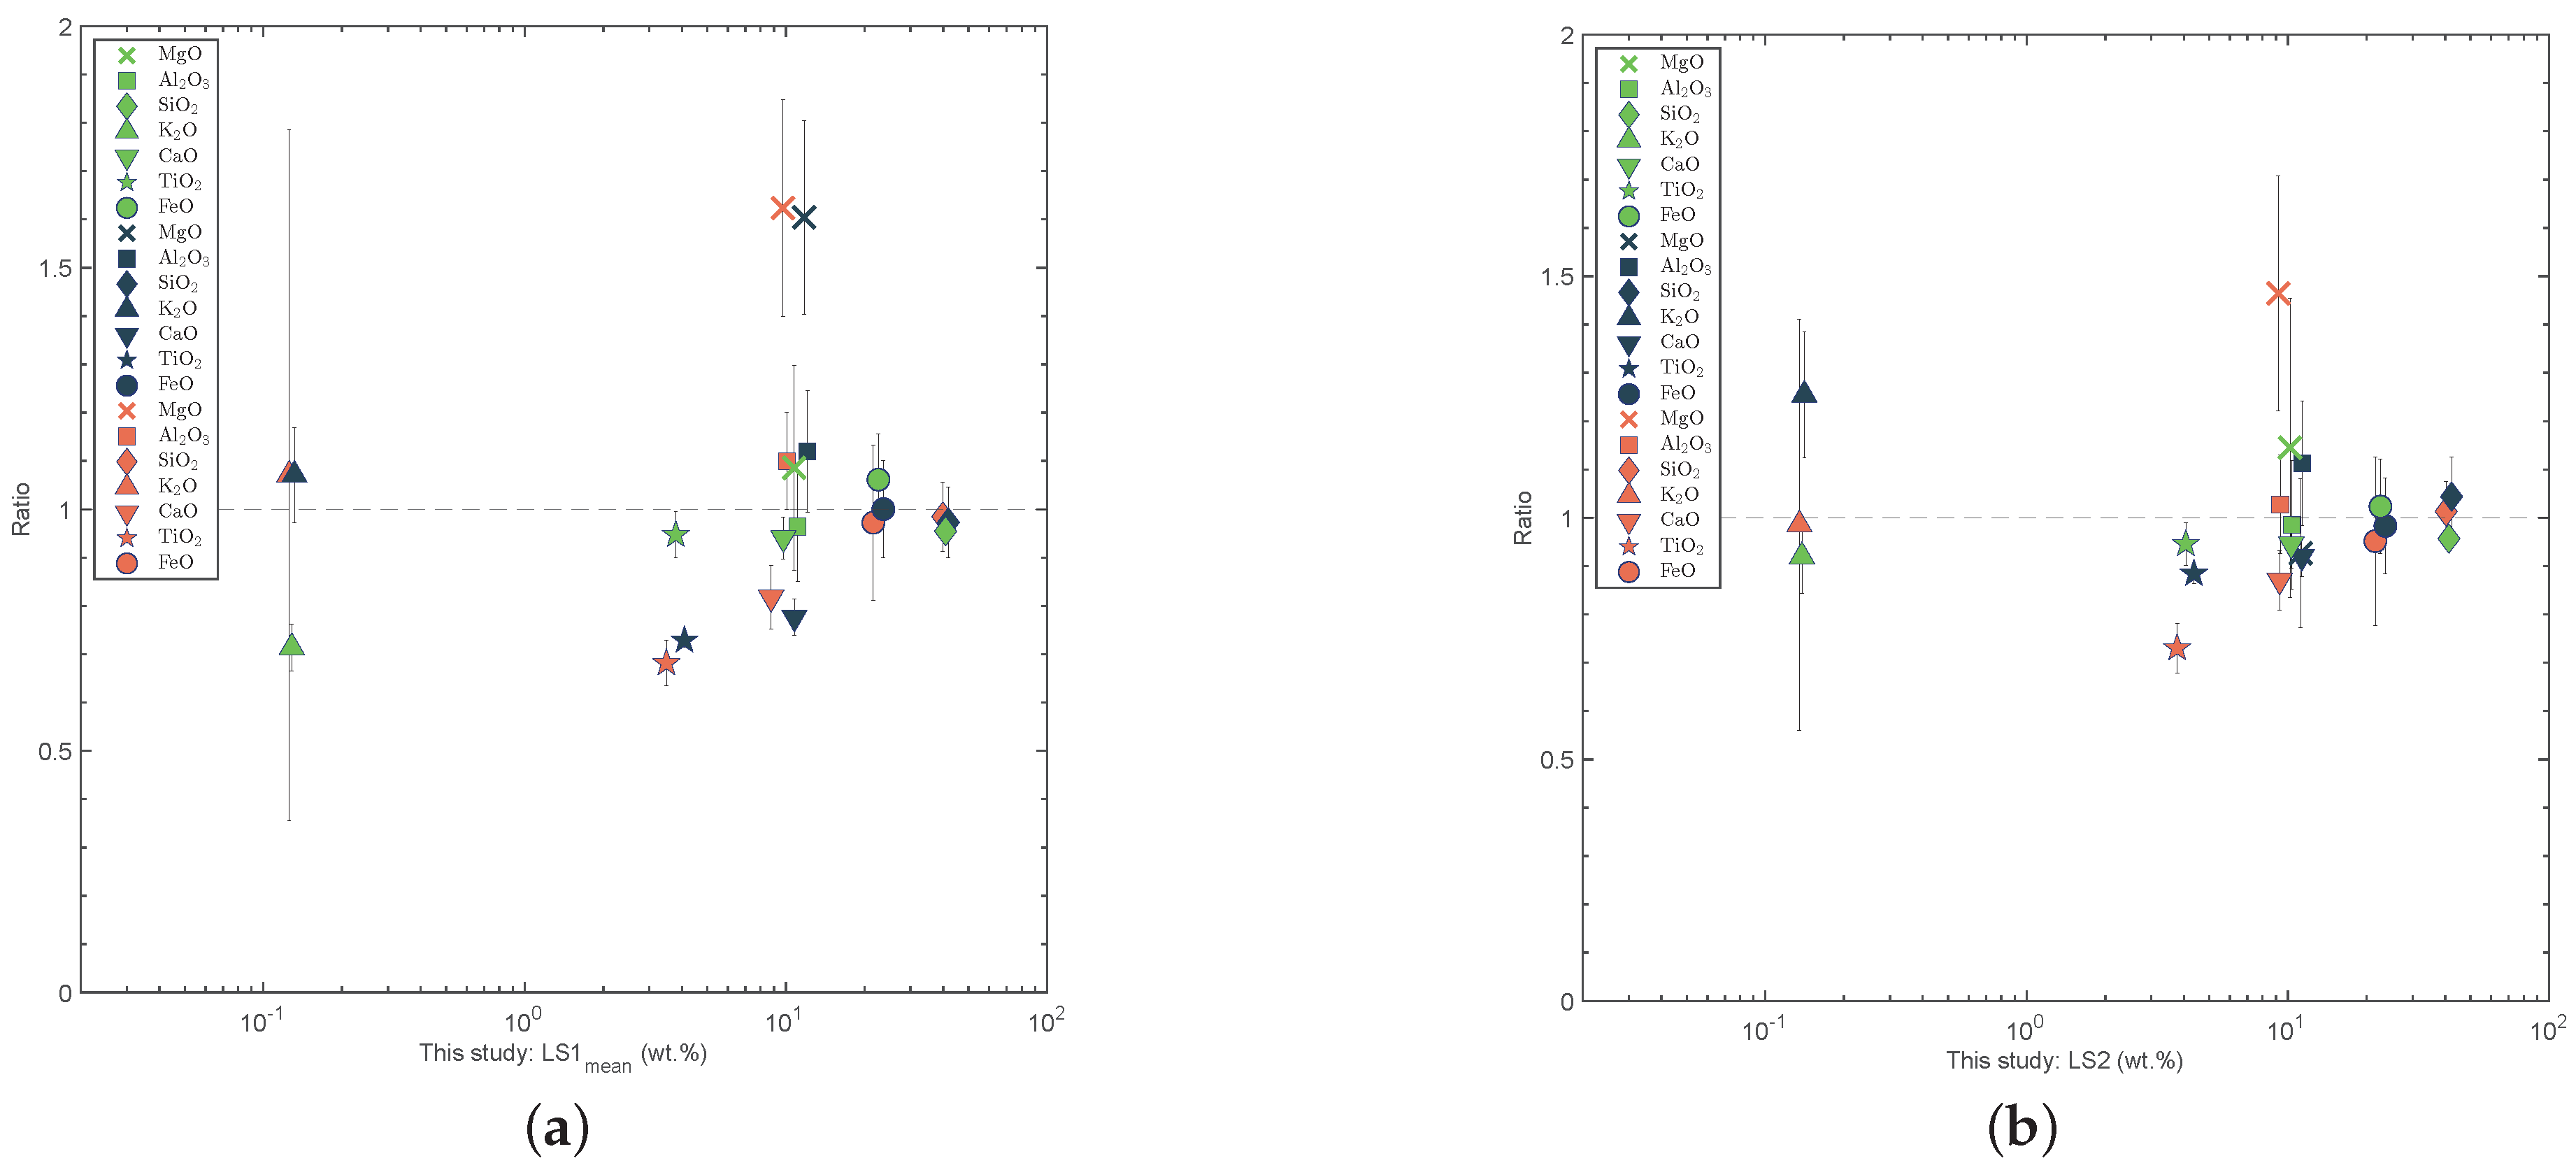
In
Table 1, we compare the three different analysis results of the major elements concentrations, the percentage differences are calculated as
= (B − A)/A × 100% and
= (C − A)/A × 100%, where the A, B and C are the results of Zhang et al., 2015 [
2], Ling et al., 2015 [
3] and Wang and Wang, 2015 [
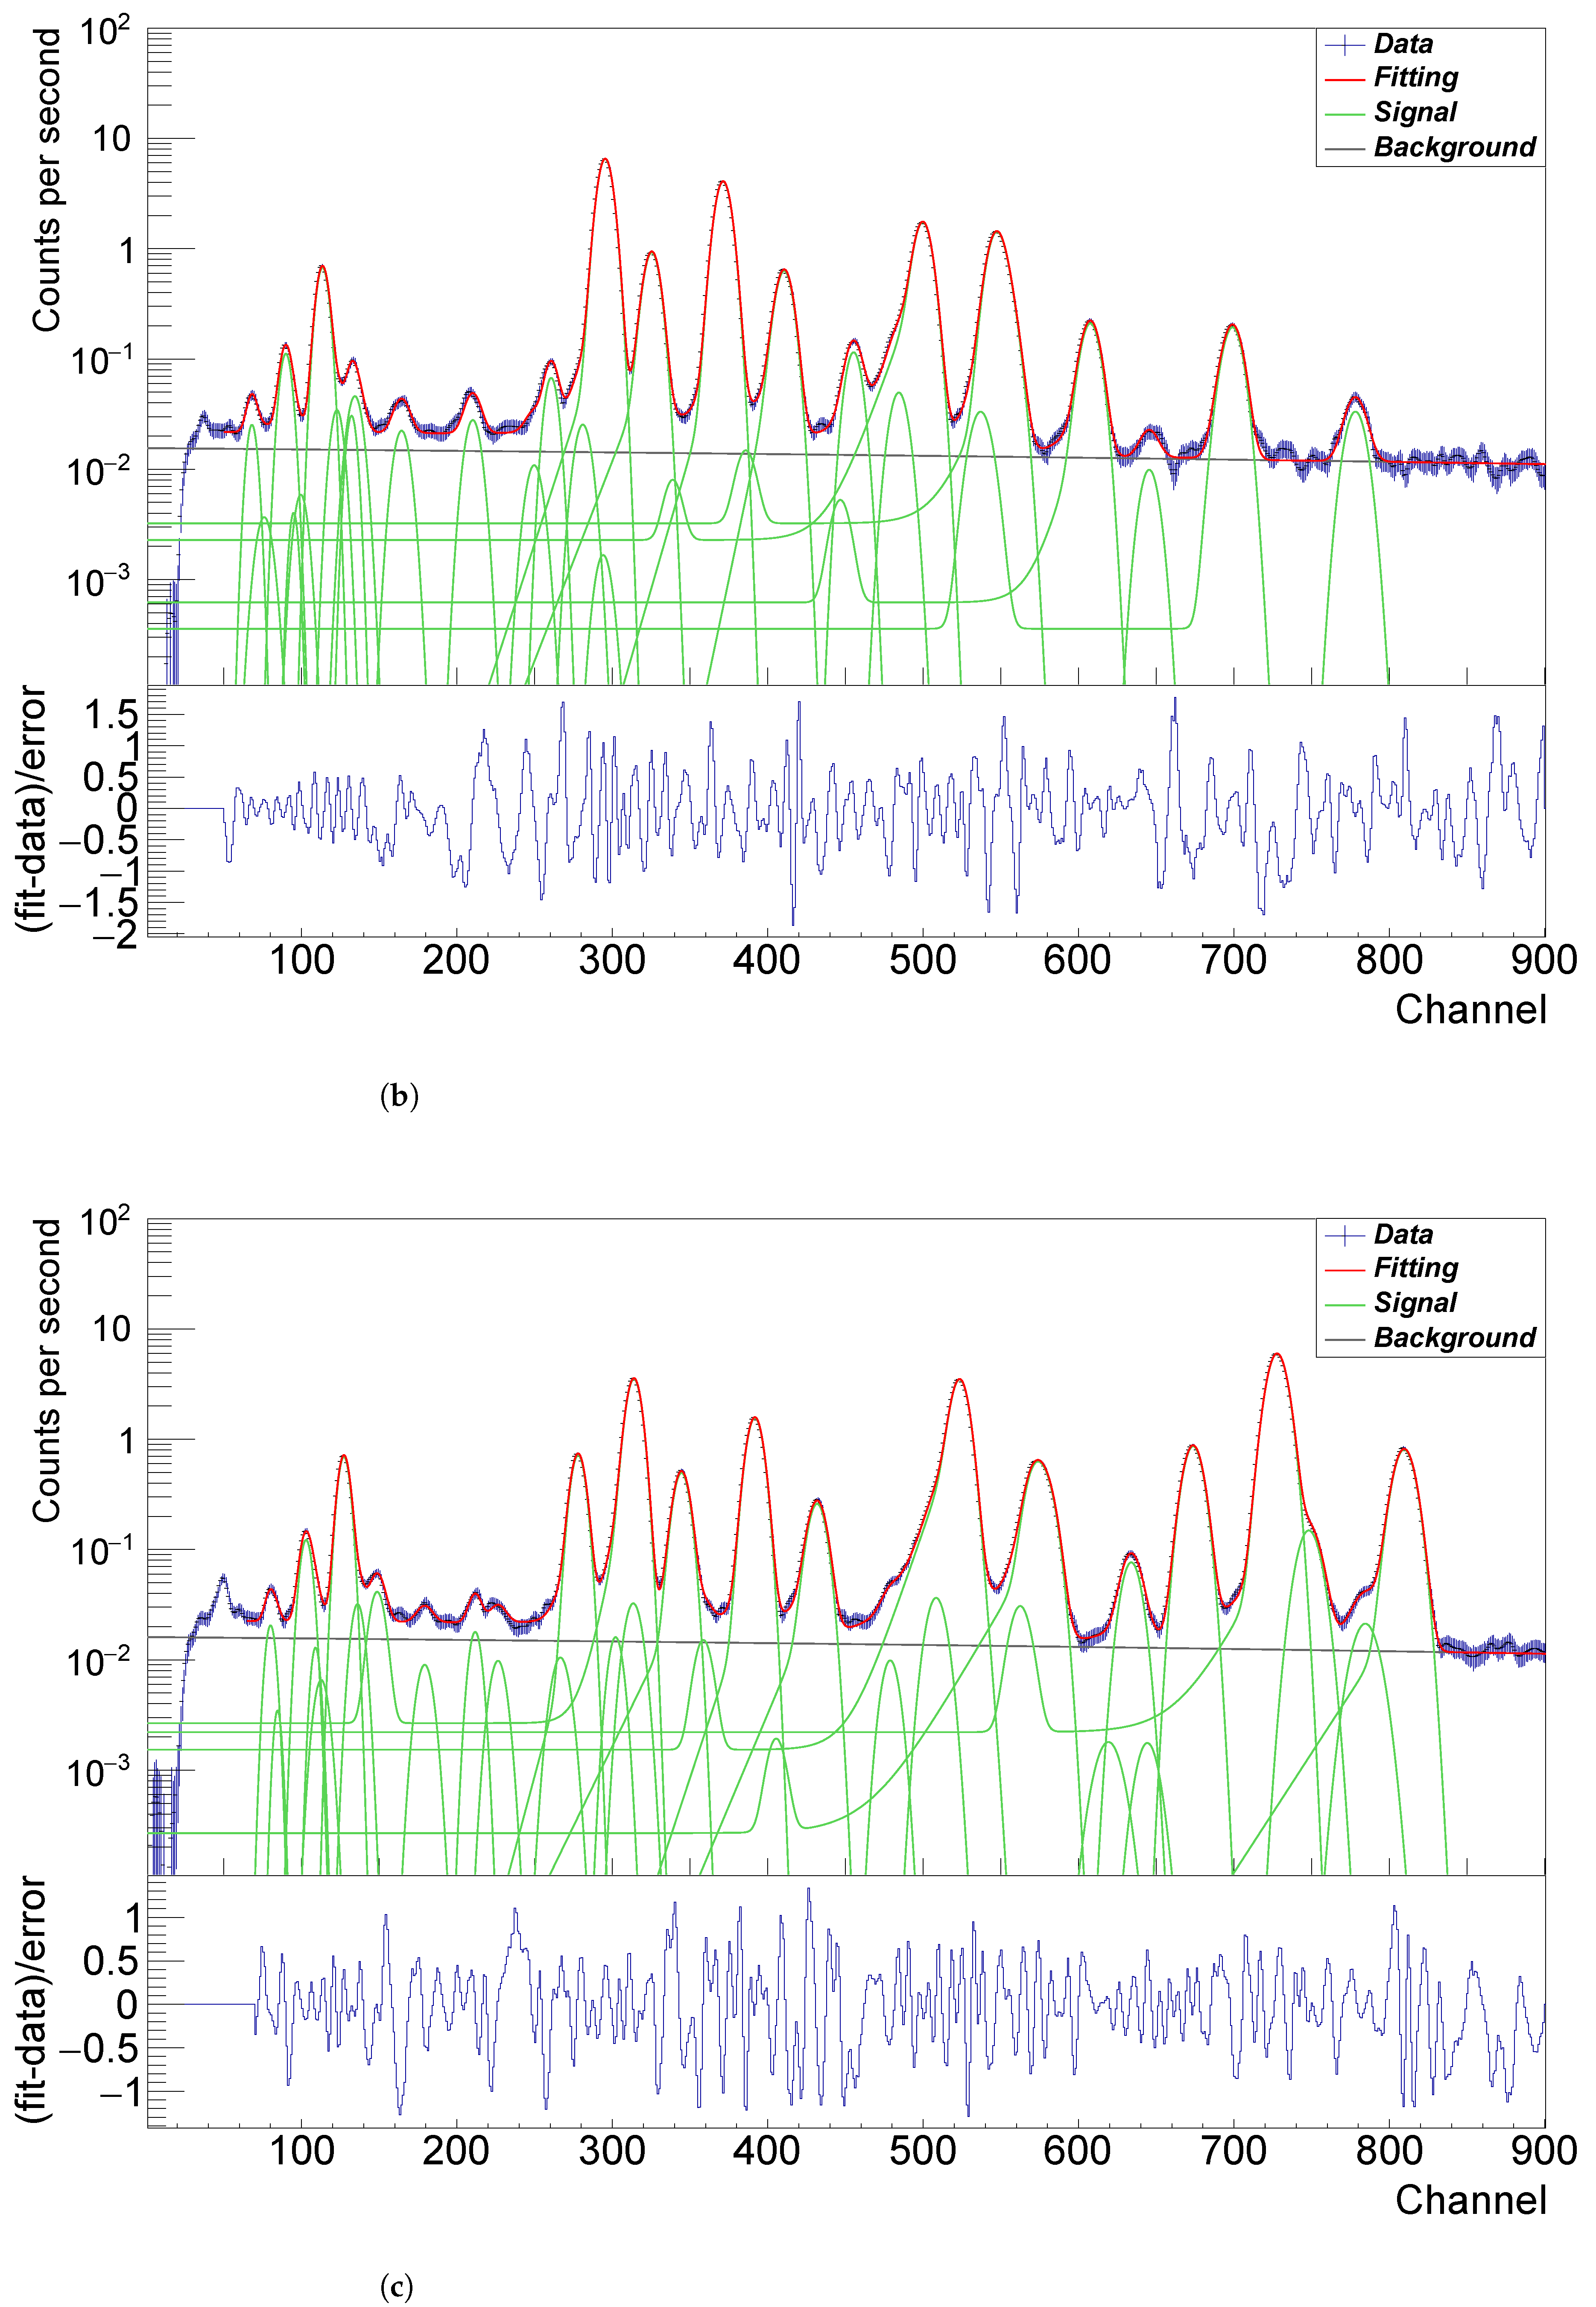
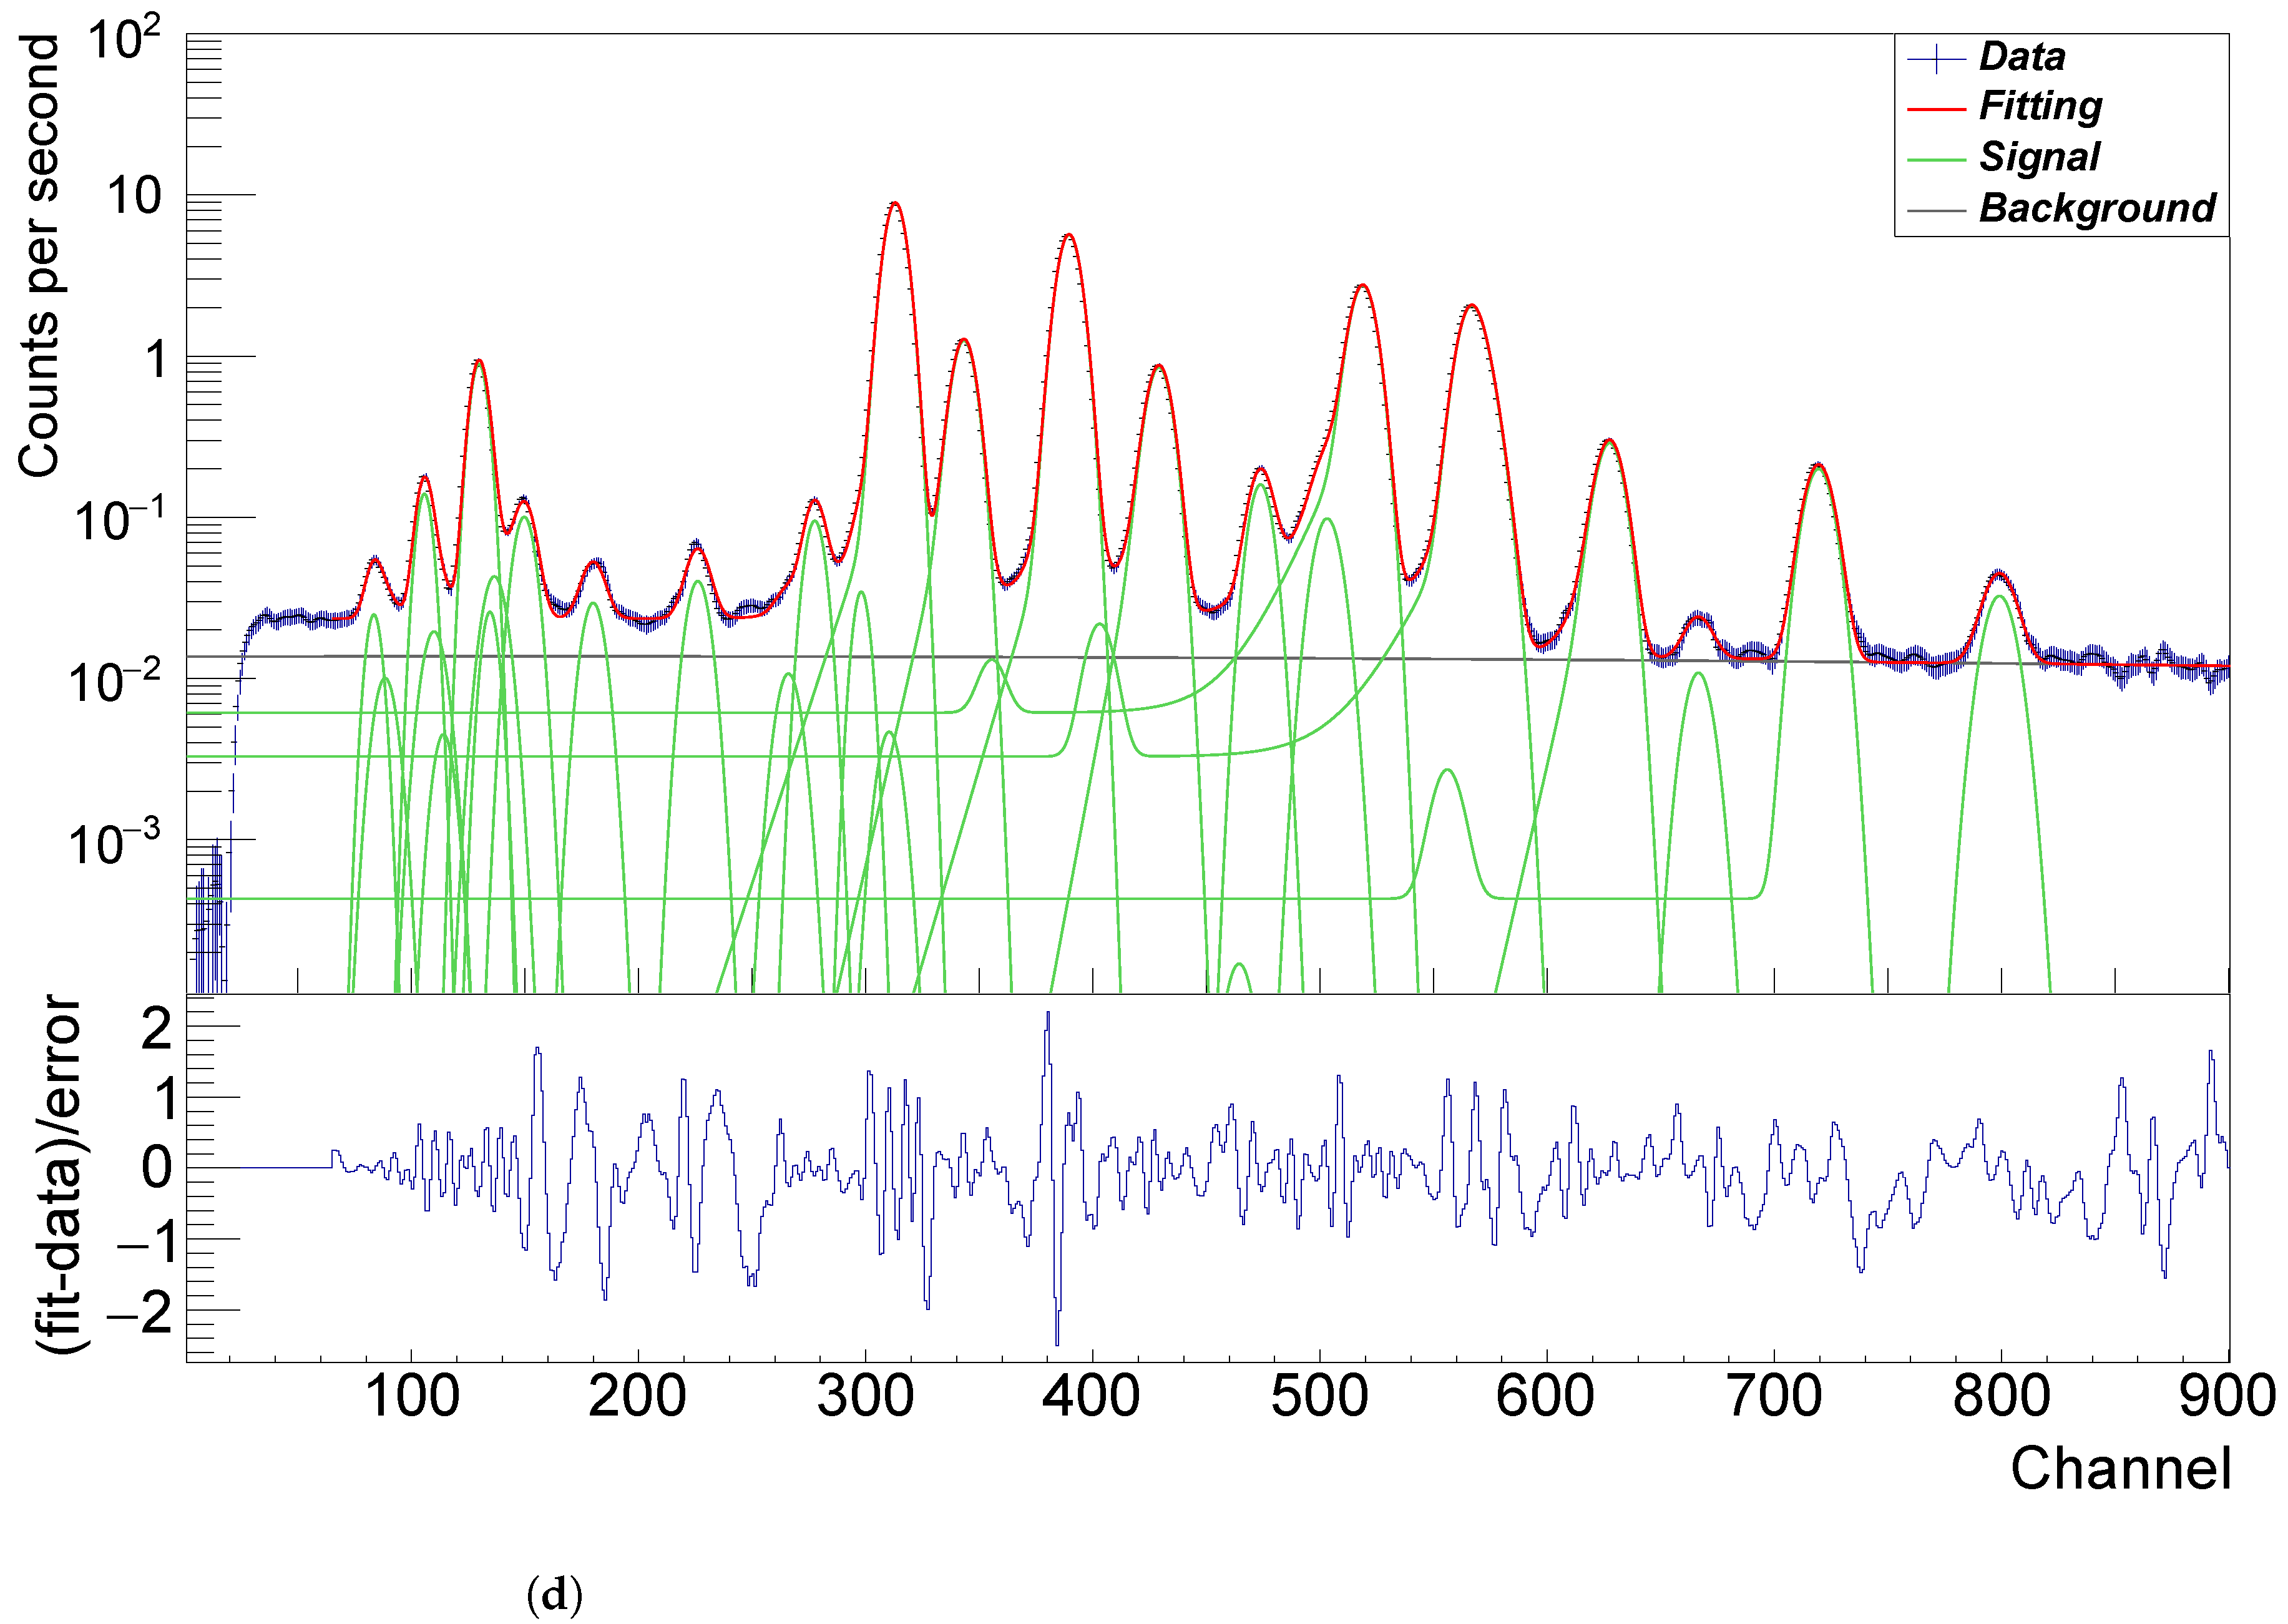
13], respectively. In the case of LS1, the events were recorded in 2BCE3-0006, which contains two measurements that are proper to analyze separately as two spectra. Due to the sampling sites being apart laterally about 10 cm distance, and although the spectra in Figure 4 show similar chemical elements concentrations for both sites, there is a slight difference in the counting rates. In addition, the results of both Refs. [
2,
13] hold a consistency in the fact that LS1 and LS2 have similar chemical elements concentrations. If the results regarding both LS1 and LS2 of Ref. [
2] compare with that of both Refs. [
3,
13], it shows large differences
and
. As described above, the determination of the content of high Z elements such as TiO
and FeO were deviated that of the real situation. Also, if the results regarding both LS1 and LS2 of Ref. [
13] compare to that of Ref. [
3], it almost overlaps together other than the content of MgO in LS2. As stated above, it indicates that scrutinizing the data to derive a more precise result also assists in understanding the geochemical characteristics of the young lunar samples in CE-3 landing site. Besides, we add that the total sums of chemical components in Ref. [
2] are 100 wt.%, while the compositional data in Ref. [
3] are normalized to 99 wt.% on account of the missing elements (Cr, Mn, Na, and P) in the analysis. Similarly, the total sums of the results in Ref. [
13] are ~99 wt.% due to inability to detect the missing elements.
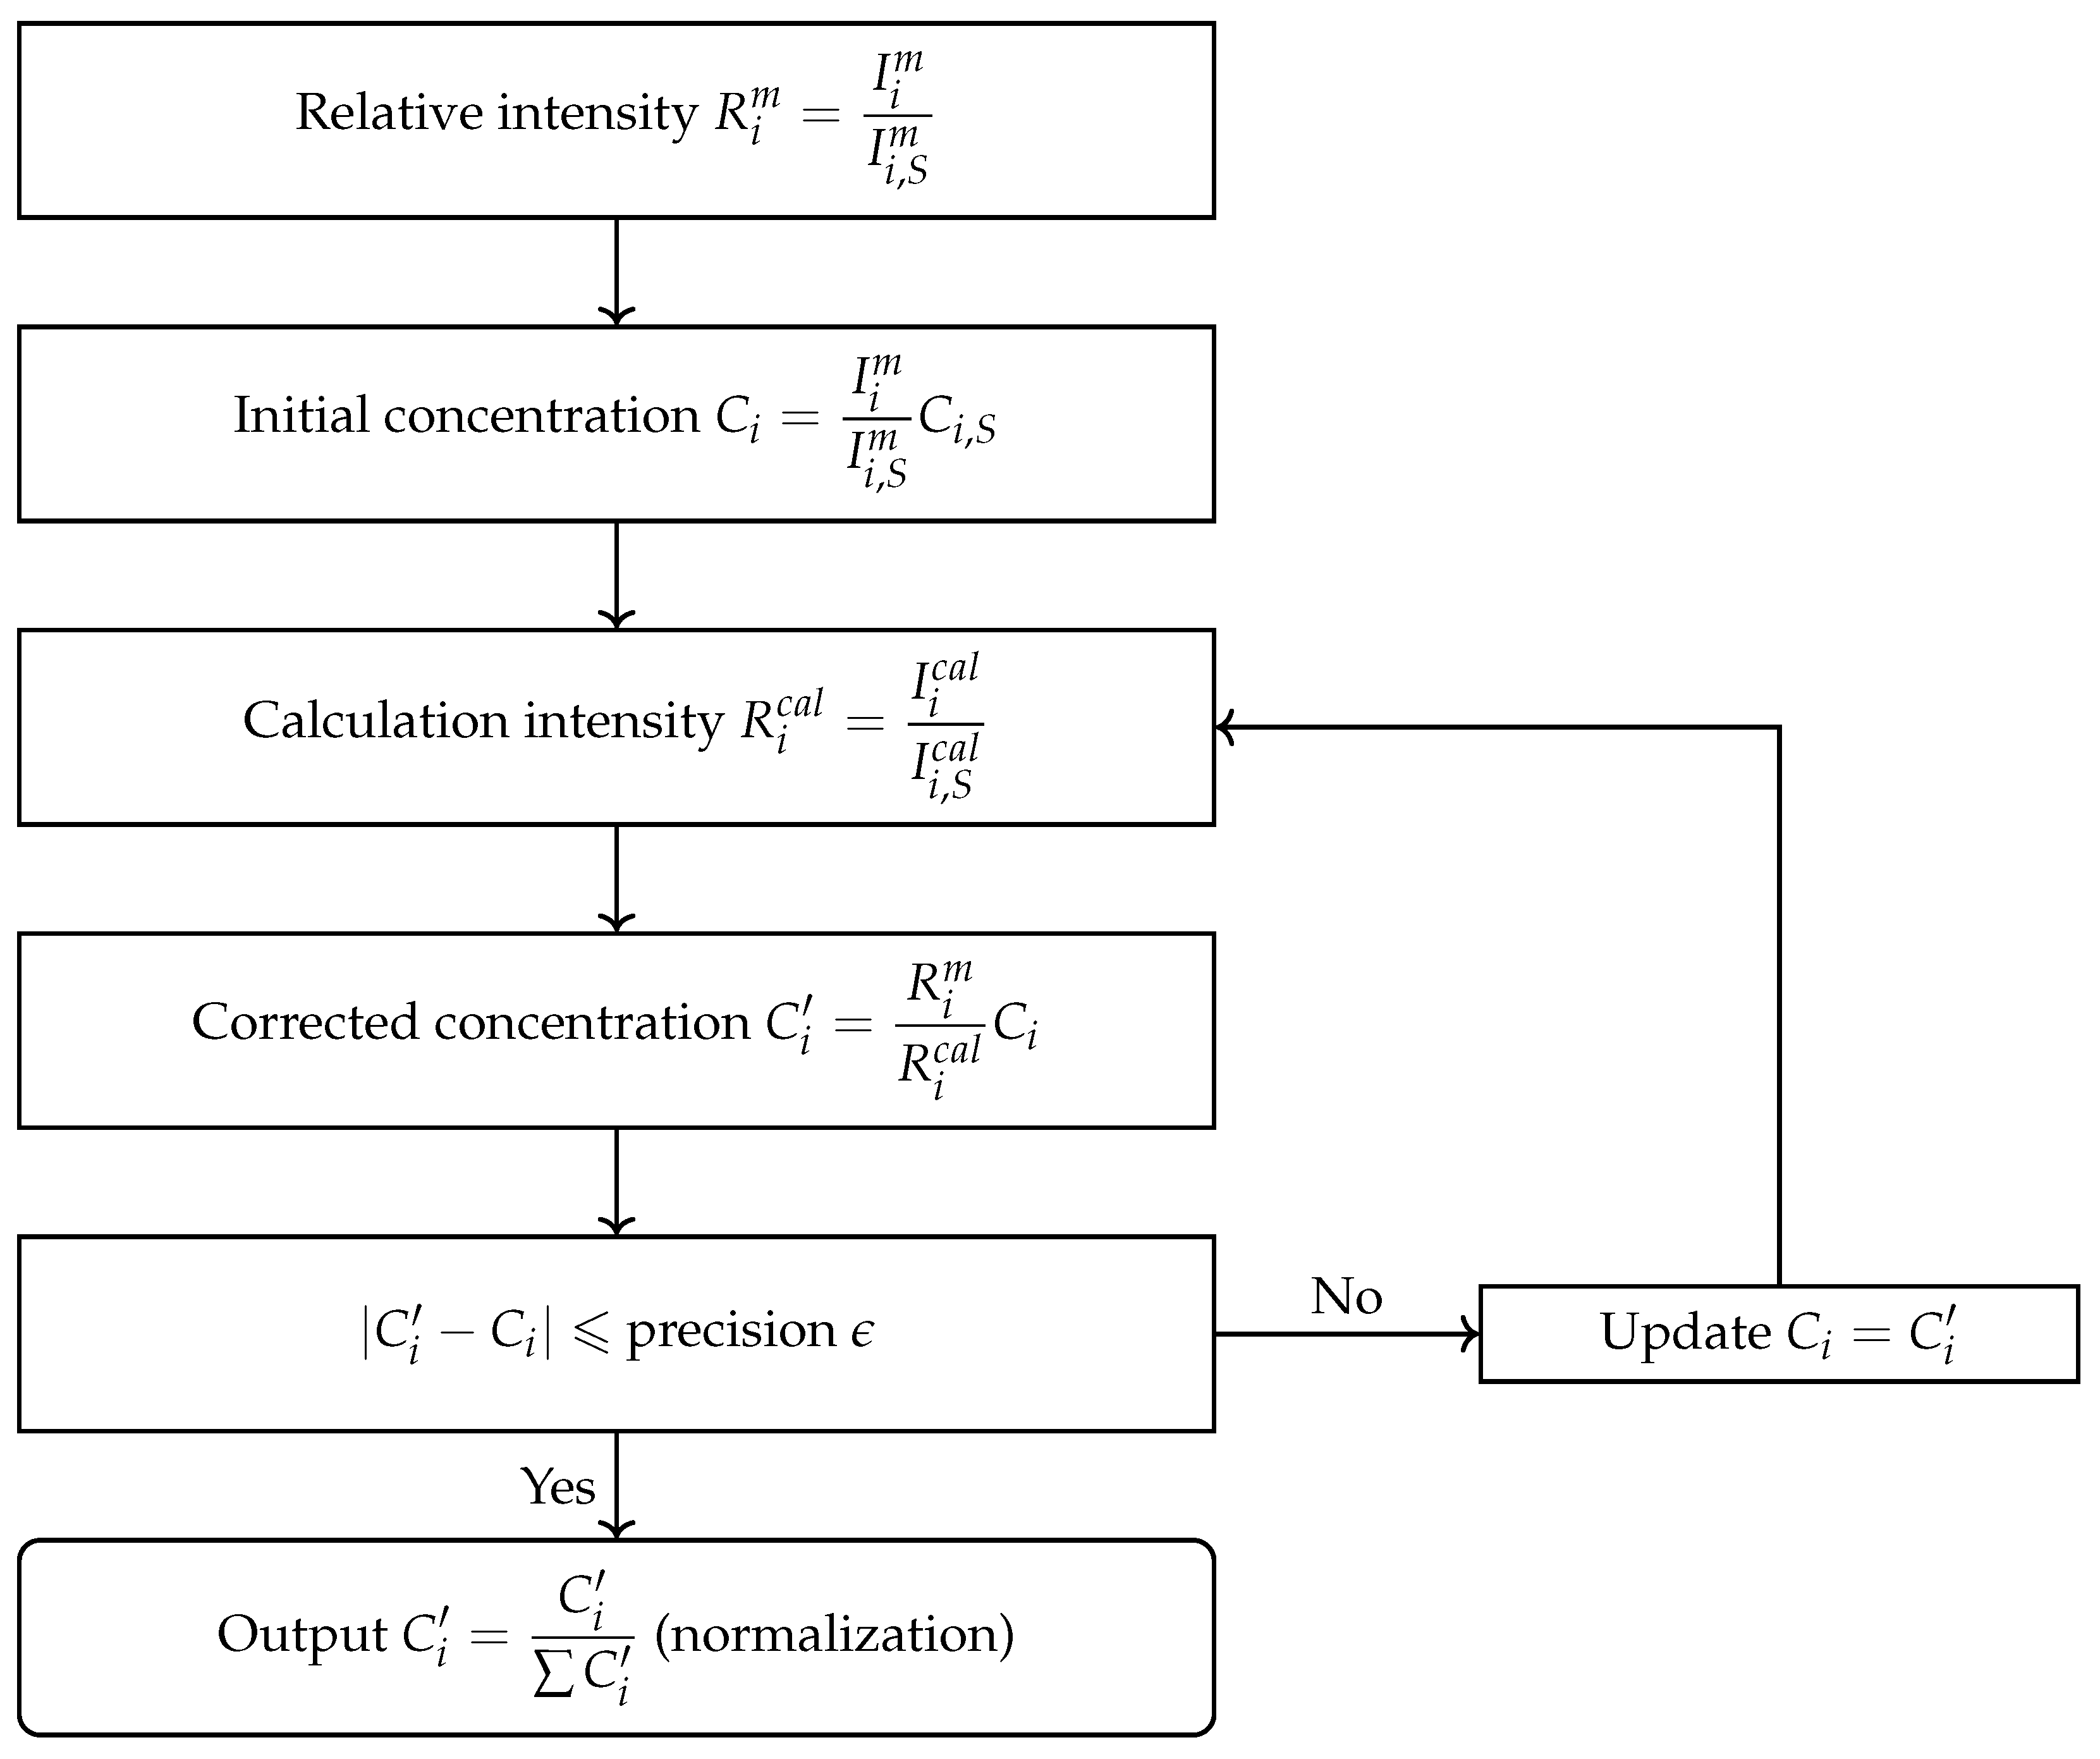
In this paper, we posit to employ an optimized model for the derivation of major elements concentrations directly with the advantages of reliability and being independent of calibration by ground standards. In addition, it is significant that the surface modeling of particle size effect in X-ray fluorescence is performed for correction in the elemental analysis because there are only a few studies where the particle size effect applies to the actual measurement on the lunar surface regardless of remote sensing or in-situ detection. Our method may facilitate data analysis in future space exploration missions. The paper is organized in the following manner. We will describe the APXS instruments and data descriptions in
Section 2.1, and present the detail of our model for the derivation of major elements concentrations in
Section 2.2,
Section 2.3 and
Section 2.4, followed by our results in
Section 3.1 and an analysis of the difference between the results of the previous lunar missions in
Section 3.2. Discussion is held in
Section 4 and the conclusions are presented in
Section 5.
4. Discussion
(1) As for earlier payloads, such as three generations of Mars rovers on Mars Pathfinder, Mars Exploration Rovers (MER), and Mars Science Laboratory (MSL), all of them utilized the radioactive source of
Cm. Among them, the MSL APXS is the optimized version that enables to resolve the peak energies of element ranging from sodium to bromine and beyond with good sensitivities and energy resolution of 200 eV@6.4 keV. However, it does not consider the detection for lighter elements (such as C and O) due to their large attenuation related to the thickness of both detector window and the atmosphere of Mars [
28,
69]. The CE-3 APXS, on the other hand, used combination (
Fe +
Cd) sources instead, this is the first time use in lunar APXS experiment. It provides better energy resolution of 135–142 eV@5.9 keV than the MSL APXS and allows the detection for the major elements (Mg, Al, Si, K, Ca, Ti, Fe, whose elemental concentration is ≥0.1 wt.%) and trace elements (Ni, Sr, Y, Zr) [
25]. It may be noted that only X-ray sources as excitation radiation were deployed in the measurement, so the sensitivity for low-Z elements had to be low, the oxygen (O) and sodium (Na) cannot be measured directly; however, the lunar soil contains only a very small amount of sodium (Na), and thus its effect can be omitted. Also, the valence of iron oxides on the Moon is only Fe
due to the redox reaction of solar wind protons, and thus the ratios of oxygen atom to those major elements are determined. Hence, the chemical compositions can be determined. Also, because of the
Fe scatters, the concentration of Mn is contaminated, unfortunately. Overall, CE-3 APXS is a reliable instrument that could be widely used for in-situ detection with a much higher spatial resolution than all the other APXS used in lunar explorations.
(2) With regard to some studies based on remote sensing data, as mentioned in Thiessen et al., 2014 [
6], some spectral features could not be identified due to the ejecta contamination, causing spectral mixing, such as the CE-3 landing site, which sits close to the boundary of two different geologic units. As we determine the TiO
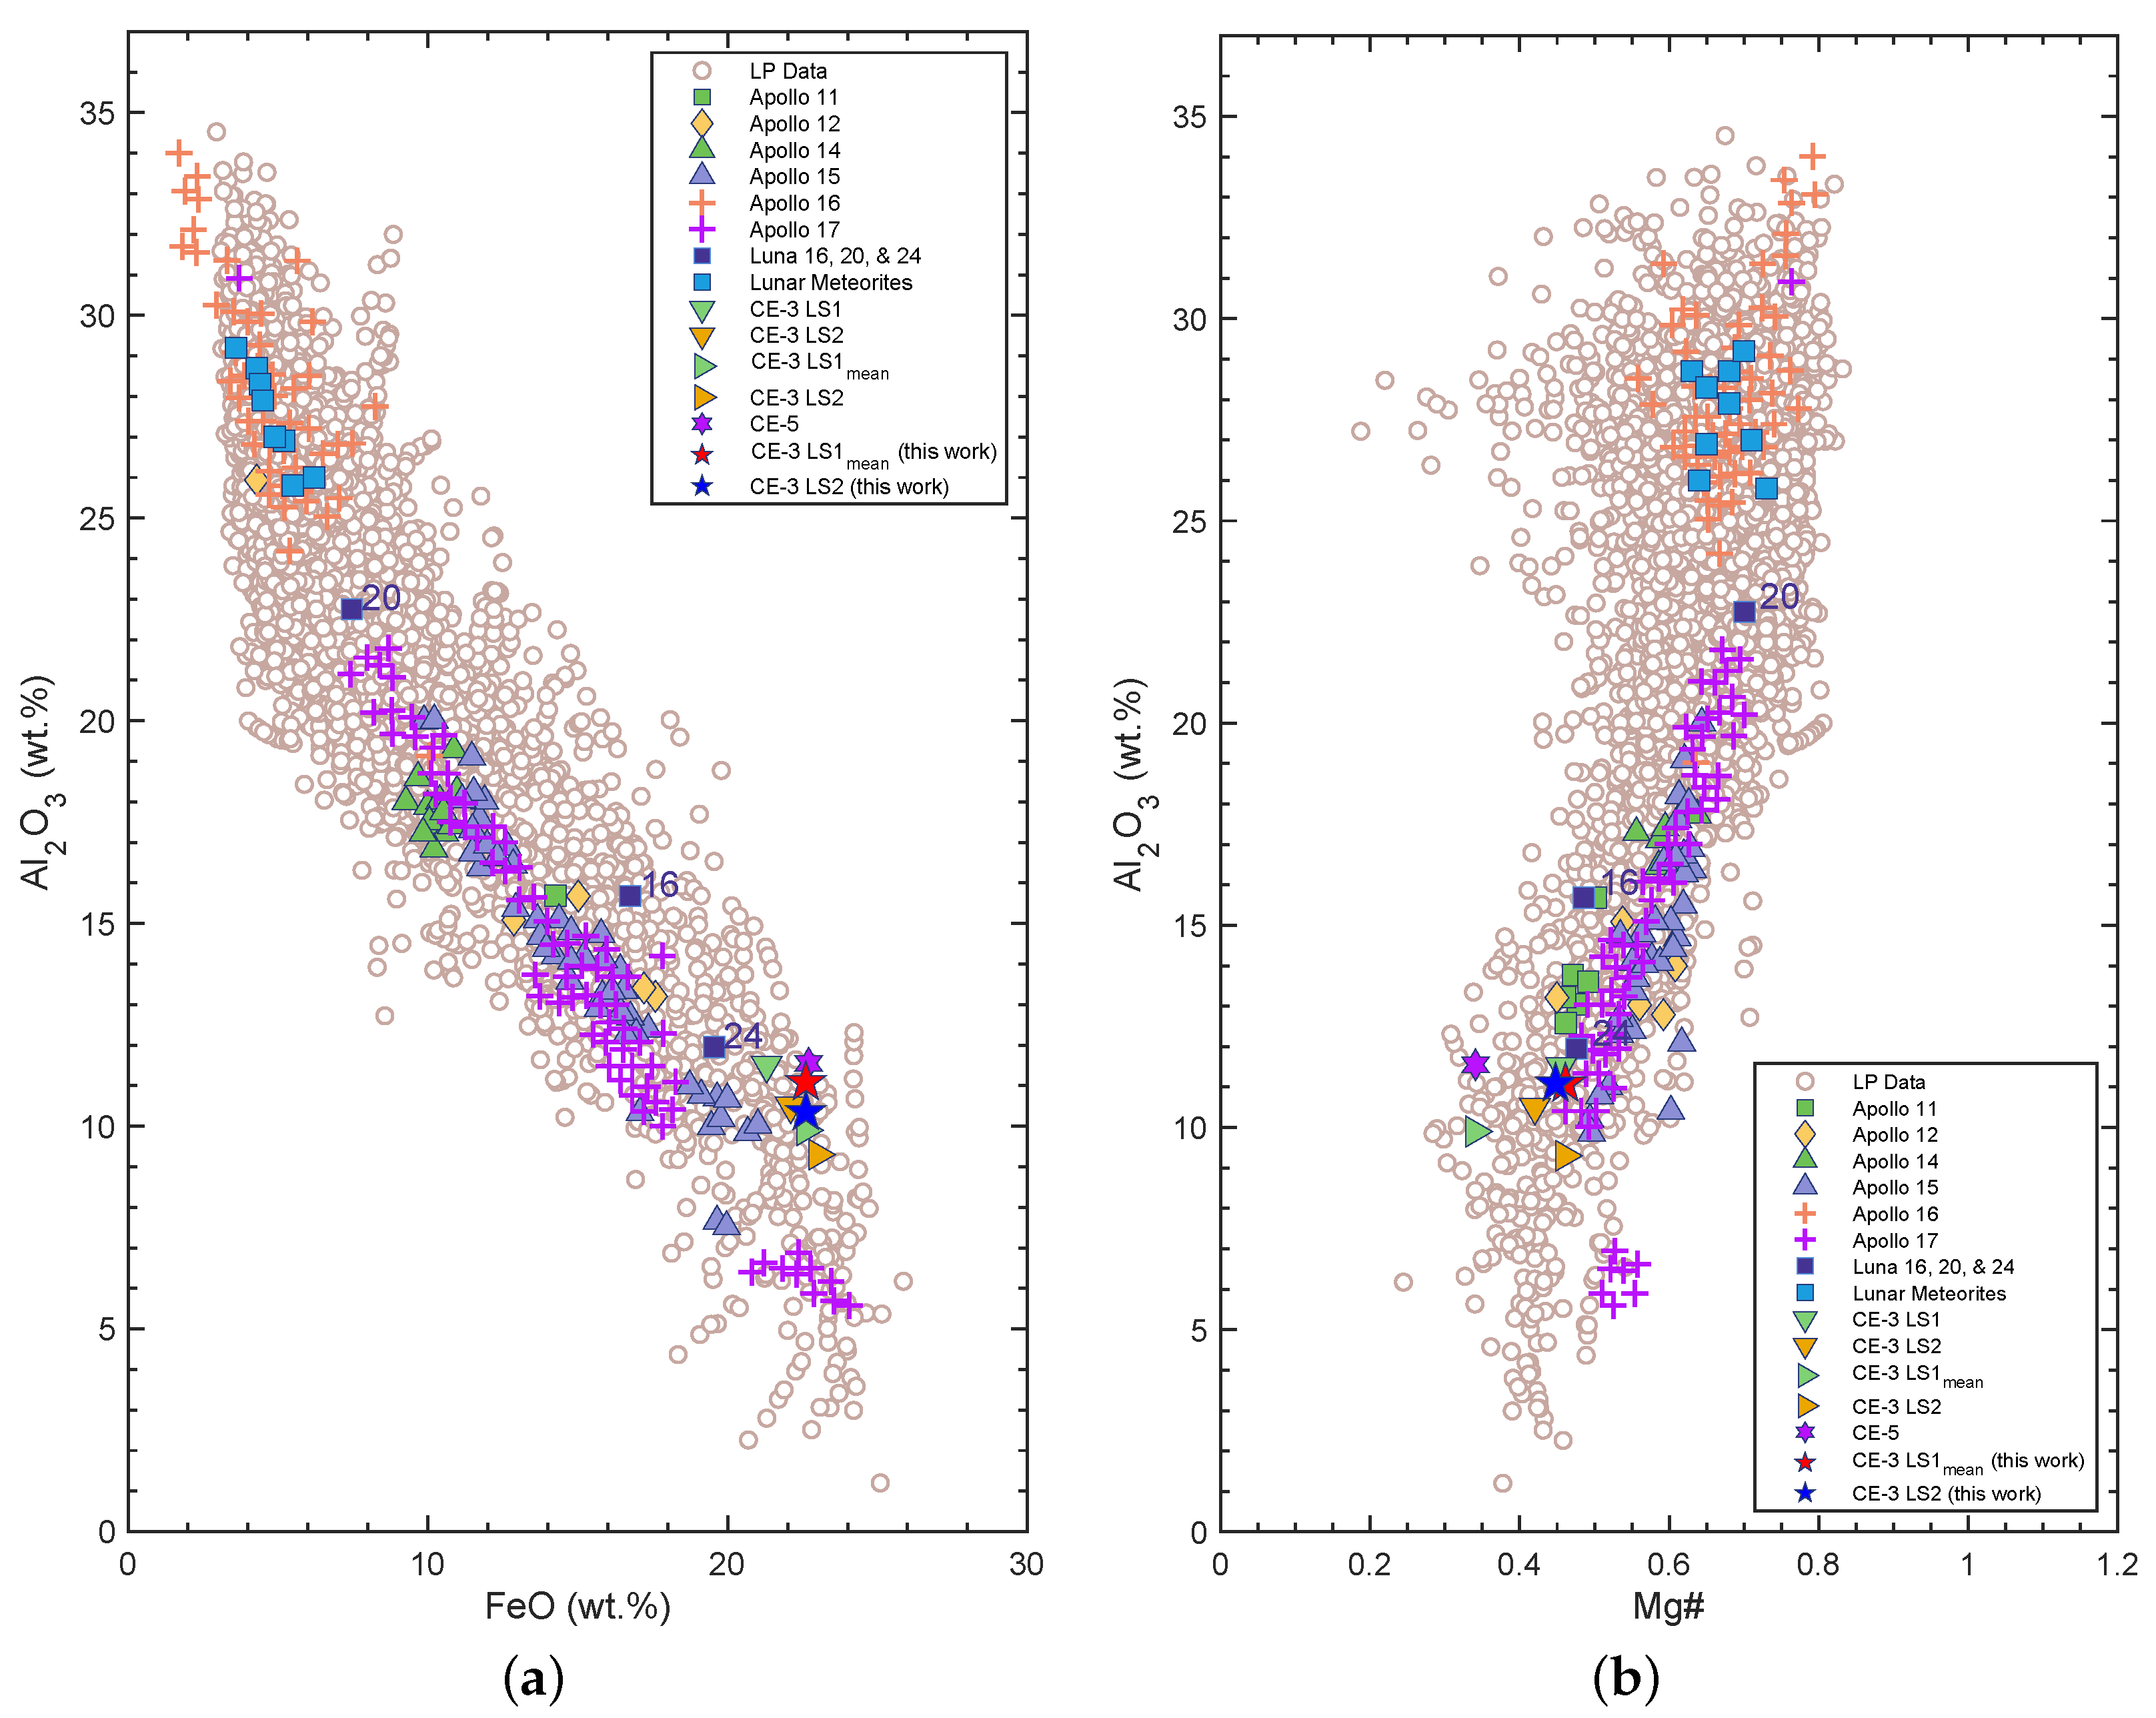
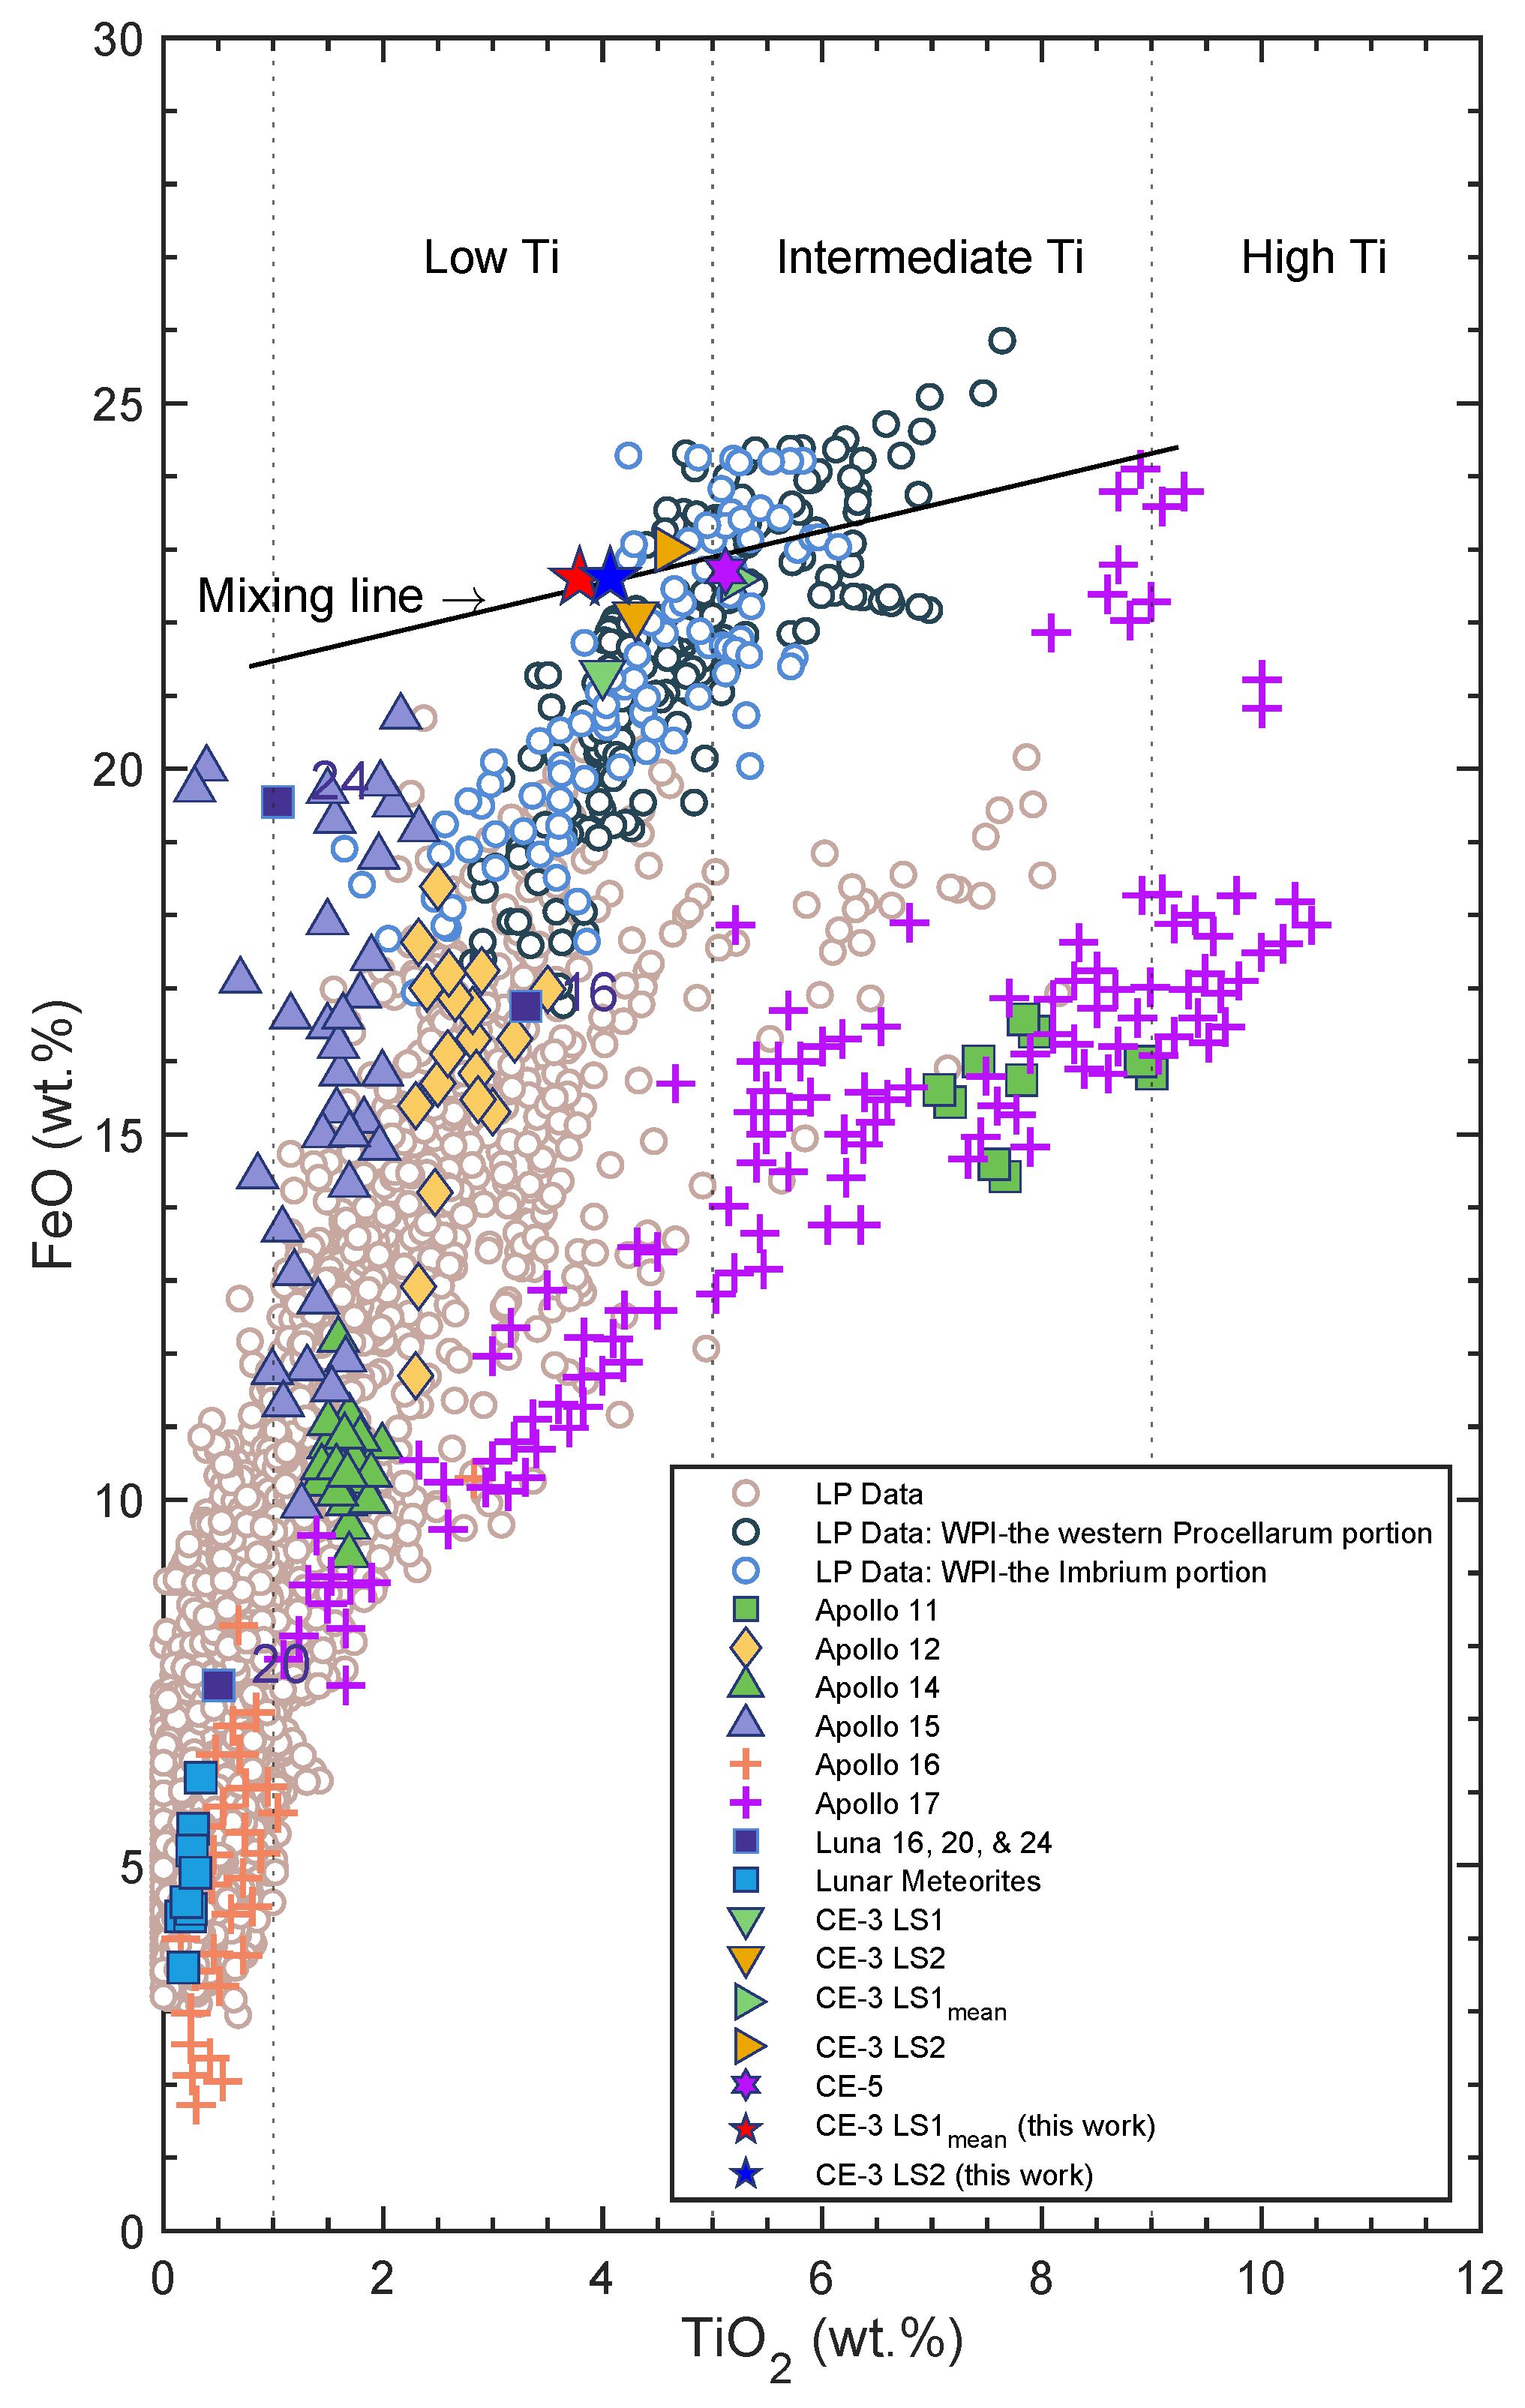
concentration of CE-3 soil samples and regard it as low-intermediate Ti mare basalt, the ground truth provides mineralogical information for the relatively young volcanism and a reference point (as shown in
Figure 14 and
Figure 15) as calibration information for the estimation by spectral data, for example, the Moon Mineralogy Mapper and the Clementine UV-VIS for mineral mapping, in the future remote sensing studies. Besides, encountering such situation can conduct an in-situ measurement to address this unavoidable limitation of the spectrometer, it is important in order to extend our understanding of the lunar magma evolution.
(3) In the particle size effect correction by numerical calculation applied in lunar X-ray fluorescence, the particle diameter
D is assumed to be 45
m (LS1_1 and LS1_2) and 33
m (LS2) for the CE-3 soils in the analysis. Concerning the change in elemental concentrations, we also employ different particle sizes of a coarser and a finer surface, 70
m (an average value for the particle of lunar soil given by Apollo samples [
70]) and 10
m (a surface finer than that of the CE-3), respectively, to compare with the assumed particle sizes. The corresponding results of elemental analysis can be found in
Table A1 and
Table A2. The concentrations of low Z elements Mg, Al, Si exhibit a slight variation of less than about ±0.5% in percent change. For elements ranging from K to Fe, the percent change in concentrations is approximately ±3–5%, where the sign denotes as positive for coarser particles and negative for finer particles, but the element Fe vice versa. The small percent change indicates that the value of particle size is not sensitive to the correction for particle size effect. Also, the variation trend of the amount of the percent change correlates systematically with the absorption K edge energy
of each element.
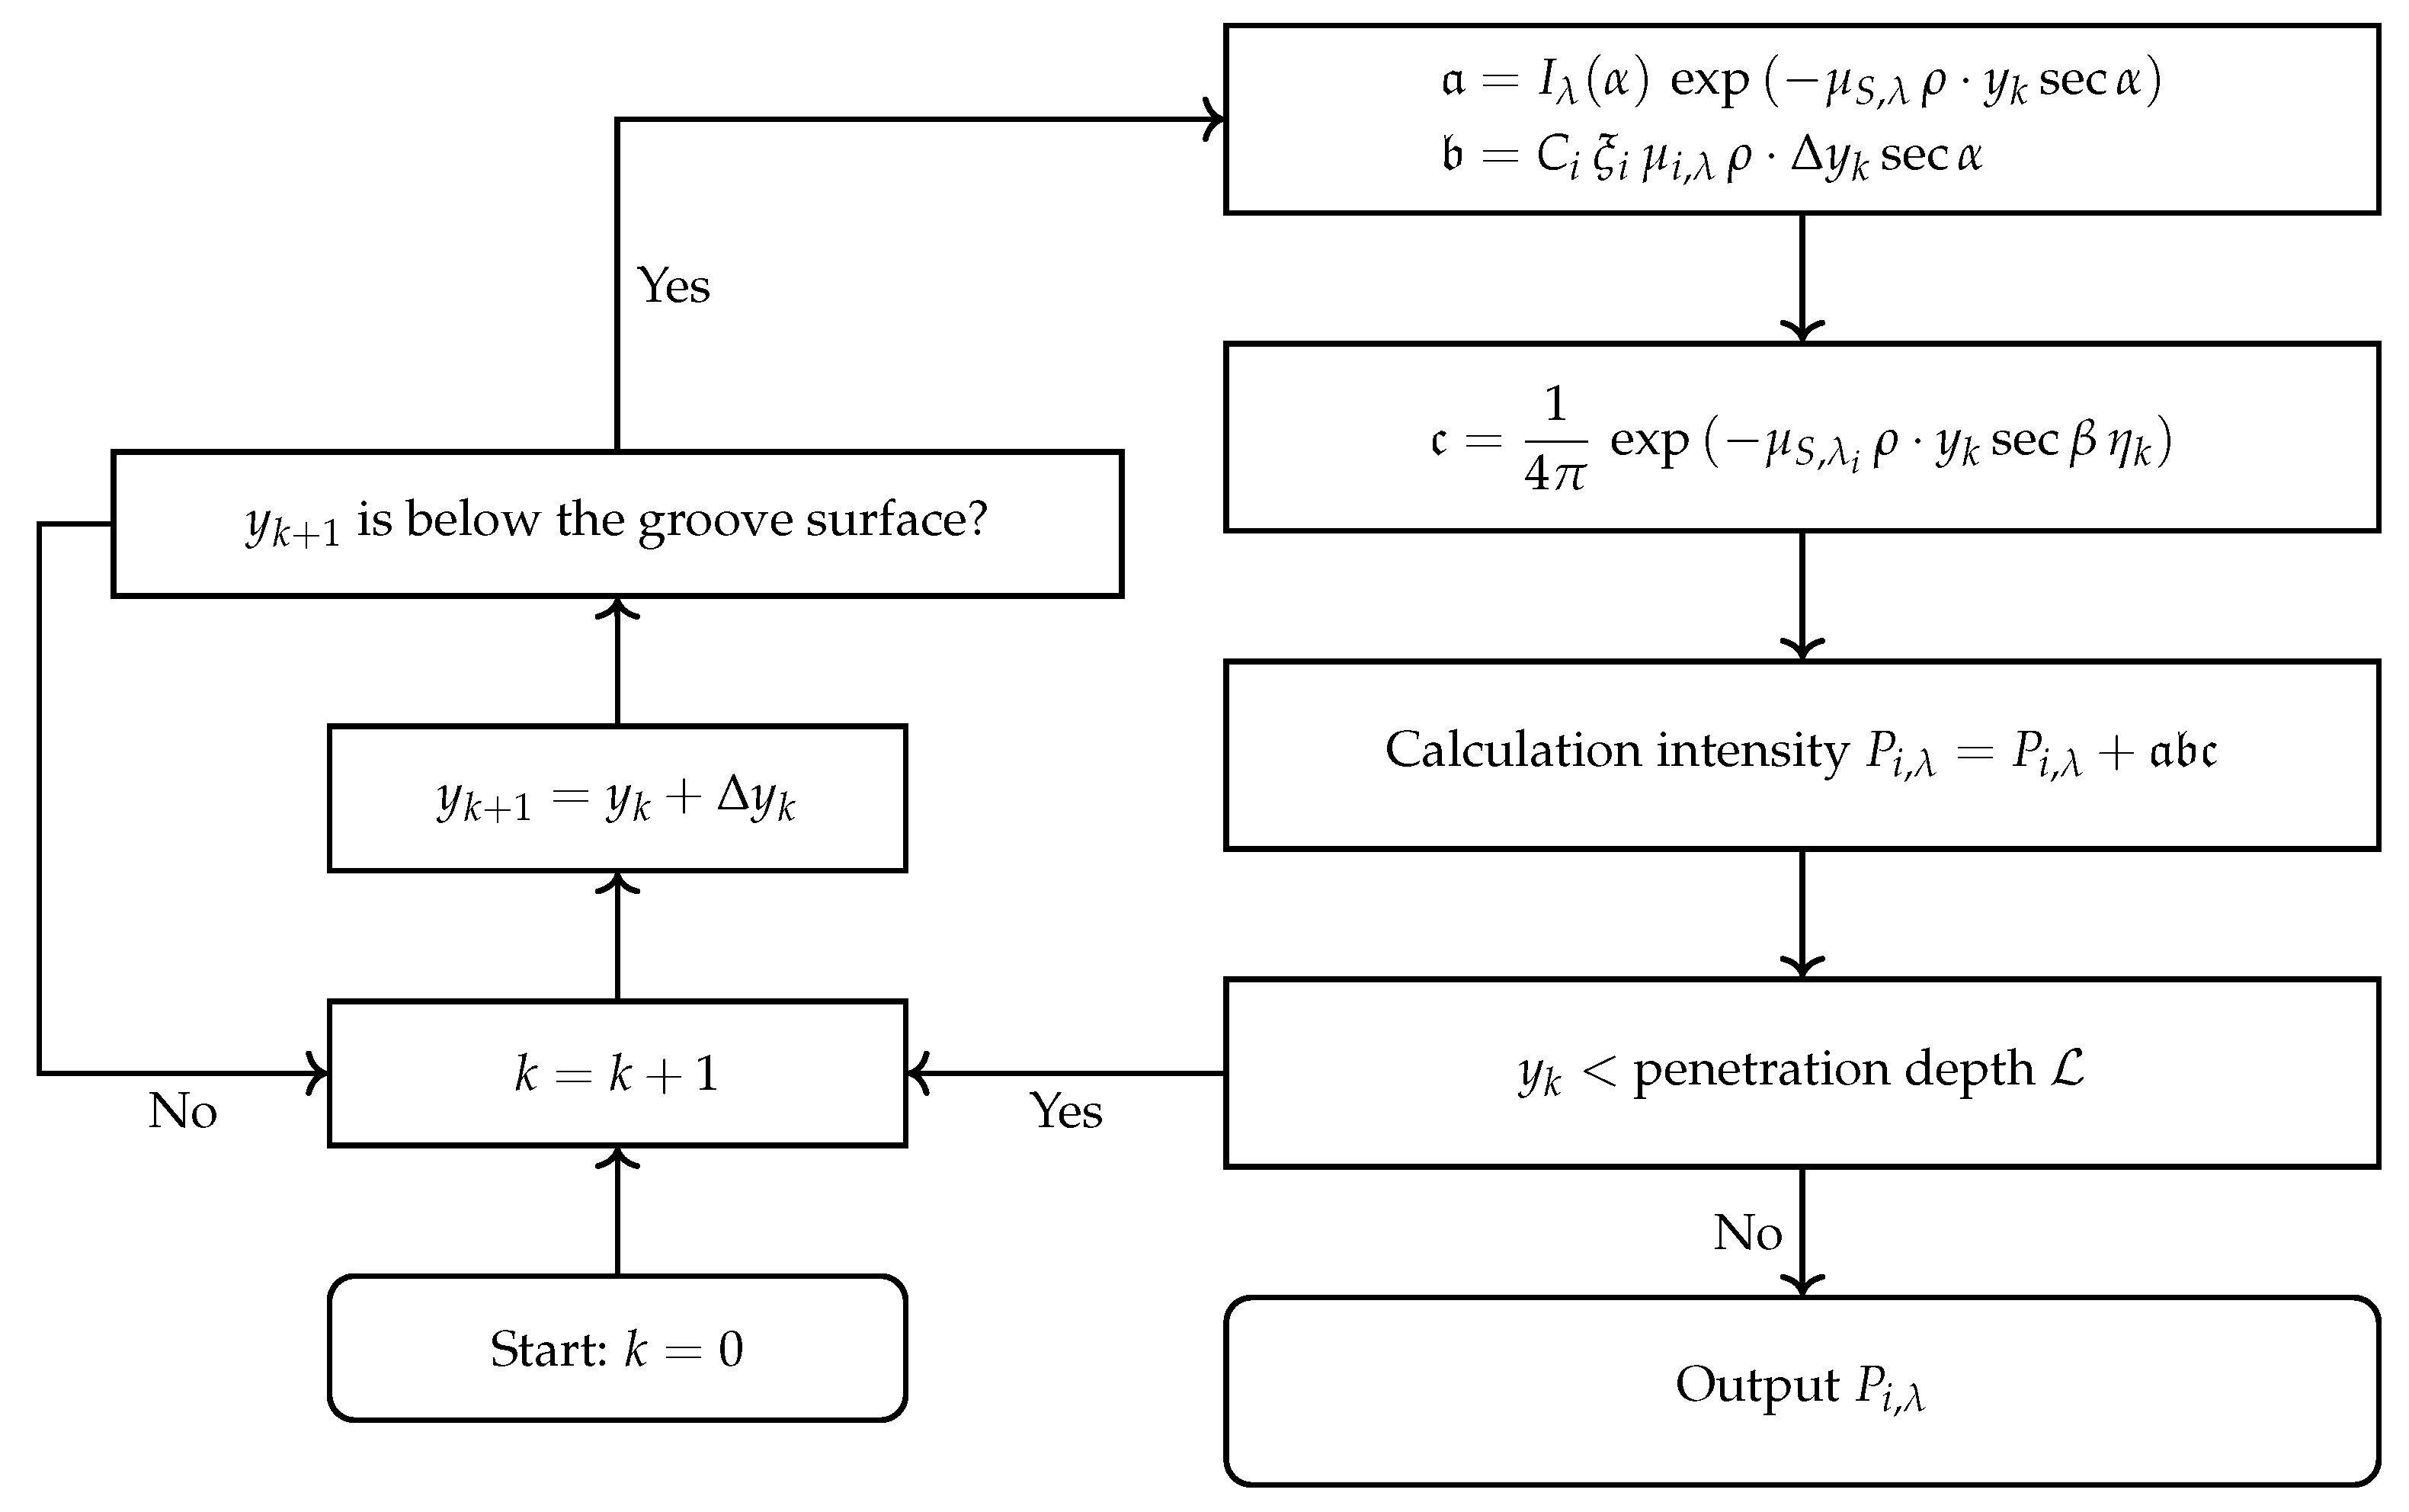
In the model (
Figure 9), one can see that the contribution of primary X-ray fluorescence is the integration of the product of
with respect to the penetration depth of fluorescent X-rays. This shows that the penetration depth of fluorescent X-rays for each element in the analytic sample is the dominant factor for the particle size effect correction. In particular, the corrections for the concentrations of Ti and Fe are significant due to their transmission depths of X-ray fluorescence, which differ to some extent from those of other elements.
In the case of complex samples, such as pristine soil [
54,
71], the current model can be enhanced in several aspects.
While the current model can simulate a specific particle size, it could be enhanced by taking into account the varying porosity, which depends on the size, shape, and arrangement of particles within the sample. However, it should be noted that the particle size distribution of the remaining dust on the surface that has undergone erosion is currently not possible to extract (see
Section 2.3.3) with regard to remote measurement. As discussed previously, since different particle sizes are not very sensitive to the particle size effect correction, the current model remains reliable in this case.
The average atomic mass of lunar soil is an important factor to consider when correcting for particle size effect because different elements in the soil have different mass attenuation coefficients . The mass attenuation coefficient is a measure of how easily X-rays are absorbed by a material, and it relates to the transmission depth of X-ray fluorescence. Thus, the current model is a equivalent model in this case.
(4) As for the implications in future on-site sampling and analysis missions, such as the Viper rover [
72] and the PROSPECT driller [
73], our study suggests that particle size is an important factor to consider. Specifically, the samples obtained by drilling may contain particles of various sizes, ranging from fine to coarse. This highlights the need to accurately determine and account for particle size in the analysis, in order to reduce the potential uncertainties. Furthermore, to prevent the presence of large particles from interfering with the analysis, it is recommended to use a sieve or similar device to filter them out from the drilling sample beforehand. On the other hand, the uncertainties can be reduced by deploying an in-situ calibration target, which can provide the calibration with the same environmental conditions and working status of the instrument on the Moon, thus enhancing the accuracy of chemical compositional measurement.
5. Conclusions
In this paper, we present an analysis for the derivation of major elements concentrations of the three lunar soil samples in the Chang’E-3 landing site of northern Mare Imbrium, which is the relatively young lunar sample available for in-situ detection, based on the data successfully measured by the Active Particle-induced X-ray Spectrometer onboard the Yutu rover.
We discussed the differences between the results of the previous studies, such as Zhang et al., 2015 [
2], Ling et al., 2015 [
3] and Wang and Wang, 2015 [
13]. The peak fit routine provides a high accuracy determination for complex peak shape rather than previous studies. In this analysis, an optimized model is employed to derive the major elements concentrations directly with the advantages of reliability and being independent of calibration by ground standards. Also, the particle size effect correction is applied in lunar X-ray fluorescence modeling for the elemental analysis, improving the accuracy in determining the elemental concentrations for the actual measurement.
We find that CE-3 APXS data show a low AlO, small Mg#, high FeO, low-intermediate TiO, and intermediate KO content, which manifest a highly evolved magma source with unusual petrological characteristics compared with not only previous lunar regolith samples from Apollo and Luna missions, but also the latest returned lunar soil samples from Chang’E-5 mission. While comparing with remote sensing data, the distribution pattern of FeO, TiO, Th suggests similar geochemical properties of the CE-3 landing site and WPI, with a signature of western Procellarum, and infers whether the CE-3 landing site to the mixing between low-intermediate Ti mare basalts and non-mare materials needs further study.
We infer that the possible magma origin of the young Eratosthenian CE-3 basalts is from the late-stage of LMO crystallization, resulting in olivine-bearing, ilmenite-rich cumulate mantles. This was followed by the late concentration of KREEP minerals, presumably at the base of the ferroan anorthosite crust, as it ascended to the surface. While it is possible that the magma origin of the CE-3 basalts shares a common origin with the magma source, including the CE-5 basalts, in PKT, further study is needed.

