Abstract
Contrast enhancement of images is a crucial topic in image processing that improves the quality of images. The methods of image enhancement are classified into three types, including the histogram method, the fuzzy logic method, and the optimal method. Studies on image enhancement are often based on the rules: if it is bright, then it is brighter; if it is dark, then it is darker, using a global approach. Thus, it is hard to enhance objects in all dark and light areas, as in satellite images. This study presents a novel algorithm for improving satellite images, called remote sensing image enhancement based on cluster enhancement (RSIECE). First, the input image is clustered by the algorithm of fuzzy semi-supervised clustering. Then, the upper bound and lower bound are estimated according to the cluster. Next, a sub-algorithm is implemented for clustering enhancement using an enhancement operator. For each pixel, the gray levels for each channel (R, G, B) are transformed with this sub-algorithm to generate new corresponding gray levels because after clustering, pixels belong to clusters with the corresponding membership values. Therefore, the output gray level value will be aggregated from the enhanced gray levels by the sub-algorithm with the weight of the corresponding cluster membership value. The test results demonstrate that the suggested algorithm is superior to several recently developed approaches.
1. Introduction
Improving the contrast of images is an essential topic of research in the image processing field. Various methods and algorithms have been proposed to improve image quality. The term “image enhancement” refers to a wide variety of processes, including the elimination of noise [1,2], modifying the gray-level range, and unblurring an image. A number of distinct picture-enhancing techniques can be employed in combination with one another to get the best possible results [3,4].
Image enhancement methods could be widely classified into three categories: fuzzy logic, optimal, and histogram-based methods [5]. Fuzzy logic methods use fuzzy transformations to improve image quality. Optimal methods involve enhancing images by optimizing certain parameters. Histogram-based techniques, i.e., histogram equalization and histogram specification, modify the histogram of images to enhance their contrast and brightness. These methods can be used individually or in combination to enhance the visual appeal of an image, make it more readable, or highlight certain features. In recent research, different studies have combined different methods to improve image enhancement. For example, the gray-level modifying formulas and fuzzy logic are combined for enhancing images [6], the enhancement algorithm is based on a homogeneity measurement [7], a novel algorithm for MR image improvement is based on homomorphic and weighted mean filtering [8], and a technique of image enhancement for MRI brain images was presented based on neural networks [9]. Maini and Aggarwal [10] have conducted an overall assessment of image enhancement methods and found that power–law transformations are effective for general-purpose contrast manipulation. Specifically, a power–law transformation with a fractional exponent could be utilized for images with low brightness to expand the gray levels. Similarly, log transformation can enhance details in darker regions of the image, but it also causes a loss of details in brighter regions by decreasing the higher-level values. A novel method for enhancing retinal images was suggested by Ghosh et al. [11], and it makes use of a measure of fuzziness in conjunction with particle swarm optimization. In 2020, Kandhway et al. [12] introduced a novel framework for the analysis of medical images that was built on a krill herd and optimized for contrast and sharp edge improvement. Jia et al. [13] described a method that utilizes the ABC algorithm (artificial bee colony) to optimize the parameters of an incomplete beta function for grayscale transformation to enhance the images. In addition, Malika and Singh [14] suggested an ABC-based technique as a means of improving color photos within the wavelet domain. One approach developed by Iqbal et al. [15] for enhancing low-light photos is to increase input contrast and topic prominence while decreasing artifacts. In a study by Liu and Tian [16], the authors presented an algorithm for the improvement of images that was based on the fractional differential. A fusion-based low-light enhancing framework that directly integrates the image semantics into the improvement procedure was developed by Xie et al. [17]. Recent research in image enhancement has proposed a variety of techniques to increase the visibility of underwater photos. In the work conducted by Liang et al. [18], the authors presented a method that utilizes color correction and dehazing. Another approach proposed in the research of Fu and Cao [19] combines compressed-histogram equalization and global–local networks to enhance underwater images. Other techniques have also been introduced to enhance images in other scenarios. Dhal et al. [20] described a technique for dynamic histogram equalization that preserves brightness. Gu et al. [21] introduced a technique for retinex image enhancement that prioritizes the brightness channel. In Krylov et al. [22], a new method based on non-iterative grid warping was suggested for enhancing images in general. Moreover, Chao et al. [23] used the directional fields to enhance and post-process fingerprint images. Each method has its own strengths and weaknesses, and the best approach will depend on the specific image and the desired outcome of the enhancement. For example, histogram equalization is a broadly-utilized technique that adjusts the image’s brightness and contrast by redistributing the intensity values of the pixels. However, it may not be suitable for dark images because it may result in an over-saturation of bright regions. Other methods, such as log transformation, retinex, and multi-scale retinex, are also useful for enhancing the contrast, but could also have limitations.
Studies on image enhancement have traditionally relied on rule-based approaches that make images brighter if they are already bright and darker if they are already dark, using a global method. However, this approach can make it challenging to discriminate dark objects within an image, particularly when it contains dark and light areas. In recent years, researchers have begun to focus on developing methods that can more effectively deal with these dark areas. For instance, Singh et al. [24] suggested an approach for dark image enhancement using histogram equalization with gamma parameter optimization (SGHIE). Other studies have proposed methods such as exposure fusion [25], a robust retinex model [26], robust exposure correction [27], deep local parametric filters [28], deep illumination estimation [29], and a simple yet effective network [30]. Additionally, Guo et al. [31] used a method of dark image enhancement using deep curve estimation, Xu et al. [32] used decomposition and enhancement for training to restore dark low-light images, Yang et al. [33] introduced a technique of dark image enhancement that uses a semi-supervised approach, Haris et al. [34] presented a space-time-aware multi-resolution video enhancement, and Zeng et al. [35] suggested a method of real-time photo enhancement by learning 3D lookup tables. These are just some examples of recent studies that aim to address the problem of enhancing dark images.
In addition to these studies, there is also recent research that proposes methods for enhancing dark images using different techniques such as retinex-inspired unrolling [36], no-flash pairs and deep denoising of flash [37], image denoising [38], temporal consistency learning [39], and nighttime visibility enhancement [40]. Fuzzy type 2 and fuzzy clustering have also been used in image enhancement. In the study of Ngo et al. [41], a combination of fuzzy type 2 and fuzzy clustering was used to segment satellite images. In research conducted by Son and Tuan [42], semi-supervised fuzzy clustering was used to segment dental X-ray images. Singh et al. [43] introduced a new method of satellite image enhancement (known as PGCFDM), and the author also suggested another approach for the visibility enhancement of remotely sensed images in another study [44]. These studies demonstrate that there is a growing interest in developing methods for enhancing dark images, but there is still a need for new techniques that can effectively improve the visibility of these images while preserving their details.
This study proposes a novel algorithm called RSIECE, which utilizes fuzzy semi-supervised clustering and enhancement operators to effectively enhance the contrast of dark satellite imagery. The target of the proposed algorithm is to enhance the visibility of dark objects within the input image, making it easier to distinguish them in the post-enhancement image. Additionally, this algorithm aims to preserve the structural and textural features of the input image while improving its overall contrast. The proposed method utilizes a sub-component for image contrast enhancement using cluster ICEC and a dark image enhancement operator. The significant contributions of this article are:
- Introducing a new enhancement operator designed explicitly for dark remote sensing images.
- Providing a new algorithm for modifying the gray level of an image based on clustering.
The remaining sections are presented in this article as follows: in Section 2, relevant works are discussed, and an overview of the many techniques used to improve photographs with low contrast is given. Section 3 details the proposed algorithm, including its implementation and how it addresses the problem of enhancing dark objects in images. Section 4 presents the results of tests and assessments, and Section 5 concludes with a summary of the findings and future research directions.
2. Methodology
2.1. Principle of Using Fuzzy Logic for Image Enhancement
Assume image size I is M × N and L is the number of gray levels that can be considered as a fuzzy array. Each element is a value indicating the degree of brightness relative to the fuzzy set, which corresponds to the brightness levels. In order to enhance the image with fuzzy logic, the picture needs to be mapped from the gray level plane into a fuzzy plane by using a membership function [6,45]. For a picture, I can be written in the fuzzy set notation:
where is the membership value and is the intensity of (m, n)th pixel. The membership value represents a suitable property of the image. Recently, the concept of fuzziness has been applied to develop novel algorithms. Figure 1 illustrates the principle of fuzzy enhancement.

Figure 1.
The main principles of fuzzy image enhancement.
2.2. The Algorithm of Fuzzy Semi-Supervised Grouping
In this study, the algorithm of fuzzy semi-supervised grouping is based on fuzzy grouping with additional information. Additional information [31], in the cannot-link and must-link constraints type, is used to guide the clustering process and achieve a more accurate segmentation of the input image. This approach is similar to that introduced by Ghosh et al. [11], in which they proposed an algorithm of fuzzy semi-supervised clustering with additional information. They suggested adding the membership values to the objective function of fuzzy clustering to improve the efficiency of clustering. The following is a definition of this objective function:
where:
- m: the fuzzy parameter
- C: the number of groups
- N: the number of all data points
- µkj: membership value of the kth pixel of jth cluster
- Xk: the kth data point
- Vj: the center of group j.
The binding conditions are as follows:
From condition (3) and objective function (2), we have:
The values are determined by two cases, as follows:
- :
- :
Algorithm 1 shows the steps of the standard fuzzy semi-supervised grouping (SFSSG) algorithm below.
This approach is effective in improving the clustering accuracy and enhances the quality of the output image by using these membership values for the cluster enhancement sub-algorithm. The membership values are used as weights for the aggregation of output gray-level values, which further improves the accuracy of the enhancement operator. This method also allows for a more fine-tuned enhancement, particularly in the dark regions of the image.
| Algorithm 1 The standard fuzzy semi-supervised grouping algorithm. | |
| Input | Dataset X has group number C, N elements, threshold , the maximum number of loops maxStep > 0, and the matrix of adding membership . |
| Output | Matrix U and group centers V. |
| SFSSG | |
| 1: | t = 0 |
| 2: | Randomized initialization ; () |
| 3: | Loop |
| 4: | ++t |
| 5: | Calculate (; ) by Formula (5) with or Formula (6) with . |
| 6: | Calculate () by Formula (4) |
| 7: | Until t > maxStep or |
3. Proposed Method
In this section, a novel algorithm for image enhancement is described, which is referred to as the remote sensing image enhancement based on cluster enhancement (RSIECE). The RSIECE algorithm is illustrated in Figure 2, which provides a visual representation of the main steps involved in the algorithm.
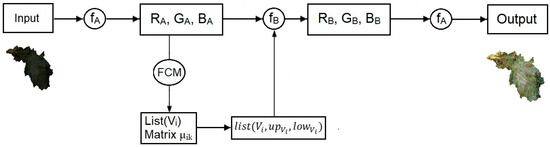
Figure 2.
Diagram of the RSIECE proposed algorithm.
From the graph that was just presented, the algorithm comprises the following steps:
- Step 1: Transforming , , according to the operator of the dark image object enhancement (ODIOE) (details in Section 3.1):Therefore:
- Step 2: Clustering SSSFG with the image (, , ) to obtain c clusters with centers Vi (i = 1, …, c) and the member matrix .
- Step 3: Calculating upper bound, lower bound according to each cluster (details in Section 3.2).
- Step 4: Aggregate gray levels from all clusters according to the formula:wherein ICEC is the algorithm of cluster-based gray-level transformation (details in Section 3.3).
- Step 5: Transforming () according to the operator ODIOE (details in Section 3.1):Therefore:
This algorithm is specifically designed to enhance the contrast in remote sensing images, which often have dark and light objects. The algorithm begins by using fuzzy semi-supervised clustering to segment the input image into different clusters. Next, the upper and lower bounds of each cluster are calculated. These bounds are then used to determine the gray-level transformation for each pixel. Finally, a sub-algorithm for clustering enhancement using an enhancement operator is implemented. This sub-algorithm transforms the gray levels for each channel (R, G, B) to generate new corresponding gray levels. The output gray-level value is then aggregated from the enhanced gray levels by the sub-algorithm with the weight of the corresponding cluster membership value. This unique approach of using clustering before enhancement allows for a more fine-tuned and precise enhancement, specifically in the dark areas of the scene, while preserving the image’s features.
3.1. The Operator of Dark Image Object Enhancement (ODIOE)
This operator is denoted as follows:
- Step 1: Gray level transformation to domain [0, 1] according to the ODIOE as follows:Therefore:
- Step 2: Transforming , , according to the formula:wherein: .
From Formula (14), it can be seen that:
- ✓
- If g approaches 0, then f(g) approaches 2∗g.
- ✓
- If g approaches 1, then f(g) approaches g.
- ✓
- So, if considering the domain [0, 255], it can be seen that:
- ✓
- If g approaches 0, then f(g) approaches 2∗g.
- ✓
- If g approaches 255, then f(g) approaches g.
Therefore:
- ✓
- Step 3: Transforming , , to domain [0, 255] according to the formula:Therefore:
3.2. Calculating Upper Bound and Lower Bound According to Group
Suppose is the histogram function of the gray values within each group. Figure 3 shows and , , . The thresholds , are determined by selecting an area of the crossover bar subregion greater than or equal to 99.5% of area of the region that is determined by the horizontal axis and function f(g).
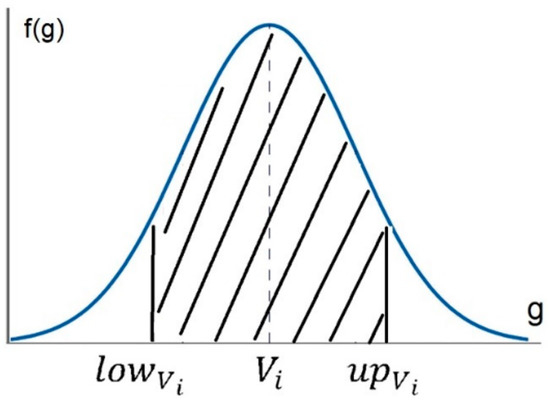
Figure 3.
The histogram function.
3.3. The Algorithm Based on the Cluster for Enhancing the Image Contrast
In this section, the authors introduced a novel algorithm for enhancing the image contrast based on the cluster (ICEC).
Input: , , , .
Output: .
Therein:
- : upper bound of the cluster ith, called up here.
- : upper bound of the cluster ith, called low here.
- : centroid of the cluster ith, called V here.
The steps of this following algorithm:
- Step 1: If g < low then g = low
- Step 2: If g > up then g = up
- Step 3: Calculating d:
- Step 4: Calculating b:
- Step 5: Calculating :
- Step 6: Calculating :
- Step 7: Calculating gray output level:
3.4. Main Contributions and Meaning of the Algorithm
In this proposed algorithm, several improvements are proposed to improve the contrast of the remote-sensing images. It does this through several improvements, including introducing a new schema for remote sensing image enhancement called RSIECE. This algorithm is better able to differentiate between dark and bright objects in images, improving the overall contrast of objects in photos. The new RSIECE schema uses clustering techniques to improve the segmentation of the photo, resulting in a more precise and fine-tuned approach to image enhancement. The RSIECE algorithm has two sub-components. The first is the cluster ICEC method, which partitions the input image into clusters to perform contrast enhancement within each cluster. The second sub-component is the dark image enhancement operator, which improves the overall contrast of the image.
The novelty of the RSIECE algorithm lies in the combination of these two sub-components and the use of fuzzy semi-supervised clustering to guide the image enhancement process. In contrast to existing methods that rely on global or local histogram equalization, the RSIECE method aims to preserve the structural and textural features of the input image while improving its overall contrast. This is achieved through the use of fuzzy clustering, which provides a more flexible and adaptive approach to image enhancement. The proposed dark image enhancement operator is specifically designed to handle the problem of low-contrast satellite images, enhancing the effectiveness of the overall algorithm.
4. Results and Discussion
In this article, recent methods are used for comparison, such as PGCFDM introduced by Singh et al. [43] (PGCFDM method) and the method of Ying et al. [25] (Ying method). These methods have been chosen, as they are among the most recent and relevant approaches to remote sensing image enhancement. The PGCFDM method uses histogram equalization by gamma parameter optimization for dark image enhancement, while the method of Ying uses exposure fusion for image enhancement. These methods provide a useful benchmark for assessing the effectiveness of the proposed technique and its suitability for dark images.
The experimental dataset used in this study is composed of Landsat ETM+ images taken in various regions and environments that can be encountered in Vietnam, which makes the dataset ideal for testing the efficacy of the method. The Landsat ETM+ sensor is a multi-spectral sensor that is capable of capturing images with a 30 m resolution. Landsat ETM+ image includes seven channels: Indigo, Green-red, Red, Near infrared, Medium infrared, Heat infrared, and Medium infrared. Because of the limited scope of the article, only ten satellite images are processed. These images are taken in the HoaBinh and SonLa provinces, including ten districts in this area. These locations are CaoPhong, DaBac, KimBoi, KySon, LacSon, LacThuy, LuongSon, MaiChau, TXHB (HoaBinh City), and YenThuy. Information on the dimensions of these images is described in Table 1. The choice of this dataset allows us to evaluate the proposed algorithm, RSIECE, using real-world satellite images, which can be helpful for various remote sensing applications. Due to the scope of the article, only a selection of the experimental results are presented and illustrated in Table 1; however, this dataset offers a wide range of test cases.

Table 1.
Brief information on experimental images from this study.
In this study, the RSIECE algorithm is examined against two other cutting-edge approaches, PGCFDM and Ying, regarding the visual results. The comparison is made using photos taken from the experimental dataset, which consists of Landsat ETM+ images from several regions of Vietnam. Table 1 shows the outcomes of processing these photos using the three distinct approaches. Visually, the results of the three methods can be clearly distinguished. The output image from the PGCFDM method shows almost no significant change in brightness and contrast compared to the original image. This means that the PGCFDM method fails to increase the contrast of the dark areas of the images, making it difficult to distinguish the objects within the image. By comparison, the output image from the Ying method is brighter than the original image, but the contrast between areas and objects in the image has not been improved.
In contrast, the output from the RSIECE algorithm is much brighter and clearer than the initial image, and the contrast between areas and objects is also enhanced. The improved contrast makes the later analysis process much easier, as objects in the image can be more easily distinguished. Thus, it can be concluded that the suggested RSIECE algorithm provides a better visual outcome than the other two approaches in regards to both image brightness and contrast enhancement. The RSIECE technique is able to successfully improve the contrast of dark areas of the image, making it a more efficient method for remote sensing image enhancement.
Additionally, mean, standard deviation, and entropy measures are employed to assess the image quality of the improved images. They are common image quality assessment metrics used to evaluate the effectiveness of image enhancement techniques. The mean index is calculated by taking the average of the pixel values in the enhanced image and comparing it to the average of the pixel values in the input image. A higher mean index value indicates that the enhanced image has a higher overall brightness and contrast than the input image. The entropy index is a measure of the randomness or unpredictability of the pixel values in an image. It is calculated using information theory and provides a measure of the amount of information contained in the image. A higher entropy value indicates a greater level of detail and complexity in the image. The equations for the mean index and entropy index are as follows:
where M, N are the total number of rows and columns of the matrix, respectively; I(u, v) is pixel value row u, column v of the matrix I; pi is the probability of occurrence of ith intensity level, and L is the maximum intensity value present in the image; and (u, v) is pixel value row u, column v of the matrix I.
The results are collected by comparing the original image and the enhanced images from the proposed algorithm and compared methods. These statistical results are presented in Table 2, Table 3 and Table 4 and Figure 4, Figure 5 and Figure 6.
Table 2.
Mean index of enhanced images by the RSIECE algorithm compared to the Ying and PGCFDM methods.
Table 3.
Standard deviation index of enhanced images by the RSIECE algorithm compared to the Ying and PGCFDM methods.
Table 4.
Entropy index of enhanced images by the RSIECE algorithm compared to the Ying and PGCFDM methods.
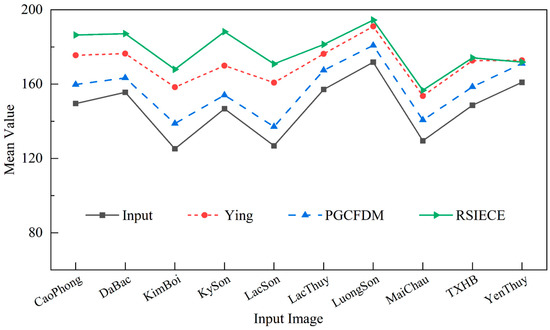
Figure 4.
Comparison of the quality of the enhanced images by the RSIECE algorithm with that of the Ying and PGCFDM methods in terms of the mean criteria.
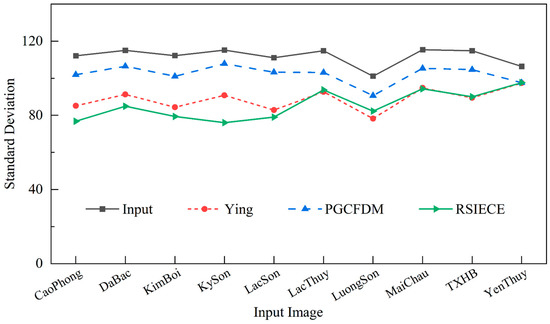
Figure 5.
Comparison of the quality of the enhanced images by the RSIECE algorithm with that of the Ying and PGCFDM methods in terms of the standard deviation criteria.
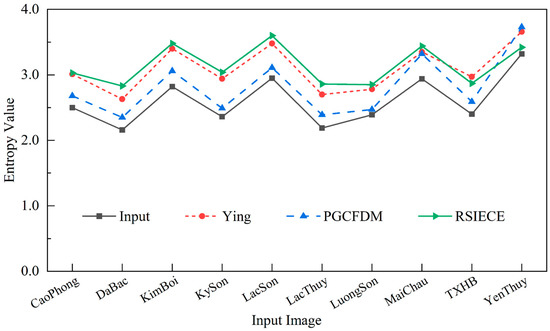
Figure 6.
Comparison of the quality of the enhanced images by the RSIECE algorithm with that of the Ying and PGCFDM methods in terms of the entropy index.
The number in Table 2 provides information on the comparison of the enhanced image quality based on the mean index for ten different locations in Vietnam. The mean value of the input images for each location varies, ranging from 125.20 to 171.82. This implies that the original images have diverse contrasts. The highest value is recorded in LuongSon, while the lowest is in KimBoi. The enhanced images produced by the Ying method show an improvement in the mean metric as compared to the input images, with an average increase of 23.54. The biggest improvement is seen in LacSon, where this metric increased by 3.96, while the least improvement is observed in YenThuy, where the mean value increased by only 11.87. Similarly, the PGCFDM approach demonstrates an enhancement with a 9.95 average increase. The largest improvement is shown in KimBoi, where the mean value improved by 13.56 from 125.20, and the smallest gain is seen in KySon, where this metric climbed by just 7.32. The suggested RSIECE approach, on the other hand, shows a considerable improvement in the mean index, with an average increase of 30.71. The greatest increase is observed in LacSon, where this value grew by 44.04, while the lowest improvement is found in YenThuy, where the mean value improved by just 10.90.
Table 3 shows the comparison of the standard deviation index for the input images and the enhanced images obtained using the Ying, PGCFDM, and RSIECE methods. The standard deviation values range from 106.41 to 115.43 for the input images. This indicates that the variability of the pixel intensity values in the original images differs across locations. The location of LuongSon has the lowest standard deviation value, while the location of MaiChau has the highest. When evaluating the standard deviation criteria of the enhanced images, the RSIECE method proves to be the most effective among the three methods, outperforming both the Ying and the PGCFDM methods. On average, the RSIECE approach decreases the standard deviation value by 26.42, with the highest reduction observed in KySon (39.17) and the lowest in YenThuy (8.80). The Ying technique, on the other hand, shows an average decrease of 23.13, with LacSon having the biggest reduction (28.27) and YenThuy having the lowest (8.96). The PGCFDM approach achieves an average decrease of 9.63, with LacThuy having the biggest decrease (11.65) and KySon having the smallest (21.13).
In general, the RSIECE method outperforms both the Ying and PGCFDM methods in terms of the mean index and is more effective in reducing the variability of pixel intensity values and enhancing the homogeneity of the images. This highlights the potential of RSIECE as a valuable tool for improving the quality of satellite images, especially in applications where homogeneity is a critical factor.
Table 4 provides a comparison of the enhanced image quality based on the entropy index, which measures the degree of randomness and complexity of pixel intensity values. The results show that, in general, the RSIECE algorithm outperforms both the Ying and the PGCFDM methods in terms of the entropy index. The RSIECE approach produces an increase in the entropy criteria that is 0.54 on average when compared to the input images. In comparison, the Ying method produces an increase of 0.49 on average, while the PGCFDM approach produces an increase of 0.22 on average. The entropy value for the site of KimBoi improved the most, with an increase of 0.66 for the RSIECE technique, 0.58 for the Ying method, and 0.24 for the PGCFDM method. This is the most improvement seen for any location. The location of YenThuy shows the least amount of improvement, with the RSIECE technique showing an increase of 0.10, the Ying approach indicating an increase of 0.34, and the PGCFDM method indicating an increase of 0.41. The improved entropy index for the RSIECE method indicates that the method is more effective in increasing the randomness and complexity of the pixel intensity values compared to the Ying and PGCFDM methods. This is a desirable property in satellite image processing, as it can help reveal more information that may be hidden in the original images due to low entropy.
In addition to evaluating images enhanced by the above statistical indicators, this study was also interested in the IL-NIQE index (integrated local natural image quality evaluator). IL-NIQE is a metric utilized to evaluate the quality of blurry images and was suggested in 2015 by Zhang et al. [46]. The IL-NIQE index reflects the visual quality of an image by evaluating its naturalness, noise, and sharpness. The assessment results of the IL-NIQE criteria are presented in Table 5.
Table 5.
IL-NIQE index of enhanced images by the RSIECE algorithm compared to the Ying and PGCFDM methods.
From Table 5, it can be seen that for all locations, the RSIECE algorithm outperformed the other two methods in terms of enhancing the quality of the input images, as the IL-NIQE index values are significantly lower than those using the Ying and PGCFDM methods. This means that the enhanced images generated by the RSIECE algorithm are of higher quality and are more natural-looking. In terms of specific locations, the input images from Mai Chau had the lowest quality, with an IL-NIQE index value of 24.84. However, the RSIECE algorithm was still able to significantly enhance the quality of the image, achieving an IL-NIQE index value of 22.69. Additionally, the RSIECE algorithm was able to increase the quality of the input images from all locations, despite the fact that input images from different locations exhibited varying IL-NIQE index values, which can be attributed to the differences in lighting conditions or weather.
The data presented in Table 2, Table 3, Table 4 and Table 5, as well as Figure 4, Figure 5 and Figure 6, clearly demonstrate that the effectiveness of the RSIECE method is superior to previous techniques in terms of picture quality. In every test, the output image produced by the RSIECE algorithm exhibited higher mean and entropy scores, indicating that the contrast of the image had been significantly enhanced. The method’s ability to improve the randomness and complexity of the pixel intensity values while also reducing the variability of the pixel intensity values highlights its potential for a wide range of satellite image processing applications. This is a strong indication that the RSIECE method is more effective in improving the contrast of dark images and that it is able to better distinguish objects in the image compared to other methods.
5. Conclusions
This work presented a novel algorithm, the RSIECE, which effectively improves the contrast of dark satellite images and improves the homogeneity of the enhanced images. The contributions of this work include:
- The development of a novel algorithm that combines fuzzy semi-supervised clustering and an enhancement operator to improve the contrast of dark satellite images.
- The utilization of group enhancement techniques, reducing the variability of pixel intensity values and improving the homogeneity of the enhanced images.
- The development of the RSIECE method, which outperforms the other two approaches (Ying and PGCFDM) in terms of various image quality indices, including the mean index, the standard deviation index, the entropy index, and the IL-NIQE index.
- The development of a method (RSIECE) that also improves the homogeneity of the enhanced images compared to the results of the Ying and PGCFDM methods.
- The demonstration of the potential of the RSIECE algorithm as a valuable tool for improving the quality of satellite images.
The proposed technique enhances the information content of the images, which is important in various applications, such as environmental monitoring and resource management. In future work, we aim to focus on evaluating the RSIECE method on a larger dataset to further validate its effectiveness and explore its potential for use in different scenarios.
Author Contributions
Conceptualization, methodology, software: N.T.T. and T.M.T.; writing—reviewing and editing: N.T.T. and X.-H.L. All authors have read and agreed to the published version of the manuscript.
Funding
This research was funded by Thuyloi University.
Data Availability Statement
Data will be made available on request.
Conflicts of Interest
The authors declare no conflict of interest.
References
- Sudhavani, G.; Madhuri, G.; Rao, P.V.; Prasad, K.S. Removing Gaussian Noise from Color Images by Varying the Size of Fuzzy Filters. Int. J. Comput. Appl. 2013, 72, 14–20. [Google Scholar]
- Sudhavani, G.; Madhuri, G.; Rao, P.V.; Prasad, K.S. Additive noise removal for color images using fuzzy filters. Int. J. Comput. Sci. Eng. 2013, 3, 1–10. [Google Scholar] [CrossRef]
- Yoon, B.-W.; Song, W.-J. Image contrast enhancement based on the generalized histogram. J. Electron. Imaging 2007, 16, 033005. [Google Scholar] [CrossRef]
- Singh, S.S.; Devi, D.H.M.; Singh, T.T.; Singh, O.I. A New Easy Method of Enhancement of Low Contrast Image using Spatial Domain. Int. J. Comput. Appl. 2012, 40, 32–34. [Google Scholar]
- Sharo, T.A.; Raimond, K. A Survey on Color Image Enhancement Techniques. IOSR J. Comput. Eng. 2013, 3, 20–24. [Google Scholar] [CrossRef]
- Hassanien, A.E.; Badr, A. A Comparative Study on Digital Mammography Enhancement Algorithms Based on Fuzzy Theory. Stud. Inform. Control 2003, 12, 21–32. [Google Scholar]
- Cheng, H.D.; Xue, M.; Shi, X.J. Contrast enhancement based on a novel homogeneity measurement. Pattern Recognit. 2003, 36, 2687–2697. [Google Scholar] [CrossRef]
- Yugander, P.; Tejaswini, C.H.; Meenakshi, J.; Kumar, K.S.; Varma, B.V.N.S.; Jagannath, M. MR Image Enhancement using Adaptive Weighted Mean Filtering and Homomorphic Filtering. Procedia Comput. Sci. 2020, 167, 677–685. [Google Scholar] [CrossRef]
- Dimililer, K.; İlhan, A. Effect of Image Enhancement on MRI Brain Images with Neural Networks. Procedia Comput. Sci. 2016, 102, 39–44. [Google Scholar] [CrossRef][Green Version]
- Maini, R.; Aggarwal, H. A Comprehensive Review of Image Enhancement Techniques. arXiv 2010. [Google Scholar] [CrossRef]
- Ghosh, S.K.; Biswas, B.; Ghosh, A. A novel Approach of Retinal Image Enhancement using PSO System and Measure of Fuzziness. Procedia Comput. Sci. 2020, 167, 1300–1311. [Google Scholar] [CrossRef]
- Kandhway, P.; Bhandari, A.K.; Singh, A. A novel reformed histogram equalization based medical image contrast enhancement using krill herd optimization. Biomed. Signal Process. Control 2020, 56, 101677. [Google Scholar] [CrossRef]
- Jia, C.; Chuyi, L.; Weiyu, Y. Adaptive Image Enhancement Based on Artificial Bee Colony Algorithm. In Proceedings of the CEIE 2016, Durrës, Albania, 28–30 October 2016; pp. 689–695. [Google Scholar] [CrossRef]
- Malika; Singh, R. Artificial Bee Colony Based Image Enhancement For Color Images In Discrete Wavelet Domain. Int. Res. J. Eng. Technol. 2017, 4, 443–448. [Google Scholar]
- Iqbal, M.; Ali, S.S.; Riaz, M.M.; Ghafoor, A.; Ahmad, A. Color and white balancing in low-light image enhancement. Optik 2020, 209, 164260. [Google Scholar] [CrossRef]
- Liu, K.; Tian, Y. Research and analysis of deep learning image enhancement algorithm based on fractional differential. Chaos Solitons Fractals 2020, 131, 109507. [Google Scholar] [CrossRef]
- Xie, J.; Bian, H.; Wu, Y.; Zhao, Y.; Shan, L.; Hao, S. Semantically-guided low-light image enhancement. Pattern Recognit. Lett. 2020, 138, 308–314. [Google Scholar] [CrossRef]
- Liang, Z.; Wang, Y.; Ding, X.; Mi, Z.; Fu, X. Single underwater image enhancement by attenuation map guided color correction and detail preserved dehazing. Neurocomputing 2021, 425, 160–172. [Google Scholar] [CrossRef]
- Fu, X.; Cao, X. Underwater image enhancement with global—Local networks and compressed-histogram equalization. Signal Process. Image Commun. 2020, 86, 115892. [Google Scholar] [CrossRef]
- Dhal, K.G.; Das, A.; Ghoshal, N.; Das, S. Variance Based Brightness Preserved Dynamic Histogram Equalization for Image Contrast Enhancement. Pattern Recognit. Image Anal. 2018, 28, 747–757. [Google Scholar] [CrossRef]
- Gu, Z.; Ju, M.; Zhang, D. A novel Retinex image enhancement approach via brightness channel prior and change of detail prior. Pattern Recognit. Image Anal. 2017, 27, 234–242. [Google Scholar] [CrossRef]
- Krylov, A.S.; Nasonova, A.V.; Nasonov, A.A. Image enhancement by non-iterative grid warping. Pattern Recognit. Image Anal. 2016, 26, 161–164. [Google Scholar] [CrossRef]
- Chao, G.C.; Lee, S.S.; Lai, H.C. Fingerprint image enhancement and postprocessing based on the directional fields. Pattern Recognit. Image Anal. 2007, 17, 560–566. [Google Scholar] [CrossRef]
- Singh, H.; Kumar, A.; Balyan, L.K.; Singh, G.K. Swarm intelligence optimized piecewise gamma corrected histogram equalization for dark image enhancement. Comput. Electr. Eng. 2018, 70, 462–475. [Google Scholar] [CrossRef]
- Ying, Z.; Li, G.; Ren, Y.; Wang, R.; Wang, W. A New Image Contrast Enhancement Algorithm Using Exposure Fusion Framework. In Proceedings of the CAIP 2017, Ystad, Sweden, 22–24 August 2017; pp. 36–46. [Google Scholar] [CrossRef]
- Li, M.; Liu, J.; Yang, W.; Sun, X.; Guo, Z. Structure-Revealing Low-Light Image Enhancement Via Robust Retinex Model. IEEE Trans. Image Process. 2018, 27, 2828–2841. [Google Scholar] [CrossRef] [PubMed]
- Zhang, Q.; Nie, Y.; Zheng, W.-S. Dual Illumination Estimation for Robust Exposure Correction. Comput. Graph. Forum 2019, 38, 243–252. [Google Scholar] [CrossRef]
- Moran, S.; Marza, P.; McDonagh, S.; Parisot, S.; Slabaugh, G. DeepLPF: Deep Local Parametric Filters for Image Enhancement. In Proceedings of the CVPR 2020, Seattle, WA, USA, 13–19 June 2020; pp. 12823–12832. [Google Scholar] [CrossRef]
- Wang, R.; Zhang, Q.; Fu, C.W.; Shen, X.; Zheng, W.S.; Jia, J. Underexposed Photo Enhancement Using Deep Illumination Estimation. In Proceedings of the CVPR 2019, Long Beach, CA, USA, 15–20 June 2019; pp. 6842–6850. [Google Scholar] [CrossRef]
- Zhang, Y.; Zhang, J.; Guo, X. Kindling the Darkness: A Practical Low-light Image Enhancer. In Proceedings of the 27th ACM International Conference on Multimedia, Nice, France, 14–18 August 2021; pp. 1632–1640. [Google Scholar] [CrossRef]
- Guo, C.; Li, C.; Guo, J.; Loy, C.C.; Hou, J.; Kwong, S.; Cong, R. Zero-Reference Deep Curve Estimation for Low-Light Image Enhancement. arXiv 2020. [Google Scholar] [CrossRef]
- Xu, K.; Yang, X.; Yin, B.; Lau, R.W.H. Learning to Restore Low-Light Images via Decomposition-and-Enhancement. In Proceedings of the CVPR 2020, Seattle, WA, USA, 13–19 June 2020; pp. 2278–2287. [Google Scholar] [CrossRef]
- Yang, W.; Wang, S.; Fang, Y.; Wang, Y.; Liu, J. From Fidelity to Perceptual Quality: A Semi-Supervised Approach for Low-Light Image Enhancement. In Proceedings of the CVPR 2020, Seattle, WA, USA, 13–19 June 2020; pp. 3060–3069. [Google Scholar] [CrossRef]
- Haris, M.; Shakhnarovich, G.; Ukita, N. Space-Time-Aware Multi-Resolution Video Enhancement. arXiv 2020. [Google Scholar] [CrossRef]
- Zeng, H.; Cai, J.; Li, L.; Cao, Z.; Zhang, L. Learning Image-Adaptive 3D Lookup Tables for High Performance Photo Enhancement in Real-Time. IEEE Trans. Pattern Anal. Mach. Intell. 2022, 44, 2058–2073. [Google Scholar] [CrossRef]
- Liu, R.; Ma, L.; Zhang, J.; Fan, X.; Luo, Z. Retinex-inspired Unrolling with Cooperative Prior Architecture Search for Low-light Image Enhancement. In Proceedings of the CVPR 2021, Virtual, 19–25 June 2021; pp. 10556–10565. [Google Scholar] [CrossRef]
- Xia, Z.; Gharbi, M.; Perazzi, F.; Sunkavalli, K.; Chakrabarti, A. Deep Denoising of Flash and No-Flash Pairs for Photography in Low-Light Environments. In Proceedings of the CVPR 2021, Virtual, 19–25 June 2021; pp. 2063–2072. [Google Scholar] [CrossRef]
- Moseley, B.; Bickel, V.; López-Francos, I.G.; Rana, L. Extreme Low-Light Environment-Driven Image Denoising over Permanently Shadowed Lunar Regions with a Physical Noise Model. In Proceedings of the CVPR 2021, Virtual, 19–25 June 2021; pp. 6313–6323. [Google Scholar] [CrossRef]
- Zhang, F.; Li, Y.; You, S.; Fu, Y. Learning Temporal Consistency for Low Light Video Enhancement from Single Images. In Proceedings of the CVPR 2021, Virtual, 19–25 June 2021; pp. 4965–4974. [Google Scholar] [CrossRef]
- Sharma, A.; Tan, R.T. Nighttime Visibility Enhancement by Increasing the Dynamic Range and Suppression of Light Effects. In Proceedings of the CVPR 2021, Virtual, 19–25 June 2021; pp. 11972–11981. [Google Scholar] [CrossRef]
- Ngo, L.T.; Mai, D.S.; Pedrycz, W. Semi-supervising Interval Type-2 Fuzzy C-Means clustering with spatial information for multi-spectral satellite image classification and change detection. Comput. Geosci. 2015, 83, 1–16. [Google Scholar] [CrossRef]
- Son, L.H.; Tuan, T.M. Dental segmentation from X-ray images using semi-supervised fuzzy clustering with spatial constraints. Eng. Appl. Artif. Intell. 2017, 59, 186–195. [Google Scholar] [CrossRef]
- Singh, H.; Kumar, A.; Balyan, L.K.; Singh, G.K. A novel optimally weighted framework of piecewise gamma corrected fractional order masking for satellite image enhancement. Comput. Electr. Eng. 2019, 75, 245–261. [Google Scholar] [CrossRef]
- Singh, H.; Kumar, A.; Balyan, L.K.; Lee, H.N. Spatial Entropy Quartiles-Based Texture-Aware Fractional-Order Unsharp Masking for Visibility Enhancement of Remotely Sensed Images. IEEE Trans. Syst. Man Cybern. Syst. 2022, 52, 2275–2288. [Google Scholar] [CrossRef]
- Sudhavani, G.; Srilakshmi, M.; Rao, P.V.; Prasad, K.S. Comparison of Fuzzy Contrast Enhancement Techniques. Int. J. Comput. Appl. 2014, 95, 26–31. [Google Scholar] [CrossRef]
- Zhang, L.; Zhang, L.; Bovik, A.C. A Feature-Enriched Completely Blind Image Quality Evaluator. IEEE Trans. Image Process. 2015, 24, 2579–2591. [Google Scholar] [CrossRef]


Disclaimer/Publisher’s Note: The statements, opinions and data contained in all publications are solely those of the individual author(s) and contributor(s) and not of MDPI and/or the editor(s). MDPI and/or the editor(s) disclaim responsibility for any injury to people or property resulting from any ideas, methods, instructions or products referred to in the content. |
© 2023 by the authors. Licensee MDPI, Basel, Switzerland. This article is an open access article distributed under the terms and conditions of the Creative Commons Attribution (CC BY) license (https://creativecommons.org/licenses/by/4.0/).