Abstract
In this study, we present nearly 9 years of the quasi16-day wave (Q16DW) in the mesosphere and lower thermosphere (MLT) wind at middle latitudes based on long-term wind observations between April 2014 and December 2022 by the Mengcheng (33.4°N, 116.5°E) meteor radar. There are two maxima in the Q16DW amplitude in the winter and early spring (near the equinox) and a minimum during the summer. The Q16DWs are relatively weak in meridional winds with no obvious seasonal variations. On average, the phase of the zonal Q16DW is larger than the meridional components with a mean difference that is slightly less than 90°, which suggests that there are orthogonal relationships between them. During the bursts of Q16DW, the periods in winter range between 15 and 18 d, whereas in summer, the periods of the planetary waves have a wider range. The wintertime Q16DW anomalies are, on average, amplified when the zonal wind shear anomalies increase, suggesting that barotropic instability may be a source of the Q16DW. Although the interannual variability of Q16DW amplitudes has been suggested observationally, there is no significant relationship between the interannual wind shear variability and Q16DW at most altitudes.
1. Introduction
The atmosphere between 60 km and 120 km, which is also referred to as the mesosphere and the lower thermosphere region (MLT), connects the lower and upper atmosphere. Horizontal and vertical coupling due to atmospheric waves plays essential roles in the transport of momentum, energy, and chemical species through the atmosphere. Of the various atmospheric wave types, planetary waves (PWs) play a critical role in MLT dynamics.
In recent decades, numerous studies have reported observed MLT planetary waves for different periods [1] of approximately 2 days [2,3], 4–7 days [4,5,6,7], 8–12 days [8,9,10], and 12–20 days [11,12,13]. MLT PWs could either be generated in situ as a result of atmospheric disturbances or be excited in the lower atmosphere and then propagate vertically in the middle atmosphere [14] and further penetrate into the MLT under suitable atmospheric conditions [15].
Quasi 16-day waves (Q16DW) are usually considered PWs with periods ranging from 12 days to 20 days. The Q16DW manifests itself with the westwards-propagating symmetric Rossby normal mode with wavenumber 1 [16]. Since Kingsley et al. [17] first reported the MLT Q16DW using the neutral winds observed by the meteor radar (MR) over Sheffield (53°N, 2°W), numerous papers have reported the Q16DW in the winter hemisphere at midlatitudes and high latitudes as a function of the neutral wind as measured by the radar [18,19], where the Q16DW is characterized by a larger amplitude in winter and a weaker amplitude in summer [20]. At lower latitudes, the Q16DW does not have significant seasonal variability [21]. Araújo et al. [22] suggested that the Q16DW is usually active during late spring months and becomes quite active during early winter, according to the MR observations at São João do Cariri (7.4°S, 36.5°W). A comparison between the Q16DW in the Northern and Southern Hemispheres [20] suggested similar seasonal variations in both hemispheres.
In the remainder of this paper, we obtained the characteristics of the Q16DW observed by MR at Mengcheng (33.4°N, 116.5°E), which was installed in April 2014. The MR winds are analyzed on the basis of continuous observations throughout the day. At some altitudes, the meteor count rate is sometimes low, which can lead to missing meteor radar observations and data gaps. The purpose of this study is to investigate the Q16DW variation with respect to actual periods at Mengcheng to improve the understanding of the Q16DW characteristics. We adopt the background wind shear computed from the meteor radar observations as a proxy for the baroclinic instability. Section 2 briefly describes the instruments and observational methods, and the Q16DW feature observed by Mengcheng’s meteor radar is detailed in Section 3. Section 4 contains a discussion of the Q16DW’s relation to the vertical wind shear and solar cycle, and Section 5 contains a summary of the results.
2. Horizontal Wind Measurements and Methods
2.1. Mengcheng Meteor Radar
The Mengcheng all-sky interferometric meteor radar (MCMR) was installed at the Mengcheng station (33.4°N, 116.5°E) in Anhui Province, China (Figure 1). The MCMR has been operating by the University of Science and Technology of China (USTC) since April 2014.
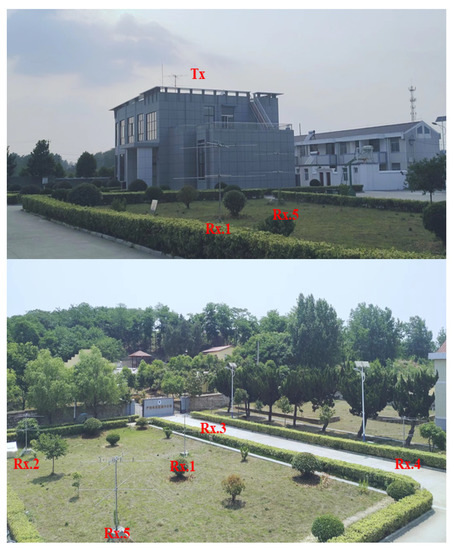
Figure 1.
Panoramic view of the Mengcheng meteor radar receiving antenna array. Tx represents the transmitting antenna, and Rx. 1–5 represent the five receiving antenna elements.
The MCMR radar system is an atmospheric radar system (ATRAD) weather-detection radar, as suggested by Holdsworth et al. [23]. MCMR transmits a 38.9 MHz pulsed coherent radio signal with a wavelength of 7.71 m and a peak power of 20 kW. A 4-bit code and a pulse repetition frequency (PRF) of 430 Hz are adopted by the MCMR with four sample integrations. Table 1 lists the key parameters of MCMR. In total, the radar has six pairs of cross-dipole antennas, of which one pair acts as the transmitter and the other five together make up a receiver.

Table 1.
Main parameters of the Mengcheng meteor radar.
Horizontal windswith resolutions of 1 h (time) and 2 km (altitude) from April 2014 to December 2022 were observed by the MCMR, following the wind retrieval technique in [23]. The residual RMS (root mean square) of the hourly horizontal velocity provided by the Mengcheng meteor radar system is mostly smaller than 10 m/s. In addition, Reid et al. [24] and Zeng et al. [25] carried out joint measurement campaigns involving two meteor radars located at Davis Station in Antarctica and at Kunming Station at low latitudes, respectively, and summarized the performance of wind measurements observed by meteor radar and provided a precise estimation of wind uncertainties.
In this study, the daily mean horizontal winds in MLT were averaged from the zonal and meridional hourly MR wind measurements. Then, the daily mean zonal and meridional winds are used to extract the amplitudes and phase of the Q16DWs at Mengcheng to investigate the seasonal variations in Q16DW in the MLT region at northern midlatitudes.
2.2. WACCM Simulation
The Whole Atmosphere Community Climate Model (WACCM), version 4, is a high-top chemistry-climate coupled model [26], with an altitude range from the Earth’s surface to the thermosphere. WACCM was developed by the National Center for Atmospheric Research (NCAR) and is a member of the Community Earth System Model. To investigate the seasonal variation in the Q16DW variation and compare it with the meteor radar observations, a 36-year (1979–2014) simulation is adopted based on the “Specific Dynamics” (SD) version of WACCM (SD-WACCM). To obtain “more real” atmospheric simulations, the dynamics in the lower atmosphere from the surface to 1 hPa of SD-WACCM are nudged with data from version 2 of Modern-Era Retrospective Analysis for Research and Applications reanalysis (MERRA2) [27].
2.3. Data Analysis
The reflected signal of meteor tracks has a Gaussian peak at approximately 90 km with a full width of 40 km corresponding to 70 km to 110 km [28]. Under the assumption of a weak vertical wind, the hourly horizontal wind values from radar measurements are obtained by using the least square method to fit the individual radial wind with an hourly time step [29]. Then, the daily mean horizontal winds are used to calculate the vertical wind shear and characteristics of quasi 16-day waves. Indeed, the results in this paper remain similar when a time window of 40 to 80 days was chosen.
The MR observation data are usually unevenly spaced since there are few meteors during certain time intervals, especially at the upper and lower altitudes during the afternoon. The Q16DW periods are determined by Lomb–Scargle periodogram analyses [30] with respect to the unevenly spaced daily mean zonal wind in each of the 61-day windows. Sliding window spectral analysis and fitting methods are often used for extracting planetary waves from radar observations [31,32]. To investigate the characteristics of the intraseasonal, annual cycle, and interannual variability of Q16DW, a 61-day sliding window is adopted in this paper. Then, the characteristics of Q16DW, including amplitude and phase, are obtained by harmonic fitting at the selected period, which was defined where the amplitude reaches its maximum between 12 and 20 days for the analyzed 61-day period. In cases that have more than one maximum within the chosen time interval, those with lower amplitudes are ignored here even though they are closer to 16 days. Note that the periodograms are computed based on the zonal component because the zonal Q16DW amplitudes are much larger than the meridional amplitudes in the observation.
The “anomalies” in this study refer to the date with the climatological mean seasonal cycle removed. The F10.7 flux used in this study is obtained from the Low−Resolution OMNI (LRO) data set.
3. Results
The MCMR observations of monthly average horizontal winds from April 2014 through December 2022 are shown in Figure 2. Seasonal variations in MLT wind are inconsistent at different heights. Above 88 km, the annual cycle of the zonal wind is mainly characterized by a strong eastward wind during spring and early summer with a maximum of approximately 60 m/s at 93 km and a weak westward wind during winter with a minimum of approximately −10 m/s at 100 km. Below 88 km, the eastward wind peaks during winter, with a maximum of approximately 50 m/s, and a weak westward wind manifests during spring, with a minimum of approximately −20 m/s. Figure 2b shows the monthly mean variation in the meridional wind. The northward wind is strongest during winter, with a maximum of approximately 20 m/s below 90 km, while the southward wind has a minimum of approximately −15 m/s at 80 km during summer. During the early spring, there is another meridional minimum at approximately 95 km in the observations.
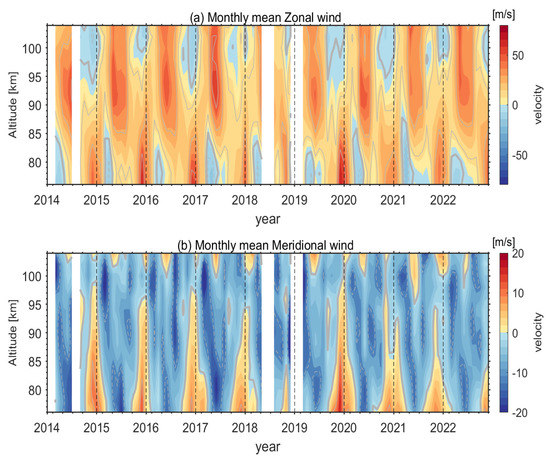
Figure 2.
(a) Monthly mean zonal (eastward is positive) and (b) meridional (northward is positive) winds from 2014 to 2022 observed by the Mengcheng meteor radar between altitudes of 76 and 106 km.
Figure 3 shows that the period of 10- to 20-day variabilities in zonal winds at 84 km is larger in winter in most years. The 84 km height was selected because the amplitude of the Q16DW is relatively strong at this height, and the seasonal variations are significant as described later. In addition to the Q16DW oscillations observed in, for example, early 2020, quasi10-day oscillations are also seen (e.g., early 2018). The quasi—10-day oscillations are also clearly presented during winter in the periodicity spectrum. However, for the meridional winds, significant quasi-16-day oscillations exist only in early 2020.
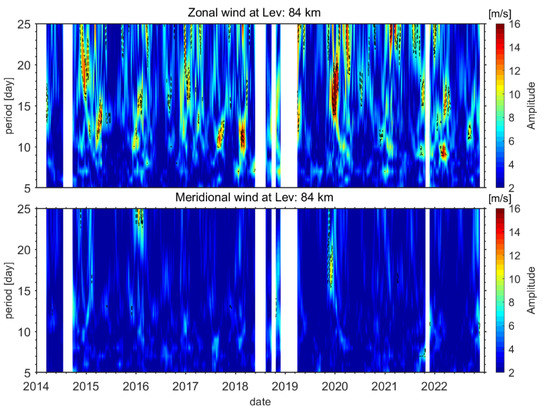
Figure 3.
Lomb Scargle Spectral of 84 km zonal (upper panel) and meridional (lower panel) wind observed by the meteor radar between April 2014 and December 2022. The area surrounded by the dashed lines indicates significant power according to the false alarm probability.
The distribution of zonal amplitudes at 84 km through the years 2014–2022 as obtained from the periodograms of the Lomb–Scargle is shown in Figure 4. The cyan dots indicate the period with the largest amplitude ranging from 12 to 20 days. During the boreal wintertime, the burst of Q16DW appears earlier in certain years (such as 2014, 2016, or 2019), with a representative peak in late November or early December. For years such as 2016 and 2018, Q16DW became active until February or March. For some years, the burst of Q16DW appears twice during both the mid-winter and spring months. In general, the strongest Q16DW activities are observed in the boreal mid-winter (from December or January). In addition, there are also significant Q16DW activities from March to May in some years (e.g., 2015, 2022). The Q16DW amplitude is quite weak in the winter of 2020–2021.
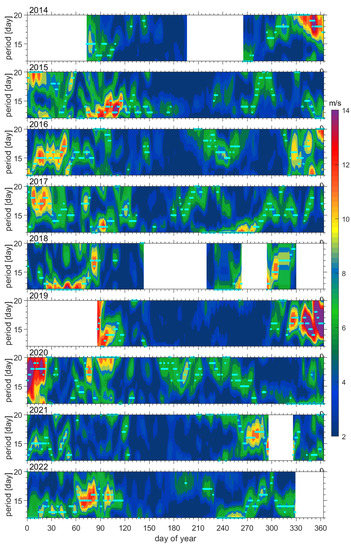
Figure 4.
Periodograms of zonal amplitudes for 2014–2022 at 84 km. The date represents the center day of a 61-day window. The cyan points denote the period with the largest amplitude between 12 days and 20 days for wave amplitudes greater than 6 m·s−1.
The periods for the Q16DW maxima for both the midwinter and spring bursts of 2014–2015 are 17 and 13 days, respectively, as suggested by the running spectrum, which provides a typical example of the seasonal variation in wave activity. This indicates that the active wave from December to January has longer periods than that during the spring event. However, this is not always the case. For instance, in the winter of 2019–2020, the period for the midwinter burst is approximately 15 to 17 days, while the periods for the spring outburst are near 20 d, which is longer than those of 2015. However, considering the 20 d period to be near the edge of the analyzed period range, it is possible that the signal within the 2020 source is induced by slower atmospheric activity, such as intraseasonal variation, rather than by the typical Q16DW signal. Generally, the periods for the wave burst during mid-winter are usually concentrated at approximately 15 to 17 days, whereas those for the spring are more variable.
Significant increases in the Q16DW amplitudes can be seen each winter from 2014 to 2022. On the other hand, the maximum in Q16DW amplitude is small for all nine summers, which is, on average, only approximately two times larger than the minimum during the month of May, which is comparable to previous observations. (e.g., [33]). Periods for the Q16DW maxima are quite variable in summer and fall. The Q16 day wave activity during summer is erratic: it is typically large during July and August of 2016, 2017, and 2020, whereas no significant Q16DW activity is observed during the summers of 2019 and 2021 in the measurements. Some years (e.g., 2018, 2021) also show peaks in amplitudes during the months of September or October. The seasonal cycle of the Q16DW basically agrees with previous studies. As suggested by Yi et al. [34], the variabilities of PWs with periods within the 12–20 day band in mesopause temperature are characterized by enhancement during the winter and suppression during the summer, associated with a small enhancement near the spring equinox. In the study of seasonal variation in the Q16DW, Gong et al. [12] found that the Q16DW activities in the Northern Hemisphere mid-latitudes are typically stronger in winter and weaker in summer. The characteristics of the Q16DW seasonal cycle are similar to those of the neutral wind and temperature in the same region. In the MLT region, Q16DWs at low latitudes show enhancements in both summer and winter [20].
Since the Q16DW is perceived to be more intense during winter, which refers to the months of November through March, we focus our attention on the characteristics of the Q16DW during winter. To investigate the relationship between wave periods and amplitudes at 84 km, the histograms of periods with respect to the different ranges of amplitude amplitudes during winter are presented in Figure 5. We omit boundary periods shorter than 5 days or longer than 25 days. The dark blue bars indicate only the largest amplitudes, while the light cyan bars include days of all amplitudes. For the strong PWs with amplitudes above 15 m s−1 (dark blue columns), the periods have a median of 15 d, while the median across all amplitudes, including faint amplitudes (light cyan), is 16 d. For the period range of 12–20 d, the lower and upper quartiles of the strong PW periods correspond to 14 d and 17 d, respectively. In addition, there is another clear maximum in the counts of the periods located at 9 to 12 d, suggesting the activity of quasi-10 day PWs [35]. There are a large number of quasi-16-day waves with total amplitudes between 10 m s−1 and 15 m s−1 in winter; thus, in the remainder of this paper, we focus on the Q16DW with total amplitudes greater than 10 m s−1, which are considered “active Q16DW” cases in the following investigation.
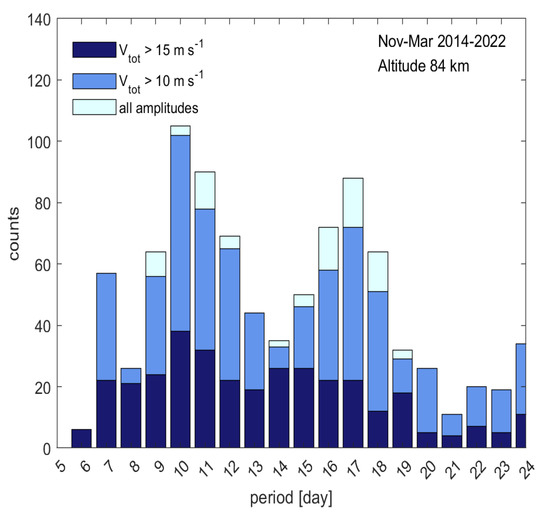
Figure 5.
Distribution of Q16DW periods in the boreal winter (Nov–March) for the years 2014–2022. Dark blue: amplitudes larger than 15 m s−1 only. Light blue: amplitudes between 10 and 15 m s−1. Light cyan: amplitudes smaller than 10 m s−1.
To evaluate the amplitude difference between the zonal and meridional components of Q16DW, the relative amplitude differences ∆υ are defined as
where () denotes the zonal (meridional) component of the Q16DW amplitude. clearly shows the dominant component of the Q16DW oscillation, and the positive (negative) value represents zonal (meridional) wind dominance. The relative amplitude differences with 738 winter days are shown in Figure 6. The mean of the relative difference is 99.3%, while the median is 105%. The 5% and 95% percentiles of the difference amount to 5% and 170%, respectively. The zonal component, therefore, tends to be greater than the meridional component. Although the zonal amplitude also tends to be slightly larger because the periods of the Q16DW were chosen based on the amplitude peaks in the zonal waves, the effect is not significant. Indeed, the 5% and 95% percentiles of the relative amplitude differences would be 10% and 165% when they were calculated at the periods when the meridional amplitude is the largest. Thus, the zonal component of Q16DW is qualitatively stronger than the meridional counterpart.
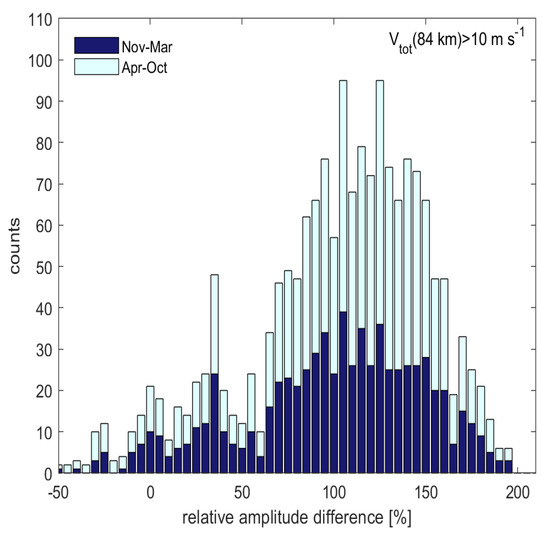
Figure 6.
Histogram of the relative amplitude differences (∆v) between the zonal and meridional components of the Q16DW amplitudes at 84 km. Only waves with amplitudes in excess of 10 m s−1 are considered. There are 738 days considered for winter (indicated by the dark blue bars, November–March), whereas 285 days are considered for the remainder of the year (Light cyan bars, April–October).
The difference between the 84 km Q16DW zonal phase and its meridional counterpart for Q16DW active days is shown in Figure 7. Dark blue bars denote cases during boreal winter (November–March), while light cyan bars indicate the remainder of the year. The number of active cases during the remainder of the years is much less than that during the winter. To estimate the typical features of the Q16DW phase relations, a Gaussian fit was performed on the winter cases. Given that the phase difference primarily localizes between 0° and 120°, whereas the range of the phase difference is expected to be within 360°, we set the range of the phase difference between −90° and 270° to better estimate the statistical characteristics of the phase difference by Gaussian fitting. The mean (80.5°) and median (72.5°) values are all similar to one another. The phase differences are close to 90° with a small bias, implying that the zonal and meridional components are nearly quadratic to each other.
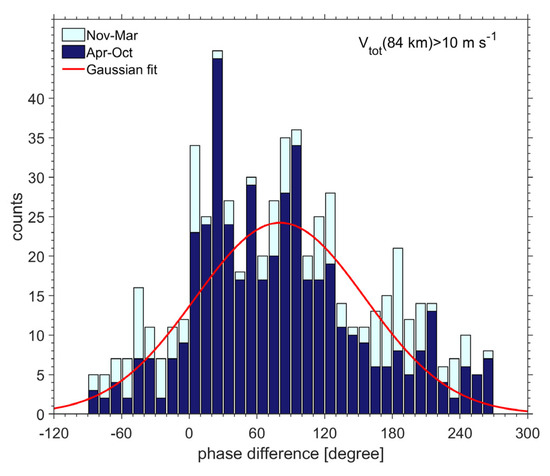
Figure 7.
The same as Figure 6 but for the phase difference. The red line indicates the Gaussian fit.
In Figure 8, we show the average phase difference of the “active” Q16DW components at each altitude along with their standard deviations (left panel). Between 80 and 90 km, the phase difference increases with height, ranging from 60 degrees to 110 degrees, which indicates that the longitudinal and latitudinal fluctuations are roughly orthogonal, as noted earlier. The phase difference remains similar between 90 km and 100 km but decreases with heights above 100 km. As suggested by the mean difference between the Q16DW zonal and meridional amplitudes (the right panel of Figure 8), the zonal amplitude is 4.5 m s−1 larger than the meridional amplitude at 104 km, which increases as the height decreases and peaks at 8 m s−1 at 88 km and slightly decreases below.
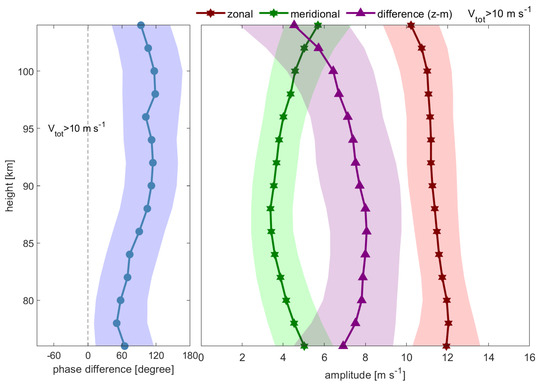
Figure 8.
Left panel: the mean of the phase difference (blue dots and line) between the zonal and meridional components during 2014–2022. The blue shadings indicate their standard deviations. Right panel: the 2014–2022 mean zonal (red stars and line) and meridional (green stars and line) amplitudes as well as their standard deviations (red and green shading). Amplitude differences with standard deviation are shown in purple triangles, lines, and shading.
4. Discussion
4.1. Relationship with the Zonal Wind Shear
As baroclinic instability is considered an origin of PWs in the mesosphere [36], the northward gradient of quasigeostrophic potential vorticity qy should have an opposite sign to trigger instability. Since the strongest zonal wind is located below the MLT region, the vertical shear of the zonal wind is adopted as a proxy for determining baroclinic instability to study the possible baroclinic instability in the MLT region based on the MR measurements.
The average seasonal cycle of the total Q16DW amplitudes at 84 km (the top panel) and at all altitudes (the bottom panel) is shown in Figure 9. The gray lines show the total Q16DW amplitudes, which refer to the arithmetic square root of the zonal and meridional amplitudes at 84 km (top panel), for each year from 2014 April to 2022 December. The 9-yr mean of the total, zonal and meridional amplitudes of Q16DW are denoted by thick, dotted, and dashed black lines, respectively. A 45-day window average of the 9-year mean is represented by the red line. Either the average seasonal variation in the Q16DW amplitude or those for each year suggest stronger winter Q16DW activity and weaker spring activity, as has also been noted earlier. The zonal amplitude in Figure 9 is much stronger than its meridional counterpart. The burst of winter Q16DW typically begins to increase in December.
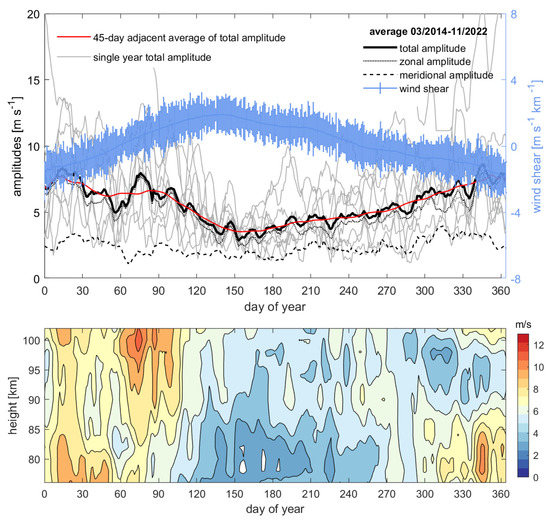
Figure 9.
Top panel: Light gray lines indicate the annual Q16DW amplitudes at 84 km for each year between April 2014 and December 2022. The thick black line indicates the mean of the total Q16DW amplitudes from 2014 to 2022, whereas the meridional and zonal components are denoted by the dashed and dotted lines, respectively. The smooth red line represents the 45-day adjacent mean for the multiyear averaged amplitude. The blue curve and error bars show the vertical zonal wind shear and its standard deviation, respectively. Bottom panel: the 9-yr mean total amplitudes of Q16DW as a function of height in an annual cycle (shading and contour).
For example, a magnificent large burst of Q16DW began in December 2019. The Q16DW amplitudes persist strongly into late March and early April, with multiyear mean amplitudes (red curve) in excess of 6 m s−1. Individual bursts (gray lines) can have significant amplitudes, peaking as high as 20 m s−1 in some years. In summer, the Q16DW amplitudes are much smaller, with mean amplitudes of approximately 3–4 m s−1. As shown by the dotted and dashed lines in Figure 9, the seasonal variation in the Q16DW amplitude is mainly attributed to the variation in the zonal direction, while the seasonal variation in the meridional component is not significant.
The variation in the baroclinic instability, denoted by the zonal wind shear, is potentially considered to be the variation in the Q16DW source. The vertical shear of the zonal wind at 84 km (a blue line in Figure 9) was calculated by the linear fit from the vertical difference in the zonal wind between 78 km and 102 km. The 9-yr mean Q16DW amplitudes start to increase in June, shortly after the shear reaches its maximum in May. During the winter months, the Q16DW burst typically occurs during December and January, when wind shear reaches its minimum. Generally, the seasonal cycle of the wind shear and the Q16DW amplitude are negatively correlated with each other. However, there is a positive relationship between the seasonal cycle of wind shear and other planetary wave components, such as Q2DW [36], which can obscure the relationship between atmospheric instability and waves within certain periods.
The lower panel of Figure 9 displays the mean seasonal cycles at different altitudes from 78 to 102 km, which suggests a stronger Q16DW during winter and a weaker amplitude during summer. In the lower altitude, the burst of Q16DW occurred during the mid-winter, while there is another amplitude maximum during March and April above 90 km.
The amplitudes of Q16DW at the same location derived from the 35-yr SD-WACCM simulation are shown in Figure 10. In the WACCM simulation, the amplitude of Q16DW is also strongest during the winter. However, there is another maximum of the amplitude during the summer, while the minimum of the total amplitude is seen during September and October. The meridional amplitude in the WACCM simulation is more comparable to the zonal counterpart, although it is still weaker than the zonal amplitude. As shown in the lower panel of Figure 10, the burst of Q16DW in the summer is confined below 90 km. The wind shear in the WACCM simulation suggested a burst of instability during summer, which implies a connection with the summer peak of the Q16DW amplitude.
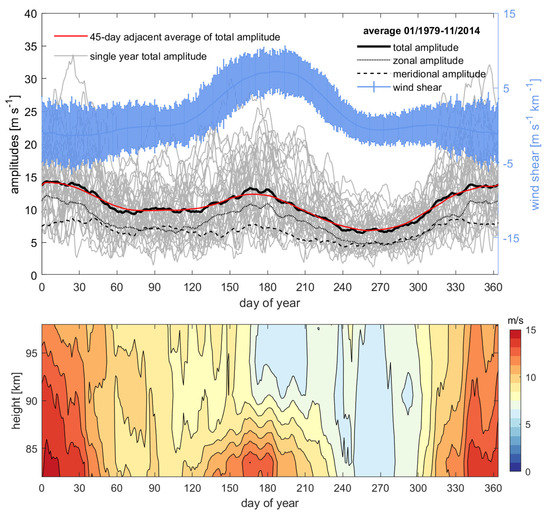
Figure 10.
The same as Figure 9 but for the 35-year WACCM simulation.
Baroclinic instability may not only vary annually but also affect Q16DW on a shorter timescale. Therefore, we next consider the possible relationship between the Q16DW amplitude and zonal wind shear during winter. To focus on the shorter timescales, we excluded the annual mean from both the amplitude of the wind shear and Q16DW. Then, two methods of superposed epoch analyses were applied to the anomalies of the wave amplitude and wind shear during the winter (November–March). For the first method, the central days are identified when the Q16DW are “active”. For the second method, the central days are identified when the wind shear is larger than 2 m s−1 km−1. Once the central days have been identified, time windows from 70 days prior to the central days to 70 days after the central days are considered.
The total Q16DW amplitude and wind shear anomalies within the windows are averaged over all cases for each of the methods. Figure 11 suggests that the anomalous Q16DW at 84 km has a positive correlation with the anomalous vertical wind shear; that is, the Q16DW tends to be enhanced as the baroclinic instability increases in the MLT region.
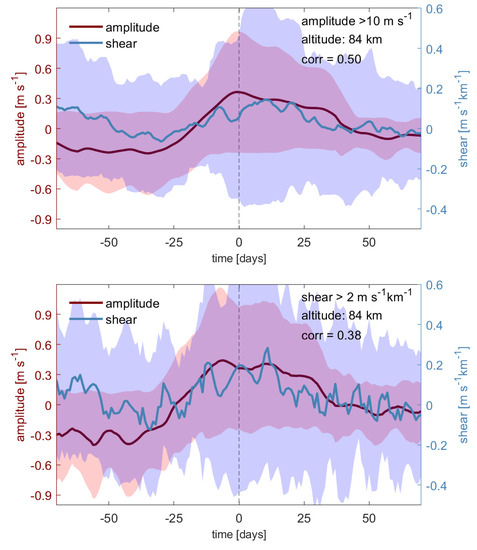
Figure 11.
The mean of the anomalous vertical wind shear from the zonal wind (blue line) and the total Q16DW amplitudes (red line) from 70 d before the central day to 70 d after the central day at 84 km, along with the standard error (shading). Top panel: central days are identified when the Q16DW amplitude > 10 m s−1. Bottom panel: central days are identified when wind shear > 2 m s−1 km−1 during the winter (November–March).
The results in Figure 11 suggest that the 84 km Q16DW tends to amplify as the wind shear peaks, implying that enhanced baroclinic instability may benefit the occurrence of Q16DW. The correlations between the amplitude and wind shear suggested by the two methods are 0.50 and 0.38, respectively. Indeed, the positive correlation between Q16DW anomalies and the wind shear anomalies is also suggested by the WACCM simulation for the “active Q16DW” cases; however, the wind shear anomalies in the SDWACCM are much weaker than the observations. The correlation between the two, however, does not necessarily prove that atmospheric instability is the primary forcing factor for the variation in Q16DW because of the large error in the data. Furthermore, the relationship at 84 km altitude is not as significant at the other altitudes.
4.2. Interannual Variability
As suggested by previous studies [37], the mesospheric planetary wave amplitudes were correlated to the 11-year solar cycle in observations. Although F10.7 and Q16DW could both affect the variability of the ionosphere [38,39], it remains unclear whether they are independent of each other [40]. The upper part of the top panel in Figure 12 shows the radio solar flux F10.7 (blue) and the vertical shear of the prevailing wind at 84 km (red) in the winter (5 months mean from November to March), whereas the total amplitudes at the four different altitudes between the altitudes of 78 km and 96 km are presented in the lower part. The interannual variations in the solar cycle (F10.7) and instability (wind shear) seem unrelated to each other (the correlations between them are 0.22 in winter and −0.03 in summer, as shown in the upper panel of Figure 12). The Q16DW amplitudes exhibit qualitatively similar interannual variability at each altitude associated with a major burst in the 2018–2019 winter. The correlation between the amplitude and the F10.7 index is weak and insignificant. At 84 km altitude, the correlation of the seasonal mean total amplitudes with wind shear is −0.72, whereas the correlation at the other altitudes is fairly low, ranging from −1.5 to 1.6.
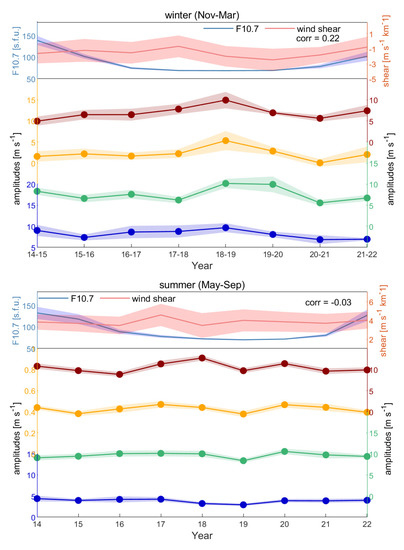
Figure 12.
Top panel: Seasonal mean Q16DW total amplitudes for winter (November–March, top panel) for different altitudes in blue (78 km), green (84 km), orange (90 km), and red (96 km) lines and dots. The shadings denote the standard deviation of each season. The light blue line and shading indicate the seasonal mean of the F10.7 index (sfu) and their standard deviations, while the light red line and shading indicate the seasonal mean of zonal wind shear at 84 km and the standard deviation (m s−1). Bottom panel: the same as the top panel except for summer (May–September).
In the summer (bottom panel of Figure 12), the amplitudes are not always as homogeneous among different altitudes, except for the minimum at all altitudes during the summer of 2019. The correlation with wind shear is also insignificant at all altitudes, with correlations ranging from −0.2 to 0.2.
Since the time span of the data is less than 11 years, it is possible that the present MT observations are not sufficient to reveal the relation between the interannual variation in Q16DW and the long-term variations in the solar F10.7 flux.
5. Conclusions
In this study, the characteristics of Q16DW are investigated based on the observation of the horizontal wind by the Mengcheng meteor radar, which has continuously monitored the MLT wind since the installation of the radar in 2014. Wave amplitudes and phases with a period ranging from 12–20 d are obtained based on a 61-day sliding window. The average amplitude of Q16DW can exceed 8 m s−1 in winter, as suggested by the nearly 9-year average of annual variation, whereas the maximum of single-wave bursts of waves may be greater than 20 m s−1. During spring, there is another lower peak in Q16DW with an amplitude of approximately 6–7 m s −1. In summer, the Q16DW amplitude reaches its minimum below 4 m s−1. The periods of the Q16DW tend to be closer to 16 d for the winter burst but are more diffusive in the spring burst.
The phase of the zonal components of the Q16DW is approximately 90° greater than the meridional counterpart, suggesting that the wave is nearly polarized, but not precisely so. The zonal and meridional amplitudes have the largest difference of approximately 8 m s−1 at 80–95 km and decrease with altitude above there. The change in the amplitude difference with height is due to the changing meridional amplitudes with height.
In the multiyear annual cycle, the zonal wind shear usually acts opposite to that of the Q16DW. In addition, a connection is suggested between the zonal vertical wind shear anomalies and the Q16DW amplitude anomalies by two epoch analyses with different definitions for the center days. The maximum of the anomalous amplitudes tends to appear simultaneously with that of the wind shear anomalies at 84 km. Moreover, in an interannual view, the correlation is not significant between the zonal wind shear and Q16DW amplitudes at most altitudes.
These results appear to suggest that atmospheric instability on a timescale of tens of days is a significant contributor to Q16DW formation. In the annual cycle, the correlation between the Q16DW amplitude and wind shear is negative, which suggests that the seasonal variation in Q16DW is not modulated by atmospheric instability. This implies that atmospheric instability has different effects on atmospheric waves at different time scales. It is worth noting that the Q16DW-wind shear relation simulated by the WACCM model is basically consistent with observations but substantially underestimates the role of atmospheric instability on Q16DW on a shorter time scale. This implies that the mechanism of atmospheric waves in this period is not fully understood. The correlation analysis alone, however, is not sufficient to conclusively demonstrate the causality between the atmospheric instability and the Q16DW. A more thorough understanding of the interaction relationship between the Q16DW during different cycles requires more observational data as well as theoretical analysis.
The relationship between Q16DW amplitudes and the F10.7 index is insignificant in either winter or summer. It seems that F10.7 and Q16DW are independent of each other in the interannual variation. However, as the MCMR timescale is less than one solar cycle (11 years), considering that the solar minimum from 2016 to 2020 occupied half of the time range analyzed, longer observations in the future are required to provide the implications and conclusions.
Author Contributions
Conceptualization, C.Y. and W.Y.; methodology, C.Y., W.Y. and D.L.; software, C.Y., W.Y. and J.W.; validation, J.W. and T.C.; formal analysis, C.Y. and D.L.; investigation, C.Y. and W.Y.; resources, W.Y.; data curation, C.Y., W.Y. and D.L.; writing—original draft preparation, C.Y.; writing—review and editing, C.Y. and W.Y.; visualization, C.Y. and D.L.; supervision, X.X and X.D.; project administration, X.X., T.L. and X.D.; funding acquisition, C.Y., W.Y., X.X., T.L. and X.D. All authors have read and agreed to the published version of the manuscript.
Funding
This research was supported by the National Natural Science Foundation of China Grants (42130203, 42188101, 42174183, 42275133, 41874180, 41831071, 41974175); the B-type Strategic Priority Program of the Chinese Academy of Sciences, Grant XDB41000000; and the preresearch project on Civil Aerospace Technologies no. D020105 funded by China’s National Space Administration; the Fundamental Research Funds for the Central Universities (grant No. YD3420002004); the Anhui Provincial Natural Science Foundation (grant No. 2008085MD113); and the Joint Open Fund of Mengcheng National Geophysical Observatory (MENGO-202209).
Data Availability Statement
The data presented in this study are available on request from the author (Y.W., yiwen@ustc.edu.cn). The data are not publicly available due to institutional restrictions.
Conflicts of Interest
The authors declare no conflict of interest.
References
- John, S.R.; Kumar, K.K. Global Normal Mode Planetary Wave Activity: A Study Using TIMED/SABER Observations from the Stratosphere to the Mesosphere-Lower Thermosphere. Clim. Dyn. 2016, 47, 3863–3881. [Google Scholar] [CrossRef]
- Gu, S.-Y.; Li, T.; Dou, X.; Wu, Q.; Mlynczak, M.G.; Russell, J.M. Observations of Quasi-Two-Day Wave by TIMED/SABER and TIMED/TIDI. J. Geophys. Res. Atmos. 2013, 118, 1624–1639. [Google Scholar] [CrossRef]
- Gu, S.-Y.; Li, T.; Dou, X.; Wang, N.-N.; Riggin, D.; Fritts, D. Long-Term Observations of the Quasi Two-Day Wave by Hawaii MF Radar. J. Geophys. Res. Space Phys. 2013, 118, 7886–7894. [Google Scholar] [CrossRef]
- Riggin, D.M.; Liu, H.-L.; Lieberman, R.S.; Roble, R.G.; Russell, J.M., III; Mertens, C.J.; Mlynczak, M.G.; Pancheva, D.; Franke, S.J.; Murayama, Y.; et al. Observations of the 5-Day Wave in the Mesosphere and Lower Thermosphere. J. Atmos. Sol.-Terr. Phys. 2006, 68, 323–339. [Google Scholar] [CrossRef]
- Gu, S.; Liu, H.; Li, T.; Dou, X.; Wu, Q.; Russell, J.M. Observation of the Neutral-ion Coupling through 6 Day Planetary Wave. J. Geophys. Res. Space Phys. 2014, 119, 10376–10383. [Google Scholar] [CrossRef]
- Gu, S.-Y.; Ruan, H.; Yang, C.-Y.; Gan, Q.; Dou, X.; Wang, N. The Morphology of the 6-Day Wave in Both the Neutral Atmosphere and F Region Ionosphere Under Solar Minimum Conditions. J. Geophys. Res. Space Phys. 2018, 123, 4232–4240. [Google Scholar] [CrossRef]
- Gong, Y.; Li, C.; Ma, Z.; Zhang, S.; Zhou, Q.; Huang, C.; Huang, K.; Li, G.; Ning, B. Study of the Quasi-5-Day Wave in the MLT Region by a Meteor Radar Chain. J. Geophys. Res. Atmos. 2018, 123, 9474–9487. [Google Scholar] [CrossRef]
- Qin, Y.; Gu, S.; Dou, X.; Teng, C.; Li, H. On the Westward Quasi-8-Day Planetary Waves in the Middle Atmosphere during Arctic Sudden Stratospheric Warmings. J. Geophys. Res. Atmos. 2021, 126, e2021JD035071. [Google Scholar] [CrossRef]
- Qin, Y.; Gu, S.; Dou, X.; Teng, C.; Yang, Z. Secondary 12-Day Planetary Wave in the Mesospheric Water Vapor during the 2016/2017 Unusual Canadian Stratospheric Warming. Geophys. Res. Lett. 2022, 49, e2021GL097024. [Google Scholar] [CrossRef]
- Luo, J.; Gong, Y.; Ma, Z.; Zhang, S.; Zhou, Q.; Huang, C.; Huang, K.; Yu, Y.; Li, G. Study of the Quasi 10-Day Waves in the MLT Region during the 2018 February SSW by a Meteor Radar Chain. J. Geophys. Res. Space Phys. 2021, 126, e2020JA028367. [Google Scholar] [CrossRef]
- Mitchell, N.J.; Middleton, H.R.; Beard, A.G.; Williams, P.J.S.; Muller, H.G. The 16-Day Planetary Wave in the Mesosphere and Lower Thermosphere. Ann. Geophys. 1999, 17, 1447–1456. [Google Scholar] [CrossRef]
- Gong, Y.; Wang, H.; Ma, Z.; Zhang, S.; Zhou, Q.; Huang, C.; Huang, K. A Statistical Analysis of the Propagating Quasi 16-Day Waves at High Latitudes and Their Response to Sudden Stratospheric Warmings from 2005 to 2018. J. Geophys. Res. Atmos. 2019, 124, 12617–12630. [Google Scholar] [CrossRef]
- Gong, Y.; Ma, Z.; Li, C.; Lv, X.; Zhang, S.; Zhou, Q.; Huang, C.; Huang, K.; Yu, Y.; Li, G.; et al. Characteristics of the Quasi-16-Day Wave in the Mesosphere and Lower Thermosphere Region as Revealed by Meteor Radar, Aura Satellite, and MERRA2 Reanalysis Data from 2008 to 2017. Earth Planet. Phys. 2020, 4, 274–284. [Google Scholar] [CrossRef]
- Gu, S.-Y.; Liu, H.-L.; Dou, X.; Li, T. Influence of the Sudden Stratospheric Warming on Quasi-2-Day Waves. Atmos. Chem. Phys. 2016, 16, 4885–4896. [Google Scholar] [CrossRef]
- Charney, J.G.; Drazin, P.G. Propagation of Planetary-Scale Disturbances from the Lower into the Upper Atmosphere. J. Geophys. Res. 1961, 66, 83–109. [Google Scholar] [CrossRef]
- Forbes, J.M.; Hagan, M.E.; Miyahara, S.; Vial, F.; Manson, A.H.; Meek, C.E.; Portnyagin, Y.I. Quasi 16-Day Oscillation in the Mesosphere and Lower Thermosphere. J. Geophys. Res. 1995, 100, 9149. [Google Scholar] [CrossRef]
- Kingsley, S.P.; Muller, H.G.; Nelson, L.; Scholefield, A. Meteor Winds over Sheffield (53°N, 2°W). J. Atmos. Terr. Phys. 1978, 40, 917–922. [Google Scholar] [CrossRef]
- Luo, Y.; Manson, A.H.; Meek, C.E.; Meyer, C.K.; Forbes, J.M. The Quasi 16-Day Oscillations in the Mesosphere and Lower Thermosphere at Saskatoon (52°N, 107°W), 1980–1996. J. Geophys. Res. Atmos. 2000, 105, 2125–2138. [Google Scholar] [CrossRef]
- Takahashi, H.; Shiokawa, K.; Egito, F.; Murayama, Y.; Kawamura, S.; Wrasse, C.M. Planetary Wave Induced Wind and Airglow Oscillations in the Middle Latitude MLT Region. J. Atmos. Sol.-Terr. Phys. 2013, 98, 97–104. [Google Scholar] [CrossRef]
- Guharay, A.; Batista, P.P.; Clemesha, B.R.; Buriti, R.A.; Schuch, N.J. Latitudinal Variability of the Quasi-16-Day Wave in the Middle Atmosphere over Brazilian Stations. Ann. Geophys. 2016, 34, 411–419. [Google Scholar] [CrossRef]
- Lima, L.M.; Batista, P.P.; Clemesha, B.R.; Takahashi, H. 16-Day Wave Observed in the Meteor Winds at Low Latitudes in the Southern Hemisphere. Adv. Space Res. 2006, 38, 2615–2620. [Google Scholar] [CrossRef]
- Araújo, L.R.; Lima, L.M.; Batista, P.P.; Clemesha, B.R.; Takahashi, H. Planetary Wave Seasonality from Meteor Wind Measurements at 7.4° S and 22.7° S. Ann. Geophys. 2014, 32, 519–531. [Google Scholar] [CrossRef]
- Holdsworth, D.A.; Reid, I.M.; Cervera, M.A. Buckland Park all-sky interferometric meteor radar. Radio Sci. 2004, 39, 1–12. [Google Scholar] [CrossRef]
- Reid, I.M.; McIntosh, D.L.; Murphy, D.J.; Vincent, R.A. Mesospheric radar wind comparisons at high and middle southern latitudes. Earth Planets Space. 2018, 70, 84. [Google Scholar] [CrossRef]
- Zeng, J.; Yi, W.; Xue, X.; Reid, I.; Hao, X.; Li, N.; Chen, J.; Chen, T.; Dou, X. Comparison between the Mesospheric Winds Observed by Two Collocated Meteor Radars at Low Latitudes. Remote Sens. 2022, 14, 2354. [Google Scholar] [CrossRef]
- Marsh, D.R.; Mills, M.J.; Kinnison, D.E.; Lamarque, J.-F.; Calvo, N.; Polvani, L.M. Climate Change from 1850 to 2005 Simulated in CESM1(WACCM). J. Clim. 2013, 26, 7372–7391. [Google Scholar] [CrossRef]
- Kunz, A.; Pan, L.L.; Konopka, P.; Kinnison, D.E.; Tilmes, S. Chemical and Dynamical Discontinuity at the Extratropical Tropopause Based on START08 and WACCM Analyses. J. Geophys. Res. Atmos. 2011, 116. [Google Scholar] [CrossRef]
- Stober, G.; Jacobi, C.; Fröhlich, K.; Oberheide, J. Meteor Radar Temperatures over Collm (51.3°N, 13°E). Adv. Space Res. 2008, 42, 1253–1258. [Google Scholar] [CrossRef]
- Hocking, W.K.; Fuller, B.; Vandepeer, B. Real-Time Determination of Meteor-Related Parameters Utilizing Modern Digital Technology. J. Atmos. Sol.-Terr. Phys. 2001, 63, 155–169. [Google Scholar] [CrossRef]
- Lomb, N.R. Least-Squares Frequency Analysis of Unequally Spaced Data. Astrophys. Space Sci. 1976, 39, 447–462. [Google Scholar] [CrossRef]
- Fougere, P.F. On the Accuracy of Spectrum Analysis of Red Noise Processes Using Maximum Entropy and Periodogram Methods: Simulation Studies and Application to Geophysical Data. J. Geophys. Res. 1985, 90, 4355. [Google Scholar] [CrossRef]
- Espy, P.J.; Stegman, J.; Witt, G. Interannual Variations of the Quasi-16-Day Oscillation in the Polar Summer Mesospheric Temperature. J. Geophys. Res. Atmos. 1997, 102, 1983–1990. [Google Scholar] [CrossRef]
- Day, K.A.; Hibbins, R.E.; Mitchell, N.J. Aura MLS Observations of the Westward-Propagating s = 1, 16-Day Planetary Wave in the Stratosphere, Mesosphere and Lower Thermosphere. Atmos. Chem. Phys. 2011, 11, 4149–4161. [Google Scholar] [CrossRef]
- Yi, W.; Xue, X.; Reid, I.M.; Murphy, D.J.; Hall, C.M.; Tsutsumi, M.; Ning, B.; Li, G.; Yang, G.; Li, N.; et al. Climatology of Interhemispheric Mesopause Temperatures Using the High-Latitude and Middle-Latitude Meteor Radars. J. Geophys. Res. Atmos. 2021, 126, e2020JD034301. [Google Scholar] [CrossRef]
- Yamazaki, Y.; Matthias, V. Large-Amplitude Quasi-10-Day Waves in the Middle Atmosphere During Final Warmings. J. Geophys. Res. Atmos. 2019, 124, 9874–9892. [Google Scholar] [CrossRef]
- Lilienthal, F.; Jacobi, C. Meteor Radar Quasi 2-Day Wave Observations over 10 Years at Collm (51.3°N, 13.0°E). Atmos. Chem. Phys. 2015, 15, 9917–9927. [Google Scholar] [CrossRef]
- Jacobi, C.; Schminder, R.; Kürschner, D. Planetary Wave Activity Obtained from Long-Period (2–18 Days) Variations of Mesopause Region Winds over Central Europe (52°N, 15°E). J. Atmos. Sol.-Terr. Phys. 1998, 60, 81–93. [Google Scholar] [CrossRef]
- Fagundes, P.R.; Pillat, V.G.; Bolzan, M.J.A.; Sahai, Y.; Becker-Guedes, F.; Abalde, J.R.; Aranha, S.L.; Bittencourt, J.A. Observations of F Layer Electron Density Profiles Modulated by Planetary Wave Type Oscillations in the Equatorial Ionospheric Anomaly Region. J. Geophys. Res. 2005, 110, A12302. [Google Scholar] [CrossRef]
- Gan, Q.; Eastes, R.W.; Burns, A.G.; Wang, W.; Qian, L.; Solomon, S.C.; Codrescu, M.V.; McClintock, W.E. New Observations of Large-Scale Waves Coupling with the Ionosphere Made by the GOLD Mission: Quasi-16-Day Wave Signatures in the F-Region OI 135.6-nm Nightglow During Sudden Stratospheric Warmings. J. Geophys. Res. Space Phys. 2020, 125, e2020JA027880. [Google Scholar] [CrossRef]
- Liu, J.; Zhang, D.; Hao, Y.; Xiao, Z. Multi-instrumental Observations of the Quasi-16-Day Variations from the Lower Thermosphere to the Topside Ionosphere in the Low-Latitude Eastern Asian Sector during the 2017 Sudden Stratospheric Warming Event. J. Geophys. Res. Space Phys. 2020, 125, e2019JA027505. [Google Scholar] [CrossRef]


Disclaimer/Publisher’s Note: The statements, opinions and data contained in all publications are solely those of the individual author(s) and contributor(s) and not of MDPI and/or the editor(s). MDPI and/or the editor(s) disclaim responsibility for any injury to people or property resulting from any ideas, methods, instructions or products referred to in the content. |
© 2023 by the authors. Licensee MDPI, Basel, Switzerland. This article is an open access article distributed under the terms and conditions of the Creative Commons Attribution (CC BY) license (https://creativecommons.org/licenses/by/4.0/).