Article

Integrated HBIM-GIS Models for Multi-Scale Seismic Vulnerability Assessment of Historical Buildings

1
LabG4CH-Laboratory of Geomatics for Cultural Heritage, Department of Architecture and Design, Politecnico di Torino, Viale Mattioli, 39, 10125 Torino, Italy
2
FULL-Future Urban Legacy Lab Interdepartmental Centre, Politecnico di Tornio @OGR Tech-Corso Castelfidardo, 22, 10128 Torino, Italy
*
Author to whom correspondence should be addressed.
Remote Sens. 2023, 15(3), 833; https://doi.org/10.3390/rs15030833
Submission received: 24 December 2022 / Revised: 21 January 2023 / Accepted: 28 January 2023 / Published: 2 February 2023

Abstract

:
The complexity of historical urban centres progressively needs a strategic improvement in methods and the scale of knowledge concerning the vulnerability aspect of seismic risk. A geographical multi-scale point of view is increasingly preferred in the scientific literature and in Italian regulation policies, that considers systemic behaviors of damage and vulnerability assessment from an urban perspective according to the scale of the data, rather than single building damage analysis. In this sense, a geospatial data sciences approach can contribute towards generating, integrating, and making virtuous relations between urban databases and emergency-related data, in order to constitute a multi-scale 3D database supporting strategies for conservation and risk assessment scenarios. The proposed approach developed a vulnerability-oriented GIS/HBIM integration in an urban 3D geodatabase, based on multi-scale data derived from urban cartography and emergency mapping 3D data. Integrated geometric and semantic information related to historical masonry buildings (specifically the churches) and structural data about architectural elements and damage were integrated in the approach. This contribution aimed to answer the research question supporting levels of knowledge required by directives and vulnerability assessment studies, both about the generative workflow phase, the role of HBIM models in GIS environments and toward user-oriented webGIS solutions for sharing and public use fruition, exploiting the database for expert operators involved in heritage preservation.

1. Introduction

Approaching historical urban centre studies from a geographical perspective firstly means sustaining the multi-scalar and multi-layered nature typical of heritage aggregates and their evolution. This may also require being able to manage and integrate, within databases, the levels of knowledge and information deriving from the points of view of scientific domains operating in the territory and concerning the monitoring of urban centres. Finally, it means being aware of the vulnerability of urban settings, in particular when dealing with seismic risk, and developing advanced approaches supporting heritage at risk at appropriate scales of analysis.
In this framework, if we consider the peculiarity of the Italian territory, and even on supranational scale, it is largely subject to seismicity and was recently affected by destructive seismic sequences that have irreversibly compromised our heritage [1]. The traces of these events are still visible in residual urban aggregates, and even in a multi-temporal documentation. Archived data and information about damage are the source of validation of seismic knowledge and vulnerability analyses, which are based on observation and modeling of real seismic consequences and damage to masonry buildings.
For these reasons, with regard to urban centres and their complex historical buildings, 3D informative models supporting actions on seismic risk assessment can provide an interesting experimentation playground in the documentation methods for damage assessments related to structural behavior. Geospatial approaches can collect multi-scale information on the geographical scene and allow for the updating of existing knowledge based on accurate and highly detailed digital documentation for conservation purposes in the framework of heritage protection, to be handed down to generations to come.
In the overall notion of emergency response, the seismic risk assessment scenarios related to the occurrence of earthquake events and the associated seismic vulnerability problem are addressed by the scientific community through different investigation strategies and data analysis tools.
In the literature regarding historical urban centres and historical masonries, some existing approaches at different scales [2] are normally distinguished by the level of detail, the scale of the evaluation, and the employed data.
Both building, aggregates, and urban scale analysis are generally based on damage observation, indices, and degree calculations, in order to estimate the levels of vulnerability and risk [3,4]. In fact, these studies are largely based on indirect methods, as a posteriori analyses of data observation before and after seismic events, i.e., statistical studies concerning the empirical data of post-earthquake damages are collected in order to retrieve useful information to estimate the reliability of methods, forecast expected damage, and risk mitigation [5].
Usually, digital and spatial data are employed, such as emergency cartography, in-situ captured image datasets, direct measures via in-situ inspections, datasheet reports, and more recently, remote sensing digital models based on imaging and ranging sensors as UAV-based photogrammetric models [6,7,8]. It is evident that the possibility of implementing a collection of 3D information related to damage and the seismic behavior of specific building categories in a geographical scale schema broadens the point of view for a systemic reading of the phenomenon, not only on the building or at the micro-urban scale but on a geographical-territorial one too [9].
With regard to the datasets of images captured in situ, more than one scientific community has considered the use of the Mapillary platform to be particularly interesting (https://www.mapillary.com/, accessed on 27 January 2023). The platform was reated for the collection of georeferenced images in crowd-sourced mode, and was used in numerous urban centres affected by the 2016–2017 earthquake in central Italy, to demonstrate that the use of terrestrial data together with satellite images confirmed the possibility of increasing the overall accuracy in attributing the degree of damage to buildings [10]. Some examples present the use of 3D geographic information system (GIS) models for the management of emergency response from the city at the building scale [3], and for the analysis of seismic vulnerability at the urban scale [11,12].
Moreover, the challenge for geomatics research is to make these scales coexist in a spatial information infrastructure (SII) based on geographical scale 3DGIS. Here, the building-scale urban heritage 3D models can be integrated, visualized, and stored as boundary representations (B-rep) according to the complexity of the surfaces generation, with parametric or non-parametric approaches (planes recognition, polygon extrusion, profile interpolation, etc., embedded in heritage building information models, HBIM [13]). In this case, the HBIM-GIS paradigms integration and usability would be discussed and validated in this research in the framework of damage documentation contributing to vulnerability assessment of urban centres.
In terms of research priorities for 3D data sciences within multi-community studies such as those focused on built heritage assets, integrating and harmonizing the geometric and semantic components of 3D information for historical buildings in SII is increasingly necessary. The INSPIRE (Infrastructure for spatial information in Europe) directive as worked in this direction for a long time [14]. Actually, it is of high interest nowadays in many application fields related to urban space and built heritage knowledge that require the representation and exchange of 3D metric data and digital models within geo-information platforms [15,16].
Particularly for 3D documentation generation and provision to the community functions and for public bodies’ actions, it is extremely important that geospatial approaches develop shareable integrated and multi-scale solutions for creating and updating geodatabases with standards, domain languages, and interoperable formats [17,18]. 3D urban cadasters, renewable energy and consumption models, traffic monitoring, real estate strategies, heritage conservations and specific risk assessment are just a few examples in the literature of how tailored 3D models and parametric approaches are increasingly crucial and demonstrate that it is necessary to extend the research for new paradigms of digital urban databases [19,20,21].
In fact, different multidisciplinary-oriented studies typically benefit from the use of 3D city models developed to support geographic scale analyses. These approaches, however, demonstrate their tangible innovation if the 3D database goes beyond the unique scope of visualization and spatial representation, despite the predominance of this purpose in many examples of 3D city models, due to their usability in many different fields of investigation [22].
However, the role of 3D geodatabases becomes crucial when the third dimension (Z) proves to be a substantial variable of the data analysis, and can determine the effective correlation of information from a geographical point of view from different sources and spatial-temporal resolutions, oriented to the direct fruition of expert users involved in the policies processes.
In other terms, the contribution of 3D geodatabases is decisive when their implementation, thanks to cross-disciplinary research, contributes to the interpretation of phenomena in a spatial dimension that is otherwise not equally determinable and successful.
In order to concretely contribute to the management of CH at risk, the information models of these assets—highly detailed and rich in information—must be perfectly accessible and usable, since one of the recurring problems concerns precisely their level of sharing. One of the purposes of this research is to provide innovative methods and tools for the management of the vulnerability of urban settings, in particular when dealing with the seismic risk of historic churches. One outcome is also the proposal of a digital AMS (asset management system) platform based on an integration between BIM and GIS, that is capable of providing real-time visualization of certain assets in an interactive and searchable 3D environment.

1.1. Research Motivation

This contribution attempts to answer the research question about the generation phase workflow of a high-resolution multi-dimensional model supporting the seismic vulnerability assessment of historical masonry buildings, in particular the case of churches, in a reasonable amount of time in the case of critical risk contexts. The role of GIS models supporting levels of knowledge required by directives and vulnerability assessment studies was explored.
Both the urban and architectural scales were considered, starting from the generation of remote sensing multi-scale models from point clouds obtained by UAV (unmanned aerial vehicle) photogrammetry and TLS (terrestrial laser scanning) 3D surveys. The experimentation was developed through the case study of the centre of Italy damaged by the 2016–2017 earthquake. The research conducted, and the relative data collected in different survey missions, were considered for the cities of Norcia, Campi di Norcia and Tolentino [12,23,24]. In addition to urban-scale 3D models, large-scale models of buildings of interest such as the church of Sant’Andrea in Campi di Norcia were considered.
This research was, therefore, an occasion to identify and deepen a complete workflow for the generation of the 3DGIS informative model, from 3D multi-sensor clouds to structured models with embedded emergency-related data (e.g., AEDeS reports, 3D models, damage mapping, inspections) and damage mechanism numerical modeling and procedural vulnerability assessment. The research also enriched the GIS-HBIM-implemented model with a webGIS interface for the interpretation, on a geographical-scale perspective, of vulnerability and risk for churches. According to the LoD (level of detail) and LOD (level of development), the work structured multi-scale models and related information to a damage mechanism for the vulnerability index (IV) according to Italian law.

1.2. Urban Centres and Seismic Damage Assesment: A Reflection upon Churches Heritage in the Italian Law

There is a serious relationship between the historical building heritage of the Italian territory and its seismic history. This is increasingly under the attention of prevention policies as well as the knowledge and conservation strategies from a European perspective [25]. In fact, the European Seismic Risk Model (ESRM20) [26] is nowadays the most updated model. This is available through a web-based platform developed within the web services of Open GeoSpatial Consortium (OGC) and made available for consulting. Web services following Open GeoSpatial Consortium (OGC) standards (https://maps.eu-risk.eucentre.it/map/european-exposure-gridded-data, accessed on 27 January 2023). In this perspective, the available vulnerability models are collected and integrated into the ESRM20 with a spatial and temporal resolution in relation to design intervention using country-specific geographical mapping.
The implementation of 3D geospatial models and infrastructures for seismic prevention and retrofit strategies becomes crucial also at greater scales for historical centres. For this reason, the analysis methods involve a multi-scale organization and connection of knowledge, from the building scale to the territorial scale, as introduced for national and international directives’ recommendations. This knowledge should regard aspects of the weaknesses in the urban environment that are susceptible to damage, to define vulnerability and the risk to which existing heritage assets are exposed [5]. For this reason, it is necessary to consider the behavior of a single object as a part of urban aggregates with different structural performances. Several methods are available, and these normally consider the seismic vulnerability of urban structural aggregates (SAs) depending on the configuration and performance of specific structural units (SUs) constituting SAs, so that different analyses pertain to SUs and SAs. Thus, conducting the multi-level vulnerability assessment of masonry buildings and aggregates is crucial, and it is commonly based on in-situ evaluation and statistical methods able to provide preliminary consideration of weaknesses, for determining the priority of intervention and planning retrofit interventions [5]. The advantages of this type of approach are remarkable because the point of view on the structural behavior of the single building is now extended to the aggregate. The analysis is thus more accurate as well as more realistic. However, these approaches rarely make use of 3D geographic information system databases to handle this type of analysis.
The vulnerability index (IV) is one of these methods and is typically used for the rapid analysis of seismic risk at the regional/urban scale. The index defines the susceptibility of a building to suffer damage or collapse, and it is influenced by typology, design solution, constructive techniques, material, and maintenance. The vulnerability assessment is conducted through various approaches and with simplified models with different levels of complexity and rapidity [27]. Among the existing, GNDT approaches and European Macroseismic Scale (EMS) approaches are used in many applications [28].
The technical analysis recognizes the crucial role of starting data, for their accuracy and interpretation reducing the uncertainty of the survey, and of the level of information that can be extracted from such data, which can influence the results of estimation.
This is the basis for the conception and validation of analysis of seismic vulnerability on an urban scale, as recently investigated in the literature precisely for the case of the 2016 central Italy earthquake and precisely for Campi di Norcia. Ref. [29] proposed a comparison between AeDES (The form AeDES—“Agibilità e Danno nell’Emergenza Sismica”, which stands for “Usability and Damage in the Seismic Emergency”—is a form for the expeditious detection of damage that is fine-tuned and usually used by the Italian civil protection department) and information extraction and assessments from omnidirectional camera (ODC) imagery for low- to medium-damage grades (DG) based on the 2016 Norcia events. In neither of the two cases, however, is a 3D digital model used as the basis of the measurement operations.
In [4] the damage of the ancient masonry aggregates documented in Campi Alto were proposed as a paradigmatic case study for a comparison of vulnerability assessment methods (IV index) based on different strategies and their accuracy, in order to determine the reliability of the methods.
A typology of historical buildings that is particularly widespread and exposed to seismic risk is represented by masonry churches. The reasons can be found in the nature of the building from an architectural and construction point of view: in the proportions of the elements of this type of artifact and in the necessary but often unsatisfactory commitment to their maintenance. The presence of large halls without internal walls, the absence of intermediate floors, the slenderness of the walls and especially of the bell towers that are usually very high, the presence of pushing elements such as vaults and arches, the degradation resulting from limited use and poor maintenance of some parts are characterizing weakness points in these architectures.
Recent national funding initiatives as the PNRR plan have given new life to religious heritage and have pushed the interest in church buildings, as defined by the publication: “an epochal intervention for the revival of culture in our country”. In fact, the 07/06/2022 decree of the Ministry of Culture allocates extraordinary funds for the fulfillment of conservation and restoration projects devoted to church buildings in the national territory (PNRR-M1C3, DM 145-07/06/2022) (DM n. 455 del 7 giugno 2022, ministero della Cultura, misura M1C3, Cultura 4.0, l’Investimento 2.4.–Sicurezza sismica nei luoghi di culto, restauro del patrimonio Fec e siti di ricovero per le opere d’arte–Recovery Art. https://media.beniculturali.it/mibac/files/boards/be78e33bc8ca0c99bff70aa174035096/Bottoni/Recovery/PDF/inv2.4/DD/Decreto%20n.%20455%2007.06.2022_investimento%202.4.%20assegnazione%20risorse-signed.pdf, accessed on 27 January 2023). Churches and their seismic vulnerability have been under observation for a long time, since they have shown recurring behaviors, linked to local damage and collapse mechanisms typical for the different architectural parts [30,31,32].
Since churches are such a type of serious object, the directive of Prime Minister’s Office (PCM) directive of 9/02/2011 (DPCM 9 febbraio 2011, Valutazione e riduzione del rischio sismico del patrimonio culturale con riferimento alle Norme tecniche per le costruzioni di cui al D.M. 14/01/2008, 2.1, “Strumenti per la valutazione della sicurezza sismica a scala territoriale”. https://www.gazzettaufficiale.it/eli/id/2011/02/26/11A02374/sg, accessed on 27 January 2023), which is referred to in this issue, outlines the steps that lead to the implementation of a seismic prevention plan. It outlines and also clarifies the limits and ways for the applicability of this program of seismic prevention based on knowledge phases (LC), from rapid to analytic ones. During the directive method application, a series of module and analytical steps defines the content of the phases and thus the progressive knowledge implementation. However, the approach does not envisage the use of a 3D information system. Regarding the use of directive modules (Table 1), the data collection is divided into autonomous and complementary datasheets, representing different levels of knowledge. The compilation of various directive module forms constitutes the cognitive project to be implemented in relation to the objectives of the survey, the territorial contexts, and the availability of resources. For example, A and B concern the identification of the asset, C and D for the elements of the structure.
Specifically for the seismic Safety Evaluation, in relation to different LC, three Level of Evaluation (LV), as three levels of increasing completeness, have been identified, and for each one, specific documentation methods are required, and can be integrated, as proposed in this research. They are respectively applicable (Table 2): LV1, for seismic safety assessments to be carried out on a territorial scale on all protected cultural heritage (CH); LV2, for the evaluations to be adopted in the presence of local interventions on limited areas of the building; LV3, for the project of interventions or in any case is required an accurate evaluation of the seismic safety.
In LV1, the i v vulnerability index is obtained through an appropriate combination of scores assigned to the various elements of vulnerability v k i and anti-seismic protection v k p of the parts of the building. The summation (1) takes into consideration all 28 damage mechanisms identified for churches.
i v = 1 6 Σ K = 1 28 ρ k ( v k i v k p ) Σ K = 1 28 ρ k + 1 2
From the point of view of data models supporting LV analysis, the LV1 level allows the evaluation of the seismic action at the SLV (“Stato Limite di salvaguardia della Vita”—“Life-Saving Limit State”) through simplified methods, based on a limited number of geometric and mechanical parameters or using qualitative data. For the most accurate assessments, on individual buildings, the tools to be adopted are those defined for the planning of improvement interventions, according to levels LV2 and LV3.
This research plan was based on approaching an important phase of the level of knowledge, schematic but critically well-founded, to be suitable for the church system in a territorial perspective subjected to seismic hazards. In this regard, the directive requires the evaluation of a safety assessment of historical masonry buildings, with time and with solutions appropriate to the large number of assets distributed on our territory. Moreover, one of the tasks of the PCM directive is to provide a simplified model for the estimation of the vulnerability index of historical masonry churches based on the principle that churches are composed of macro-elements, architectural portions that present an autonomous behavior with regard to the structure.
In this framework, the digital documentation approach based on 3D geosciences proposed in this research provides a new and crucial point of view in the construction of knowledge about the safety level of churches, and particularly for their geographic and urban contexts. In this research, a comprehensive documentation method based on 3D geodatabase was proposed in order to answer directive requests in terms of the multi-scale level of knowledge and in relation to directive modules and levels of evaluation steps. As a result, the availability of rapid mapping and low-cost 3D surveys and their applicability for the identification and sizing of macro-elements is an interesting area of comparison that is both methodological and holistic. The interest in this strategy results in the potential if we consider the analysis of the vulnerability, related to the single structure only, in connection to its territory and other protected buildings, using geospatial science methods. This LC approach of a rapid assessment and/or analytical evaluation enables the establishment of a solid geographic multi-scale database to structure the planning of future intervention projects.

1.3. User-Oriented Urban 3D Geodatabases

A multitude of studies have focused on the integration of geographical multi-scale databases with 3D models of architectural heritage obtained with a BIM approach, contributing to the GIS-HBIM paradigms integration debate [33].
The BIM (building information modelling) approach and the HBIM (Heritage BIM), which refers to built and cultural heritage, and the generation from cloud-based 3D survey techniques (scan-to-BIM approach), owe their most interesting aspects to object-based modelling [34]. The literature has focused a lot on the geometric discretization methods of the built heritage and the quality of the models and their reliability in representing the hierarchy and morphological complexity of many components [35].
On the other hand, many reflections on the semantic part have been raised, starting from the considerations on methods and formalisms for integrating heterogeneous information [36]. This investigation on geospatial data has continued up to the most recent proposals to manage vocabularies, libraries of objects, and semantics, in the direction of mutual enrichment between BIM modelling and GIS [37].
The issues about data models, structuring and format interoperability are certainly crucial tasks in the framework of urban scale 3D database generation, based on the use of both existing and newly generated geospatial data. On the other hand, reflections on the conceptual framework in geographic knowledge have been proposed to enhance differences in classifying real features (ontologies), multiscale issues, the mobility of objects, the many-to-many relationship of place names (gazetteers), and so on [38].
Simultaneously, the terminology is systematized by designing a taxonomy of requirements to define the elements of the inventory of 3D city model applications (semantic content, level of detail measured through LoDs—Levels of detail, spatial coherence, etc.). In the framework of geographic information standards, it is known that IFC (Industry Foundation Classes) (https://www.buildingsmart.org/standards/bsi-standards/industry-foundation-classes/, accessed on 27 January 2023) and CityGML-City Geography Markup Language (http://www.opengeospatial.org/standards/citygml, accessed on 27 January 2023), published by the Open Geospatial Consortium (OGC) (OGC: Open GIS City Geography Markup Language (CityGML) Encoding Standard v.2.0. Open Geospatial Consortium, 2012) are the two most prominent data models to represent digital city objects [39].
Ref. [40] performed a careful comparison of the object classes of the IFC standards and recognized that among the 900 available classes, at least 60–70 are characterized by a semantic representation very similar to the CityGML standard. They tried to integrate the two standards to obtain city information modelling (CIM). In this direction, Ref. [41] proposed an HBIM-GIS integration strategy based on interoperability tests foreseeing the IFC-CityGML in the case study of the San Lorenzo Church in Norcia (Italy).
In terms of the integration of standards, the issues to be solved are complex. For this reason, shared studies have been launched on the conversion of BIM models into 3D city models, taking advantage of OGC CityGML and buildingSMART IFC as reference standards [17]. Other authors tested the goal of integrating BIM models with ontological knowledge [42]. A starting proposal of an ontological scheme supporting semantic conceptualization of historical built heritage to generate parametric structured models from point clouds was applied to Norcia in [43]. The classes of objects of data models and the classification of the damages ascertained after the 2016 earthquake were among the semantic information represented.

2. Material and Methods
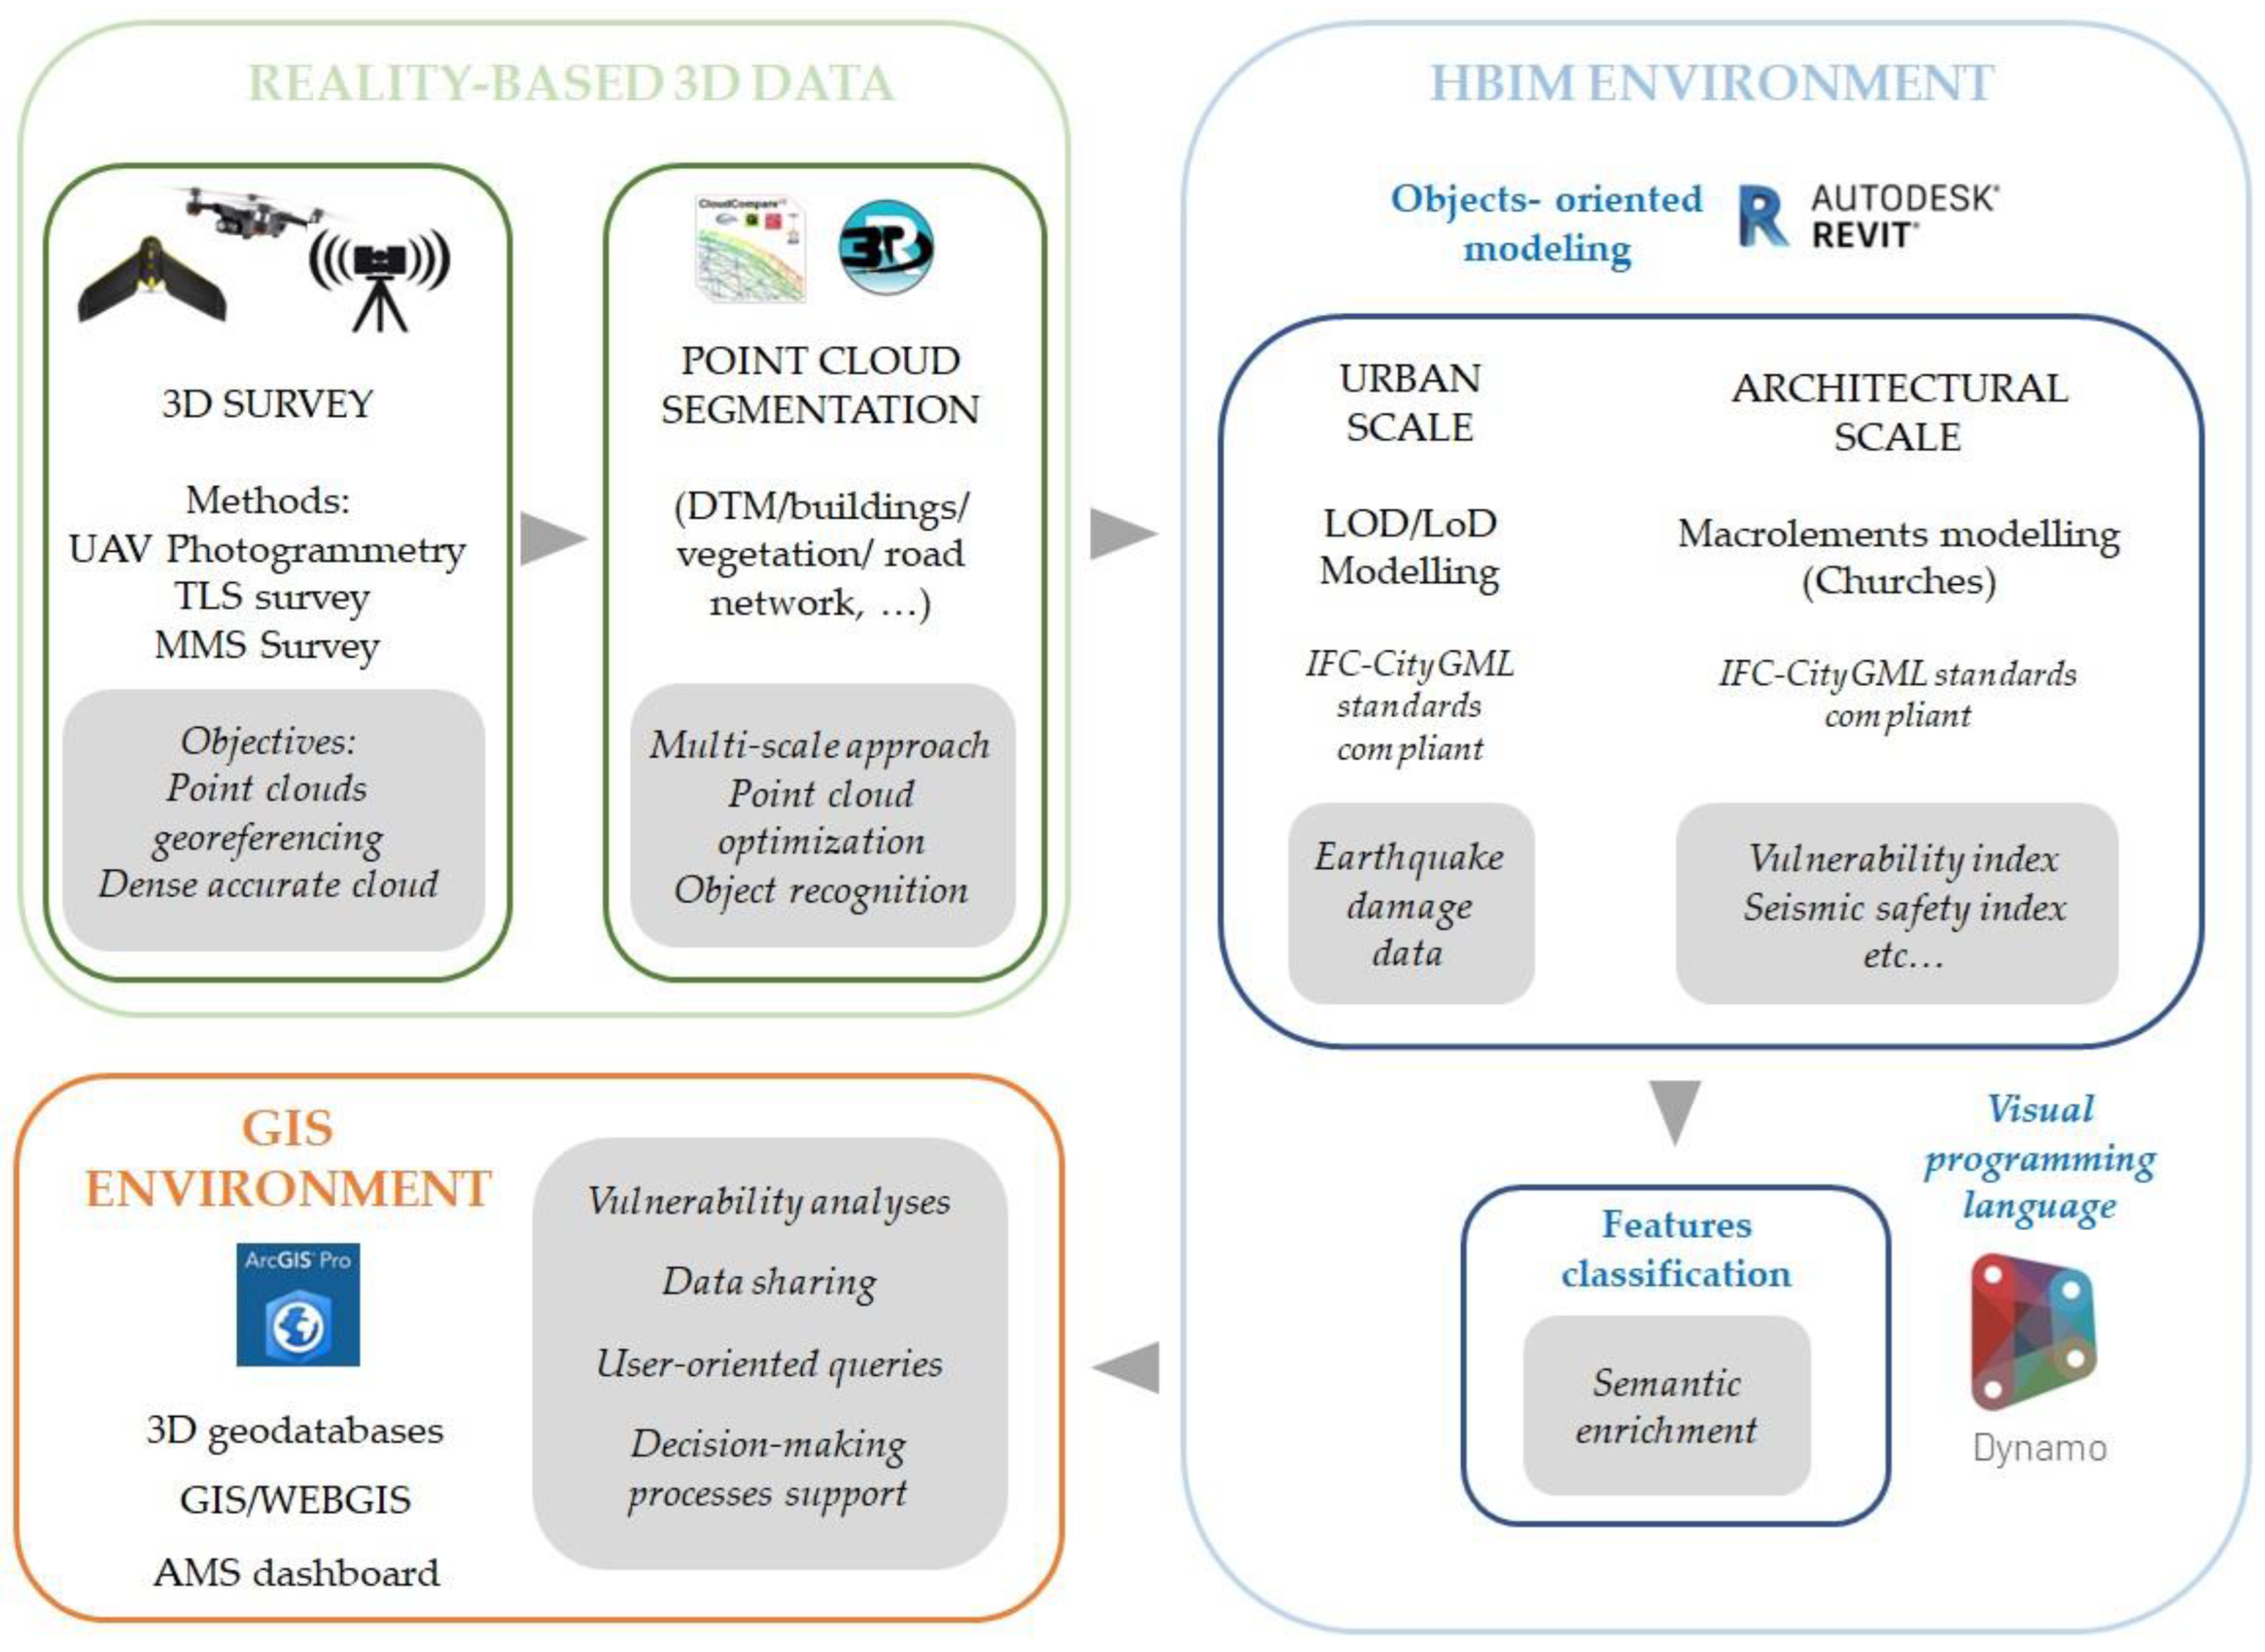
2.1. The Workflow

Based on the huge knowledge developed in the framework of 3D geodatabases for the generation of 3D city models for different applications, the proposed approach of the present research goes on to develop some tools to originate the 3DGIS environment where object-oriented HBIM models can be integrated, visualized, queried and systematically analyzed based on the interoperability of semantic information implemented into it.
The main objective of this study was to create a multiscale 3D modelling of urban areas including important examples of built heritage such as churches, to obtain the possibility of comparing recurrent seismic vulnerability behaviors within the historical architecture that characterized the past buildings such as churches. The ability to compare behaviors and vulnerability indexes, based on macro-elements according to the directive referred to in the previous paragraph, is our focus in a geographical perspective.
The workflow we propose (Figure 1) on the one hand aims to generate an urban model that represents the situation of the post-event seismic damage to apply the indirect methods of interpretation mentioned in the introduction. On the other hand it focuses on the churches for which the construction knowledge of their level of safety, in a reasonably short time, is considered a priority for the management of resources related to the protection of CH.
As is discussed in greater detail in the next paragraph, the urban modeling and the consequent 3D geodatabase were created in the urban center of Norcia and Campi of Norcia, while the historical masonry churches were represented primarily by Sant’Andrea di Campi di Norcia and a short series of other churches in Norcia and in the territory hit by the disastrous events of the 2016-17 earthquake (Section 2.3).
First, the starting point was the use of rapid 3D survey technologies (Section 2), which enable the collection of information on the architectural structures and on the constructive and spatial relationships that characterize their macroelements, as well as the characteristics of the damage suffered, to assess vulnerability. The employed techniques ranged from aerial and terrestrial photogrammetry or scanning (unmanned aerial vehicle, UAV photogrammetry, terrestrial laser scanning, close-range photogrammetry), the use of MMS (mobile mapping system) selected from hand-held or backpack, trolley, cars or unmanned ground vehicles (UGV), which allowed for easy portability, rapidity, and effective use even in precarious and emergency conditions.
An important step of the workflow is that of cloud segmentation and optimization. The segmentation objective aims at the automatic or semi-automatic classification of the terrain (obtaining DTM), the buildings, the vegetation, and possibly of the roads, which is of crucial importance for converting clouds into structured models. The literature in this sector is vast and approaches based on families of region-growing algorithms or based on RANSAC approaches are available, with the contribution of machine or deep learning support for the automation of the recognition and classification of surfaces. Some experiments on the architectural structures covered by this paper have already been reported and will not be addressed in this paper [23,41].
A great deal of attention was instead devoted here to urban modeling and to the scale of the building (Section 3), to demonstrate the different levels of detail required for the geometry of the objects of the spatial database and the different granularity of the related information archive. In general, structured modeling is entrusted to the BIM environment, using typical strategies of the HBIM approach both at the urban and building scales. On the urban scale, modeling is regulated according to the different LoDs, found in the next paragraph (Section 2.2), reflecting on the comparison between the elements of the classification in the two standards IFC and CityGML and the PCM Italian directive.
Within this workflow (Figure 1), the visual programming developed using the open-source software Dynamo for Revit provided a diagram that supported assigning encodings to buildings models respecting the relationship scheme established in the BIM database. This part is specifically developed in [23]. In this way, the semantic enrichment of the models in the conversion to the 3D geodatabase will not suffer any degradation of the related information, as will be demonstrated in the last part of the paper.
Finally, a discussion concerning the applicability of macroelement analysis in HBIM-GIS models for a geographic scale perspective and the possible users’ fruition of 3D geodatabase information was proposed (Section 4). Selected final remarks and perspectives of implementation using an AMS interfaces, as already investigated in the Torino context by [44], were proposed in the conclusions (Section 5).

2.2. Reflections on Similarities Detected on Two Standards: LoD (CityGML) and LOD (IFC)

As previously cited studies have ascertained, the integration of urban data model schemes based on CityGML and those based on the IFC standard of BIM, allow for a mutual enrichment that allows a wider application in different sectors and greater purposes in the different fields of interest.
Although interoperability in the strict sense is based on the data format features, their clarity, and consistency, which is not degraded during the possible conversion between different software, it is essential that some basic characteristics are harmonizable, such as data accuracy, the geometric and semantic description, and their levels of detail. For this reason, and taking into account the final purpose pertaining to the church macro-elements organization that are parts of the building, the in-depth analysis of the conceptual data model and relations is essential for the integration proposal.
We summarize the similarities detected in the comparison among CityGML 2.0 with the elements/surfaces descriptions (OGC City Geography Markup Language, CityGML Encoding Standard—2020) and the IFC objects definitions of the objects oriented model pertaining to BIM (building information model) approach (https://standards.buildingsmart.org/IFC/RELEASE/IFC2x3/TC1/HTML/ifcsharedbldgelements/ifcsharedbldgelements.htm#entities, accessed on 27 January 2023). In terms of the current standard definition, the City GML 3.0 is the newest released version [45] and IFC 4.3.1.0 is the last released [45], and IFC 4.4.0 is under development.
The needs encountered in the AEC (Architecture, Engineering, Construction) industry that require the dimensional characteristics to be embedded in other information such as the materials and properties of the “smart objects” of the buildings, have led to the development of different levels. The level of geometry (LoG) refers to the graphical elements of the model, whilst LoI refers to non-graphical information, both of them are combined in LOD, which is used as a measure of the service level required [46]. The level of information has also recently been subject to revision in the structuring of BIM model: Ref. [47] introduced the issue of information requirements, to detach from the concept of LOD, and then Ref. [48] specified it. In fact, since the standard is applicable to the entire life cycle of any building asset, the LOIN, Level of Information Needed [49] (LoIN is defined as: “Graphic and non-graphic information for the definition of the building in its components in the different phases of technical-economic feasibility design, definitive and executive design”), indented and referred to structural elements is even more important, after the construction, to documentation, maintenance, refurbishment and restoration, including vulnerability assessment procedures oriented to structural reinforcement. In these terms, the LoIN describes the granularity of the information adaptable to different purposes and exchanged in terms of geometric, alphanumeric, and documentation information.
Starting from the consideration that the levels of detail of the CityGML standard and the levels of development of the IFC standard are not completely overlapping in their contents, it is necessary to explain how a greater variety of levels is necessary for the evolution of the need in design and building practices, including infrastructures, so they suggest adopting a new vision of LoD with the meaning of Level of Decision.
In parallel, for the development of the semantic representation of 3D city models, further subgroup specifications, namely a set of n°16 LoDs enriching the original n°4 LoDs classification, have been proposed [50].
Although in different case studies, the scope of the 3D representation requires the developer to generate a digital model considering both LOD and LoD, in the present research we considered the basic classification since the possible improvement coming from the macroelements modelling needed to start from the conceptual reference model structure. Therefore, in the following comparison (Table 3) LoD is used for CityGML standard organization of Level of Detail, while LOD is used for the level of development from the IFC standard.
  • LoD 0, is for the regional and landscape level, it corresponds to the maximum generalization, a 2D polygon represents the shape of a building;
  • LoD 1. Regional or city level (1:25000/1:10000 scale), the accuracy is low (5 m to 2 m), the buildings are represented as schematic volume, and the roofs are flat;
  • LoD 2, is for city district and urban context, (1:5000/ 1:1000 scale) the accuracy is medium (2 m–1 m). The buildings have roof objects with their shape and orientation;
  • LoD 3. In the LoD 3 the exterior architectural models (1:1000/1:500 scale) are represented and the accuracy is high. The buildings are represented in the actual form as are the roofs;
  • LoD 4 in CityGML 2.0 enhances the previous LoD adding the interior architectural model structures (more than 1:500), but currently LoD 4 (CityGML 3.0) can be used in any lower LoD.

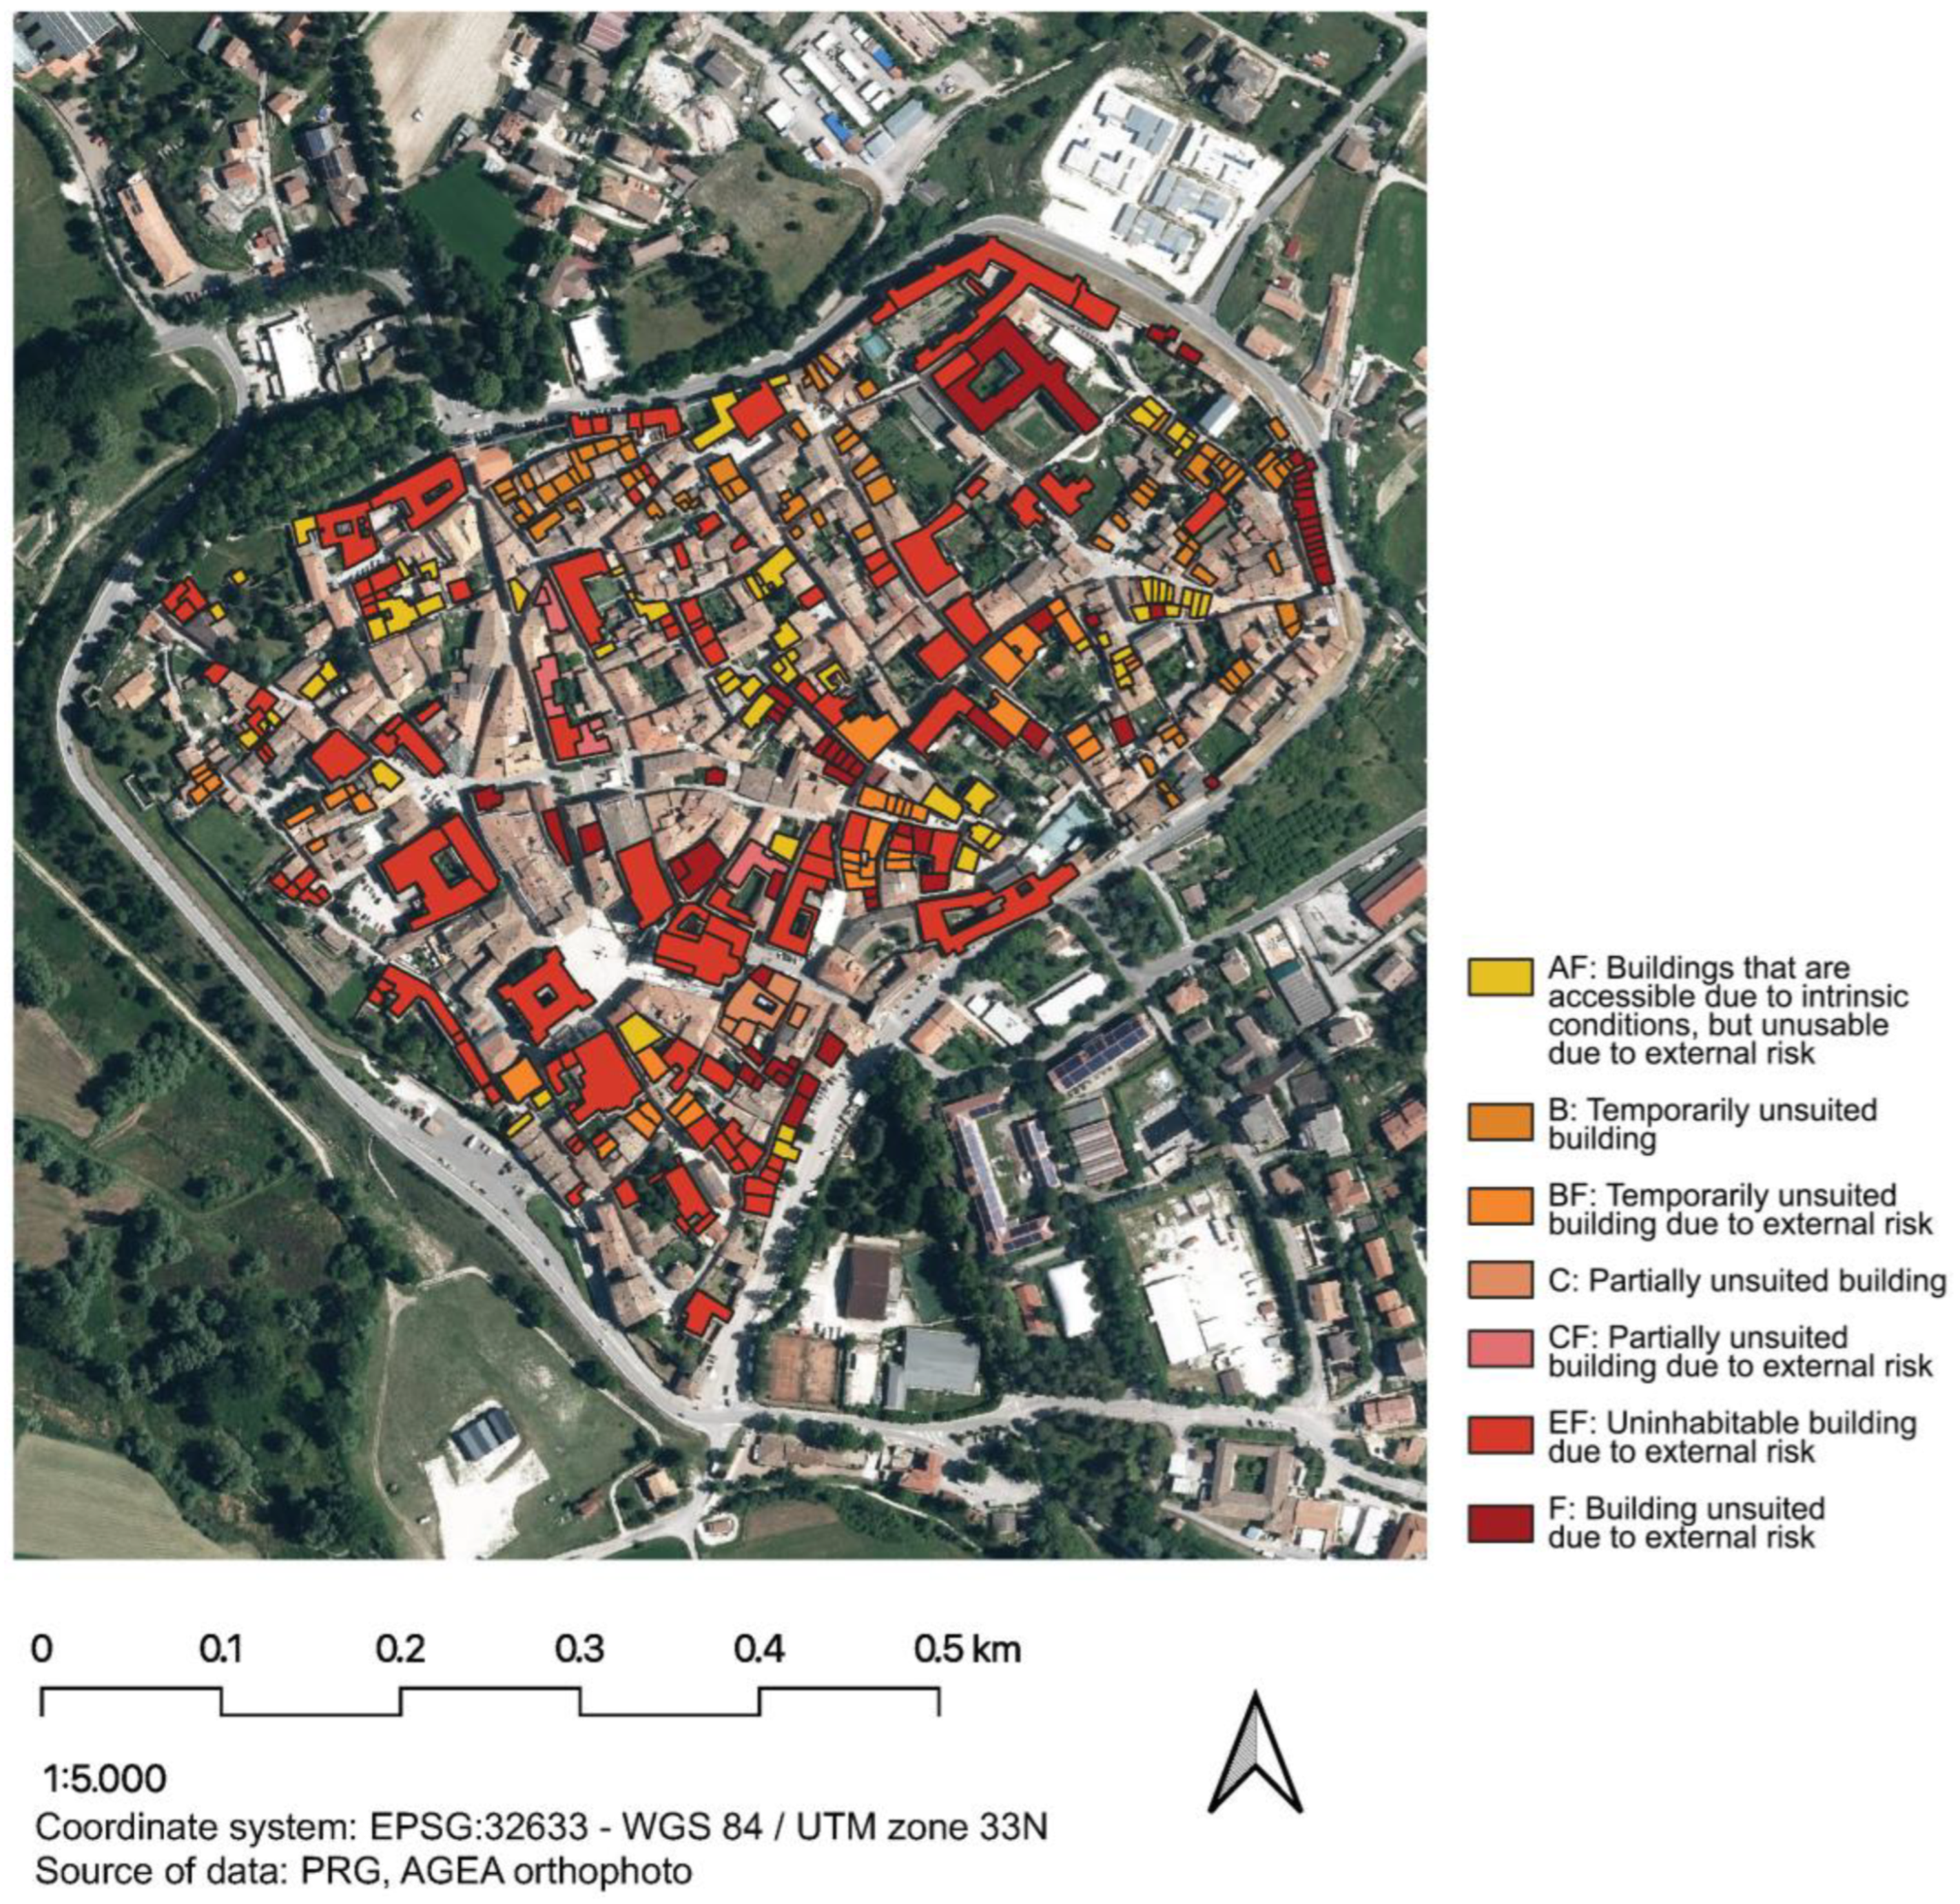
2.3. Data Collection: Integrated Rapid Mapping Approach Supporting Damage Mapping and Seismic Vulnerability Assessment

Within the built heritage documentation domain, the use of integrated geomatics techniques for answering to the sustainability requests, in terms of time, cost, involvement, complexity of use, quality of measurements and accuracy of 3D models is widespread. Among the most widespread and new digital techniques for rapid mapping, the recent 3D metric survey methods allow the collection of accurate 3D a point cloud with particular attention to the potential of rapid mapping and mobile systems based on imaging and ranging sensors. Multisensory surveys allow the construction of integrated 3D models, derived from point clouds, which are lifelike and an accurate digital representation of the artefact. In such contexts, these models often prove to be strategic in the contribution to the metric documentation, supporting the structural analysis and vulnerability in contexts of seismic risk, and understanding the connections between structural elements and the damaged state during the typical operations of post-event reporting (e.g., AeDES datasheets).
The goal of the rapid mapping strategy is to maximize the acquisition of 3D data with a well-structured survey and minimizing operator attendance time at the site, also for safety issues [51]. The validation of a workflow based on 3D digitization can lead to provide those metric and radiometric information effective to outline the first level of knowledge for masonry churches. Research in these directions can also ensure that these methodologies can be replicable and thus implemented in the actual operational practices of pre-post damage conditions. Mobile mapping systems (MMS) and photogrammetry by unmanned aerial vehicle (UAV) can be clearly defined among the most pervasive, investigated and experiment techniques both into geomatics data acquisition research and in heritage context-related applications.
In this research, we focused on urban and architectural scale modeling according to LoD/LOD hierarchy and information extraction supporting damages documentation and analysis, thanks to the integrated acquisition of photogrammetric data from drone and data derived from a mobile mapping system based on SLAM technology. With this strategy, it was possible to generate 3D metric models in the proposed cases study, with multiple resolution and accuracy, on which the damage mapping can be supported and the macro-element modelling for seismic vulnerability assessment can be based with high reliability. Below are the presentations of the case studies with their particularities regarding the data collection and the purposes of the modeling.

2.3.1. Cases Studies

The research is focused on two cases studies of urban nuclei involved in the integrated documentation project of urban areas interested by the 2016 earthquake, carried out by the Geomatics group of the Politecnic Univerity of Turin in collaboration with the DIRECT team and 2016 Earthquake Task Force Polito. The 3D survey work was conducted after the seismic wave that occurred in the central Italy area, and that has strongly damaged not only historic buildings but entire urban centres. Among others, the historical centres of Norcia and Campi di Norcia (involved in the current research), and Amatrice, Pescara del Tronto, Tolentino were the subject of 3D emergency mapping for multiple purposes, also deriving from contingent emergency contexts. In particular, the villages of Norcia and Tolentino and the hamlet of Campi di Norcia, were established as reference cases studies, the urban centre of Norcia. The buildings under particular interest included the Castellina and the San Lorenzo Church, and the Campi hamlet, with the church of Sant’Andrea in Campi. The carried-out activity involved survey and training activities for students, researchersm and professors, on 3D multi-sensor survey methods to increase ability and efficiency in survey acquisition methods in emergency sites and then, the generation of multiscale and multi-contents models in critical contexts. The 3D metric survey procedures were set up starting from a topographic survey with GNSS method and total station. The integrated aerial and terrestrial approach delivered many typologies of geospatial data, that are the bases of the construction of the methodological approach here presented.

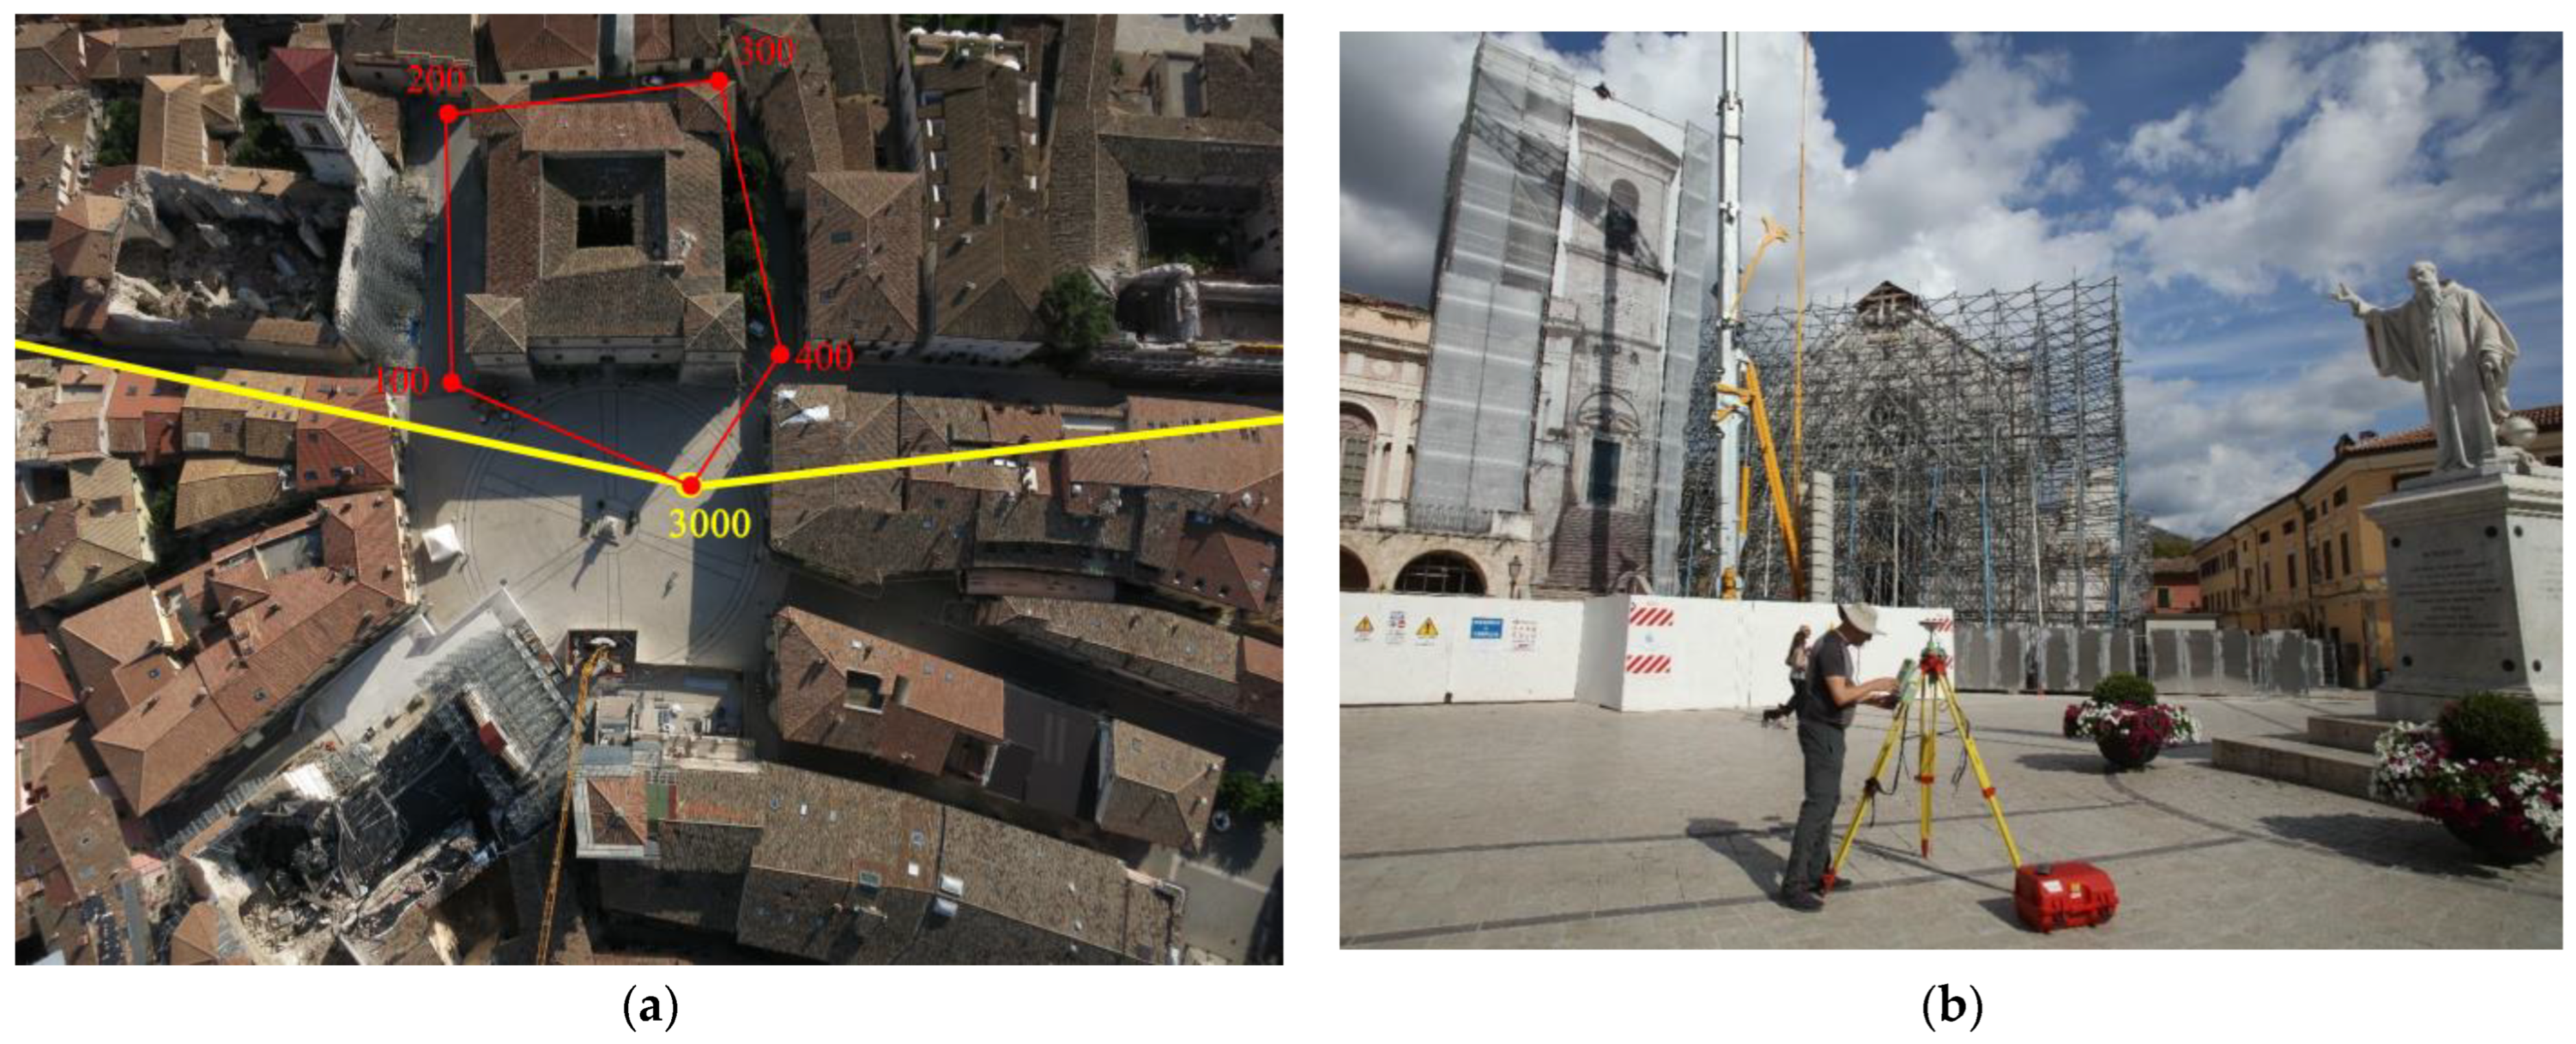
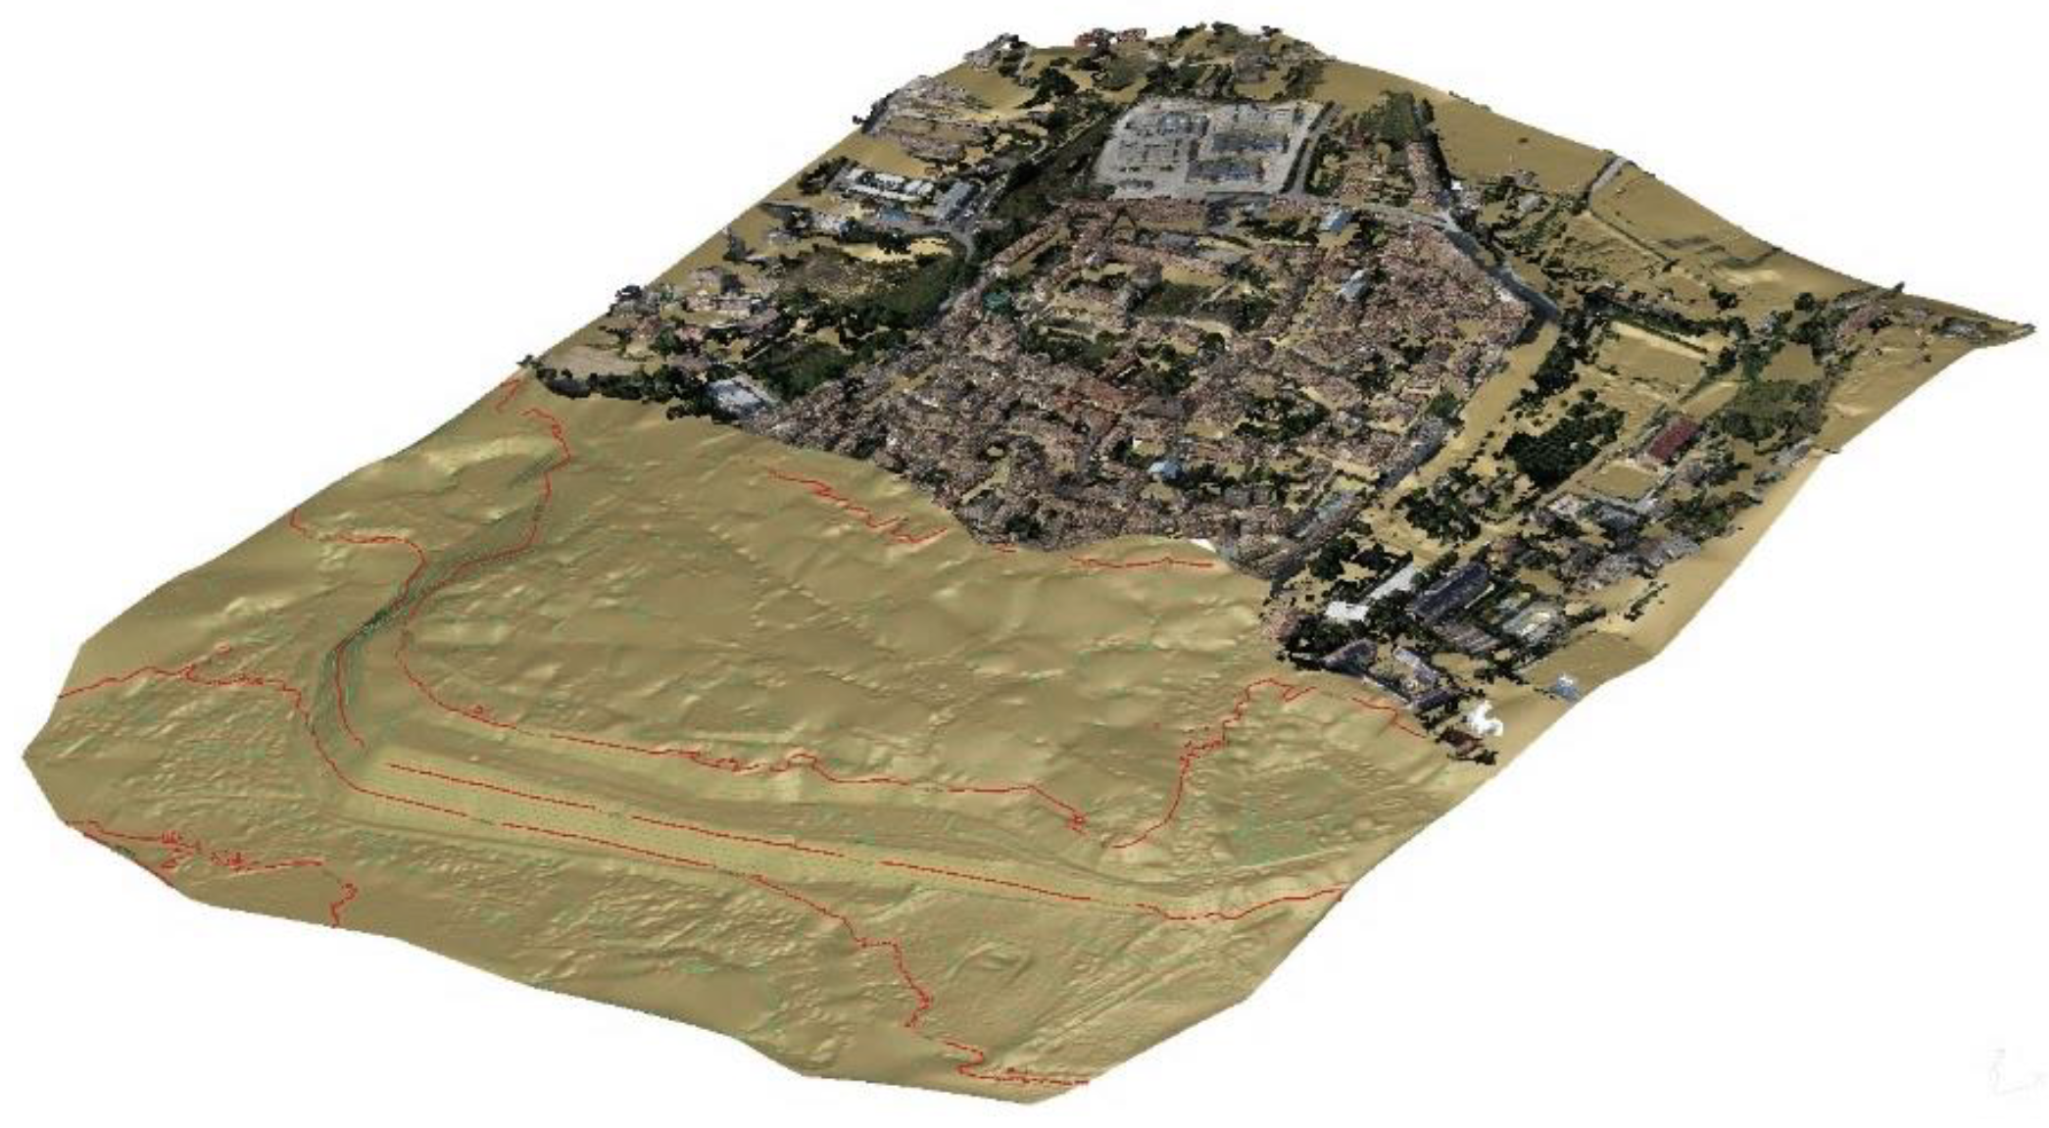
Urban Scale: The Norcia Urban Centre

The first case study presented refers to the city of Norcia, an historical city at about 600 m asl, in the Valnerina territory, that is the birthplace of San Benedetto, creator of the Benedictine order and patron of Europe. The featuring architectural and urban elements of the city are related to the free municipality period of Norcia, when the impressive city walls (XIII century) and the imposing basilicas of San Benedetto and San Francesco (XIV century) were realized. The seismic inheritance of this territory is also a constant, characterizing the built heritage, due to the high seismic risk of the area. Norcia has been hit repeatedly over the centuries by devastating earthquakes (the major ones: 1328, 1703, 1730 and 1859) [52]. The last one, that this research refers to, was the disastrous one of 2016-17, with a magnitude of 6.5, which caused numerous collapses of the churches and extensive damage. The documentation activity carried out in 2016 by the geomatics teams refers to an integrated multi-sensor approach focused on the historical centre, the main building of the central square, Piazza S. Benedetto di Norcia, the Castellina building, and the walls system. This part of the work is already presented in [23], where the specificity of the documentation and modelling strategy were presented.
The multi-scale and multi-sensor DSM at the base of the HBIM modelling starts from point clouds derived from UAV flights ad different scales. A wide scale flight was performed by an Ebee fix-wing drone by Sensefly, with a 120 flight altitude and 4.3 cm/px GSD (80 mln points) using 50 × 50 cm colour contrast target. It was integrated with a very high-scale photogrammetric dataset by a DJI Spark mini-drone with nadir-oblique camera configuration integration and 1cm/px GSD (10 mln points) using 10 × 10 cm B/N target. The accuracy of survey was ensured by Total Station measurements and topographic GNSS receiver measurements of vertices networks around the city centre and the square (Figure 2). The dense cloud processing followed the GCP-optimized bundle adjustment and were evaluated via CP residuals of around 3–4 cm. In addition, a terrestrial combined acquisition by a static TLS survey processed with the use of control points was carried out on the Castellina palace and the main square of Norcia for the architectural-scale documentation standards. The acquisition was made by 21 scan positions, of which 13 were useful for the acquisition of the square and the buildings overlooking and eight were located around the Castellina complex, were co-registered and georeferenced with residuals on control points lower than about a few centimeters (1:50–1:100 scale) [23,53].

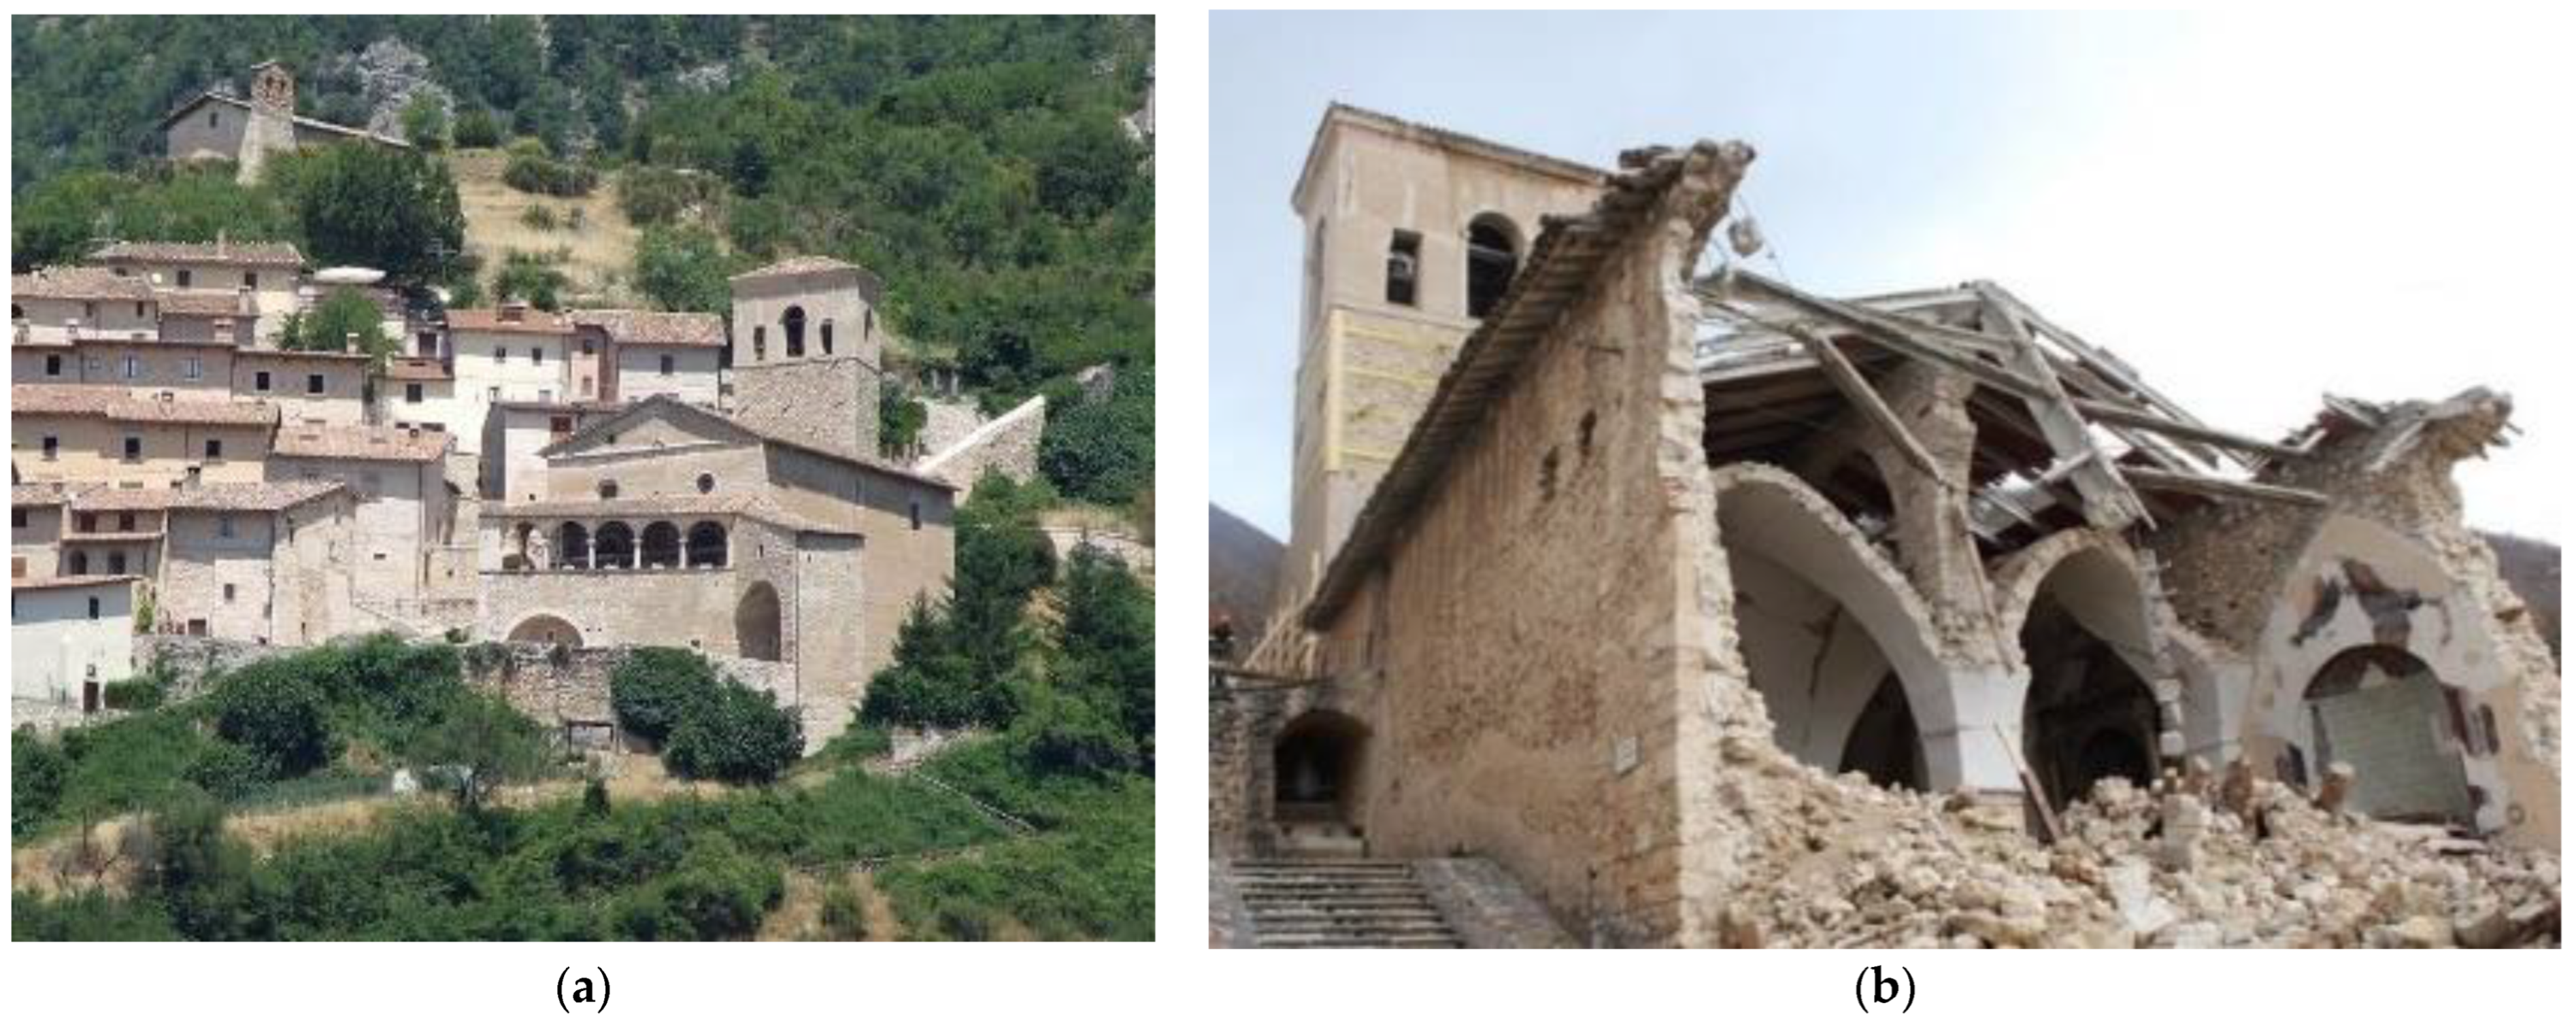
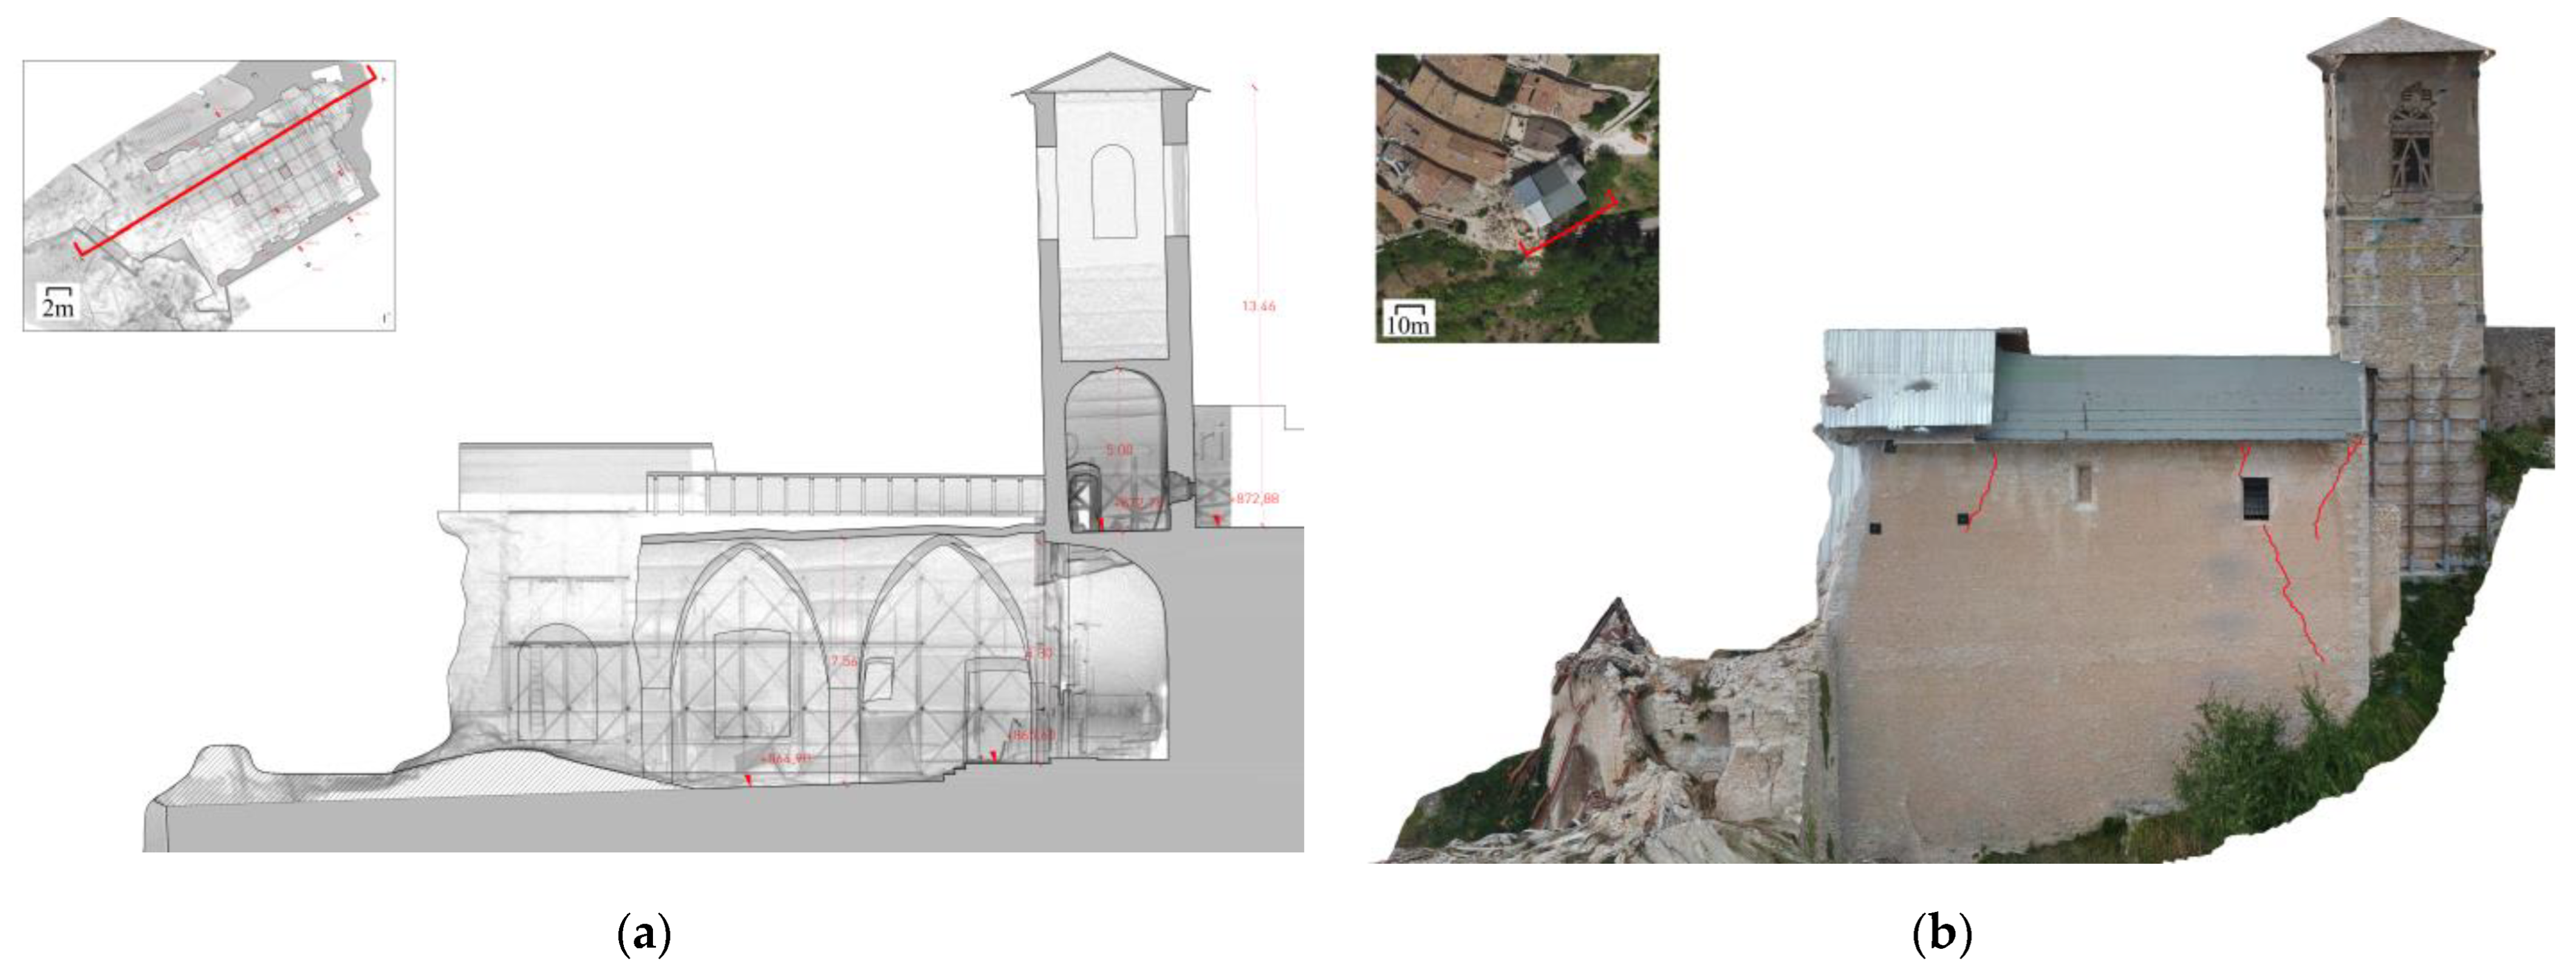
Architectural Scale: The Sant’Andrea Church Digital Model

The Sant’Andrea church is a masonry structure of moderate dimensions dating back to the 14th century, composed of a hall with two naves, a bell tower behind and a portico on the façade. Today, it appears partially collapsed following the seismic events that hit central Italy during 2016 with a magnitude above 5 and, on 30 October 2016, a magnitude of 6.5 with an epicenter 4 km northeast of Norcia (Figure 3).
The high-precision 3D model of the church generated from these can support:
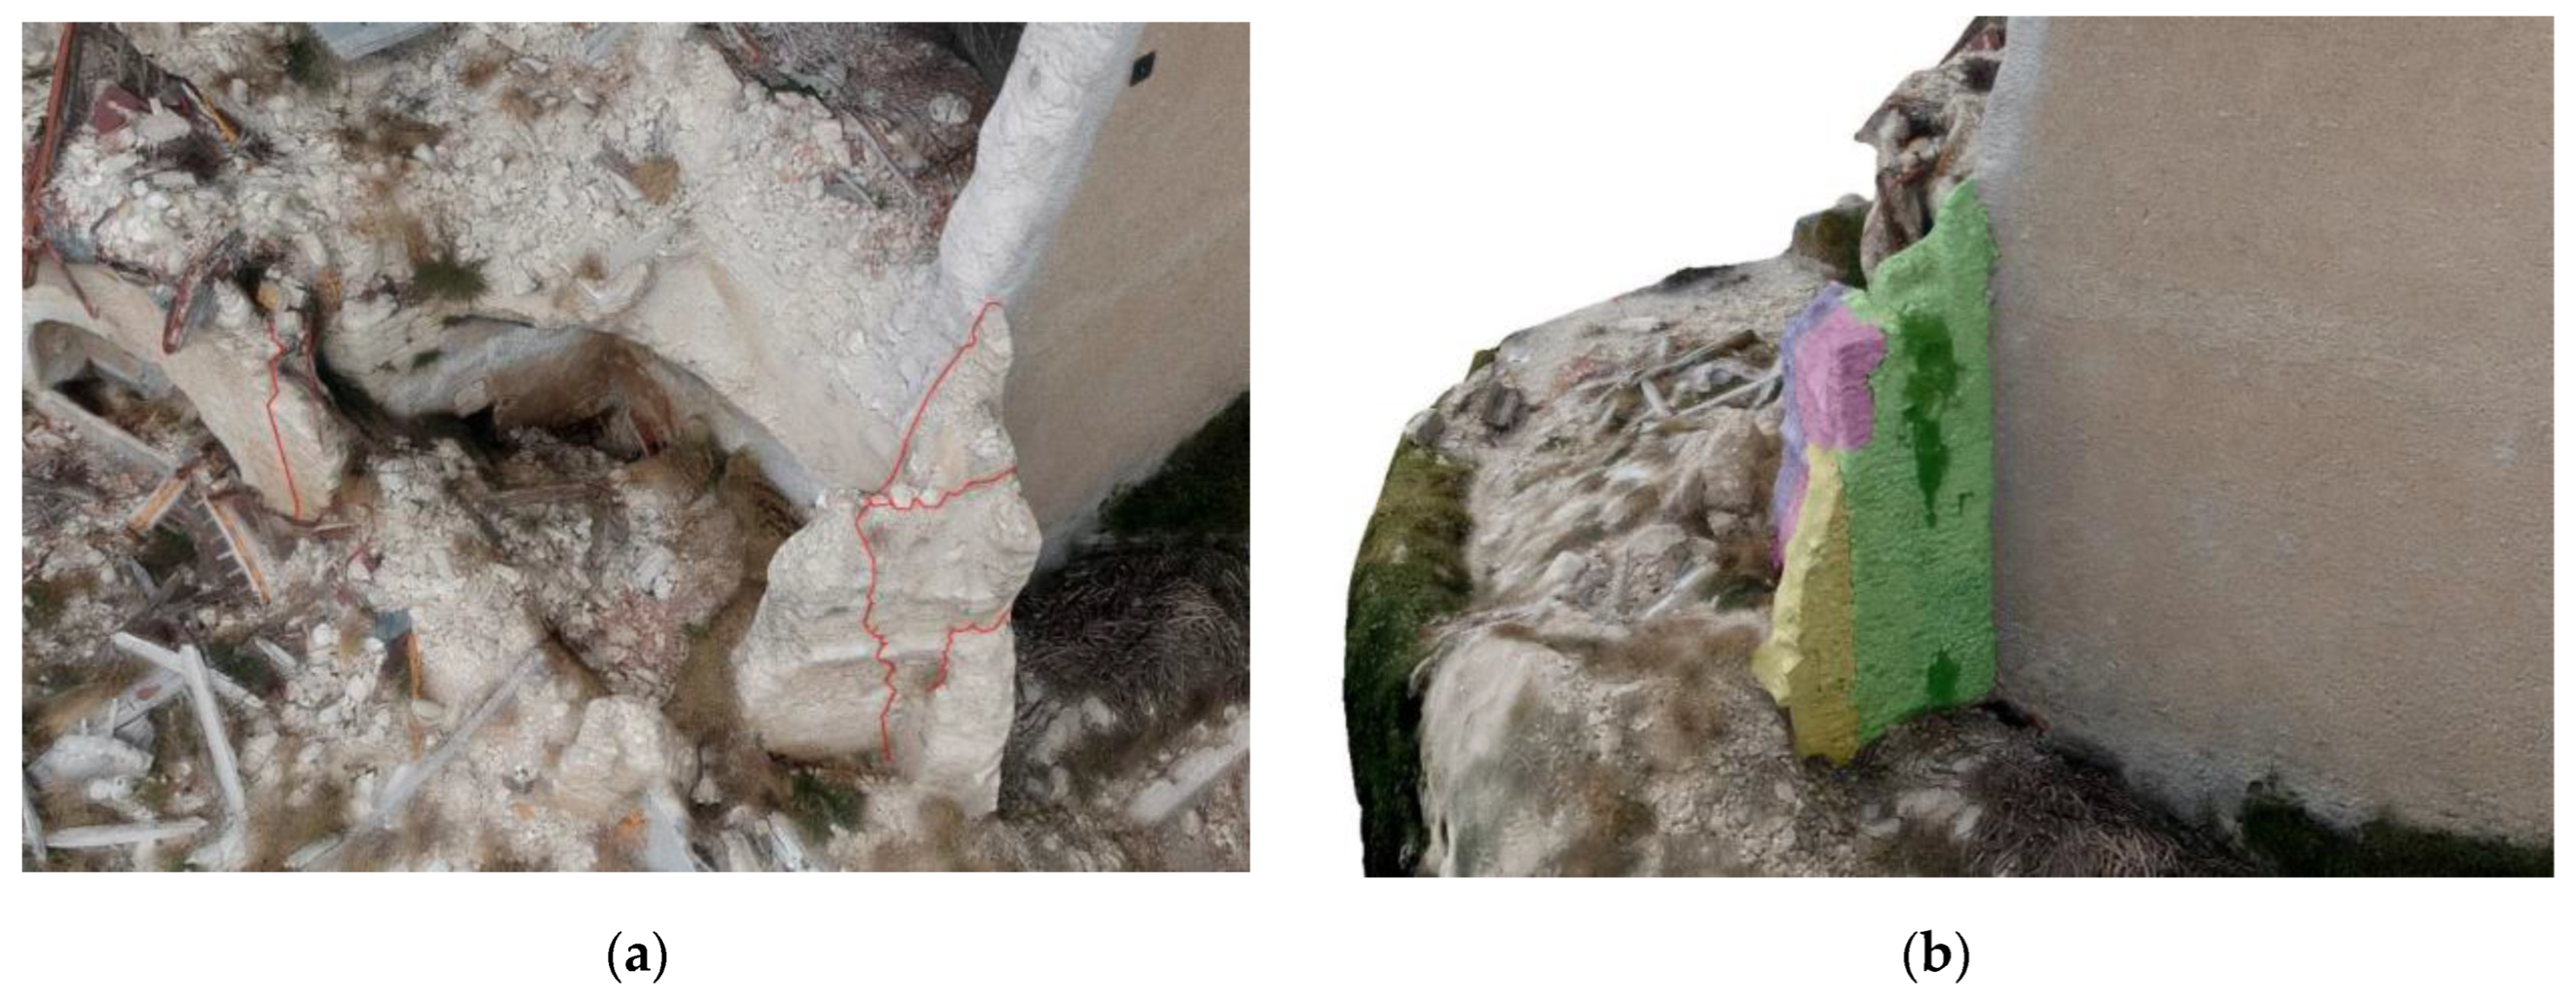
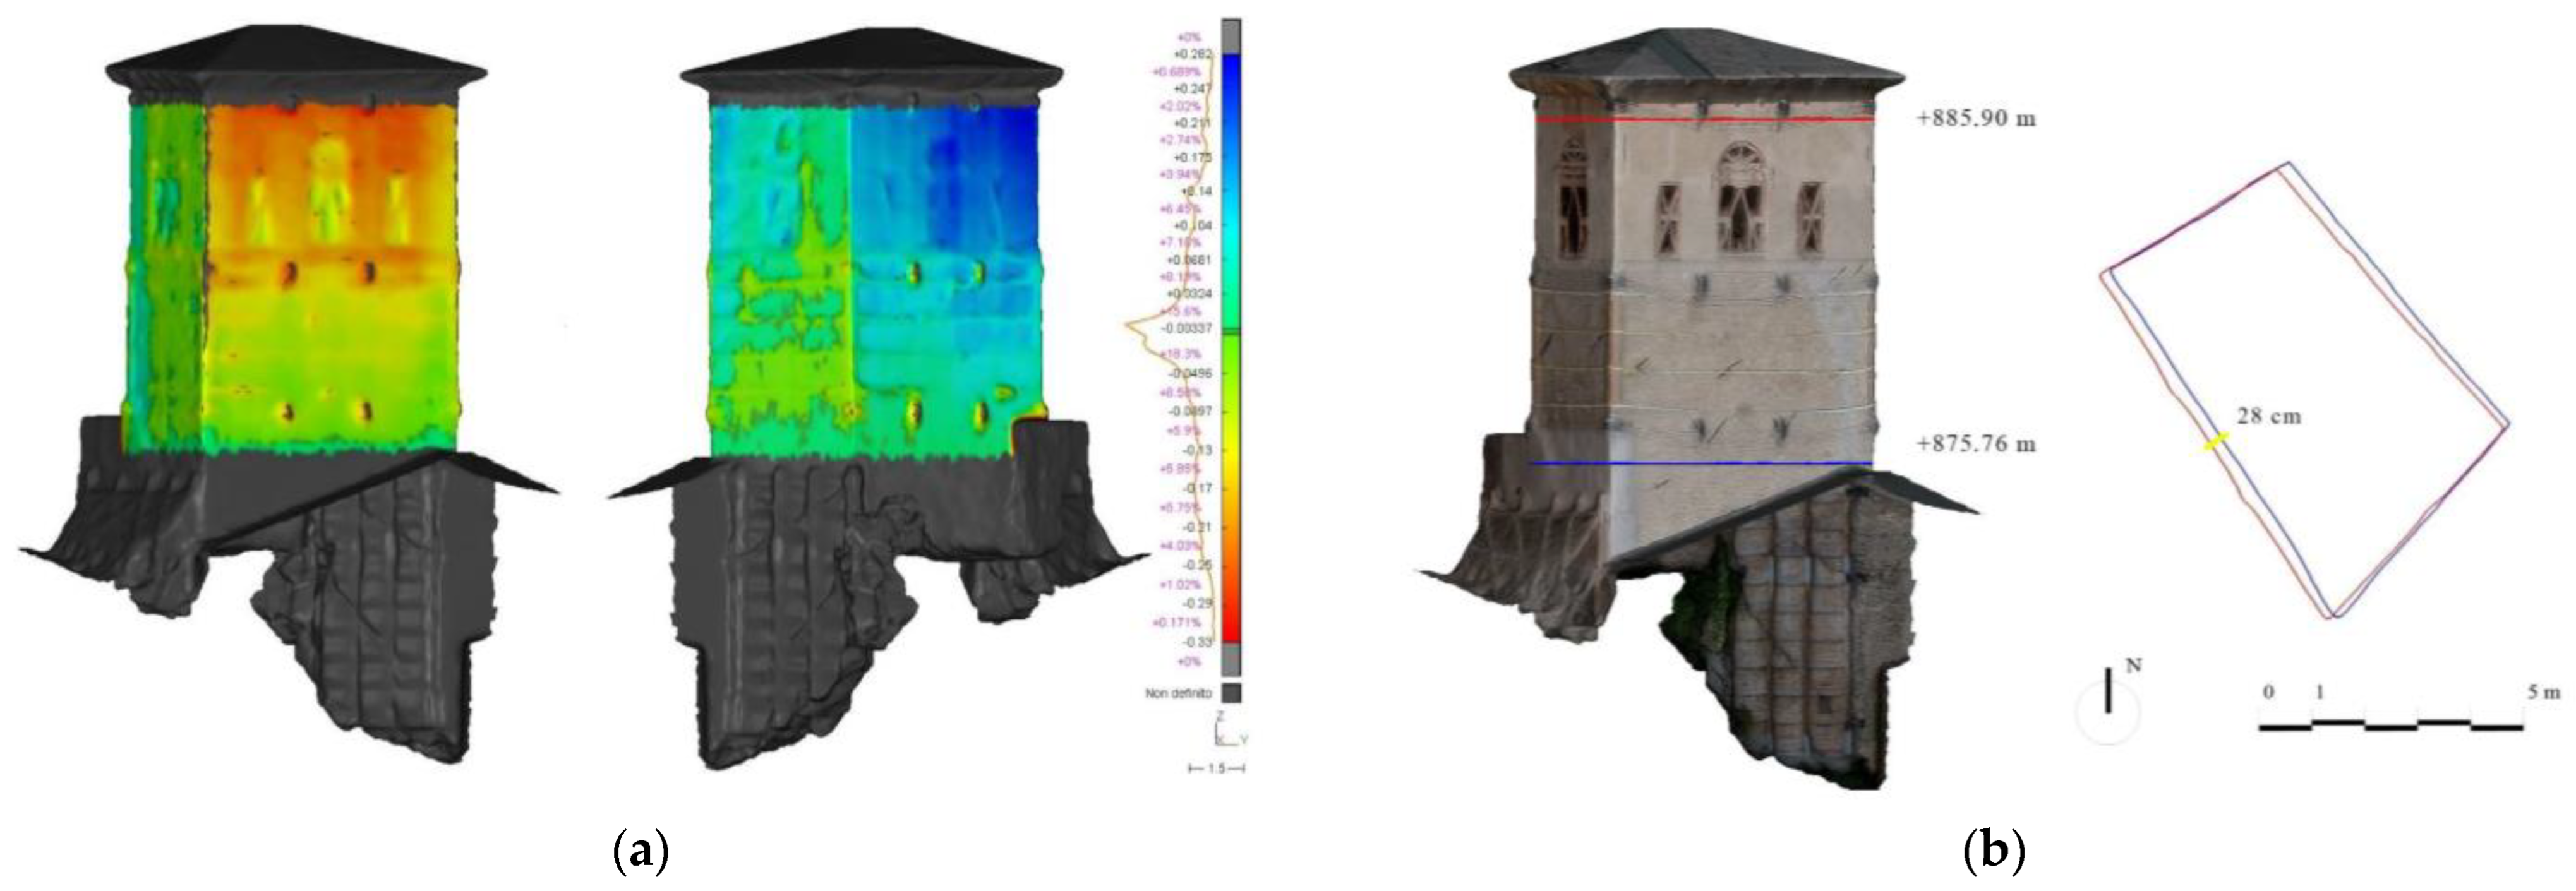
  • Damage inspection and deformation analysis;
  • Monitoring of the evolution of deformations and damages by analyzing and comparing different measurements, from a multi-temporal and multi-scale point of view;
  • The definition of volumes for analysis aimed at the identification of the elements that make up the architectural system and the conditions of equilibrium.
As specified at the beginning of this paragraph, the models derived from reality-based techniques are more suitable than traditional techniques in supporting the identification of the geometric alterations related to structural movements that trigger damage mechanisms, such as the loss of connection between masonry and cracks, as well as their out-of-plumb and buckling phenomena, in addition to masonry misalignments on different planes. The historical centre of Campi, which houses the church of Sant’Andrea, today partially collapsed, is perched on a slope, and surrounded by walls. The study was initially developed in [54,55].
Here, the digital documentation was based on the integration of photogrammetric acquisitions from flights with multi-rotor micro-drones, scans by traditional laser scanning (TLS), and scans with mobile scanners (MMS) outside and inside the artifact.
A topographic GNSS network supported the RTK (real time kinematic) measurements of aerial target distributed on the village and the Total Station measurements for terrestrial control points. The static scans project was made of 11 scan points.
The flights made using DJI Mavic and Spark drones, adopted nadiral shots, inclined at 45° on an orbital trajectory around the church and its bell tower. The average height of the flight was attested at 35 m to the lowest point of the site, which obtained an average GSD of 9.6 mm. The bundle block adjustment and the consequent Structure form Motion technique obtained an accuracy of 2 cm (evaluated through the usual sqm calculated on GCPs and CPs). Of particular interest was the acquisition (even in conditions of collapse and with the presence of scaffolds) and co-registration of ground clouds based on SLAM technology made in the interior of the bell tower and the nave of the church, with the aerial photogrammetric cloud related to the most difficult-to-access areas of the architectural complex as the wall towards the slope, the roofs and the upper portion of the tower.
The clouds acquired by means of a GeoSLAM Zeb-Revo hand-held scanner were registered by means of the ICP (Iterative Closest Point) algorithm integrated in the GeoSLAM Hub software (merge tool). Since this procedure does not foresee only a rigid roto-translation but also non-rigid registration of the clouds, a careful prior verification of the overall quality of the clouds and that of the trajectory estimated by the SLAM algorithm, which can be subject to drift, was necessary (Figure 4). The integrated clouds were evaluated and validated using the TLS cloud that constituted ground truth and provided local and global accuracy in line with the expected goals and results and in relation with the SLAM technology where the drift errors normally occurs. Here, the deviation analysis reported values between 1 and 8 cm [54].

3. Results

3.1. From Point Clouds to Structured Models

The structuring of semantically enriched 3D models starts from the optimized point clouds, which is one of the most crucial phases of the whole process. Only with an effective segmentation and structuring, which provides for the identification of the individual parts of the building according to an interpretation valid from the structural, functional, and morphological conformation point of view, as well as congruent with the standards which obviously constitute an effective guide for this important phase, is it possible for the model thus generated to meet the requirements for being constituted as the digital twin of the city or of a single building.
Point clouds segmentation has certainly been a subject under high observation for a long time, and has involved the search for tools and methods that facilitate the operator in the automatic or semi-automatic execution of this phase of the process, which is important and time-consuming. Knowledge-based approaches combined with algorithms capable of clustering clouds, as well as the search for valid machine and deep learning tools are highly studied and tested [55,56,57]. It is also relevant to consider that, in general, historic centres and historic architecture certainly involve greater difficulties in these specific tasks than modern buildings.

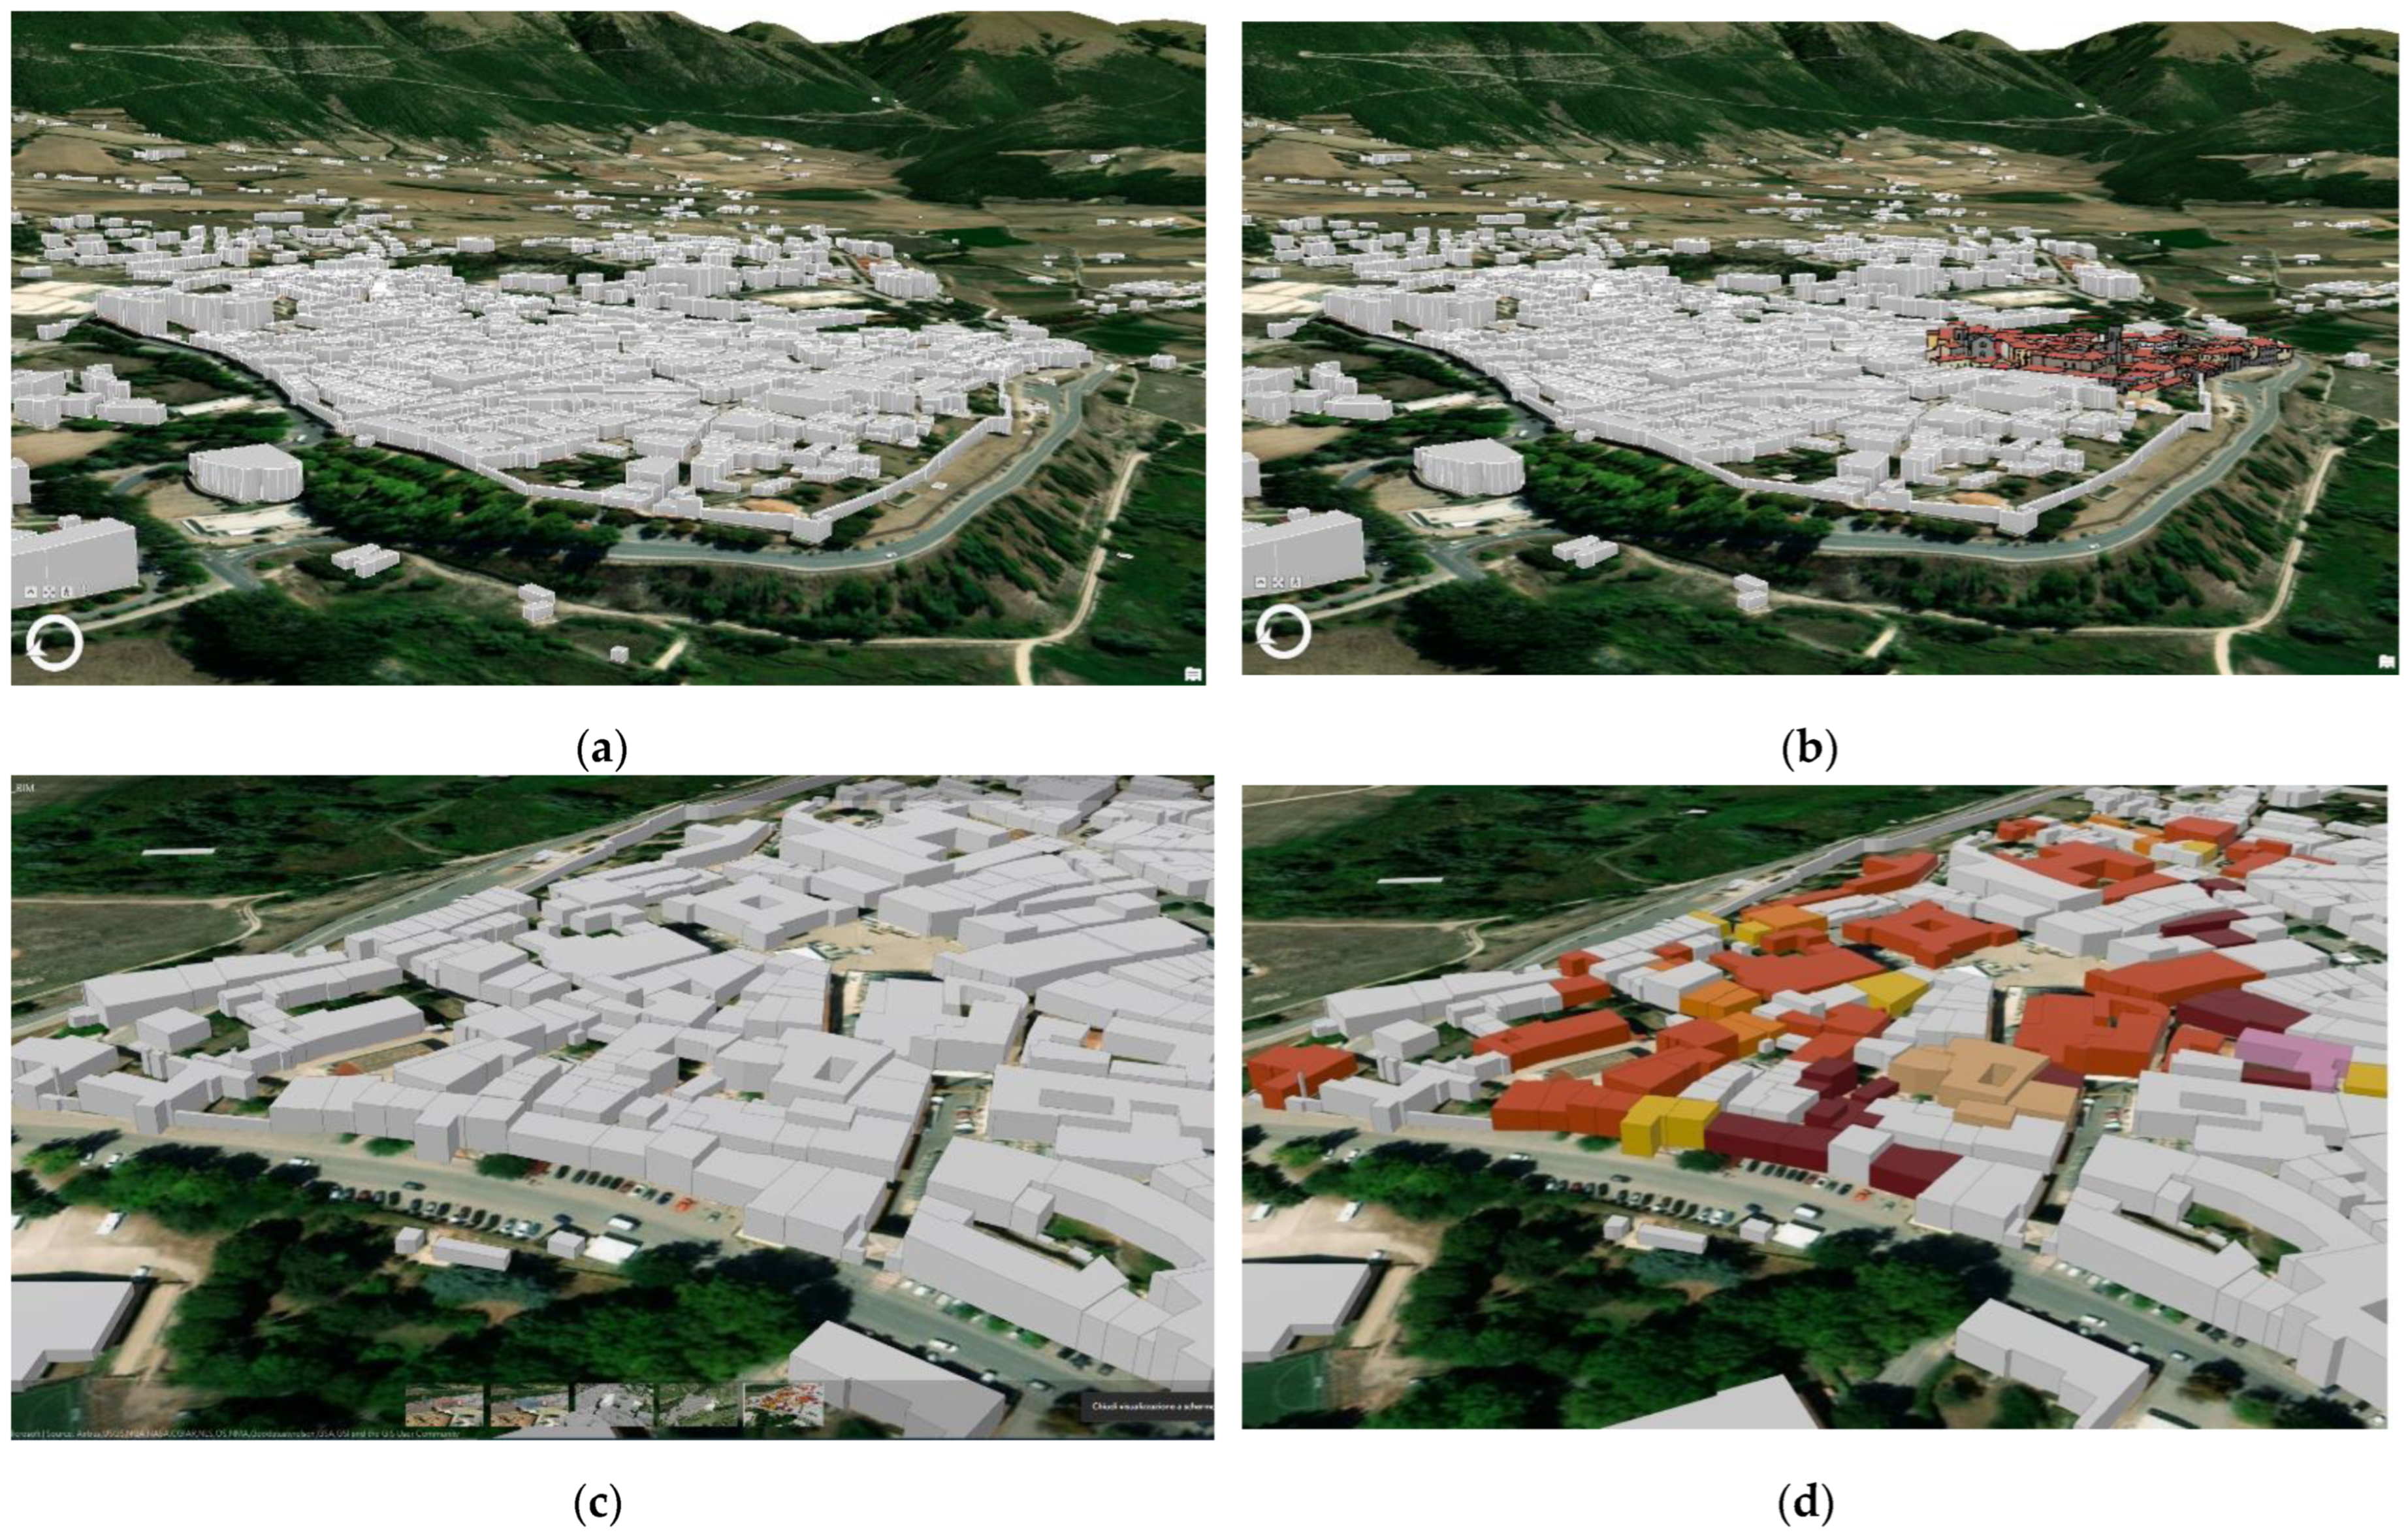
3.2. Urban Scale HBIM Modeling

The multiscale and multi-sensor nature of unstructured point clouds offers richness in geometric and radiometric features characterizing historical surfaces, and this challenging potential imposes the use of several segmentation approaches for undertaking semantic modelling of heritage objects.
The proposal to reach intermediate annotated point clouds helps to obtain an easier step in the workflow for semantic elements modelling toward parametric HBIM models. Among the achievable opportunities, supervised 3D segmentation can be based both on the 3D characteristics of the geometric content and on the continuity of the radiometric values of the cloud points, i.e., families of region-growing algorithms based on the segmentation of edges and regions, or RANSAC (RANdom SAmple Consensus) strategies that recognize shapes that match the surfaces [58].
In the context of the historic city of Norcia, approaches for automatic segmentation were tested on both the urban and building scales.
The dense cloud derived from UAV photogrammetry was analyzed and segmented to transform the DSM into DTM and obtain the classification of the terrain and urban objects in LoD 1; for this purpose CFS (cloth simulation filter) [59] implemented in Cloud Compare (CC) Graphic User Interface (GUI) was used (Figure 5).
An interesting aspect of the historical walled city of Norcia, which was a walled city and which essentially retains this conformation, is the presence of a road that surrounds the town, built in place of the moat that once enclosed the city. In this case, a good result was obtained by applying the supervised segmentation algorithm based on radiometric homogeneity available in the 3Dreshaper®-3DR software from Leica Geosystems.
On the architectural scale and with regard to the automatic classification experiments, we focused above all on the Castellina building, both because it is one of the prominent buildings in the main square of Norcia together with the famous basilica of San Benedetto unfortunately disastrously damaged following the earthquake, and because, as will be seen in the subsequently, the relevant architectural assets undergo a richer level of detail and an overall development of parametric modeling.
We can briefly report that in Avena et al. 2021 it was possible to examine the comparison between the application of the region growing algorithm which was based on the normals to the surfaces in the two software CC and 3DR® GUI: in the first case only the classification of the roof with respect to the perimeter walls was classified, while in the second case, the plane recognition algorithm also accurately identified the scarp masonry of the building. On another occasion [43] a semantic segmentation based on the feature vectors was proposed, followed by the RANSAC algorithm estimating the geometric parameters of primitives representing building components. In this test, one of the most interesting aspects was the study and extraction of topological relationships between the geometric components of the building, which finally made it possible to relate the ontological classes and relationships of historical building components with semantic segmentation.

3.2.1. LoDs

The HBIM modelling organized according to the different LoDs/LODs had the dual purpose of providing differently detailed documentation within the historical urban space and at the same time providing differently detailed information regarding the seismic damage suffered by the different buildings of the city, i.e., the multiscale approach was adopted. According to this purpose, the geometric and semantic information level of the parametric modelling decreased starting from the main square of the city. The detail of the modeling subsequently decreased in the southern residential area of the city for which a complete evacuation of residents was planned and still descends in the other parts of the city within the walls.
For the description of the different LODs that we report below, the classification proposed by British Standards Institution (PAS 1192-2: 2013) according to development levels was adopted (referred in brackets). In general, the modeling strategy was organized starting from thin sections of the point cloud, and intensified where it was necessary to increase the level of detail, and is a common feature of multiscale modelling.

LoD 0 Modelling

Mapping tdamage information is a prominent task, and such localized information is obviously an important management tool that the public administration can use to plan interventions and to manage the post-event housing situation. The LoD 0 modelling, corresponding to the most general representation of the city environments, here involved a 2D cadastral polygons database encoded according to the damage classification that represents buildings in a GIS environment (Figure 6). The classification was derived from AeDES forms by the Italian Civil Protection, in order to evaluate the level of damage that the built heritage suffered.
The damage scale is organized in different levels: from level A (absence of damage) to decreasing levels B, C, D, E (different levels of damage making the buildings unsuited due to their intrinsic injury) and finally level F (for cases of damage due to the context). Our purpose was that the damage information, intrinsically linked to each building, can be inherited in the subsequent multilevel 3D modeling, to finally be made available also in the future BIM-GIS representation.

LoD 1 Modelling (LOD 100)

In the case of Norcia, the DTM obtained from the UAV data, as described in paragraph 3.1, was used as terrain data into GIS space using ArchGIS Pro interface (Figure 5). Generic volume was used for buildings modelling as represented in Figure 7a–c, while the damage scale from AeDES reporting was the information associated with the building objects Figure 7d.

LoD 2-3 (LOD 200-300)

The urban morphology of Norcia is a typical medieval one: public spaces involve squares and widenings, but the streets are very narrow and winding; the buildings are neighboring and crowded together. The nadiral UAV photogrammetric point cloud featured high accuracy and rich levels of details in the roof surface of the buildings and in situations of compact urban settlement, presenting a lack of information relating to the fronts of the buildings.
The 3D data from UAV flights performed using 45° shooting and from terrestrial laser scanning acquisitions were planned in the areas in which higher LoD and LOD (see next step) were to be achieved, so in this step, the buildings were modelled starting from simple overall geometries and their roofs. The modeling procedure starts from buildings modeling based on point clouds with BIM parametric approach (Autodesk Revit®) and then it continued with the import of modelled buildings, with incremental LoDs into GIS space.
The LoD 2 (LOD 200) modeling certainly identified buildings uniquely at the architectural scale, allowing the recognition of the general morphology of the building, and volumetrics of the roof (balconies and dormers). Many constructive elements, such as openings, both doors and windows, have not undergone detailed modeling, but only generic elements similar to the originals (IFC families) were used.
More detailed geometric and semantic contents are in fact linked to the LoD 3 (LOD 300) representation. Here, more in-depth modeling than the previous one identified the features of the building organisms, ranging from the architectural choices, positioning of doors and windows, identification of any imperfections or damage, etc.
The modelled buildings were mainly located in the area of Piazza San Benedetto and from the cloud of points sections and cloud front projections, elements such as doors, windows, balconies, any stairways, damaged or collapsed elements, etc., were visible and identifiable (Figure 8). Ultimately, the inclination of the roofs pitches was defined using appropriate sections of the point cloud, capable of unequivocally highlighting the profile of the natural roof.
  • IFC object types in LoD 2 (LOD 200): ifcwall, ifc roof;
  • IFC object types in LoD 3 (LOD 300): ifcWall, ifc Roof, ifcDoor, Ifcwindow, ifcstair.

LoD 3 Interior (cityGML 3.0) (LoD 4CityGML 2.0) (LOD 400)

The city GML and IFC standards provided, for this LoD, a geometric and semantic in-depth analysis that prefigured the modeling of the internal elements and of the constructive element stratigraphies in a predominantly building conception of the construction. In the context of historical buildings, considering the extreme complexity of the possible different purposes of the use of the model (from conservation, restoration, reuse projects, which require high specializations in terms of materials, structural and superficial degradation, etc.) particular attention was required for specific building, such as the Castellina palace and the San Benedetto church in the main square of Norcia. For these assets, the parametric model required an as-built modeling approach based on the integrated point cloud, specifically for the roof shape and state of conservation and the walls configuration and slant.
Actually, we considered that the modeling at the architectural scale and of the individual architectural elements subjected to damage from a seismic event and the relative modeling for macro elements in view of the evaluation of the seismic vulnerability of the church of Sant’Andrea in Campi di Norcia presented in the following paragraphs (3.2 and sub-par), was a good example of appropriate modeling for this LoD.
  • IFC object types in LoD 4 (LOD 400): ifcWall, ifc Roof, ifcDoor, Ifcwindow, ifcstair, InteriorWallSurface.

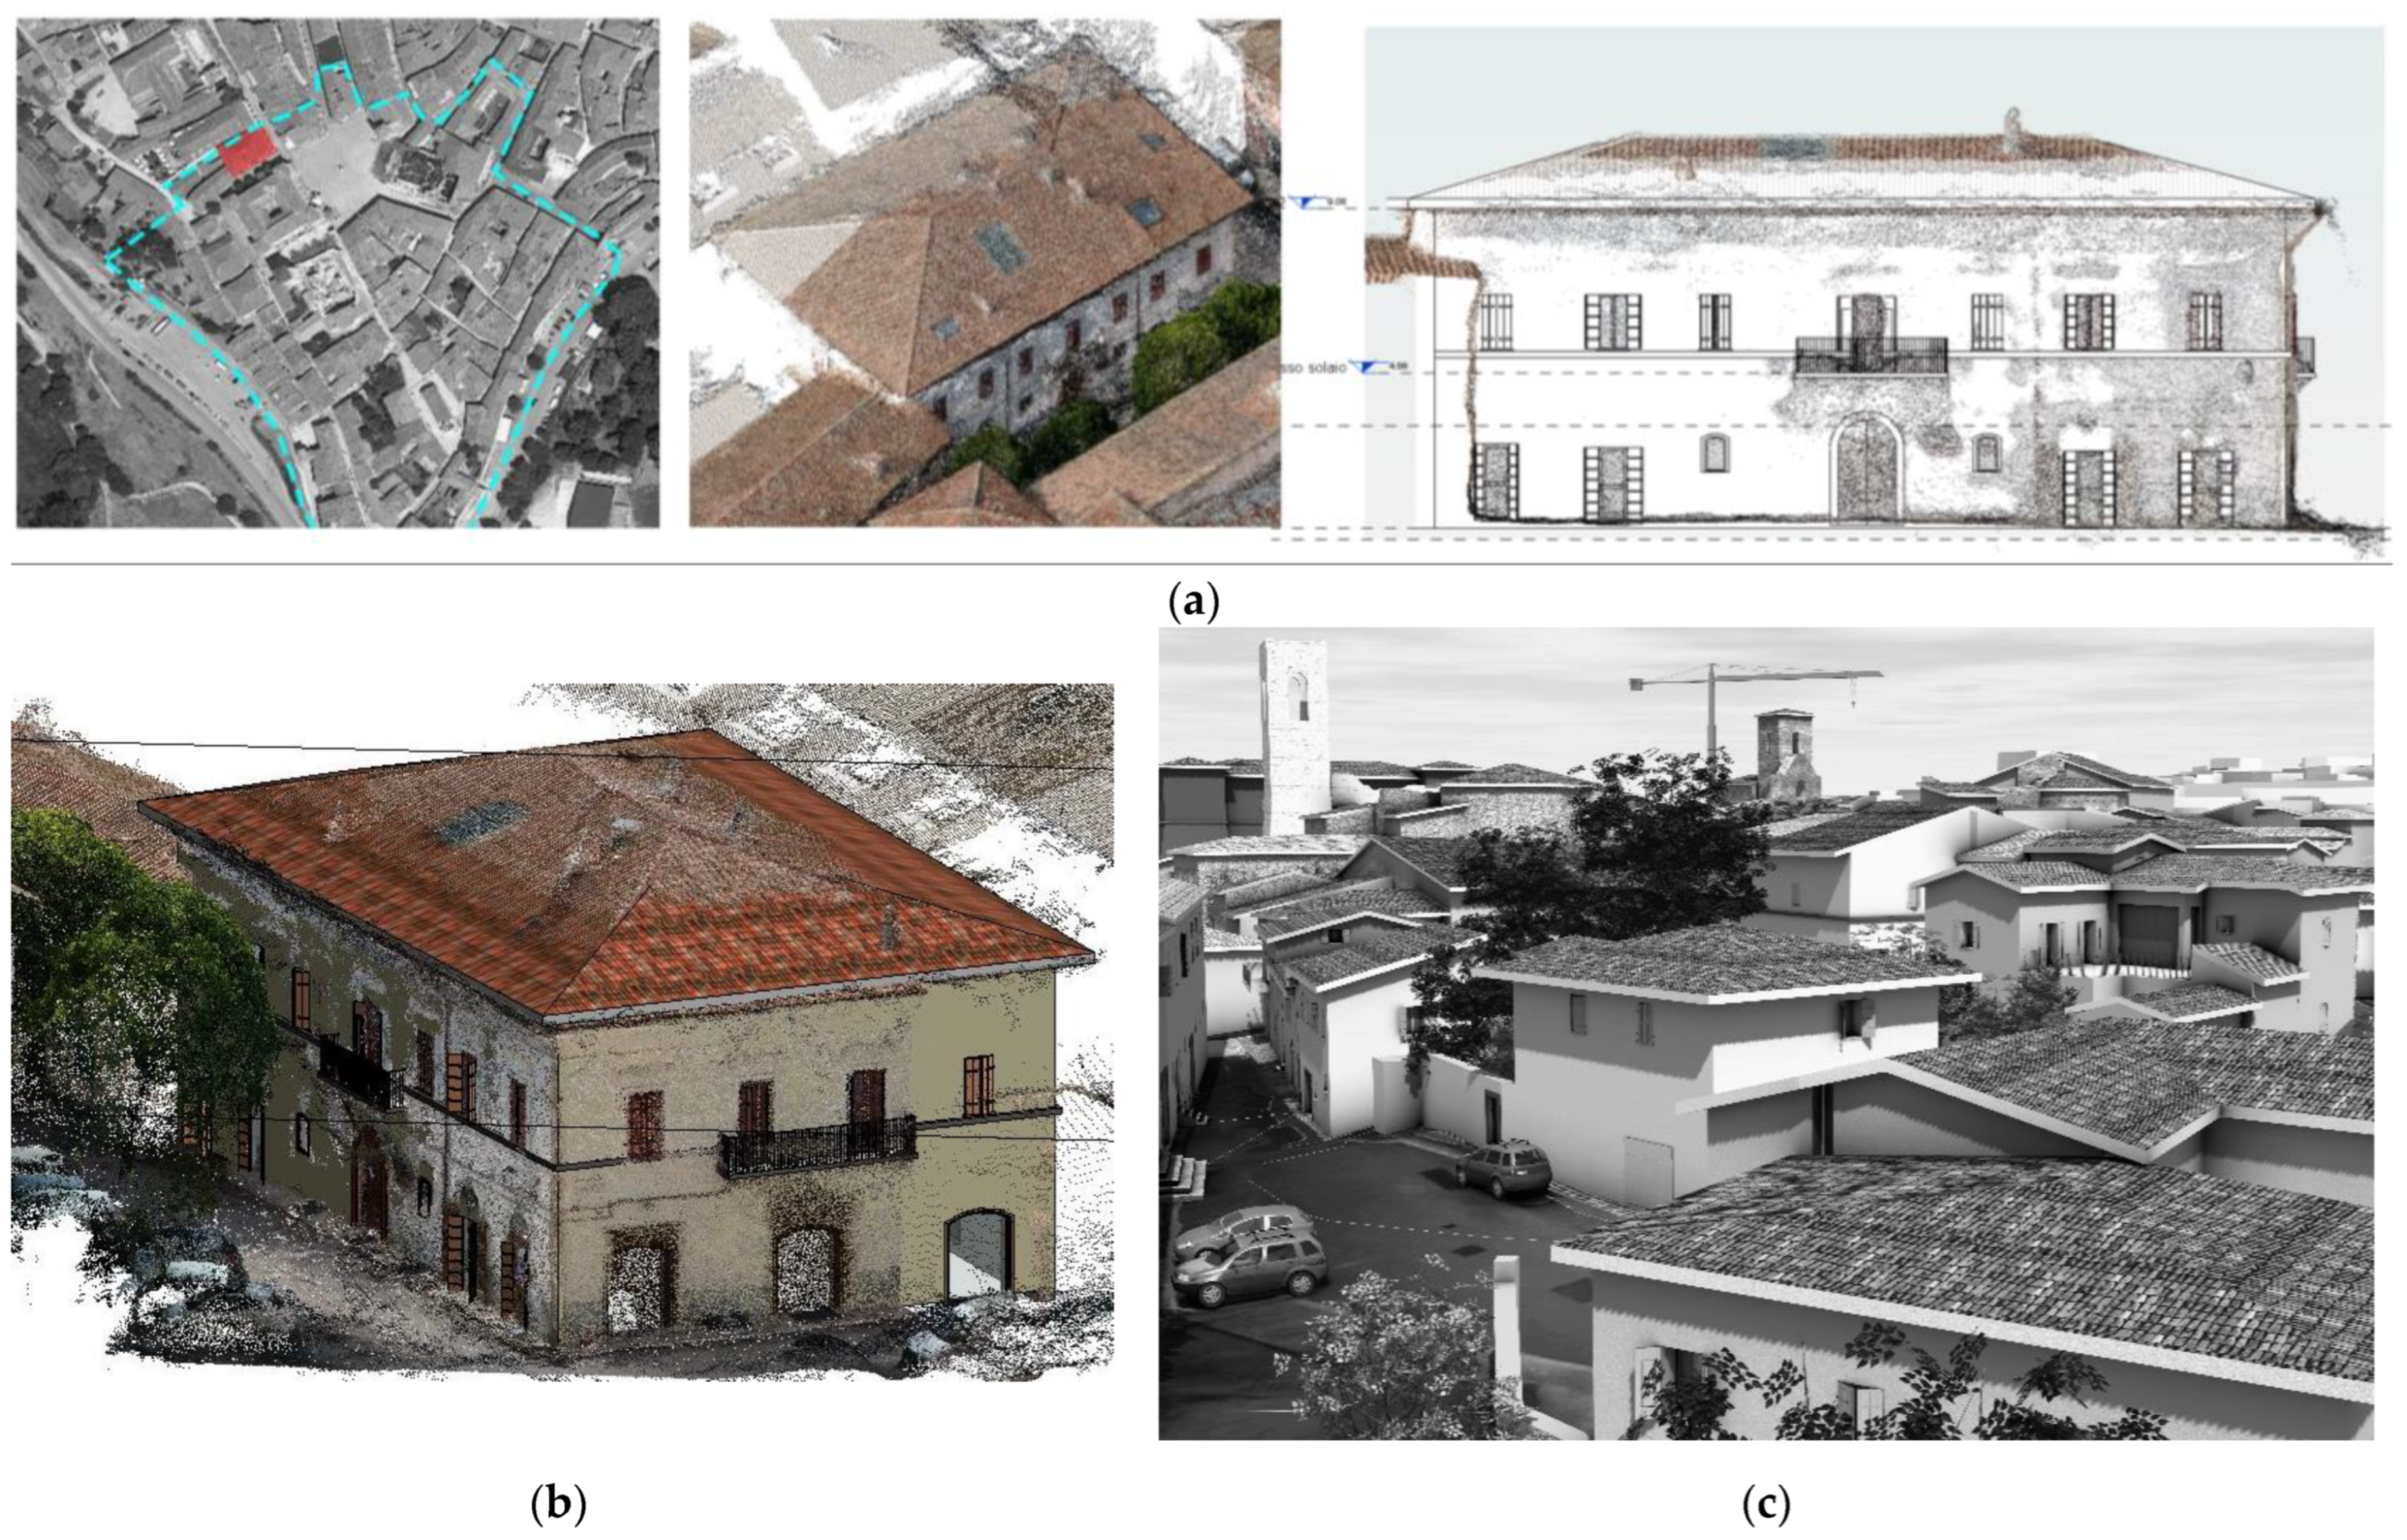
3.3. Architectural Scale: 3D Multisensor Model Generation

The set of 3D documentation data for the interpretation of the architectural system and seismic vulnerability assessment, made available by the integration of the techniques, to meet the level of information needs, was distinguished in:
  • Archival and historical data supporting the knowledge of pre-earthquake condition;
  • Images datasets captured by UAVs offer a privileged point of view, from above in nadir view and according to different camera positions and orientation, both for an inspection from inaccessible viewpoints and for a complete modelling and representation of the building façades;
  • Orthophotos and two-dimensional elaborations (Figure 9) in the form of sections and elevations in scale where the geometric and radiometric data are harmonized and metrically controlled;
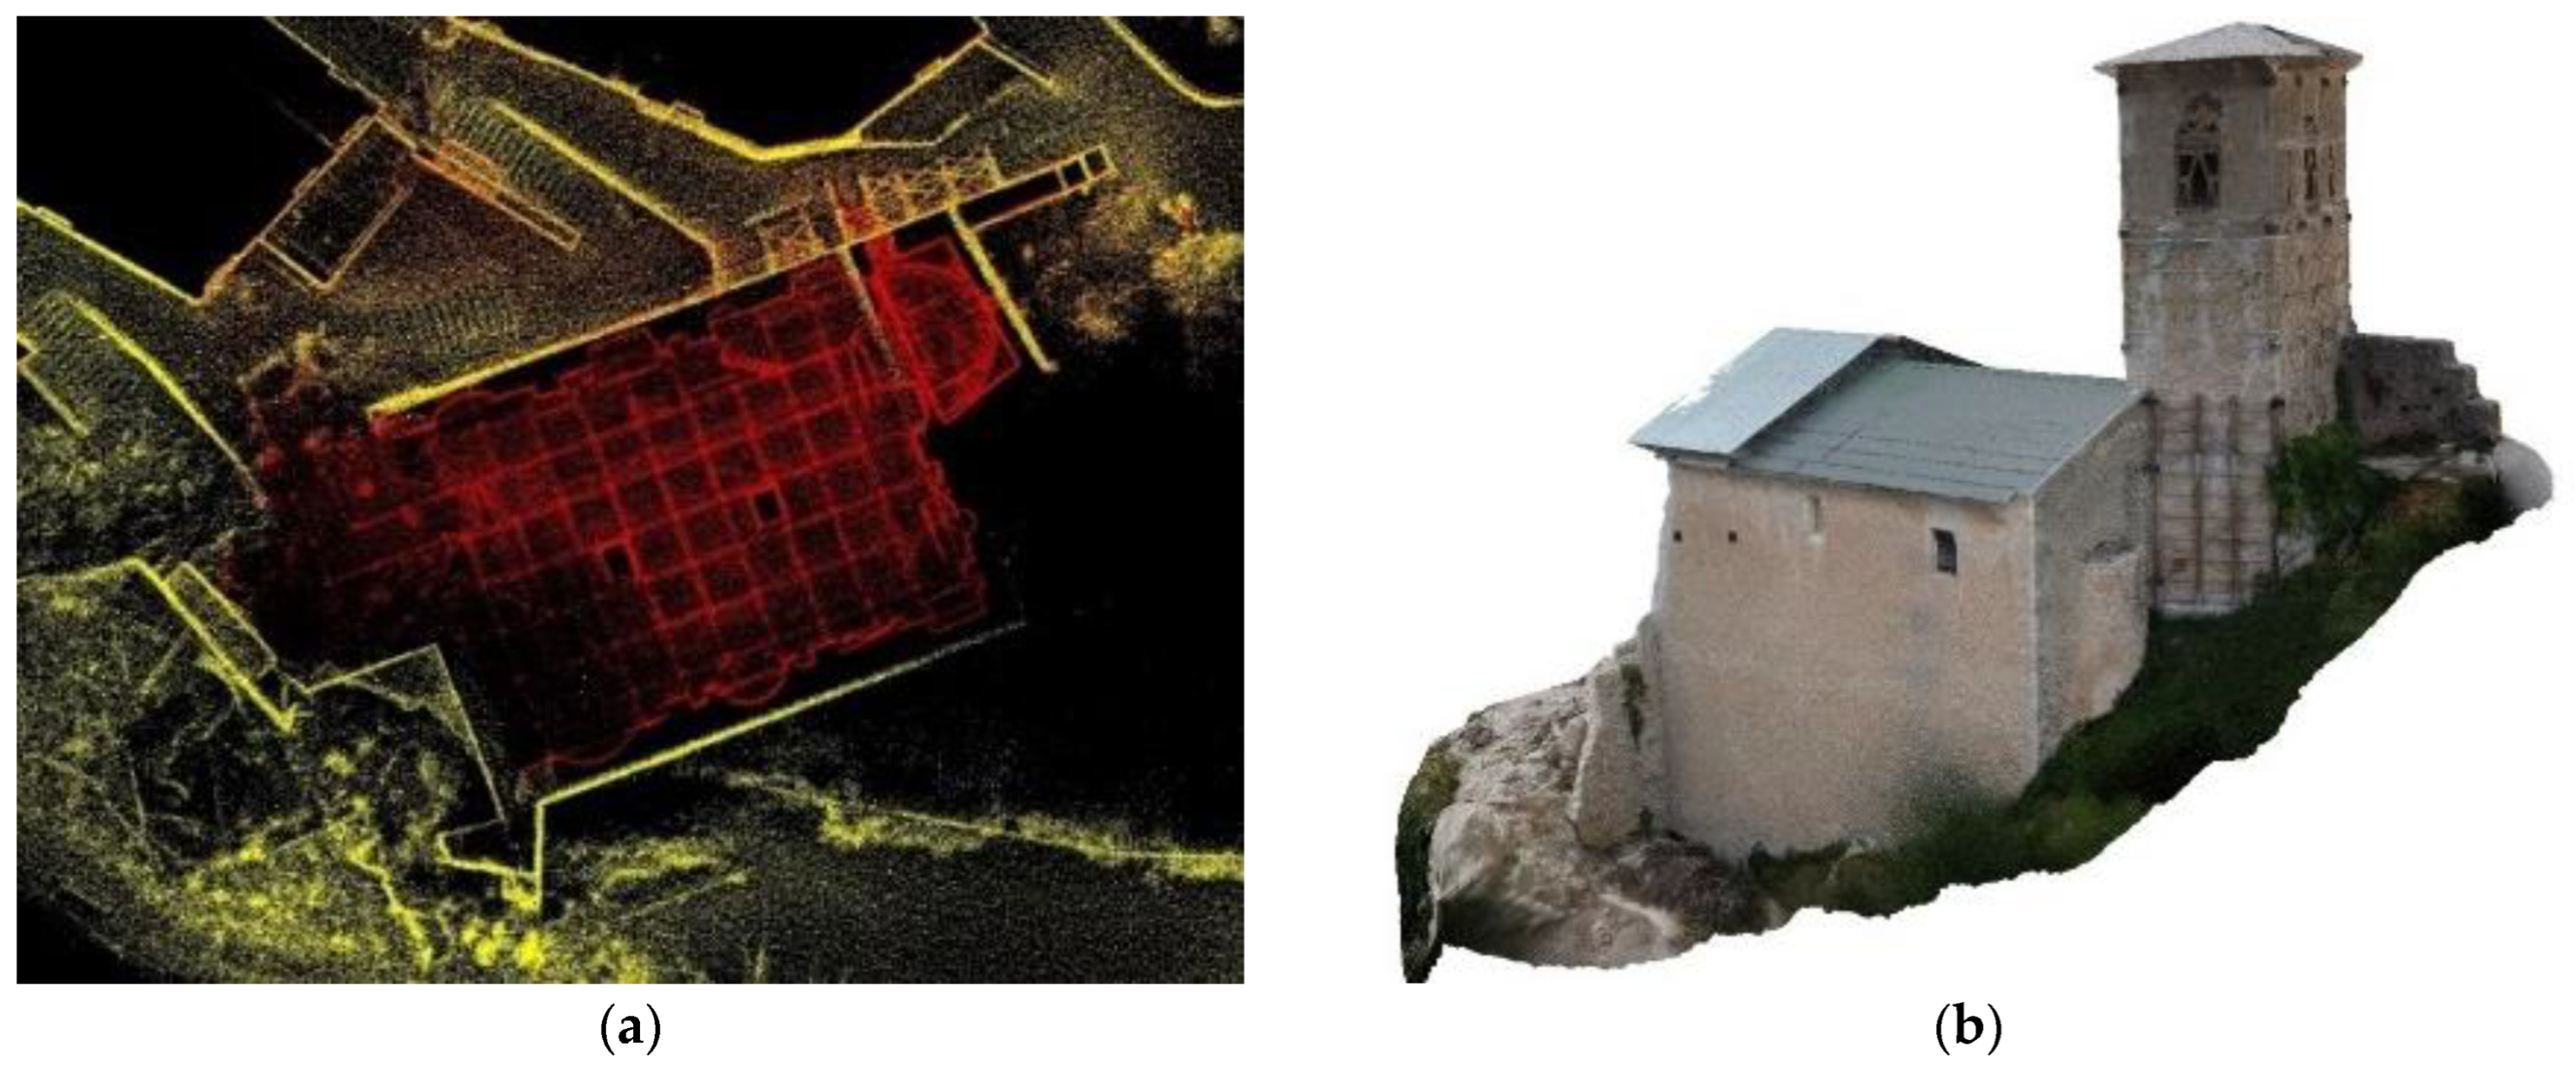
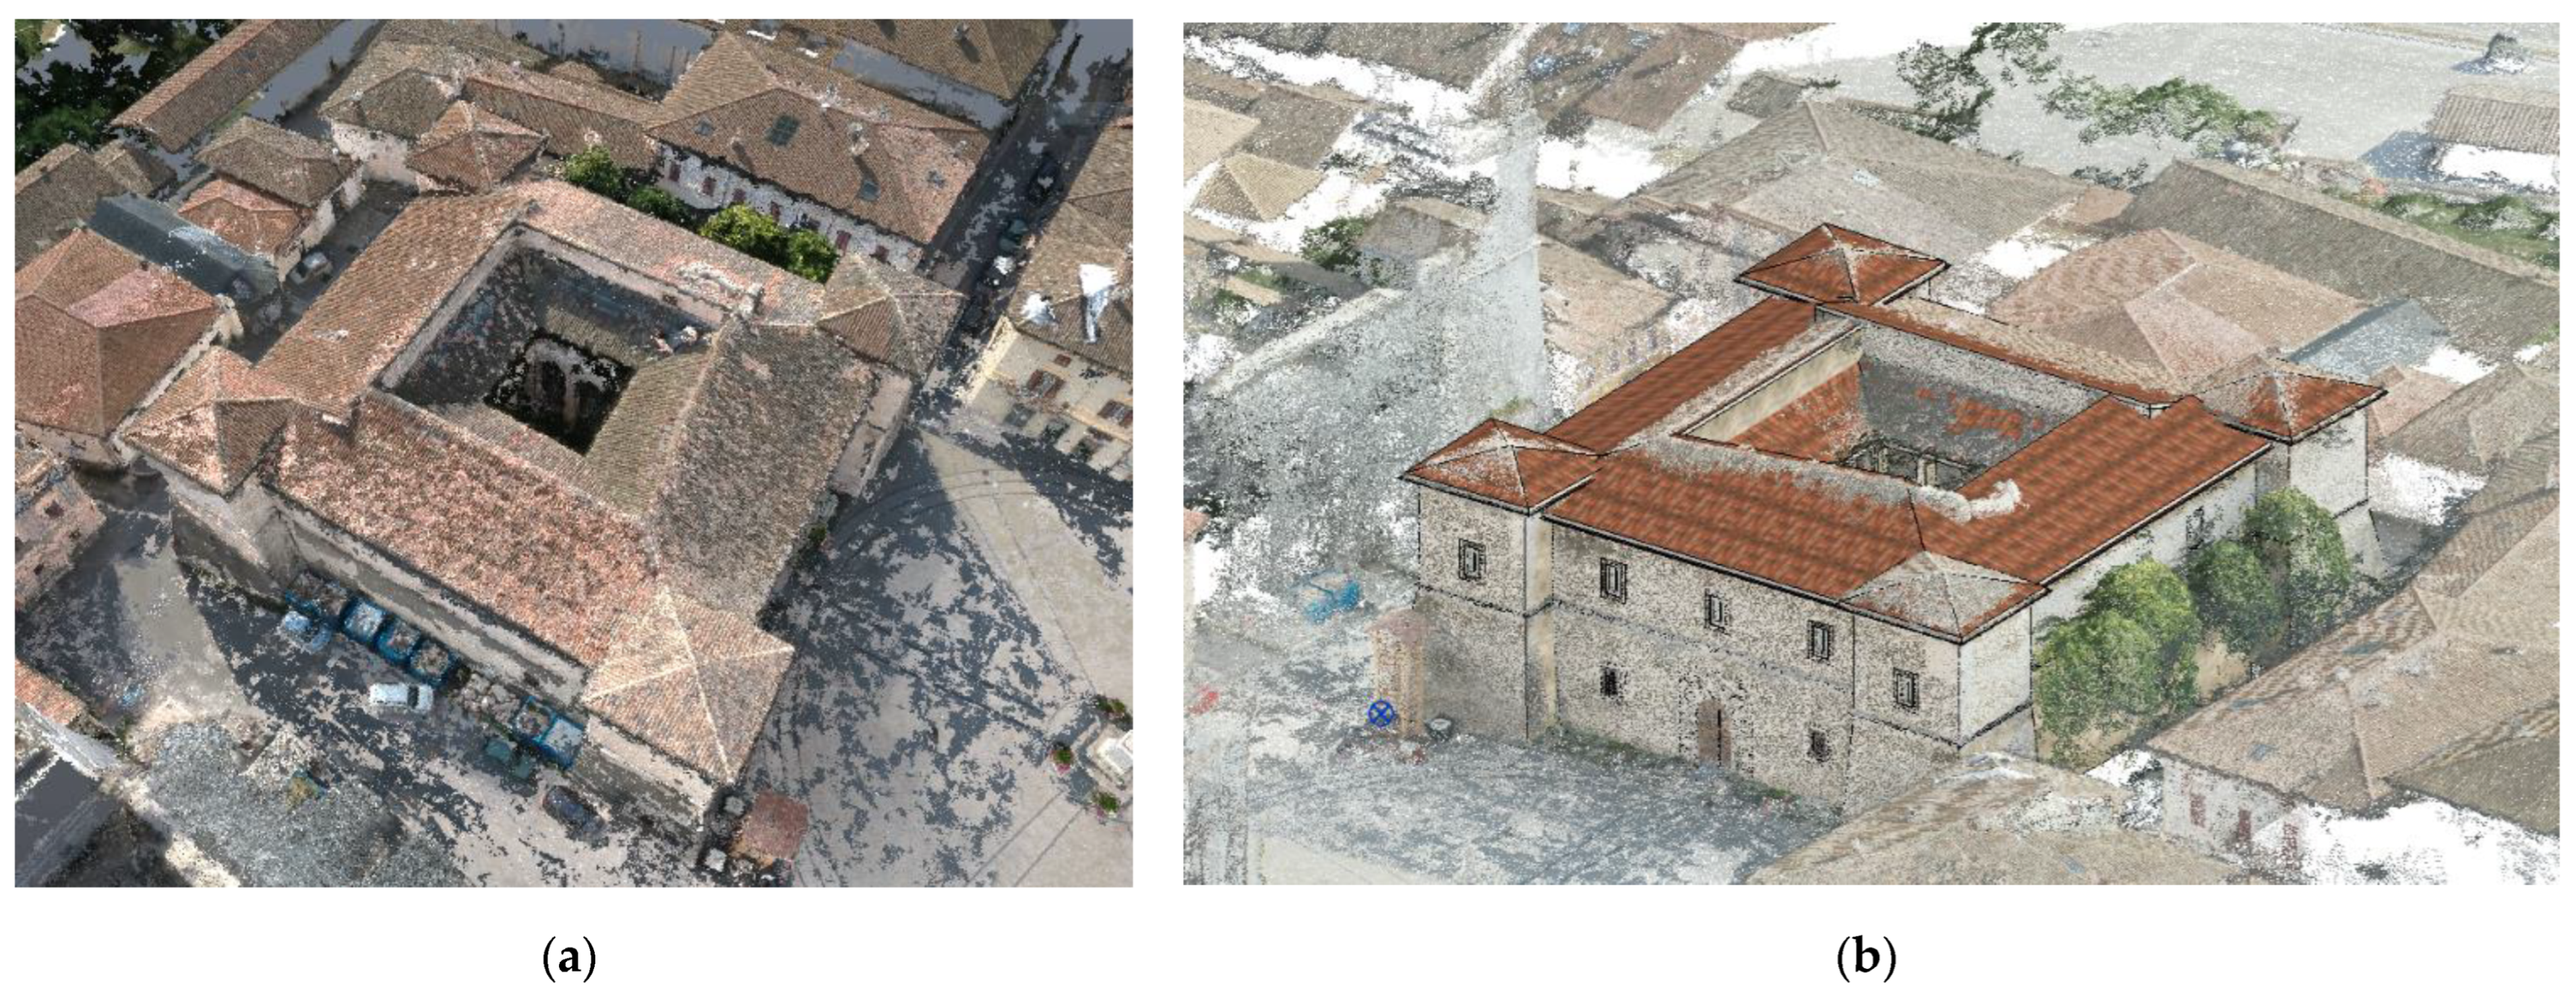
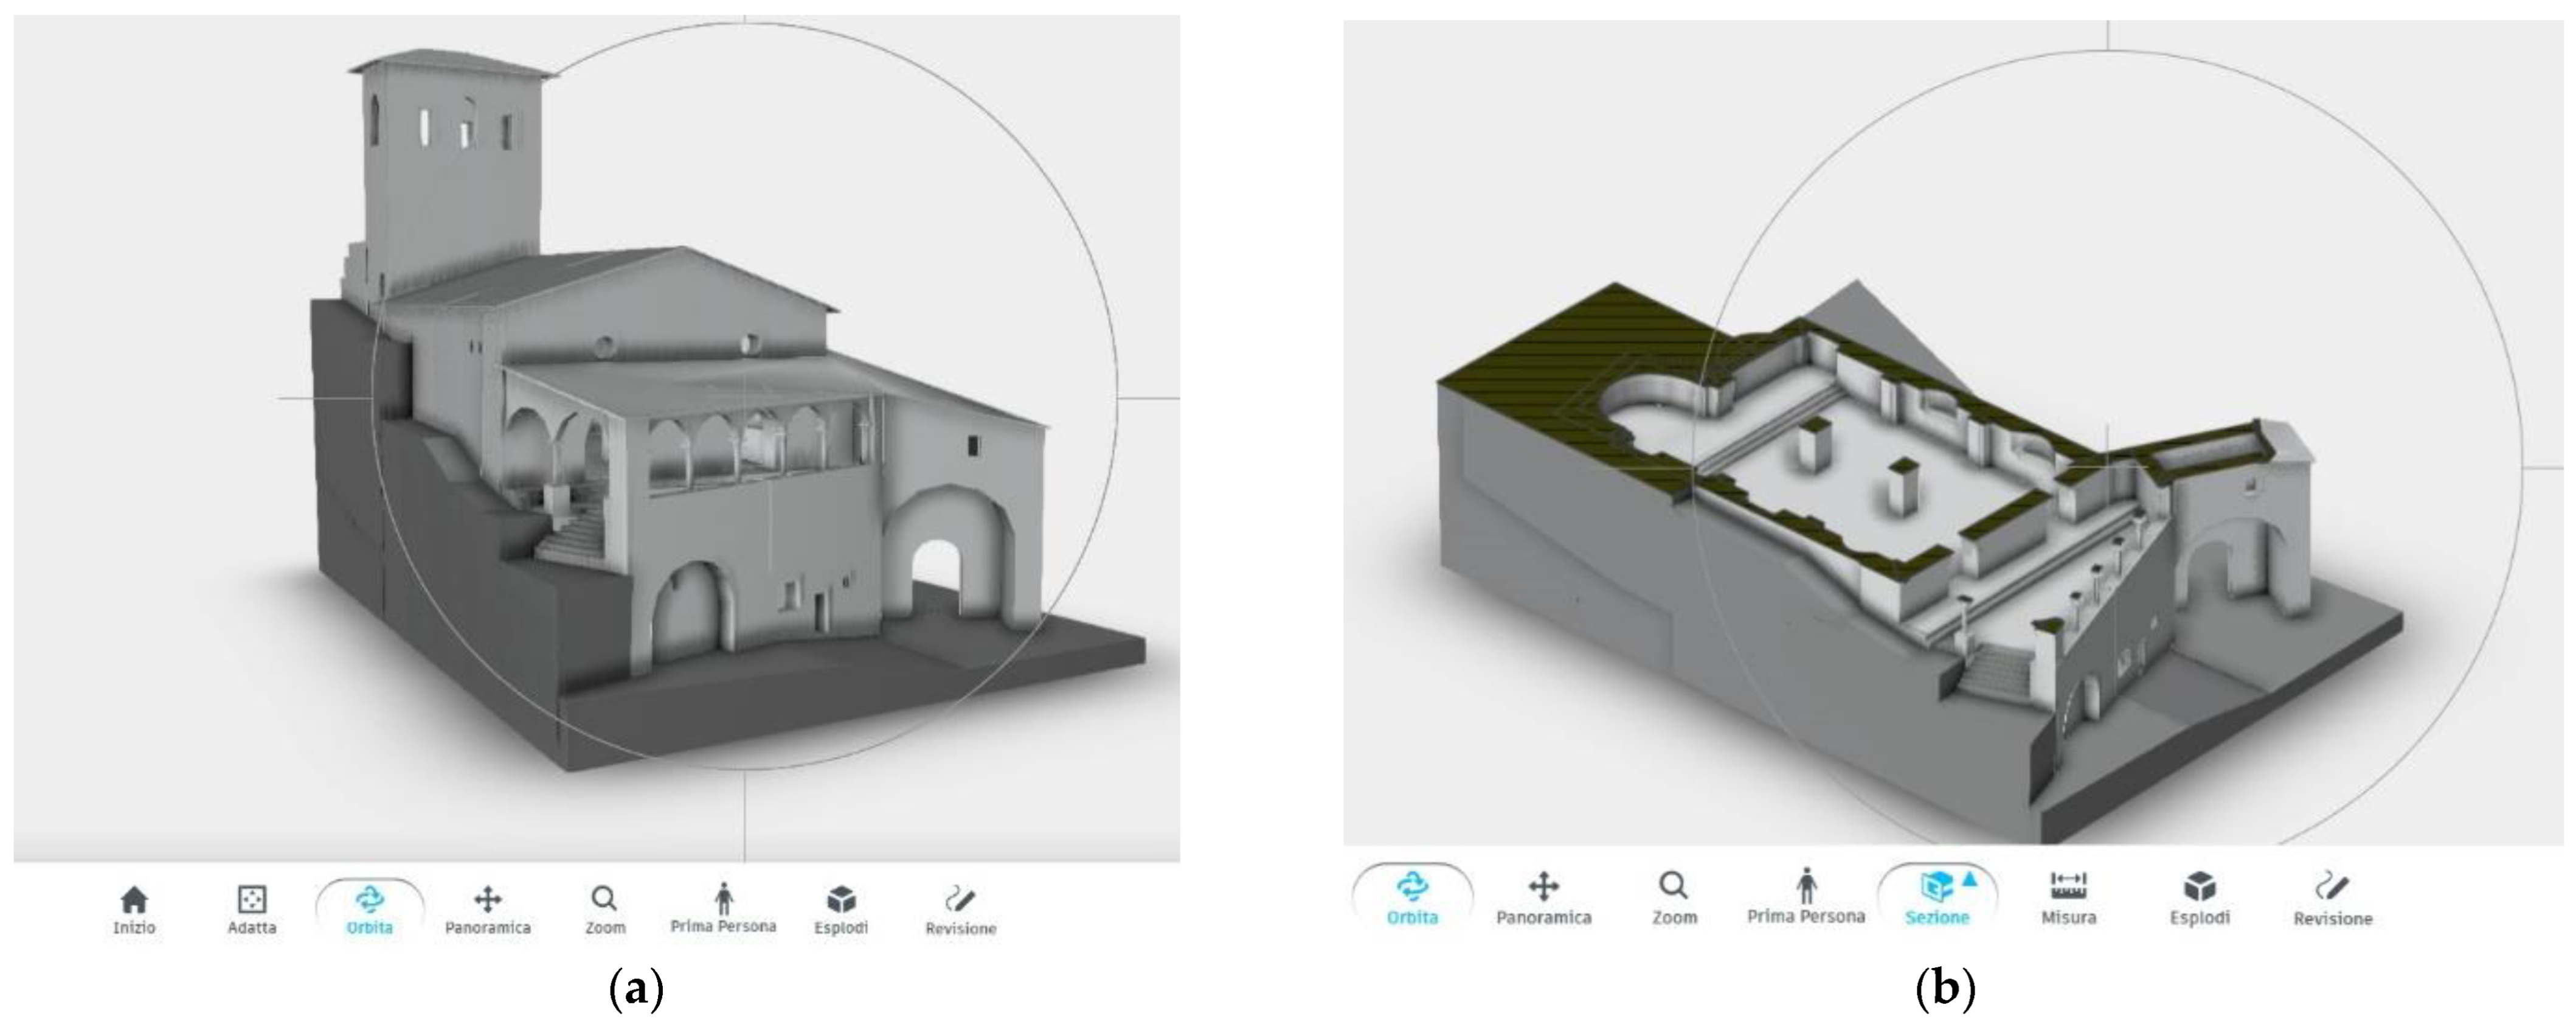
  • Textured 3D mesh models, generated from the transformation of the point cloud, is formed by vertices, which identify edges and faces (Figure 10). In addition, the texture derived from the re-projected frames with metric control can be applied to the external surfaces; the result can be delivered as a 3D parametric model navigable for analysis of the artifact by conservation experts (Figure 11 and Figure 12);
  • The complete 3D volumetric model characterized by simplified geometries allowing the analyses for identifying the conditions of equilibrium (Figure 13).

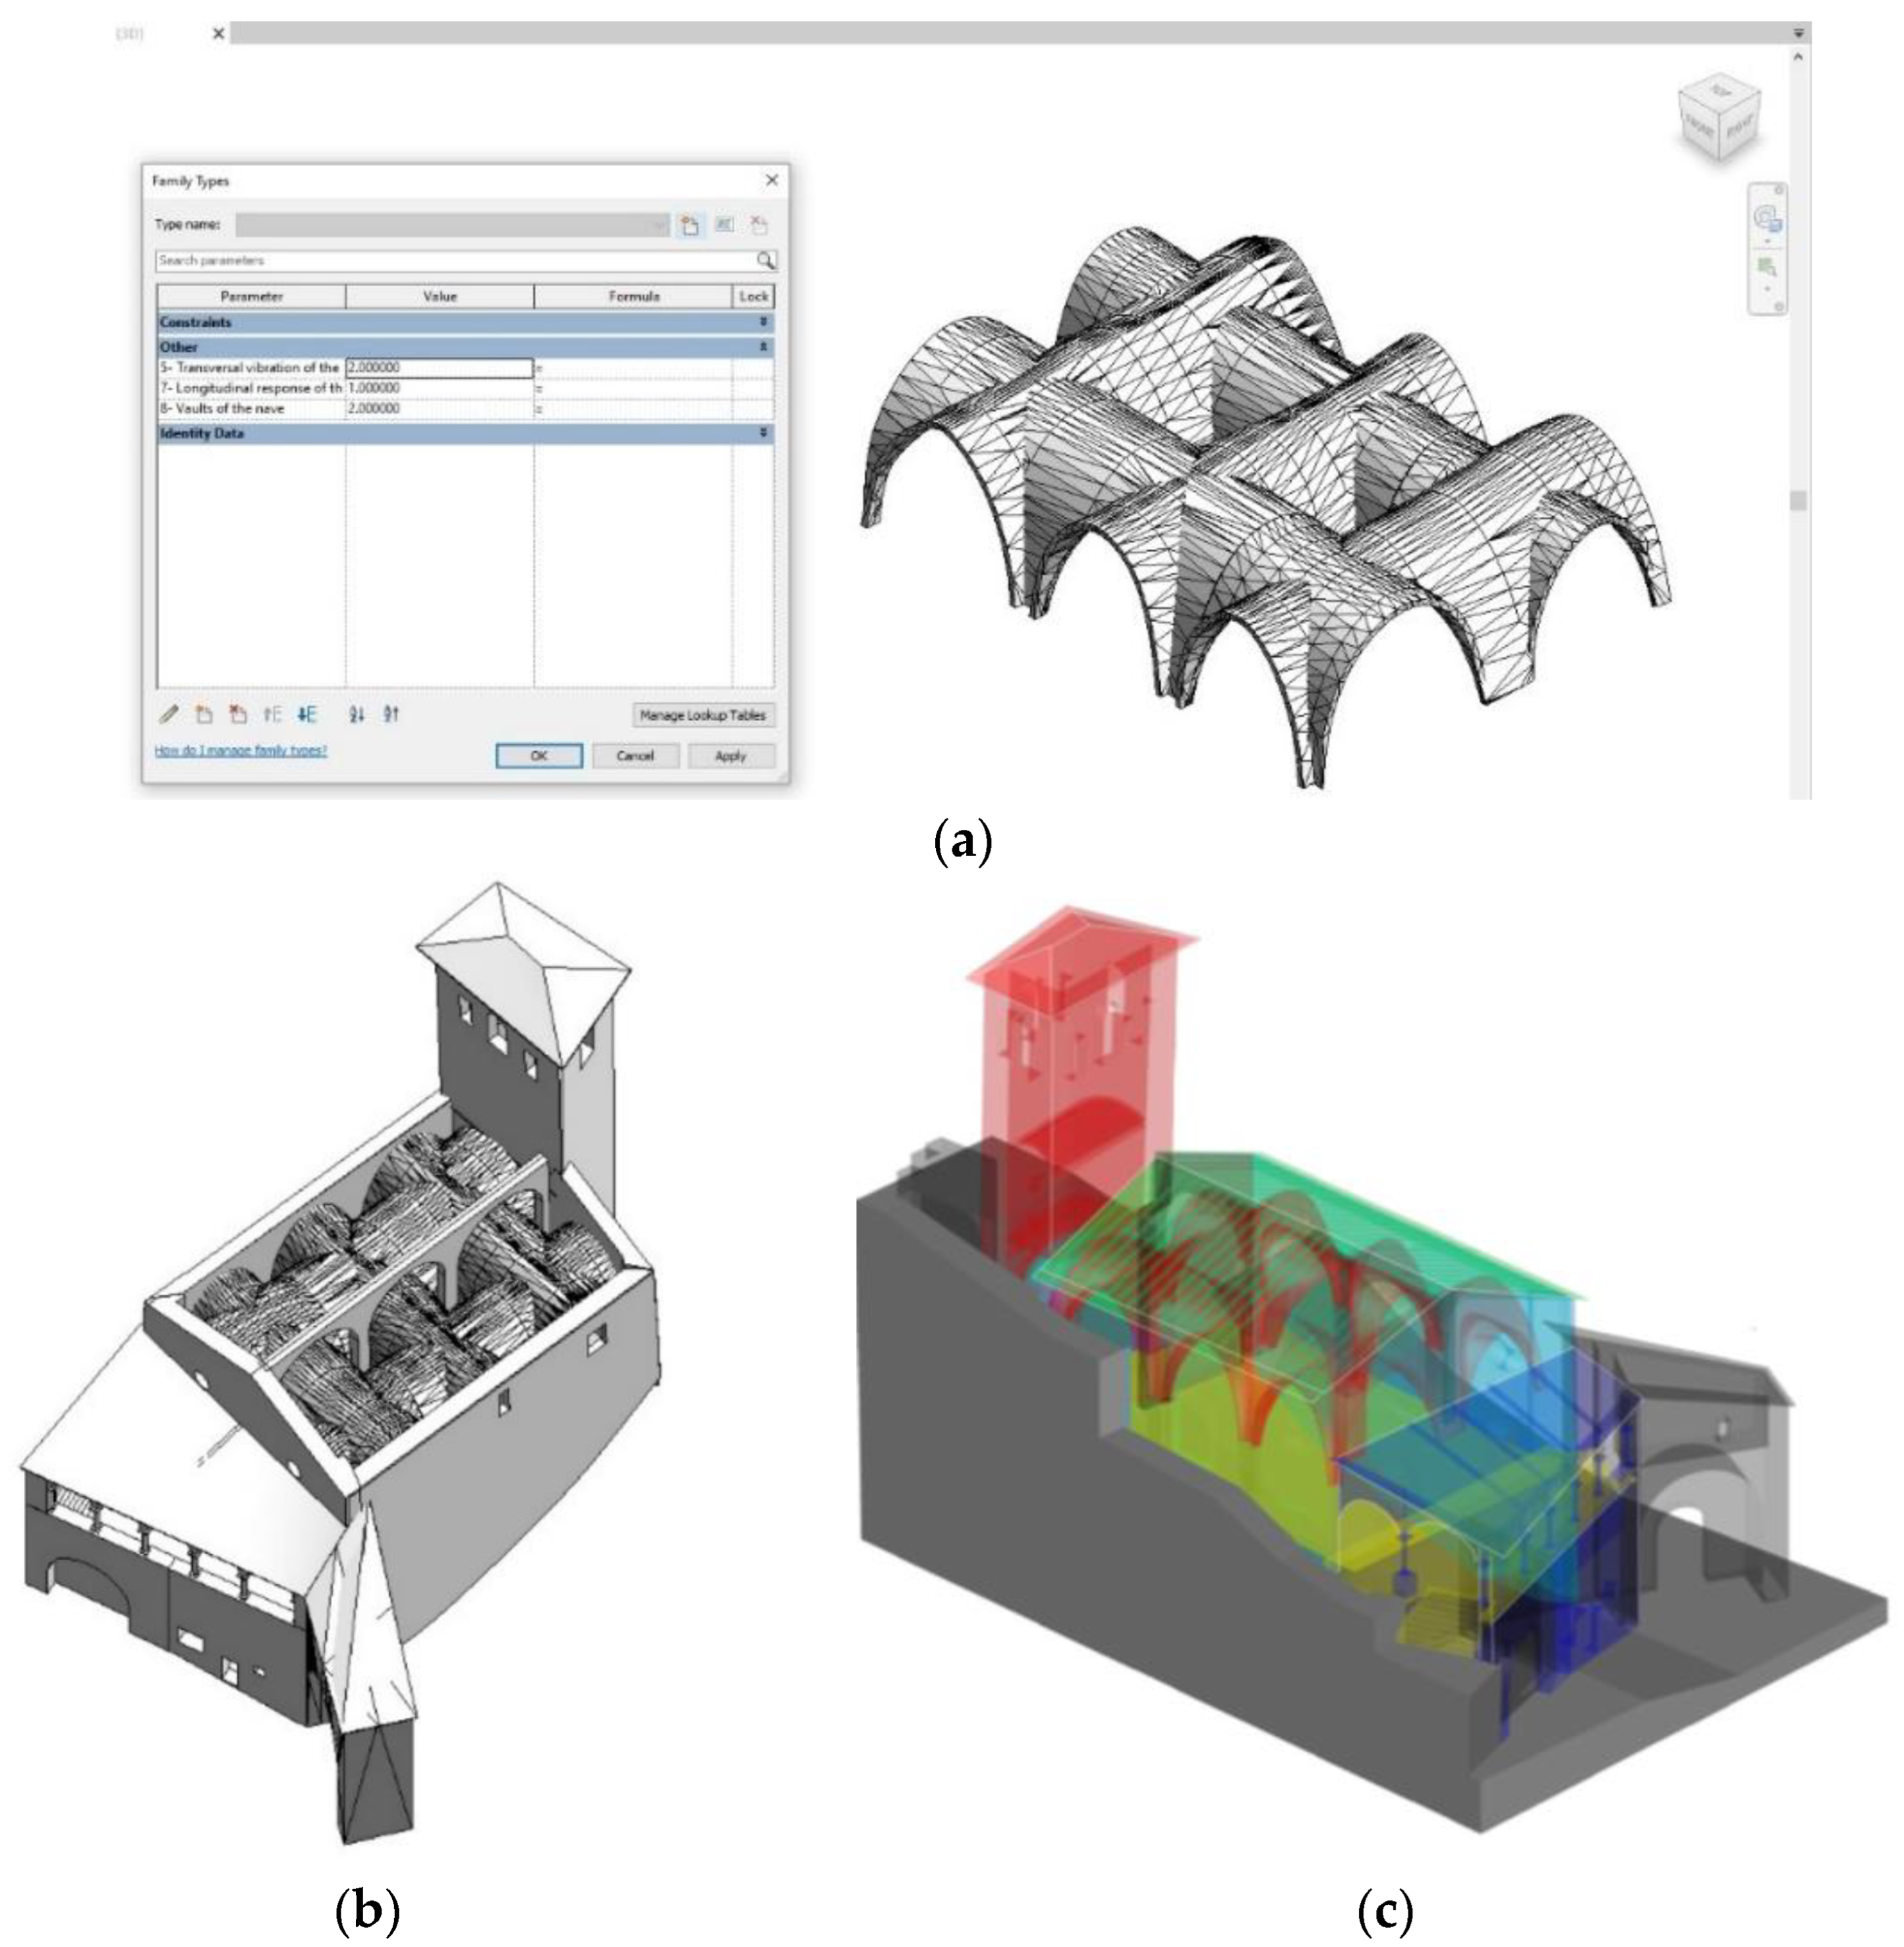
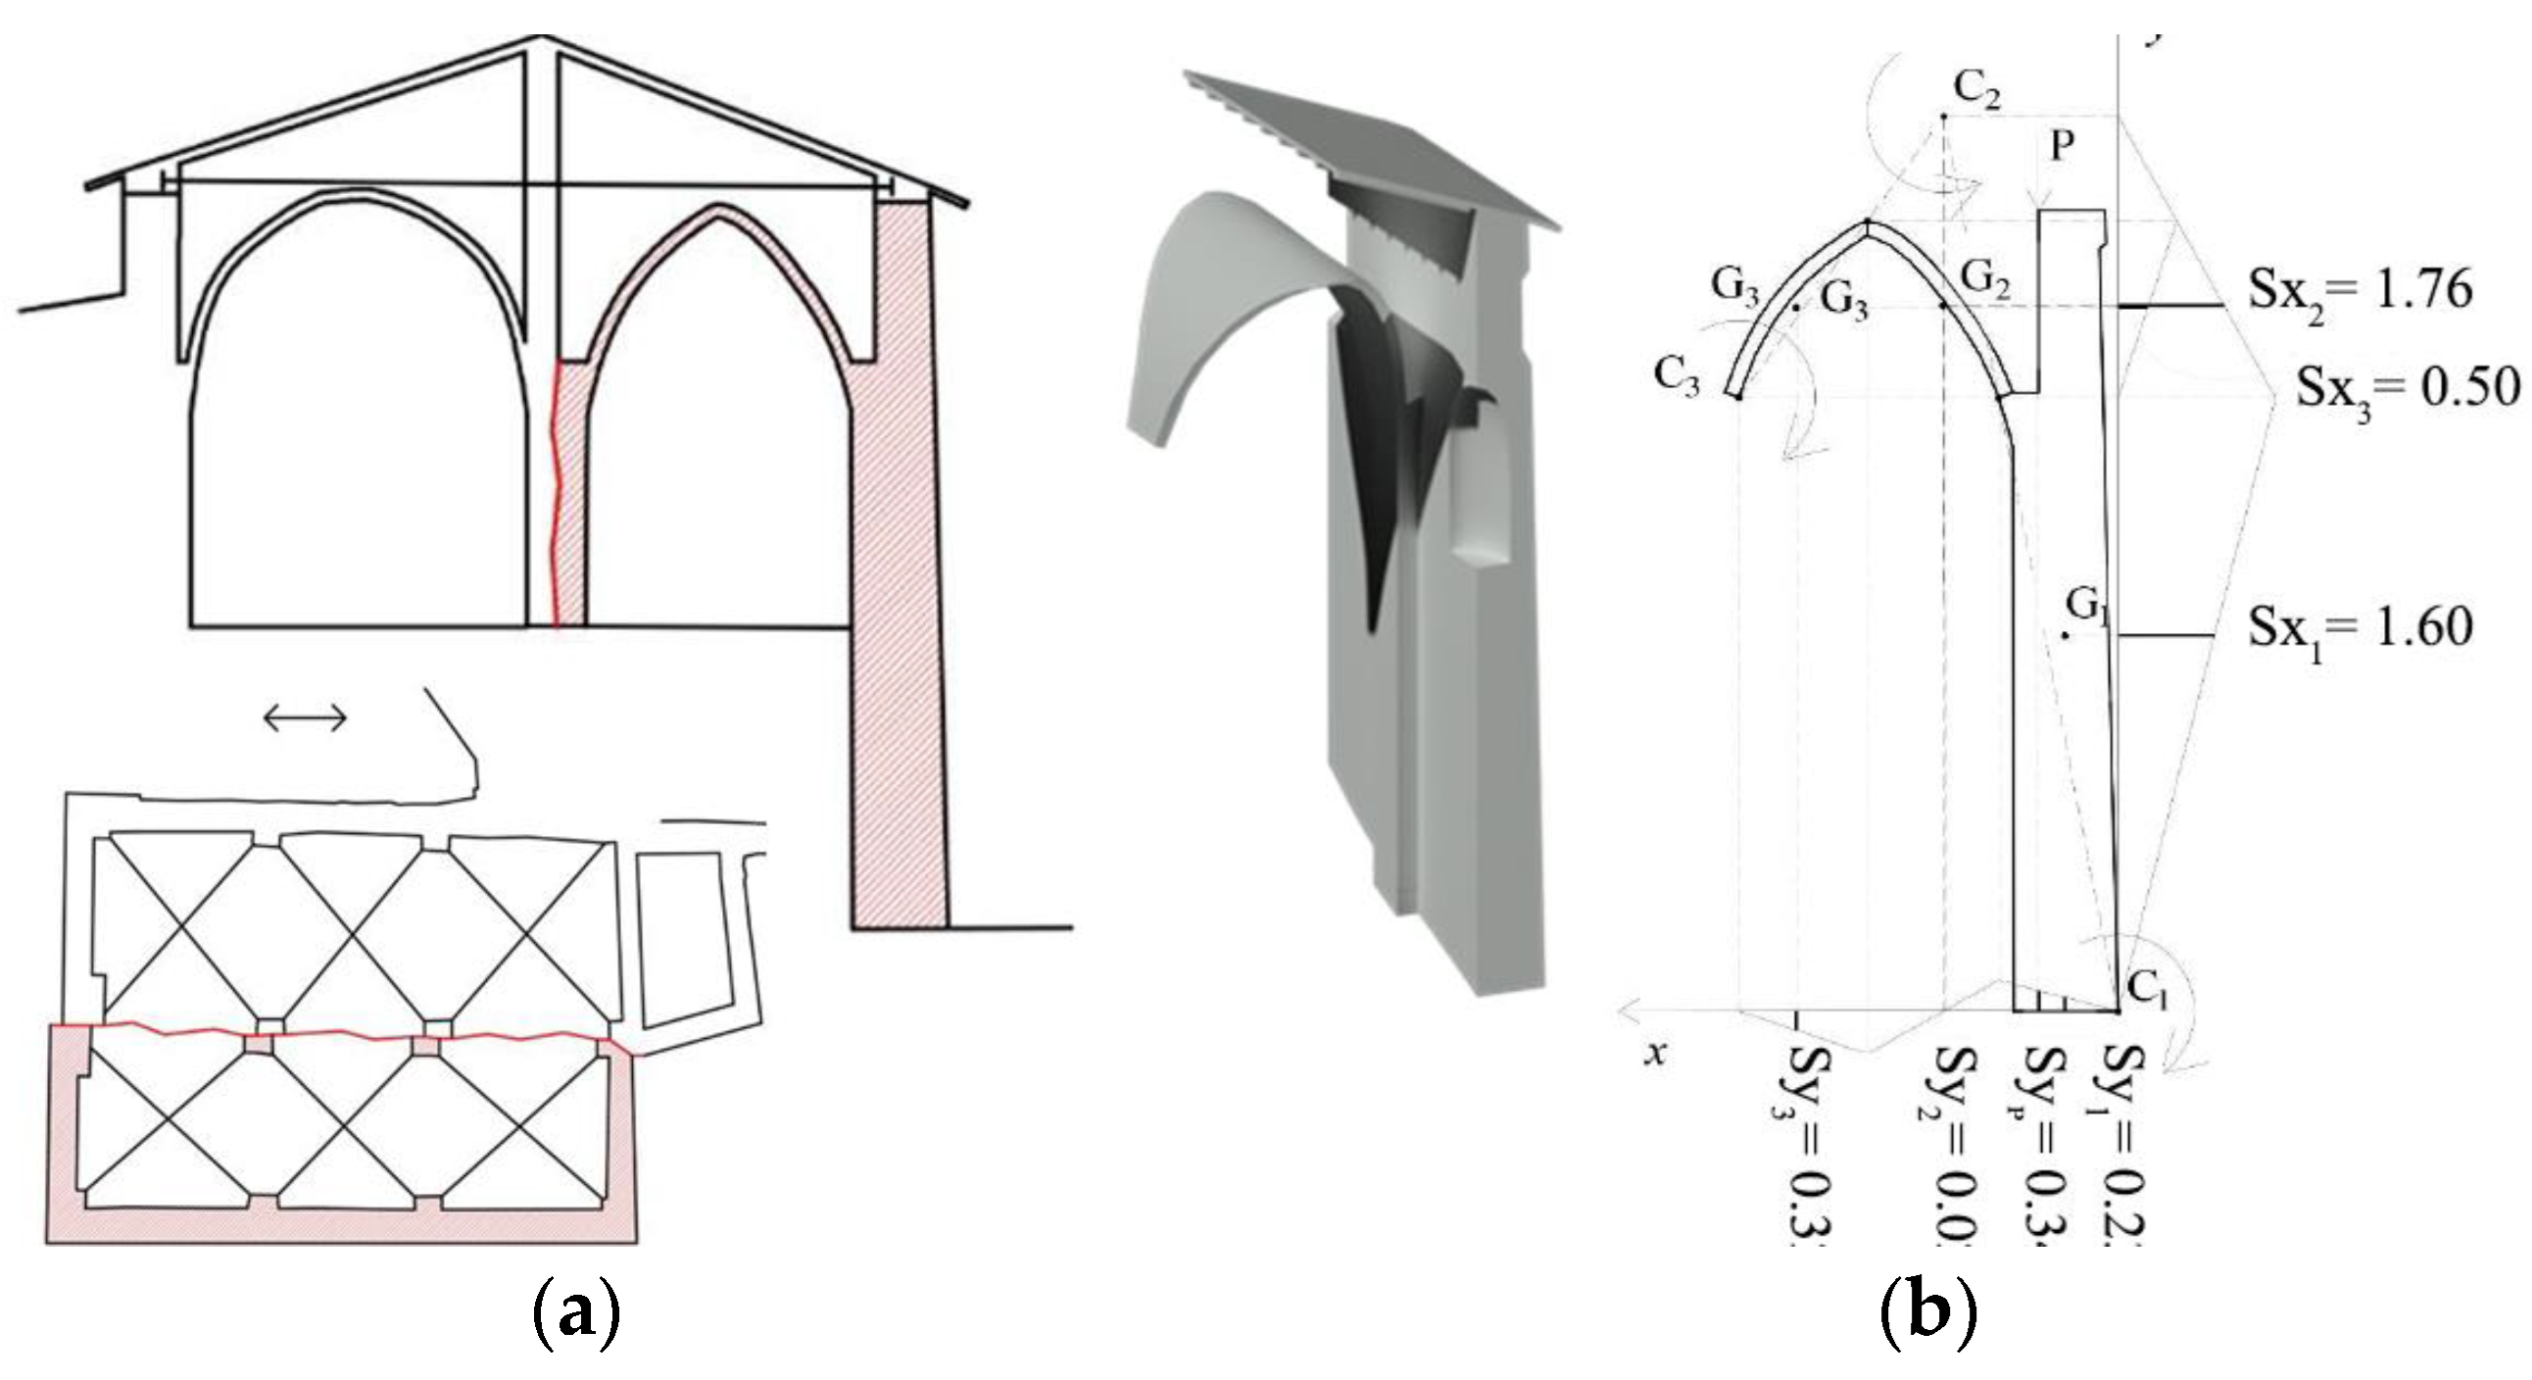
3.3.1. Volumetric Model for the Macro-Elements Analysis

For the macro-elements analysis and related damage mechanisms study, it is very important to define a geometrically accurate 3D model of the pre-earthquake and post-earthquake conditions. Concerning the parts no longer existing, archival data and past surveys available on the church structure, together with current digital measures helped to construct the complete status in a coherent 3D volumetric model.
The first part of the procedure aimed to construct the macroelement-based 3D model, translating the pure raw geometric data (point clouds, mesh), equivocal in their connection relationship or without any classification, into a semantically enriched volumetric object with classified elements that represent the parts of the architectural system, and that have unitary behavior when stressed by the earthquake event (façade, side walls, vaults, etc.). It is important for the mechanical study, that each element will ensure relative connections, also with simplified surfaces approximation, and will carry on the information related to the damage mechanism after the analysis. These were the requirement premises of the generation of the volumetric model, for 1:100 scale detail.
The modeling operation based on point clouds takes place through a shared approach widely diffuse in the literature based on the so-called reverse modeling approach exploiting point cloud data segmentation to derive 3D objects with continuous surfaces [60,61]. The surfaces approximation took place, from an operative point of view, according to a well-known as-built generative process for the reconstruction of structural macroelements with different levels of geometric complexity: walls, vaults, pavements, etc. were segmented. Commonly based on surface interpolation, the volumetric generation of architectural elements aims to achieve a systematic reduction of geometric information, according to specific elements complexity, through the use of profiles or sections or planes recognition and detection from point clouds or intermediate surfaces of the volumes to be modelled (Figure 13). At the same time, the pre-model was defined on the basis of archival drawings and past surveys, used with a metric approach. The model was metrically made consistent and integrated where it was necessary to estimate the missing parts. The detail and scale requirement for the macro-element volumetric model was ensured, with the result in (Figure 13c). The approximation was in the order of magnitude of a few centimeters, allowed by the required scale.
The vaults definition, for example, was based on curvature profiles extraction, and interpolation based on edges (splines) and sub-sampled points of the clouds into NURBS objects. The surface was then extruded for the creation of the volume. CAD-based modelling (Autocad, Rhinoceros) or parametric BIM modelling (Revit) were parallelly employed to generate NURBS or meshes or a vector BIM object. The modeling of volumes was conducted with different approaches according to the grade of generation [62]. Volumes consisting of surfaces that can be approximated to regular surfaces were modelled by extruding the related polygons. The elements were then aggregated into several groups for subdivision into macro-elements.
The final BIM parametric model an be also shared on sharable visualization platforms as the Autodesk Viewer one (Figure 14), an online viewer that allows to perform several operations such as navigating in the 3D space, creating horizontal and vertical sections, measuring the elements, navigating in walk mode as well as selecting the elements to view their properties, such as the macro-element they belong to or hiding some elements/macro-elements for a better understanding of the spatial relationship between them).

3.3.2. 3D Model Validation for Seismic Vulnerability Assessment

The 3D volumetric model, based on macroelements, contributes to the carrying out a more in-depth analysis regarding the indications of the guidelines that suggest the application of a simplified model founded on the cognitive material already at disposal and on the interrogation and visual interpretation as the main instrument of analysis. The church of Sant’Andrea presents the greatest damage in the front portion, due to the total collapse of the façade and the porch, which immediately suggests how the artifact has received longitudinal stress. This hypothesis was consolidated by the analysis of the cracks present on the side walls of the hall and the bell tower.
The investigations on the collapses due to the second seismic event of 30/10/2016 (façade, the first span of vaults, porch and the city gate leaning against the side of the church) were conducted with the aid of textured mesh (Figure 12). This reading mode, through a navigable model, allowed inspection of the damaged portion from different viewpoints. What we can see is a substantial lack of connections between the city gate, the church and the supporting wall of the columns which is leaning against another wall, perhaps of an earlier period. The solidity of the architectural system was compromised by the risk of overturning of the wall on which the columns supporting the roof of the porch, made up of two parts that are not connected to each other. The steel beams anchored to the wall of the façade and introduced in a recent restoration, have aggravated a critical situation that, exposed to the seismic action that has hit the building longitudinally, has determined the overturning of the church façade. The masonry of the façade, with its overturning has dragged with it in the collapse the last span of the arches supporting the ridge with consequent collapse of the last prestressed concrete beams of the roof that have broken through the last span of vaults. On the back of the church (north-west) the longitudinal stress caused little damage since the hall and the major apse are partially against the ground. The aid of the 3D model allowed for the study of the architectural composition of this portion of the church through some sections of the point cloud.
From the two-dimensional drawing, the tower rests on the ground in correspondence of the apse and the south-west wall unloads its weight on the triumphal arch. The arch is in good condition, there are no damage mechanisms, also in consideration of the very solid lateral constraints: to the north against the ground, to the south against a wall panel in good condition. However, the bell tower has a south-ward tilt causing an out-of-plumb corresponding to approximately 28 cm from the base (Figure 15). It is possible to perform further analysis for more accurate documentation of this phenomenon by measuring the distance between the tower mesh surface calculated from point cloud and an extrusion surface along the vertical axe starting from the profile to the base. This situation was not compromised during the 2016 seismic events given the excellent compactness of the tower, which favors a box-like-behavior.

The Directive Method Application: An Example

Hereinafter, the evaluations based on the analysis of the 3D model of the church that supported the calculation with so-called “simplified model” (DPCM 09/02/2011), which provides the identification of macro-elements, the analysis of mechanisms and the assignment of a score related to the probability of their occurrence (from −3, very unlikely to +3, very likely) (Table 4). Although the method application is not reported for the whole building here, it is described as an example for damage mechanism of microelements and related vulnerability values according to (DPCM 09/02/2011).
The quality of the structure does not appear to be very good and the evaluation of the structure using the analysis form returns a negative picture [63]. Table 5 below shows the calculation of other parameters indicated by the directive.
The very high seismic hazard of the area does not allow the achievement of high safety standards, that require an adequate monitoring and design program of new interventions and new verifications. The result related to a nominal life of less than 10 years can therefore be considered seriously insufficient. In fact, the DPCM 09/02/2011 says “Nominal life values greater than 20 years can be considered adequate for a historical building”.
The 3D model also allowed us to carry out, on the most vulnerable macro-elements, a more in-depth analysis, verifying the equilibrium conditions and determining the seismic coefficient useful for the determination of the peak ground acceleration during which the overturning occurred (Figure 16). Two analyses were performed, according to the dynamic analysis in order to determine the forces (virtual work theorem), one for the verification of the south side wall and one for the bell tower (Figure 16) providing the following results Table 6. In a synthetic definition, Figure 16b represents the graphic solution of the combination of forces acting on the elements, where the system in equilibrium is generically defined when the force moments according to the two axes x and y results is 0.

4. Discussion

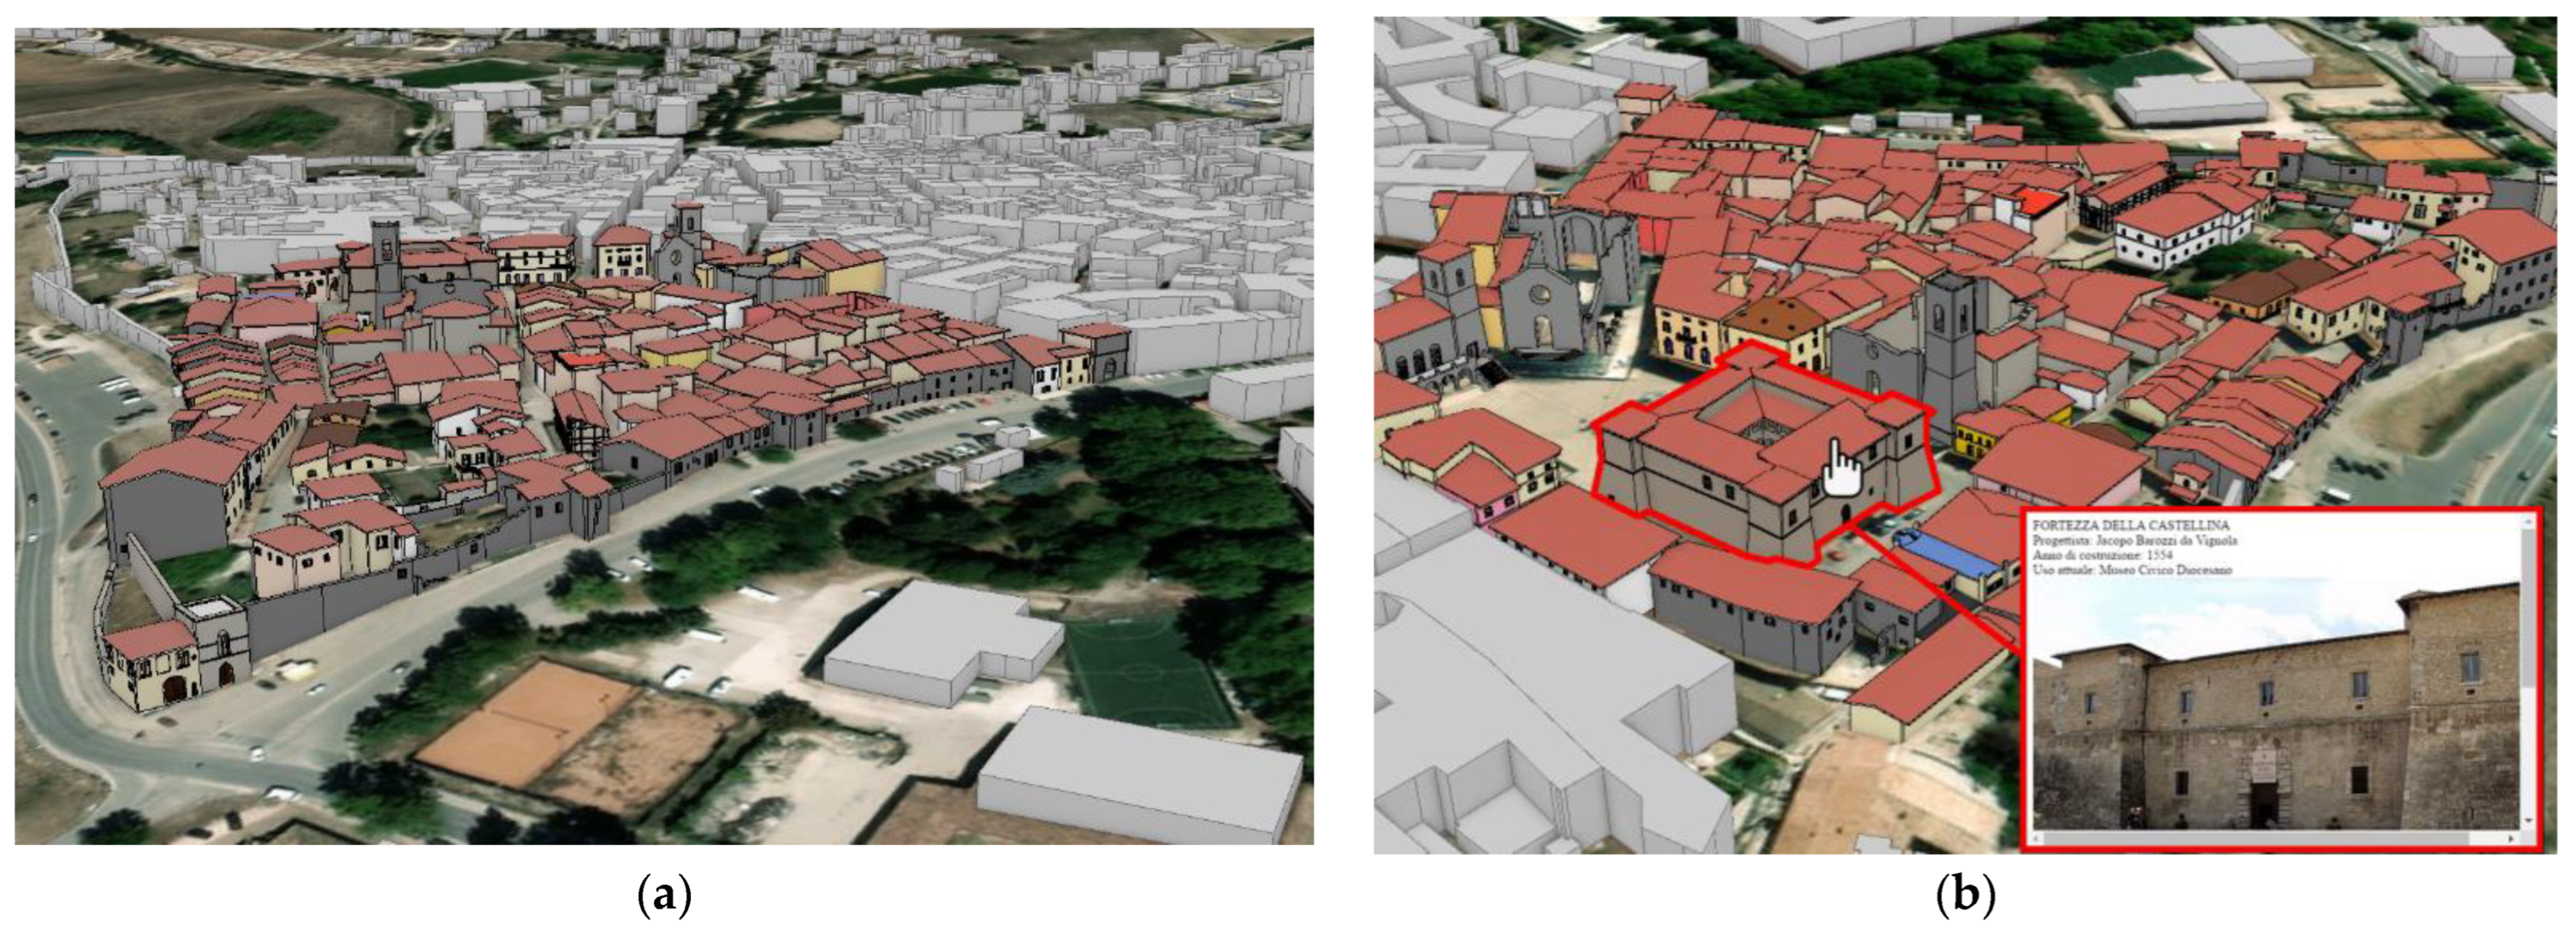
4.1. The User-Fruition Improvement of the Multi-Scale 3D Geodatabase

In the last step, the work presented the validation of the proposed methodological approach that integrates and exploits vulnerability data by multi-scale HBIM models into GIS, using both the desktop version of Geodatabase and webGIS sharing interface (ERSI ArcGIS Pro platform was tested in this phase). Web-based GIS interfaces and integrated interactive dashboards based on AMS platforms (Section 4.3) were tested in order to simulate interaction and make it operational from a user-oriented perspective, and personalized views were created to facilitate asset queries and user navigation. The implementation of a GIS geodatabase sharing interface was presented in the direction of user accessibility to damages and vulnerability analysis data, according to Directive orientation. Regarding the validation of the data storage workflow, the tests were performed on the presented case studies and in other sites with the aim of implementing the geometries derived from the existing cartography and generated from the point cloud with object-oriented modeling. From operative point of view, the ArcGIS Pro software allowed for the import, management and storage of *.IFC BIM models in GIS (e.g., *.rvt Revit files), with excellent performance with Revit models. The 3D geodatabase was enriched by the multi-scale urban models, according to the LoINs and LoDs method already introduced to HBIM building-scale models (masonry buildings, palaces, churches, etc.).
Therefore, in this process, it is essential to specify the expected LoIN, preliminarily defining the purposes in order to clarify the usefulness of sharing this information. To achieve these goals, the geometric, alphanumeric information and the documentation associated with the information models may differ from one object to another. Particularly, in this research, the intention was to transfer the models and embedded semantic information related to damage, to numerical analysis and to the directive knowledge phases supporting vulnerability analysis in a geographical database, in order to connect multiple models belonging to different geographical contests. The examples of Norcia, Campi di Norcia (Figure 17a), Tolentino (Figure 17b) in a territorial scale database were transferred into a ArcGIS Webb App implementation. The enrichment of the 3D geodatabase can improve the possibility to study systematic behaviours of damage mechanisms related to masonry buildings not close to each other in the same seismic area. This can help to guide decision-making processes for establishing strategies of structural strengthening and conservation plans at the geographical scale. In these terms, the results can be interesting from the perspective of allowing digital replicas to effectively be twins of real assets, in an innovative concept of an advanced 3D structure management platform [64]. The discussion is presented at different steps, the case study of Campi di Norcia was proposed for focusing on the 3DGIS LoDs implementation in this case. According to these premises, the evaluation objectives for future perspectives of work were:
-
3D multiscale information structuring according to macroelements and elements;
-
Analysis of geographical scale phenomena according to Directive modules and level of evaluation;
-
Applicability of dashboard interfaces for information querying.

4.2. Applicability of Macroelement Analysis in HBIM-GIS Models for a Geographic Scale Perspective

The volumetric model derived from high-scale geometric survey (presented in Section 3.2.1) is optimized, parametrized with specific geometric and semantic data from directive analysis application (Section 3.2.1) and prepared for integration and sharing in the GIS platform, for the implementation of the Geodatabase, aimed at assessing seismic risk at the territorial level harmonized according to the INSPIRE directive. The research conducted by [12] already introduced, starting from similar assumptions, addressed and validated the possibility of integrating a representation by macro-elements and damage mechanisms of an architectural asset according to the Italian directive of 2011 with INSPIRE standards.
-
The Building object must be characterized by LoD.
-
Macroelements are considered Building Part, defined by INSPIRE as “sub-division of a Building that might be considered itself as a building”.
-
Macroelement names must comply with the AAT Getty Vocabularies for unambiguous definition.
The crucial steps refer to the procedures supporting the vulnerability assessment, developed for Campi di Norcia urban context and specifically for Sant’Andrea church. The presentation of results will follow both the already mentioned LoIN preliminary definition and LoDs hierarchy and will analyze and propose a correlation between current directive tasks and the required information with the 3D geospatial approach and multi-dimensional/multi-temporal analysis. In fact, the Italian directive, regarding the level of expeditious knowledge, provides a well-defined information structure, even if not designed for storage in GIS. It is certainly necessary to develop and implement an accurate 3D approach and a multi-temporal vision of phenomena. As introduced, the required information for approaching directive application was catalogued in different parts (Table 1 and Table 2): from the data useful for the identification of the asset, the geometric model, the semantic and geometric definition of the elements of the structure, and the connection of historical and diagnostic inspection data. Mostly, the LV data concerned the results of the seismic vulnerability analysis (DPCM 9/02/2011).
The level of detail to be associated with the information is a key-step in the LoIN definition process, as it describes the complexity of the information models. In this research, the information was structured in GIS through three different scales, which corresponded to specific expected LoIN. For example, LoD 1-2 supports information A, B and e, F and LV1 (building)-LV2 (macro-elements) were associated; LoD 3 where macro-elements were modelled and damage mechanism information was associated; LoD 4 where all elements were modelled and information C, D, F, G, H were associated and LV2, LV3 results related to structural elements (Table 7).
Moreover, the availability of data acquired by UAV photogrammetry of the urban area of Campi allowed for the modelling in GIS of the urban context in LoD 2 Figure 18a. It was modelled as a DTM, classifying the ground and building from the DSM point clouds by isolating the points that match the 2D shape file of the buildings of Campi from the public WebGIS of Umbria. The LoD 2 buildings modelling can be performed with a special ArcGIS tool that extracts roofs characteristics from point clouds.
The LoD 2, in Figure 18a, can correspond to the geometric survey (E module). Here, the churches model can be consulted at a territorial scale for many analyses, including the ranking of the most at-risk churches.
The LoD 3-4 models information can support the correlation and mapping of past restoration actions and historical and diagnostic investigations, especially from a multi-temporal perspective. The LoD 3, in Figure 18b, of the church model can be consulted either by selecting the macro-elements and displaying the information on the damage mechanisms corresponding to LoIN’s definition, or by a query that, for example, allows for the automatic selection and display of the macro-elements associated with a damage mechanism or, more specifically, if its value is greater than or equal to 2 and therefore associated with a warning. Similarly, the LoD 4, in Figure 18c, church model can be consulted by selecting the elements and displaying the C and D related information. The hierarchical structure of the information within the models, guaranteed by the adoption of a specific LoIN, facilitates the sharing and extraction of selected data useful to meet specific requests.
The model is, besides being a parametric BIM model, is externally connected, and available for the design of works aimed at improving the seismic safety of the church.
Experiments involving the construction of the GIS platform also included the integration of two other architectural-scale models of the churches of San Lorenzo in Norcia and the Basilica of San Nicola in Tolentino with the same semantic structure. The 3D models of the churches, already available, were prepared for inclusion in this data storage system on three levels, and shared parameters. (Figure 18). The interests regard the feasibility of this method, emphasizing the possibility of building this database using also already available data and at the same time implementing it with new information are available at different levels of detail.

4.3. Future Perspectives on Data Readiness by AMS Interfaces

The final part of the research was the finalization of the model usability with a simulation of a user-oriented 3D geodatabase in a web-GIS environment exploiting an effective AMS interface potential, in the direction of investigating data readiness and enlarged serviceability to heritage- and risk-related users.
The greatest benefit of using this sort of platform lies in the possibility of managing a geodatabase, with a large amount of heterogeneous data (e.g., geometric, semantic) as the one that have been implemented in this research, within a single 3D GIS environment and customizing interaction interfaces (e.g., 3D maps, active dashboards, tables, etc.). For this purpose, the software ArcGIS Pro connects the entire 3D geodatabase project and online web-GIS environment (ArcGIS webApp previously introduced) to dedicated valuable instruments and tools of business intelligence (BI) technology to support strategic decisions. To achieve this goal, the software Microsoft Power BI®, internationally recognized as one of the most suitable software programs for its ability to manage large quantities of data [65], was chosen and preliminarily tested. In fact, such a tool helped to develop interactive and comprehensive dashboards connected to the 3D geodatabase and to other related data, aimed at facilitating the visualization and analysis of information. In this case the tested dashboard was associated with the multi-scale LoDs-based 3D geodatabase of historical centres contexts, including their HBIM objects concerned with the heritage of masonry churches at risk. As foreseen from the multiscale approach of this project, data can be analysed at diverse levels of detail, in order to generate several dashboards and analyzes at various scales (multiscale approach), ranging from the damage mechanism of macro-elements to that associated with single architectural elements.
The reported dashboard (Figure 19a,c), being significant and capable of demonstrating the potential linked to BI technology, was designed in order to visualize the damage mechanism of macro-elements concerning S. Andrea’s Church, at a single building level. It displays interactive customizable contents (e.g., 2D image, maps, graphs, etc.) enable the BIM model of the church to be filtered by macro-elements, which are identified by different clickable areas. By clicking and querying them, data can be filtered or aggregated, and key performance indicators (KPI) interactively change with maps, tables, bar graphs and damage mechanisms images. Particularly, once selected, the building or the macro-element (Figure 19b,d), or single element, it is possible to see the associated information, as the damage mechanism, an explanatory image of this mechanism and the relative vulnerability index, allowing the user to immediately recognize the likelihood that this phenomenon could be injurious or less. Considering the 2D image querying, one of the future developments of this research is linked to the implementation of 3D BIM models that can be navigated and interrogated directly within the dashboard toolbox. In this regard, as the state of the art, there are different plugins able to satisfy this purpose in this environment, in order to visualize both the GIS (from ArchGIS, Maps resources, etc.) and BIM (from Autodesk Revit, etc.) model geometry and data in Microsoft Power BI. An example is represented by the 3DBI plugin, developed by KG-dev, which enable to navigate the BIM model within the dashboard and to query each element of the model through simple clicks, in order to immediately see the information relating to them and carry out different types of analyses through KPIs, graphs, maps and tables.

5. Conclusions

In conclusion, the data archiving strategies in integrated BIM-GIS presented in this paper, make it ultimately possible to analyze, manage, view, share and exchange data of different nature (geometric, semantic), contributing to the achievement of efficient and sustainable management of resources.
Considering the nature of these databases that usually result from different databases sources and are based on non-homogeneous languages and data models, which complexifies their management and usability, it is essential to manage the large and heterogeneous amount of data in an efficient, standardized and adaptable manner. A lesson learned long ago foresees the information organized in shared classification modes and archived according to pre-established rules and standards.
The data structuring phase undoubtedly represents a fundamental part of the process, as it consists of information organization operations through the collection of material, coding, cataloguing, processing, and analysis.
The generation of structured geodatabases enable the management of the information they contain in an organic and functional way. In this sense, AMS platforms with customizable dashboard interface, promote this type of process, allowing analyses at different scales and ensuring transversal data reading/analysis, under a crucial perspective to analyze the seismic events and related behaviors as a preventive strategy, facilitating information management, analysis, and decision-making processes.
Managing data relating to the detection of damage and vulnerability, from a geo-spatial point of view enables the observation of phenomena based on the territory implied, with a holistic approach, in a systemic manner and through a multi-scale approach that fundamentally relates individual behavior to that of others, and is perhaps an effective perspective for territorial heritage protection.

Author Contributions

Conceptualization, A.S. and G.S.; methodology, A.S. and G.S.; software, M.A. and E.F.; validation, G.S., M.A. and E.F.; investigation, A.S., G.S. and M.A.; data curation, M.A. and E.F.; writing—original draft preparation, A.S., G.S., M.A. and E.F.; writing—review and editing, A.S. and G.S.; supervision, A.S. All authors have read and agreed to the published version of the manuscript.

Funding

This research is conducted under the funding of Politecnico di Torino Task Force for the 2016 Earthquake, whose overall work was published in [24].

Acknowledgments

A sincere thanks to the municipality and the populations of Norcia, Tolentino and the other cities involved in the recognition activities who hosted us. Particular attention was paid to the collaboration with the Superintendency, Archaeology, Fine Arts and Landscape of Umbria and Marche. Finally a particular consideration to the firefighters corps and the UAV-experts core. A truthful gratitude to all the DIRECT Team of Politecnico di Torino, tutors and students involved, with whom the collaborative work was so interesting and fruitful from a scientific and human point of view.

Conflicts of Interest

The authors declare no conflict of interest.

References

  1. Stewart, J.P.; Zimmaro, P.; Lanzo, G.; Mazzoni, S.; Ausilio, E.; Aversa, S.; Bozzoni, F.; Cairo, R.; Capatti, M.C.; Castiglia, M.; et al. Reconnaissance of 2016 Central Italy Earthquake Sequence. Earthq. Spectra 2018, 34, 1547–1555. [Google Scholar] [CrossRef]
  2. Ferreira, T.M.; Mendes, N.; Silva, R. Multiscale Seismic Vulnerability Assessment and Retrofit of Existing Masonry Buildings. Buildings 2019, 9, 91. [Google Scholar] [CrossRef]
  3. Zlatanova, S. SII for Emergency Response: The 3D Challenges. Proc. XXI ISPRS Congr. 2008, XXXVII, 1631–1638. [Google Scholar]
  4. Romis, F.; Caprili, S.; Salvatore, W.; Ferreira, T.M.; Lourenço, P.B. Seismic Vulnerability Assessment of Historical Urban Centres: The Case Study of Campi Alto Di Norcia, Italy. Int. Arch. Photogramm. Remote Sens. Spat. Inf. Sci. 2020, XLIV-M-1–2020, 885–892. [Google Scholar] [CrossRef]
  5. Romis, F.; Caprili, S.; Salvatore, W.; Ferreira, T.M.; Lourenço, P.B. An Improved Seismic Vulnerability Assessment Approach for Historical Urban Centres: The Case Study of Campi Alto Di Norcia, Italy. Appl. Sci. 2021, 11, 849. [Google Scholar] [CrossRef]
  6. Grazzini, A.; Chiabrando, F.; Foti, S.; Sammartano, G.; Spanò, A. A Multidisciplinary Study on the Seismic Vulnerability of St. Agostino Church in Amatrice Following the 2016 Seismic Sequence. Int. J. Archit. Herit. 2020, 14, 885–902. [Google Scholar] [CrossRef]
  7. Fernandez Galarreta, J.; Kerle, N.; Gerke, M. UAV-Based Urban Structural Damage Assessment Using Object-Based Image Analysis and Semantic Reasoning. Nat. Hazards Earth Syst. Sci. 2015, 15, 1087–1101. [Google Scholar] [CrossRef]
  8. Calantropio, A.; Chiabrando, F.; Sammartano, G.; Spanò, A.; Teppati Losè, L. UAV strategies validation and remote sensing data for damage assessment in post-disaster scenarios. ISPRS-Int. Arch. Photogramm. Remote Sens. Spat. Inf. Sci. 2018, 42, 121–128. [Google Scholar] [CrossRef]
  9. Duarte, D.; Nex, F.; Kerle, N.; Vosselman, G. Towards a More Efficient Detection of Earthquake Induced Façade Damages Using Oblique UAV Imagery. ISPRS-Int. Arch. Photogramm. Remote Sens. Spat. Inf. Sci. 2017, 42, 93–100. [Google Scholar] [CrossRef]
  10. Ajmar, A.; Boccardo, P.; Tonolo, F.G. Mappatura Speditiva Dei Danni Da Immagini Satellitari a Supporto Della Risposta All’ Emergenza Satellite Based Rapid Mapping to Assess Damages in Support of Emergency Management. ATTI E Rass. Tec. 2019, LXXIII, 32–40. [Google Scholar]
  11. Redweik, P.; Teves-Costa, P.; Vilas-Boas, I.; Santos, T. 3D City Models as a Visual Support Tool for the Analysis of Buildings Seismic Vulnerability: The Case of Lisbon. Int. J. Disaster Risk Sci. 2017, 8, 308–325. [Google Scholar] [CrossRef]
  12. Colucci, E.; Noardo, F.; Matrone, F.; Spanò, A.; Lingua, A. High-Level-of-Detail Semantic 3D GIS for Risk and Damage Representation of Architectural Heritage. Int. Arch. Photogramm. Remote Sens. Spat. Inf. Sci.-ISPRS Arch. 2018, 42, 177–183. [Google Scholar] [CrossRef] [Green Version]
  13. Banfi, F. BIM orientation: Grades of generation and information for different type of analysis and management process. ISPRS-Int. Arch. Photogramm. Remote Sens. Spat. Inf. Sci. 2017, 42, 57–64. [Google Scholar] [CrossRef]
  14. Directive 2007/2/EC Establishing an Infrastructure for Spatial Information in the European Community (INSPIRE); 2007. Available online: http://inspire.ec.europa.eu/documents/directive-20072ec-european-parliament-and-council-14-march-2007-establishing (accessed on 27 January 2023).
  15. Logothetis, S.; Delinasiou, A.; Stylianidis, E. Building Information Modelling for Cultural Heritage: A Review. ISPRS Ann. Photogramm. Remote Sens. Spat. Inf. Sci. 2015, 2, 177–183. [Google Scholar] [CrossRef]
  16. Volk, A.R.; Stengel, J.; Schultmann, F. Building Information Modeling (BIM) for Existing Buildings—Literature Review and Future Needs. Autom. Constr. 2014, 38, 109–127. [Google Scholar] [CrossRef]
  17. Noardo, F.; Krijnen, T.; Arroyo Ohori, K.; Biljecki, F.; Ellul, C.; Harrie, L.; Eriksson, H.; Polia, L.; Salheb, N.; Tauscher, H.; et al. Reference Study of IFC Software Support: The GeoBIM Benchmark 2019—Part I. Trans. GIS 2021, 25, 805–841. [Google Scholar] [CrossRef]
  18. Noardo, F.; Arroyo Ohori, K.; Biljecki, F.; Ellul, C.; Harrie, L.; Krijnen, T.; Eriksson, H.; van Liempt, J.; Pla, M.; Ruiz, A.; et al. Reference Study of CityGML Software Support: The GeoBIM Benchmark 2019—Part II. Trans. GIS 2021, 25, 842–868. [Google Scholar] [CrossRef]
  19. Billen, R.; Zlatanova, S. 3D Spatial Relationships Model: A Useful Concept for 3D Cadastre? Comput. Environ. Urban Syst. 2003, 27, 411–425. [Google Scholar] [CrossRef]
  20. Atazadeh, B.; Rajabifard, A.; Zhang, Y.; Barzegar, M. Querying 3D Cadastral Information from BIM Models. ISPRS Int. J. Geo-Inf. 2019, 8, 329. [Google Scholar] [CrossRef]
  21. León-Sánchez, C.; Agugiaro, G.; Stoter, J. Creation of a CityGML-Based 3D City Model Testbed for Energy-Related Appications. Int. Arch. Photogramm. Remote Sens. Spat. Inf. Sci. 2022, 48, 97–103. [Google Scholar] [CrossRef]
  22. Biljecki, F.; Stoter, J.; Ledoux, H.; Zlatanova, S.; Çöltekin, A. Applications of 3D City Models: State of the Art Review. ISPRS Int. J. Geo-Inf. 2015, 4, 2842–2889. [Google Scholar] [CrossRef]
  23. Avena, M.; Colucci, E.; Sammartano, G.; Spanò, A. HBIM modelling for an historical urban centre. Int. Arch. Photogramm. Remote Sens. Spat. Inf. Sci. 2021, 43, 831–838. [Google Scholar] [CrossRef]
  24. VV.AA. (Spanò ed.) L’esperienza Interdisciplinare Della Task Force Del Politecnico Di Torino per Il Terremoto Del Centro Italia (2016–2017). Sviluppi e Prospettive. ATTI E Rass. Tec. 2018, LXXIII, N. [Google Scholar]
  25. Crowley, H. European Exposure and Vulnerability Models: State-of-The-Practice, Challenges and Future Directions. In Advances in Assessment and Modeling of Earthquake Loss; Springer International Publishing: Cham, Switzerland, 2021; pp. 155–168. [Google Scholar]
  26. Crowley, H.; Dabbeek, J.; Despotaki, V.; Rodrigues, D.; Martins, L.; Silva, V.; Romão, X.; Pereira, N.; Weatherill, G.; Danciu, L. European Seismic Risk Model (ESRM20); EFEHR Technical Report 002, V1.0.1; ETH Zurich: Zürich, Switzerland, 2021; 84p. [Google Scholar] [CrossRef]
  27. Benedetti, D.; Benzoni, G.; Parisi, M.A. Seismic Vulnerability and Risk Evaluation for Old Urban Nuclei. Earthq. Eng. Struct. Dyn. 1988, 16, 183–201. [Google Scholar] [CrossRef]
  28. Kassem, M.M.; Nazri, F.M.; Farsangi, E.N.; Ozturk, B. Improved Vulnerability Index Methodology to Quantify Seismic Risk and Loss Assessment in Reinforced Concrete Buildings. J. Earthq. Eng. 2022, 26, 6172–6207. [Google Scholar] [CrossRef]
  29. Putrino, V.; D’Ayala, D. Effectiveness of Seismic Strengthening to Repeated Earthquakes in Historic Urban Contexts: Norcia 2016. Disaster Prev. Manag. An Int. J. 2020, 29, 47–64. [Google Scholar] [CrossRef]
  30. Lagomarsino, S.; Podestà, S. Seismic Vulnerability of Ancient Churches: I. Damage Assessment and Emergency Planning. Earthq. Spectra 2004, 20, 377–394. [Google Scholar] [CrossRef]
  31. Lagomarsino, S.; Podestà, S. Seismic Vulnerability of Ancient Churches: II. Statistical Analysis of Surveyed Data and Methods for Risk Analysis. Earthq. Spectra 2004, 20, 395–412. [Google Scholar] [CrossRef]
  32. NIKER. 2010. Available online: http://cordis.europa.eu/project/id/244123/reporting/it (accessed on 27 January 2023).
  33. Bruno, N.; Roncella, R. HBIM for Conservation: A New Proposal for Information Modeling. Remote Sens. 2019, 11, 1751. [Google Scholar] [CrossRef]
  34. Murphy, M.; McGovern, E.; Pavia, S. Historic Building Information Modelling—Adding Intelligence to Laser and Image Based Surveys of European Classical Architecture. ISPRS J. Photogramm. Remote Sens. 2013, 76, 89–102. [Google Scholar] [CrossRef]
  35. Brumana, R.; Della Torre, S.; Previtali, M.; Barazzetti, L.; Cantini, L.; Oreni, D.; Banfi, F. Generative HBIM Modelling to Embody Complexity (LOD, LOG, LOA, LOI): Surveying, Preservation, Site Intervention—The Basilica Di Collemaggio (L’Aquila). Appl. Geomat. 2018, 10, 545–567. [Google Scholar] [CrossRef]
  36. De Luca, L.; Busayarat, C.; Stefani, C.; Véron, P.; Florenzano, M. A Semantic-Based Platform for the Digital Analysis of Architectural Heritage. Comput. Graph. 2011, 35, 227–241. [Google Scholar] [CrossRef] [Green Version]
  37. Brumana, R.; Ioannides, M.; Previtali, M. Holistic heritage building information modelling (hhbim): From nodes to hub networking, vocabularies and repositories. Int. Arch. Photogramm. Remote Sens. Spat. Inf. Sci. 2019, 42, 309–316. [Google Scholar] [CrossRef]
  38. Laurini, R. A Conceptual Framework for Geographic Knowledge Engineering. J. Vis. Lang. Comput. 2014, 25, 2–19. [Google Scholar] [CrossRef]
  39. Isikdag, U.; Zlatanova, S. Towards Defining a Framework for Automatic Generation of Buildings in CityGML Using Building Information Models. In 3D Geo-Information Sciences; Springer: Berlin/Heidelberg, Germany, 2009; pp. 79–96. [Google Scholar]
  40. Xu, X.; Ding, L.; Luo, H.; Ma, L. From Building Information Modeling to City Information Modeling. J. Inf. Technol. Constr. 2014, 19, 292–307. [Google Scholar] [CrossRef]
  41. Colucci, E.; De Ruvo, V.; Lingua, A.; Matrone, F.; Rizzo, G. HBIM-GIS Integration: From IFC to CityGML Standard for Damaged Cultural Heritage in a Multiscale 3D GIS. Appl. Sci. 2020, 10, 1356. [Google Scholar] [CrossRef]
  42. Yang, X.; Lu, Y.-C.; Murtiyoso, A.; Koehl, M.; Grussenmeyer, P. HBIM Modeling from the Surface Mesh and Its Extended Capability of Knowledge Representation. ISPRS Int. J. Geo-Inf. 2019, 8, 301. [Google Scholar] [CrossRef]
  43. Colucci, E.; Xing, X.; Kokla, M.; Mostafavi, M.A.; Noardo, F.; Spanò, A. Ontology-Based Semantic Conceptualisation of Historical Built Heritage to Generate Parametric Structured Models from Point Clouds. Appl. Sci. 2021, 11, 2813. [Google Scholar] [CrossRef]
  44. Meschini, S.; Accardo, D.; Avena, M.; Seghezzi, E.; Tagliabue, C.L.; Di Giuda, G.M. Data Integration through a Bim-GIS Web Platform for the Management of Diffused University Assets. In Proceedings of the 2022 European Conference on Computing in Construction, Ixia, Rhodes, Greece, 24–26 July 2022. [Google Scholar] [CrossRef]
  45. Building SMART International IFC Specifications Database 2023. Available online: http://technical.buildingsmart.org/standards/ifc/ifc-schema-specifications/ (accessed on 27 January 2023).
  46. Tolmer, C.-E.; Castaing, C.; Diab, Y.; Morand, D. CityGML and IFC: Going Further than LOD. In Proceedings of the 2013 Digital Heritage International Congress (DigitalHeritage), Marseille, France, 28 October–1 November 2013; pp. 645–648. [Google Scholar]
  47. UNI EN 17412-1:2021; Building Information Modelling—Livello Di Fabbisogno Informativo—Parte 1: Concetti e Principi 2021. UNI: Milan, Italy, 2021.
  48. Di Giuda, G.M. Introduzione Al BIM: Protocolli Di Modellazione e Gestione Informativa; Società Ed.: Rome, Italy, 2019. [Google Scholar]
  49. UNI EN ISO 19650-1:2018; Building Information Modelling (BIM)—Gestione Informativa Mediante Il Building Information Modelling—Parte 1: Concetti e Principi 2019. UNI: Milan, Italy, 2018.
  50. Biljecki, F.; Ledoux, H.; Stoter, J. An Improved LOD Specification for 3D Building Models. Comput. Environ. Urban Syst. 2016, 59, 25–37. [Google Scholar] [CrossRef]
  51. Sammartano, G. Suitability of 3D Dense Models from Rapid Mapping Strategies for Cultural Heritage Documentation and Conservation. Validation of Metric and Non-Metric Information Extraction from Integrated Solutions. Ph.D. Thesis, DAD—Politecnico di Torino, Torino, Italy, 2018. [Google Scholar]
  52. Pagana, P. Sismicità Storica in Umbria. Ricostruzione e Studio Dei Principali Terremoti Verificatisi a Partire Dal III Secolo a.C.; Firenze University Press: Perugia, Italy, 2011. [Google Scholar]
  53. Avena, M. Dalla Nuvola Di Punti All’UrbanBIM. Tecniche Integrate Di Rilievo 3D per La Generazione Di Un Modello Multiscala Di Città in Scenario Post Sismico. Il Caso Studio Di Norcia (PG), Rel. A. Spanò, E. Abbate. Master’s Thesis, Politecnico di Torino, Torino, Italy, 2020. [Google Scholar]
  54. Fillia, E. Modelli 3D per La Valutazione Della Vulnerabilità Sismica Delle Chiese in Muratura Storica. Il Caso Studio Di Sant’Andrea a Campi Di Norcia., Rel. A. Spanò. C. Tocci, G. Sammartano. Master’s Thesis, Politecnico di Torino, Torino, Italy, 2020. [Google Scholar]
  55. Treccani, D.; Balado, J.; Fernández, A.; Adami, A.; Díaz-Vilariño, L. A Deep Learning Approach for the Recognition of Urban Ground Pavements in Historical Sites. Int. Arch. Photogramm. Remote Sens. Spat. Inf. Sci. 2022, 43, 321–326. [Google Scholar] [CrossRef]
  56. Matrone, F.; Grilli, E.; Martini, M.; Paolanti, M.; Pierdicca, R.; Remondino, F. Comparing Machine and Deep Learning Methods for Large 3D Heritage Semantic Segmentation. ISPRS Int. J. Geo-Inf. 2020, 9, 535. [Google Scholar] [CrossRef]
  57. Croce, V.; Caroti, G.; Piemonte, A.; Bevilacqua, M.G. From Survey to Semantic Representation for Cultural Heritage: The 3D Modeling of Recurring Architectural Elements. Acta IMEKO 2021, 10, 98. [Google Scholar] [CrossRef]
  58. Grilli, E.; Remondino, F. Classification of 3D Digital Heritage. Remote Sens. 2019, 11, 847. [Google Scholar] [CrossRef]
  59. Zhang, W.; Qi, J.; Wan, P.; Wang, H.; Xie, D.; Wang, X.; Yan, G. An Easy-to-Use Airborne LiDAR Data Filtering Method Based on Cloth Simulation. Remote Sens. 2016, 8, 501. [Google Scholar] [CrossRef]
  60. Hichri, N.; Stefani, C.; De Luca, L.; Veron, P. Review of the « As-Built Bim » Approaches. 3D-ARCH 2013—3D Virtual Reconstr. Vis. Complex Archit. 2013, XL-5/W1, 107–112. [Google Scholar] [CrossRef]
  61. Tang, P.; Huber, D.; Akinci, B.; Lipman, R.; Lytle, A. Automatic Reconstruction of As-Built Building Information Models from Laser-Scanned Point Clouds: A Review of Related Techniques. Autom. Constr. 2010, 19, 829–843. [Google Scholar] [CrossRef]
  62. Brumana, R.; Stanga, C.; Banfi, F. Models and Scales for Quality Control: Toward the Definition of Specifications (GOA-LOG) for the Generation and Re-Use of HBIM Object Libraries in a Common Data Environment. Appl. Geomat. 2022, 14, 151–179. [Google Scholar] [CrossRef]
  63. Fillia, E.; Sammartano, G.; Tocci, C. Spanò Modellare La Conoscenza Della Vulnerabilità Sismica Delle Chiese in Muratura Storica Con Tecnologie 3D Speditive Introduzione. In Proceedings of the Conferenza ASITA 2021, Genoa, Italy, 1–23 July 2021; pp. 167–180. [Google Scholar]
  64. Sammartano, G.; Avena, M.; Cappellazzo, M.; Spanò, A. Hybrid GIS-BIM approach for the Torino digital-twin: The implementation of a floor-level 3D city geodatabase. Int. Arch. Photogramm. Remote Sens. Spat. Inf. Sci. 2021, 43, 423–430. [Google Scholar] [CrossRef]
  65. Shaulska, L.; Yurchyshena, L.; Popovskyi, Y. Using MS Power BI Tools in the University Management System to Deepen the Value Proposition. In Proceedings of the 2021 11th International Conference on Advanced Computer Information Technologies (ACIT), Deggendorf, Germany, 15–17 September 2021; pp. 294–298. [Google Scholar] [CrossRef]
Figure 1. The main step of the HBIM modelling workflow, involving point clouds segmentation and optimization, and objects structuring according to LOD/LoD.
Remotesensing 15 00833 g001
Figure 2. (a) Nadir view of Norcia square with an excerpt of 1st and the 2nd order control network and (b) the San Benedetto basilica ruins, during the acquisition phases.
Remotesensing 15 00833 g002
Figure 3. (a) The church of Sant’Andrea, with its bell tower and portico, prior to the 2016 earthquake. (b) The church following the collapses related to the 2016 earthquake.
Remotesensing 15 00833 g003
Figure 4. (a) Integration in planar view of indoor point cloud from mobile laser scanner (red) with outdoor point cloud from mobile scanner and UAV photogrammetry; and (b) textured 3D mesh model from UAV images data.
Remotesensing 15 00833 g004
Figure 5. Segmentation of the DSM point cloud and interpolation of the DTM surface, with visualization of extracted isolines.
Remotesensing 15 00833 g005
Figure 6. Ortophoto with cadastral polygons of the Norcia urban centre, encoded by Level of usability due to seismic damage (AeDES reports).
Remotesensing 15 00833 g006
Figure 7. The LoD 1 3D model generated from urban cartography in GIS interface: (a) neutral representation; and (c) its zoom; (b) multi scale view with the LoD 3 modelled part on background; and (d) thematic mapping according to the attribute relater to damages (AEDES reports).
Remotesensing 15 00833 g007
Figure 8. Examples of of one sample building definition (building n°2, Via Solferino) based on point clouds with parametric modeling, with eaves, ridges, floors and ground lines (a); corresponding modelling according to LOD 300 (b) in the evacuated residential area; and aerial views of the centre with the other modeled buildings (c).
Remotesensing 15 00833 g008
Figure 9. Examples of 2D digital products: (a) section; and (b) façade ortophoto for the Sant’Andrea.
Remotesensing 15 00833 g009
Figure 10. (a) Investigation of the anterior portion through the 3D mesh model textured by HD UAV images. (b) Recognition of the different portions of masonry not clamped or separated by cracks.
Remotesensing 15 00833 g010
Figure 11. Examples of volumetric high scale 3D data: point cloud (a), and (b) models for Castellina building in Norcia.
Remotesensing 15 00833 g011
Figure 12. The Urban BIM related to Norcia city centre: the south-west part of the city (a), with a zoomed view on the Castellina 3D model and query in the 3D database (b).
Remotesensing 15 00833 g012
Figure 13. The as-built modeling steps for deriving accurate surfaces from point clouds. (a,b); and final microelement 3D volumetric model (c).
Remotesensing 15 00833 g013
Figure 14. Autodesk viewer® visualization: (a) complete; and (b) section option.
Remotesensing 15 00833 g014
Figure 15. (a) Deformation evaluation based on the 3D mesh model with deviation analysis between the tower mesh and the profile at the base extruded along the vertical, underlining the off-lead of the bell tower; and (b) mesh profile at the base (blue) and mesh profile at the top of the tower (red).
Remotesensing 15 00833 g015
Figure 16. Representation of the wall mechanism: (a) 2D and 3D model extrapolated from the simplified volumetric; and (b) analysis of the south side wall, with graphical solution of the equilibrium conditions analysis for the calculation of the seismic coefficient.
Remotesensing 15 00833 g016
Figure 17. 3D view on two of the four geographic spot in the ArcGIS WebApp: (a) Campi di Noria with Sant’Andrea church; and (b) Tolentino with San Nicola church.
Remotesensing 15 00833 g017
Figure 18. (a) Campi LoD 2 GIS model: the ground from DSM, LoD 2 buildings from matching point cloud and 2D shape file and georeferenced LOD 2 model of the church; (b) the LoD 3 church model where macro-elements were modelled form BIM, and damage mechanism information was associated; and (c) the LoD 4 church model where all elements were modelled, and information C and D were associated.
Remotesensing 15 00833 g018
Figure 19. Thematic and interactive dashboard of S. Andrea’s Church damage mechanism: (a) general view with active tools, and (b) query of the façade element. In (c,d) respective zoomed view of the data reporting on the dashboard.
Remotesensing 15 00833 g019aRemotesensing 15 00833 g019b
Table 1. Directive Modules from Italian regulation (DPCM 09/02/2011).
Directive ModulesDescription
ABuilding identification. It is useful to identify the artifact, base on three fundamental parameters: denomination, toponymy, cadastral data.
BCritical issue related to territorial context. It contains the data necessary to determine the relationships between the building and the territorial context in order to classify particular sensitivity factors.
CStructural elements morphology. It identifies and describes the structural elements, through the recognition of the morphology, typology, construction techniques and materials.
DState of conservation. It classifies and describes the damage phenomena of the individual structural elements.
EGeometric survey. It is intended the survey of the building in its current state, as a complete stereometric description of the building, including any cracking and deformation phenomena
FFormer restoration intervention. It identifies to any recorded past action related to structural consolidation
GHistorical investigation. It is related to historical data collected on the building phases
HDiagnostic investigation. It refers to the data derived from diagnostic investigation phases
Table 2. Level of Evaluation method from Italian regulation (DPCM 09/02/2011).
Level of EvaluationDescription
LV1The LV1 level allows the evaluation of the seismic action with simplified methods, based on a limited number of geometric and mechanical parameters or qualitative data (visual examination, understanding of construction features, critical and stratigraphic survey).
LV2The LV2 level refers to the evaluations to be adopted in case of local interventions in limited areas of the building, individual macro-elements, for which local analysis methods are suggested. In this case the assessment of the seismic action for the entire building is carried out with level LV1 instruments
LV3The LV3 level allows the design of diffuse interventions in construction through the assessments concerning the entire building or local analysis methods used for the LV2 level, provided that they are generally applied to all the elements of the construction (from past seismic events experience, the collapse event in historic masonry buildings is achieved, in most cases, due to loss of equilibrium of limited portions of the construction, defined as macro-elements).
Table 3. Comparison between LoD/LOD in CityGML and IFC.
LoD 1/LOD 100
CityGML definition (2.0 version)IFC Elements
AbstractBuilding is the pivotal class of the model; it is a subclass of the thematic class _Site (and transitively of the root class _CityObject). _AbstractBuilding is specialised either to a Building or to a BuildingPart.Conceptual mass-elements
LoD 2,3,4/LOD 200/300/400
CityGML definition (2.0 version)IFC Elements
RoofSurface class espress the major roof parts of a building or building part
BuildingInstallation class involves secondary parts of a roof with a specific semantic meaning like
dormers or chimneys.
IfcRoof:
-
Definition from ISO 6707-1:1989: Construction enclosing the building from above.
-
Definition from buildingSMART: The IfcRoof describes the total roof, as a container entity, that aggregates all components of the roof. The aggregation is handled via the IfcRelAggregates relationship, relating roofs to related entities (IfcSlab), rafters and purlins (IfcBeam), dormers (IfcRoof).
WallSurface is used to model all parts of the building façade
belonging to the outer building shell
IfcWall:
-
Definition from ISO 6707-1:1989: Vertical construction, in masonry or in concrete, which bounds or subdivides a construction works and fulfills a load-bearing or retaining function.
-
Definition from buildingSMART: The wall represents a vertical construction that bounds or subdivides spaces. Wall are usually vertical, or nearly vertical, planar elements, often designed to bear structural loads (also non-load-bearing function). The IFC specification provides two entities for wall occurrences
LoD 3,4 /LOD 300/400
CityGML definition (2.0 version)IFC Elements
Opening: Door/Window
is the abstract base class for semantically describing openings like doors or windows in outer or inner boundary surfaces like walls and roofs.
IfcDoor:
-
Definition from ISO 6707-1:1989: Construction for closing an opening, intended primarily for access with hinged, pivoted or sliding operation.
-
Definition from buildingSMART: The door includes constructions with revolving and folding operations (including lining and one or several panels, which properties are defined by the IfcDoorLiningProperties and the IfcDoorPanelProperties.
IfcWindow:
-
Definition form ISO 6707-1:1989: Construction for closing a vertical or near vertical opening in a wall or pitched roof that will admit light and may admit fresh air.
-
Definition from buildingSMART: window consists of a lining and one or several panels, which Properties are defined by the IfcWindowLiningProperties and the IfcWindowPanelProperties.
BuildingInstallation is a class used for building elements like balconies, chimneys, dormers or outer stairs, strongly affecting the outer appearance of a buildingIfcStair:
-
Definition from ISO 6707-1:1989: Construction comprising a succession of horizontal stages (steps or landings) that make it possible to pass on foot to other levels.
-
Definition from buildingSMART: A vertical passageway allowing occupants to walk (step) from one floor level to another one at a different elevation. (may include a landing as an intermediate floor slab.
LOD 400
City GML definition (2.0 version)IFC Elements
InteriorWallSurface is a class to be used only in the LoD 4 interior building model for modelling the visible surfaces of the room walls.Constructive elements stratigraphy:
The concept template Property Sets for Objects describes how an object occurrence can be related to a single or multiple property sets (that contain a single or multiple properties). The data types of individual property are sigle value, enumerated value, bounded value, table value, reference value, list value, and combination of property occurrences. Property sets can also be related to an object type (Property Sets for Types), that define the common properties for all occurrences of the same type. If the same property (by name) is provided by the same property set (by name), then the properties directly assigned to the object occurrence override the properties assigned to the object type. (https://standards.buildingsmart.org/IFC/DEV/IFC4_2/FINAL/HTML/schema/templates/property-sets-for-objects.htm, accessed on 27 January 2023)
Table 4. Damage mechanisms associated with vulnerability score (vk) in the vulnerability indicator scorecard, highlighting of mechanisms with high vulnerability, ≥2.
MacroelementDamage MechanismsVulnerability (vk)
Facade1—Overturning of the facade2
2—Damage at the top of facade2
3—Shear mechanisms in the facade0
Nartex4—Nartex mechanisms2
Side walls5—Transversal vibration of the nave2
6—Shear mechanisms in the side walls−3
Colonnade7—Longitudinal response of the colonnade1
Vaults8—Valuts of the nave2
Triumphal arch13—Triumphal arch mechanisms−2
Apse16—Overturning of apse−3
17—Shear mechanisms in presbytery and apse−2
18—Vaults in presbytery and apse−2
Roof covering19—Part of the roof: side walls of nave and aisles−2
Bell tower27—Bell tower−2
28—Bell cell−1
Table 5. Parameters and values calculated according to the directive’s indications.
NameParameterValueReference Value
Vulnerability indexiv0.450–1
Peak ground acceleration SLDaSLD0.051 g0.444 g expected
Peak ground acceleration SLVaSLV0.203 g0.444 g expected
Nominal lifetime 1VN2 years>20 years
Safety index IS0.04>1
1 The nominal lifetime is an indication of the period in which to provide an intervention and a new verification, in addition to providing a suitable monitoring program.
Table 6. Damage mechanisms calculated according to analytical mode.
Damage MechanismsTrigger Mechanism ValueReference Value
Overturning of the south side wall0.296 g0.444 g expected
Overturning of the bell tower0.632 g0.444 g expected
Table 7. Analysis of information needed (for the LoIN definition of the model) through the evaluation of LoD sequence and the punctual directive task, according to DPCM 9/02/2011.
LoD/LODDirective TasksDescription
LoD 0A
B
Building identification (cartography, cadastre)—2D
Criticality factors of the building in relation to the territorial context
LoD 1/LOD 100A
B
Building identification (cartography, cadastre)—3D
Criticality factors of the building in relation to the territorial context
LoD 2/LOD 200E
F
LV1
LV2
Geometric survey—3D
Former restoration actions—4D
Parameters resulting from the LV1 assessment relating to the macroelements
Parameters resulting from the LV2 assessment relating to the macroelements
LoD 3,4/LOD 300/400C
D
F
G
H
LV2
LV3
Elements morphology—3D
State of conservation of elements—3D
Former restoration actions—4D
Historical investigation—4D
Diagnostic investigation—4D
Parameters resulting from the LV2 assessment relating to the elements
Parameters resulting from the LV3 assessment relating to the elements
Disclaimer/Publisher’s Note: The statements, opinions and data contained in all publications are solely those of the individual author(s) and contributor(s) and not of MDPI and/or the editor(s). MDPI and/or the editor(s) disclaim responsibility for any injury to people or property resulting from any ideas, methods, instructions or products referred to in the content.

