Abstract
Monitoring vessel activity is an important part of managing marine protected areas (MPAs), but small-scale fishing and recreational vessels that do not participate in cooperative vessel traffic systems require additional monitoring strategies. Marine Monitor (M2) is a shore-based, multi-sensor platform that integrates commercially available hardware, primarily X-band marine radar and optical cameras, with custom software to autonomously track and report on vessel activity regardless of participation in other tracking systems. By utilizing established commercial hardware, the radar system is appropriate for supporting the management of coastal, small-scale MPAs. Data collected in the field are transferred to the cloud to provide a continuous record of activity and identify prohibited activities in real-time using behavior characteristics. To support the needs of MPA managers, both hardware and software improvements have been made over time, including ruggedizing equipment for the marine environment and powering systems in remote locations. Case studies are presented comparing data collection by both radar and the Automatic Identification System (AIS) in urban and remote locations. At the South La Jolla State Marine Reserve near San Diego, CA, USA, 93% of vessel activity (defined as the cumulative time vessels spent in the MPA) was identified exclusively by radar from November 2022 through January 2023. At the Caye Bokel Conservation Area, within the Turneffe Atoll Marine Reserve offshore of Belize, 98% was identified exclusively by radar from April through October 2022. Spatial and temporal patterns of radar-detected and AIS activity also differed at both sites. These case study site results together demonstrate the common and persistent presence of small-scale vessel activity near coastal MPAs that is not documented by cooperative systems. Therefore, an integrated radar system can be a useful tool for independent monitoring, supporting a comprehensive understanding of vessel activity in a variety of areas.
1. Introduction
Recently, there has been a global focus on implementing marine protected areas (MPAs) to achieve large-scale conservation targets, such as protecting 30% of the world’s marine area by 2030 [1]. These spatial goals require monitoring vast areas of the ocean [2,3], which can be supported by satellite-borne remote sensing (e.g., [4,5]). But small-scale, locally managed MPAs also require special attention due to their role in the economies of coastal communities [6]. These MPAs can enhance fish biomass [7] and support local food security [8], but limited staffing and budget capacity for monitoring are pervasive issues [9,10]. Satellite-based monitoring solutions may not be appropriate for these areas due to data processing requirements and cost, and, at the time of writing, further development is needed to improve detection of small vessels amongst waves and other features [11,12,13]. Therefore, remote sensing solutions that are scaled for targeted use at the local level may be more practical.
The purpose of this paper is to describe and evaluate a coastal radar monitoring and reporting system that is appropriate for documenting small-scale vessel activity in nearshore areas with a specific focus on monitoring vessels that are found in the vicinity of coastal MPAs. The need for effective and appropriate technologies that support management of small-scale fisheries in developing countries and elsewhere is specifically addressed by international goals, including Sustainable Development Goals 14.a and 14.b [14]. The commercial availability of radar, along with its established and widespread use in the maritime domain, make it an appropriate tool for managers who may have limited access to resources. The system described in this paper is the Marine Monitor (M2) [15], a multi-sensor platform that uses X-band marine radar and optical imagery to detect and document vessel activity from shore. While these are common, well-established tools used in maritime surveillance, this paper presents a system specifically designed for conservation-based monitoring and reporting.
Cooperative vessel traffic systems, such as the Automatic Identification System (AIS), have been widely used to inform conservation-based assessments of human impacts on protected areas [16], including fishing activities [5,17,18,19,20] and recreation and tourism [21,22,23]. The global availability of AIS, specifically, facilitates monitoring commercial fishing activity at a large scale (e.g., [24,25]), but participation is not universally mandated [16], not well enforced [26], and not commonly used in small-scale fishing [27]. Previous research in particular regions has shown that many vessels, even in highly populated areas, are not broadcasting AIS data [28,29,30]. Therefore, non-cooperative systems are likely better suited for monitoring MPAs where small-scale vessel activity is of interest. To evaluate the benefit of using coastal radar in these areas, data collected via radar are compared to data provided by AIS (integrated by the M2 system) at two case study sites: one in a highly developed urban area and one in a more remote location. These contrasting locations provide an opportunity to incorporate different types of small-scale vessel activity.
This paper is structured as follows: Section 1.1 summarizes related work using remote sensing systems to monitor non-cooperative vessel activity as it relates to MPAs. Section 1.2 includes an overview of the chosen system, including the technical capabilities of coastal radar that make it an appropriate choice for targeted monitoring of coastal MPAs. Section 2.1, Section 2.2, Section 2.3, Section 2.4, Section 2.5 and Section 2.6 provide details on the methods used to collect data. Section 2.7 describes the two case study sites and the methods used for analysis. Results from the case study sites are presented in Section 3, and Section 4 provides discussion of the case study results and overall challenges and the importance of monitoring small-scale vessel activity. A brief conclusion is provided in Section 5.
1.1. Related Work
Satellite-based remote sensing solutions are rapidly progressing to support maritime surveillance with a clear advantage being the ability to survey large swaths of the ocean [31]. Synthetic aperture radar (SAR) and optical imagery from satellites facilitate a multitude of image-processing techniques for detecting and classifying vessels in the images [32,33,34], including identification of fishing vessels [12] and fishing activity [35]. Lights used by some fisheries to attract target species can also be detected using the visible infrared imaging radiometer suite (VIIRS) and used to map the spatial and temporal extent of activity [35,36] and identify discrete vessel positions [37,38]. However, the temporal lag of vessel detections across subsequent images complicates route prediction and enforcement response on the water. For example, ref. [4] describes a patrol vessel in the Ascension Island MPA that was unable to intercept an SAR-detected vessel before it left the area. The issue of response time is especially relevant for small-scale MPAs when vessels can more quickly leave the boundaries. Higher resolution imagery may be expensive for MPA management applications [4], although development of more affordable systems, such as micro- and nano-satellites, is ongoing [39].
Using optical cameras and video feeds to monitor marine areas is a well-established practice for port surveillance and security [40]. The affordability of digital cameras and closed-circuit television systems has also made these tools useful for conservation-based monitoring in targeted, nearshore areas [41,42]. Stationary digital cameras that are programmed to capture images on a schedule have been used to document the presence of recreational fishing vessels in coastal areas of interest, such as MPAs and artificial reefs [43,44,45,46]. A common strategy is to deploy cameras near defined access points to a fishery, such as a boat ramp or areas where vessels must pass to reach their destination [42,47,48], and apply an automated vessel detection method on the images or video [49,50]. These methods can facilitate real-time enforcement response when data are streaming and provide a robust record of vessel counts [42]. However, manual review of the data can be required to identify fishing effort or other specific activities [45,51], so cameras are often utilized as a secondary source of information [42,49].
While the range of coastal radar is restricted compared to satellite systems, it is a traditional component in vessel traffic service systems for monitoring non-cooperating vessels in highly trafficked areas [52]. There are many examples of coastal radar as a component of a common operating picture that considers multiple inputs (e.g., [53,54,55]). Persistent target tracking, facilitated by the Automatic Radar Plotting Aid (ARPA), provides a continuous record of a unique vessel’s trajectory, which is difficult to reconstruct from infrequent satellite images [56]. Some satellites can be tasked to a given area (albeit with limitations [57]) or revisit within minutes, but most have a longer revisit time [58,59]. Radar and AIS positions are both typically reported of the order of seconds, so association between the two is a common practice and helpful for providing identification information on radar-detected targets [60,61]. Conversely, radar provides situational awareness of targets that do not broadcast AIS data, such as smaller vessels [62]. Radar tracking is also unaffected by cloud cover and foggy conditions that can inhibit vessel detection in other types of imagery.
It is also important to mention remotely or autonomously controlled aerial, surface, or underwater vehicles. These systems typically patrol marine areas and capture images or other data that can be used to detect and identify vessels. At the time of writing, most of these systems are best suited for use in small, targeted areas [63] and provide complementary information to more traditional monitoring techniques [64]. However, with ongoing progress in edge computing and computer vision models, these vehicles can be effective tools for collecting data on vessel activity in MPAs [65].
1.2. System Overview
Coastal radar is well-suited for monitoring small-scale MPAs for three primary reasons: (1) radar systems can provide persistent monitoring that supports both real-time response and comprehensive analysis, (2) radar is a widely used and available technology, and (3) the range of vessel tracking is at a similar scale to smaller MPAs. The M2 system autonomously documents vessel activity by pairing vessel positions over time, provided by the radar system, with imagery of the vessel collected by a camera. In this way, spatio-temporal and identifying information on non-cooperative vessels is presented similarly to cooperative systems, such as AIS. The automated process for directing the camera to vessel locations expands on similar previous efforts (detailed in Section 2.4), thus generating high quality images so that MPA managers can effectively evaluate activity and, thus, compliance.
The primary hardware components of M2 are the radar system, optical camera, and PC computer for processing, storing, and viewing data. Early deployments integrated these components with existing field stations that had a power source and internet connection.
Subsequent deployments required the development of an off-grid power system when MPAs were in remote areas or there was not an adaptable infrastructure in the area. The Mobile Marine Monitor (M3) integrates hardware components in a ruggedized, towable trailer containing a solar array and battery system (Figure 1). A microwave antenna also provides internet access onsite and the ability to stream remote data to the cloud. This provides a connected base of operations in the field and also the ability to relocate the system in response to changing monitoring needs. Finally, additional sensors, such as weather stations, provide in situ data, which can be helpful for interpreting vessel data and providing overall environmental monitoring at a remote location.
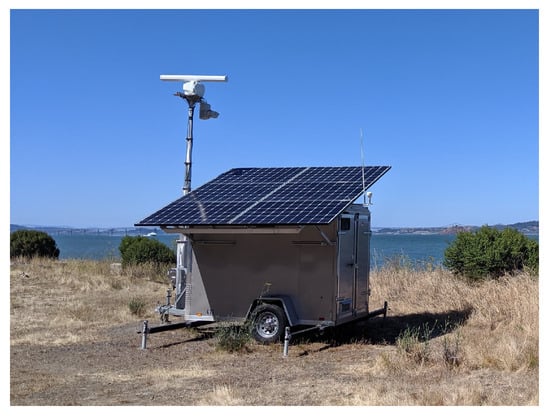
Figure 1.
Mobile Marine Monitor (M3) deployed in California, USA.
There have been software adaptations made to ensure users can effectively interact with the data collected. To maximize successful capture of tracking data and images, data are stored locally and on the cloud via independent streams when connected to the internet. This ensures that information is still captured should there be a transient local or cloud software or data failure or when an internet connection is intermittent. Additionally, a fully offline mode can be used for very remote areas where internet or other connections are not currently practical. In this mode, data are stored locally, including images, but can be exported to portable media (e.g., USB drive) and uploaded to the cloud from any internet-connected computer. In addition to accessing individual data streams from system components, users can dynamically engage all local and cloud-based data using an interactive browser-based interface (Figure 2).
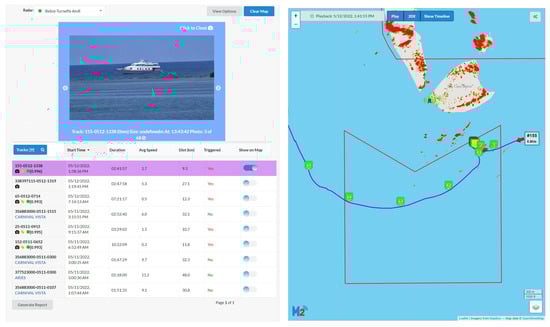
Figure 2.
Data viewer showing track list and associated attributes (left) and selected track displayed on map (right), along with radar imagery and area of interest in red. Green icons on the map indicate vessel locations when an image was captured. The yellow icon indicates where the vessel was when the image on the left was captured.
2. Materials and Methods
The primary system sensors and processes are shown in Figure 3. In addition to the radar and camera components, the system includes a very-high-frequency (VHF) antenna and AIS receiver to collect messages from AIS broadcasts in the area. Comparing known AIS records with potential duplicate records from another sensor can be helpful for differentiating between cooperating and non-cooperating vessels (e.g., [66,67]). Figure 3 highlights the similarity of radar and AIS data and processing.
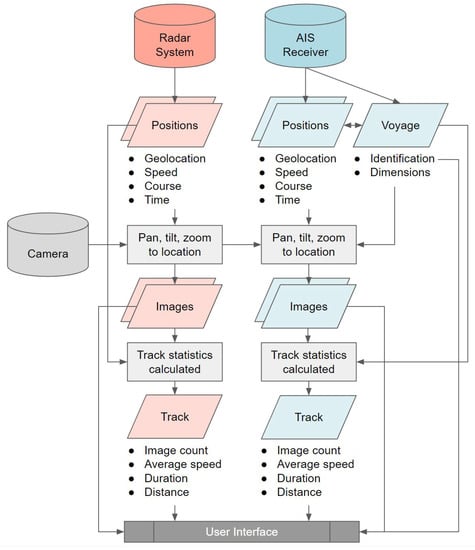
Figure 3.
Conceptual diagram of primary system sensors and processes, including the radar system, Automatic Identification System (AIS) receiver, and camera.
2.1. Radar Tracking
The system utilizes a Furuno solid-state Doppler X-band radar paired with Nobeltec TimeZero Coastal Monitoring (TZCM) navigation software [68]. The availability of these components on the retail market helps minimize cost compared to custom-built systems and ensures access to adequate documentation and technical support. The detection range of the radar depends on the antenna height above sea level according to
where the antenna height (h) is in feet, and the distance to the radar horizon (dr) is in nautical miles [69]. With system antennas typically installed at a minimum height of 16.4 feet (5 m), targets are generally detected within 5 nautical miles (9.26 km) of the system, although the detection range extends further depending on vessel height, construction, and surface conditions [70].
Candidate vessels are detected and tracked autonomously by the ARPA-enabled radar system. With a radar sweep rate of 24–30 Hz, TZCM updates target positions from the radar imagery roughly once per second using a proprietary motion model based on the Kalman filter [71], a common algorithm for target tracking [61]. These estimated target positions, along with course and speed, for each vessel are provided over a network data stream and are hereafter referred to as detections. Global identification numbers are assigned to targets, thereby linking consecutive detections of unique targets, hereafter referred to as tracks. The Software calculates numerous track-level metrics across detections, such as average speed, and manages track life based on track persistence over time (dropping tracks if targets become latent or spatially move outside of the expected range of the system).
Additional data beyond detections and tracks are collected via an Internet Protocol (IP) data connection to the radar unit using Furuno’s Software Development Kit (SDK) [72]. Radar images are captured every 6 s (as individual .png files) and stored for georeferencing and animation with track data. For each deployment location, the appropriate radar resolution is determined for optimal target detection and tracking. TZCM has dual-range capability, where users set a minimum and maximum resolution for short and long pulses, respectively [71]. This facilitates target tracking at both nearshore and more distant areas. The status of radar and network functioning are also logged over time to monitor overall system uptime and alert system managers to disruptions.
2.2. AIS Data and Track Association
Messages transmitted via AIS report instantaneous attributes, such as location, course, and speed, derived by onboard GPS sensors, providing similar data as those detections provided by the radar system. Static voyage data, such as vessel name, dimensions, and type, are also transmitted intermittently, although voyage data from smaller vessels using less powerful AIS transponders (Class B) may not be available or be received more infrequently [16,27]. Consecutive AIS detections from unique vessels are linked with voyage information (if available) to create AIS tracks. The similar structure of data collected by radar and provided by AIS facilitate integration of the two data streams (Figure 3), and the same track-level statistics are calculated for both.
Since the radar system tracks all vessels within its range, some radar tracks duplicate AIS tracks. Track association links coincident radar and AIS tracks according to criteria recommended by [61]: detections are associated when they have similar position, movement vector, and history. Using this guidance, radar and AIS detections are associated when they meet all of the following requirements (illustrated in Figure 4):
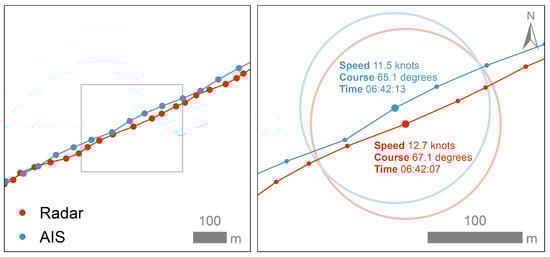
Figure 4.
Example of associated radar and AIS detections that meet the defined criteria based on similar position (shown with 100 m buffer around points), movement vector (speed and course), and history (time).
- detections are within 100 m in geolocation,
- difference in speed less than 1.5 knots (0.77 m/s),
- difference in course less than 10 degrees, and
- detected within 15 s.
2.3. Track Analysis
Using the descriptive track-level statistics, additional analysis helps highlight meaningful tracks. When systems are deployed, local site partners identify areas of interest where vessel activity is of concern, often MPA boundaries. Both radar and AIS detections are flagged if they are spatially within these areas, and M2 reports the total time a vessel spent within an area as a track-level statistic.
Site partners also identify vessel behaviors of interest that typically correspond to regulated activities within the area. For example, MPA managers may be interested in vessels traveling at very low speeds or idling in an area where fishing activities are prohibited as this behavior could be indicative of fishing [73,74]. Based on local knowledge, site partners identify speeds of interest and the time spent within the area that would suggest a prohibited activity may be occurring. Using these definitions, the system identifies radar and AIS tracks that meet the criteria, classifies them as alarm tracks, and sends notifications to subscribed users.
Occasionally the radar system can erroneously identify sea clutter and weather events as targets [70]. Within TZCM, exclusion areas are defined to minimize these false targets, but they can still occur in fluctuating environmental conditions. A model developed by machine learning, a technique helpful for analyzing vessel tracks [74,75], uses track statistics to calculate a confidence score between 0 and 1, with higher scores indicating those tracks more likely to be vessels. See [76] for a full description of the process. The confidence score is stored as a track statistic and can be used to classify and isolate only those radar tracks predicted to be true vessels. Tracks are typically classified with greater than 90% accuracy [76,77].
2.4. Camera Integration
Systems are configured with one or more pan, tilt, zoom (PTZ) IP cameras (Figure 5). While a stationary camera can be an affordable option for monitoring a fixed area (summarized in Section 1.1), dynamically directing a camera to vessel locations can provide a magnified image for identifying specific vessels and their activities. To capture the target vessel at the center of the frame, different techniques have been proposed, including directing the camera to radar- and AIS-reported locations [78,79] and object detection in live video [80,81]. The M2 system uses the former approach to simplify processing demands on the local PC and provides a number of configurable parameters so that the system can be easily adapted to different locations and vessel types (detailed in Section 2.5). By utilizing the Open Network Video Interface Forum (ONVIF) and Real Time Streaming Protocol (RTSP) for PTZ control and image capture, the system is compatible with most surveillance cameras [82]. This makes deployment especially cost effective when MPA managers have access to existing equipment.
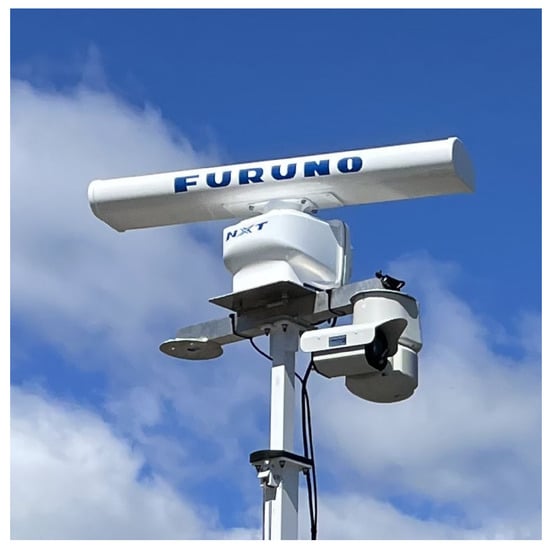
Figure 5.
Camera mounted with radar antenna on a telescoping mast.
Electro-optical (EO) cameras are commonly integrated with the system to capture images during the day using daily sunrise and sunset times at the system location to trigger camera operation. These cameras can also be configured to function at night if vessel lights are of interest as they can indicate certain fishing activities [67,83]. While infra-red (IR) cameras can capture higher quality images at night, they are currently cost-prohibitive for most locations when there is minimal non-AIS activity at night. When appropriate, dual cameras are supported, including those with a common pan/tilt head and co-boresight sensors, such as an EO/IR combination, and other sensor types, such as hyperspectral cameras.
2.5. Camera Calibration
Before the camera can autonomously pan, tilt, and zoom to vessel locations, site-specific parameters must be set for each of these variables. The offset angle between true north and the camera’s zero angle resting position must be obtained so that, when the camera is directed to target locations, it pans to the correct true north bearing. Reassigning the camera’s zero angle resting position to true north is accomplished using built-in camera functionality. Then, an appropriate tilt angle can be calculated according to
where h is the camera’s height above the water and d is the distance to the vessel (Figure 6). Additional tilt adjustments can be defined in bearing angle ranges (i.e., pie slices) to compensate for a camera mount that is not absolutely plum, common in rugged environments [80].
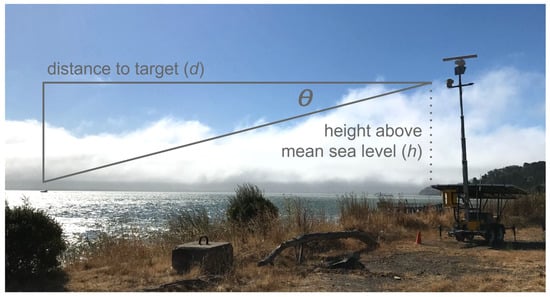
Figure 6.
Mathematical approach for calculating the appropriate camera tilt angle given the height of the camera above mean sea level at the site (h) and varying vessel distances (d).
For determining appropriate zoom levels, calibration is performed for each unique camera model to estimate intrinsic lens parameters as a function of zoom percentage. First, images of a target board of known width are captured from a distance of 5 to 100 m at 5-m increments and 5% zoom steps. For each distance and zoom, the width of the target in pixels is determined from the captured image. Then, degrees per pixel (pixel) can be calculated at each step according to
where wmeasured is the measured width of the target board, and wpixel is the width of the target in pixels. Next, the degrees of the field of view (FOV) are calculated according to
where wpixel is the width of camera images in pixels. The field of view at each step is used to estimate the focal length (f) and ultimately an associated theoretical zoom level.
Finally, an adjustment factor is experimentally applied to (5) to fit the resulting theoretical zoom levels to the measured levels, if necessary, so that the ideal field of view is captured (Figure 7). Manufacturer specifications typically provide the minimum and maximum focal lengths, and these generally align with estimated values (Figure 7).
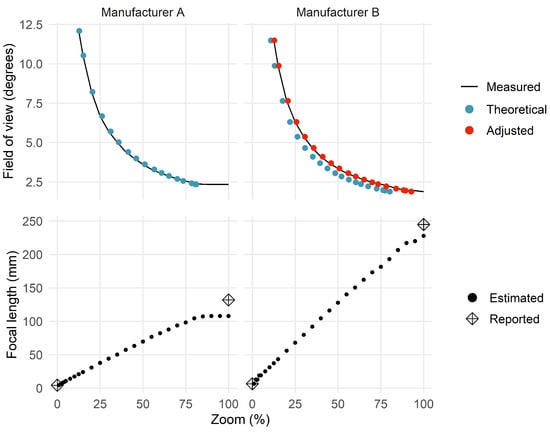
Figure 7.
Camera parameters at increasing zoom levels. Theoretical field of view values have been adjusted to best fit measured values, if necessary (top). Estimated focal lengths are compared to manufacturer-specified values (bottom).
In addition to distance, the zoom calculation also considers available target information when determining image width and, thus, zoom level. For AIS targets, the base image width is set based on reported vessel length, typically included in voyage data [16]. For vessels without a reported length (and all radar targets), the software alternates between minimum and maximum vessel lengths that are set based on typical traffic. Site-specific AIS limits ensure that barges are adequately captured in images of smaller tow and push boats and that erroneous voyage data do not negatively impact vessel capture in photos. Image width is also adjusted based on the target’s orientation relative to the camera,
where A is the aspect angle of the vessel based on its course and true bearing angle in relation to the camera (e.g., smaller widths are used when the vessel’s bow or stern is pointed at the camera, subject to a minimum length for avoiding overzoom) (Figure 8). An adjusted vessel length (ladjusted) is calculated by
where lreported is the vessel length reported by AIS or the set minimum and maximum lengths of radar targets. An additional width factor can be applied as a margin of error to best frame targets. See Figure 9 for image examples.
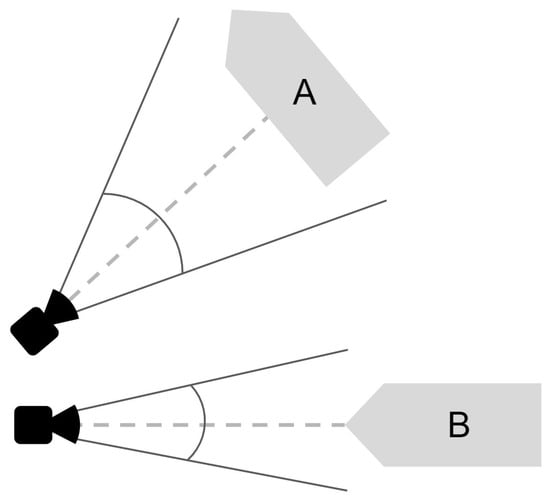
Figure 8.
Image width considers orientation of vessels with the camera. If vessels A and B were the same size and equidistant to the camera, vessel B would have a smaller image width and, thus, a higher zoom level than vessel A.
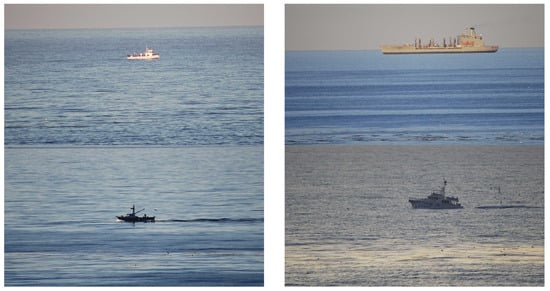
Figure 9.
Images captured autonomously of radar-detected vessels (left) and vessels broadcasting AIS (right).
The final determined width is converted to degrees per pixel using target distance (3), which is then used with the lens calibration Equations (4) and (5) to calculate a zoom percentage (6). If the percentage is outside 0–100%, then the zoom is set to the minimum or maximum, respectively.
2.6. Target Selection and Cuing
At the time of deployment, geographic areas for desired image capture are defined. These can have arbitrary shapes and sizes to capture images where they will be useful, mask areas of high false targets, and protect the privacy of nearby private land or structures. A target selection algorithm executes every 15 s when one or more vessels are in the photo-capture area. Targets with no prior images are given highest priority. When all candidate targets have been imaged, priority is given to the target with the longest time since the last image. All targets are subject to a capture delay of 120 s after the previous image and first detection (to reduce capture of transient false targets). Once a target has been photographed five times, the minimum delay for that target is increased to 5 min to reduce the overall count of images for tracks that persist over longer periods of time. If no targets meet the criteria, the camera rests and the nomination algorithm runs again in 15 s.
Considering camera pan and zoom speed is one obstacle for directing PTZ cameras to active targets [80]. To account for these variables, the target location, course, and speed are used to generate a predicted target location after a set delay (to account for camera pan speed, usually 2 s). For radar detections, the location is assumed to be the target center. Since AIS voyage data include vessel dimensions relative to its GPS antenna [16], the target location is additionally adjusted to the ship center for these vessels (only for camera cuing purposes) (Figure 10). The location is then transformed into a range and bearing angle from the camera, and it pans, tilts, and zooms according to the predetermined settings. The camera is re-cued with each new detection, which typically occurs every 2–6 s. Before the next target is nominated, an image is captured if there was at least one cue.
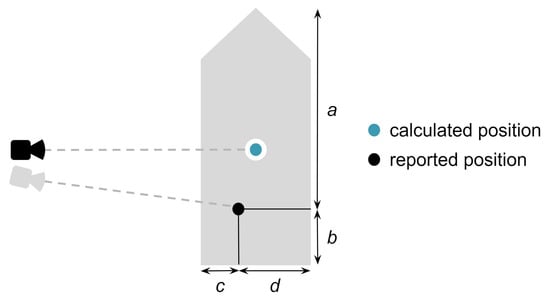
Figure 10.
Vessel dimensions (a, b, c, d) provided in AIS data with respect to the reported position [84]. Dimensions are used to calculate the position of the geometric center of the vessel for camera cuing purposes.
To simplify access to image metadata, the system encodes the following information in the image filename at the time of capture: timestamp, system track identification number, most recent target location, speed, course, camera zoom percentage, vessel length (or assumed length), and vessel name (if known from AIS).
2.7. Case Study Analysis
The two case study sites, one in a highly developed coastal area and one offshore (Figure 11), provide an opportunity to evaluate and compare vessel traffic patterns from both radar and AIS at an urban versus remote location. Areas of high population density place a multitude of pressures on marine ecosystems [85], and poaching in MPAs is more likely to occur near urban areas [86]. The time and resources required to travel to more remote MPAs can deter human activity, and lower harvest rates have been recorded [87], but enforcement in these areas may be similarly limited [88]. The amount of vessels using or not using AIS is likely unique to a given location and a result of site-specific commercial and recreational activities. Therefore, these case studies are intended to assess the benefit of using radar at two distinct locations, which may not transfer to other areas (discussed further in Section 4).
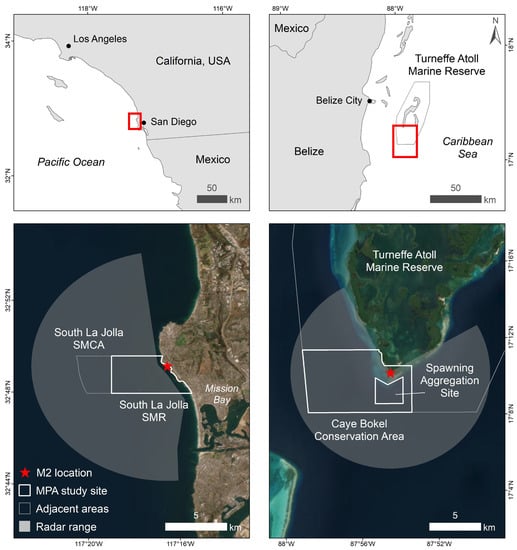
Figure 11.
Case study site locations and marine protected areas (MPAs). South La Jolla State Marine Reserve (SMR) (left) and the adjacent South La Jolla State Marine Conservation Area (SMCA). Caye Bokel Conservation Area (right), including a multi-species spawning aggregation site, within the Turneffe Atoll Marine Reserve. Basemap: ESRI World Imagery.
The South La Jolla State Marine Reserve (SMR) is approximately 13 km2 and directly adjacent to the city of San Diego, California, USA. As such, recreational activity is common, and there are more marine-related violations associated with the SMR than others in the area [89]. The SMR was designated in 2012 to preserve an area of high biodiversity, including a rocky reef ecosystem and kelp forest, and all harvesting of marine resources is prohibited, which includes all types of fishing [90]. As part of a larger network of MPAs in California, the SMR shares a boundary with the South La Jolla State Marine Conservation Area (SMCA) where some recreational fishing is allowed.
The Caye Bokel Conservation Area is approximately 55 km2 and is part of the larger Turneffe Atoll Marine Reserve, designated in 2012 to improve management of local resources [91]. Located 50 km east of the central coastline of Belize in the Mesoamerican Reef region, there is little development on the atoll. Tourism directly benefits the larger economy of Belize, and fishing has significant social value to nearby communities [92]. Fishing with the appropriate license and permitted gears is allowed in the majority of the Reserve, but smaller zones prohibit extractive fishing. In the Caye Bokel Conservation Area, catch and release sport fishing is allowed with a valid license [93], and one traditional fisher is allowed to extract lobster, subject to catch limits and sharing catch data with management. Within the Conservation Area, there is a multi-species spawning aggregation site critical for sustaining commercial fish species [94] where all fishing is fully prohibited.
Based on deployment dates and system functioning, we collected data from November 2022 through January 2023 at the South La Jolla site and from April 2022 through October 2022 at the Caye Bokel site. Occasional gaps in monitoring occurred due to system maintenance, so we only considered data from days when both radar and AIS data were received. This resulted in 92 days of analysis at South La Jolla and 150 days at Caye Bokel. Radar tracks that duplicated AIS tracks, and those that were most likely false targets, were not included in analysis. Due to potential error in AIS track fusion and the machine learning model used to identify false targets, we consider radar data an estimate of activity sufficient to understand broad patterns in activity.
Tracks were classified by their source, radar or AIS, and further by whether or not they triggered a site-specific MPA alarm. Activity inside the MPA at each site was quantified in two ways: the number of unique track records detected (“tracks”) and the duration of time they lasted (“hours”). Detections were identified as inside or outside the MPA, and the time between consecutive points along each unique track was summed for both areas. The cumulative time summed across all tracks, which did not consider temporal overlap, was intended to best reflect the pressure of an activity on an area (e.g., [77,95]).
Tracks are intended to estimate the number of vessels that entered the MPA. Therefore, when there were multiple AIS tracks with the same vessel identification number over a unique day, these were considered a single track record. The same method could not be performed with radar-detected tracks since the radar system does not include vessel identification information. Therefore, radar track counts may overestimate the number of unique vessels. Images captured by the camera help site partners identify vessels, and we report the number of images collected.
To assess activity over time, we calculated track counts and hours over each unique day of analysis. These daily values were summed and averaged over the full study period and per day of the week to evaluate weekly activity patterns. We also calculated track counts and hours within each hour of the day to evaluate daily patterns. Finally, we generated track heat maps using tracks both inside and outside MPA boundaries to show the spatial distribution of activity. We determined the resolution of the spatial grid (249 m) using the radar positional error model defined in [28]. All analyses were conducted in R [96].
3. Results
Activity detected by AIS was common outside the MPAs, but, inside the MPAs, there was far more activity detected by radar compared to AIS at both case study sites (Figure 12). At South La Jolla, 94.8% of tracks observed in the MPA were detected by radar and accounted for 93.2% of track hours. The standard deviation values in Table 1 are meant to indicate the variability across days. At Caye Bokel, 94.5% of tracks in the MPA were detected by radar, accounting for 97.8% of track hours. There were over 200 images of radar-detected targets, on average, collected daily at South La Jolla and over 100 images at Caye Bokel.
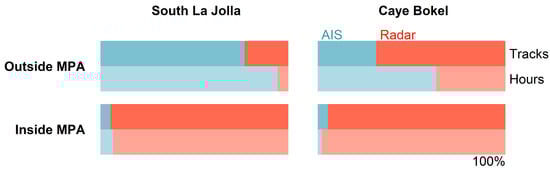
Figure 12.
Percentage of total tracks and track hours detected by radar or AIS outside and inside the MPAs at each case study site.

Table 1.
Total and daily average (with standard deviation) track counts, hours, and images collected of targets detected by radar or AIS inside the MPAs.
Temporal patterns of daily activity detected by radar over the full study period were not especially similar to AIS patterns at either case study site (Figure 13). At South La Jolla, tracks and hours followed similar patterns over time, but activity detected by radar peaked in November 2022, while AIS activity peaked roughly one month later. At Caye Bokel, radar tracks and hours followed different temporal patterns: hours peaked near the beginning of May 2022, but tracks peaked roughly one month later. AIS tracks peaked in May 2022 (similar to radar hours), but AIS hours peaked much later in August 2022.
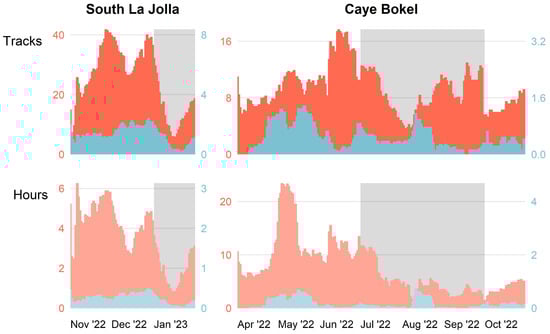
Figure 13.
Fourteen-day moving average of track counts and hours per day in the MPAs across the study period. Note that radar values are in red on the left side of each panel, and AIS values are in blue on the right side of each panel. Shaded areas indicate the closed season of local fisheries of interest: boat-based sport fishing for certain species of groundfish in southern California [97] and commercial, non-industrial fishing for Queen conch in Belize [91].
Weekly radar and AIS activity patterns at South La Jolla showed a general increase in both tracks and hours on weekends. The results were not similarly consistent at Caye Bokel (Figure 14): radar tracks in the MPA peaked on Wednesdays, but hours peaked on Sundays. The highest daily AIS track average occurred on Sundays, but hours peaked on Thursdays. At both sites, tracks that triggered the site-specific alarm generally followed similar weekly patterns to the overall track counts.
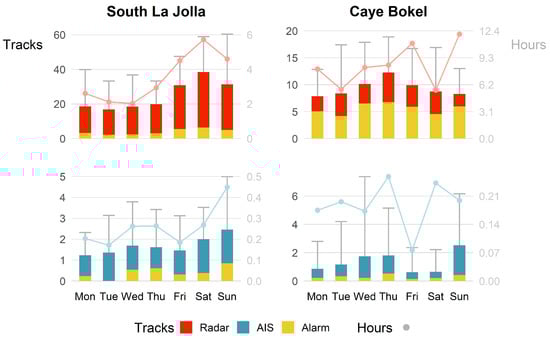
Figure 14.
Average daily tracks (with standard deviation) in the MPAs and average daily hours by day of the week. The percent of tracks that triggered the site-specific alarm are shown in yellow. At South La Jolla, the alarm is triggered when a track has a speed less than 3 knots (1.5 m/s) and remains in the MPA for more than 5 min. At Caye Bokel, the alarm is triggered when a track has a speed less than 5 knots (2.6 m/s) and remains in the MPA for more than 10 min.
Both the radar and AIS track counts followed similar patterns throughout the day at each site (Figure 15). At South La Jolla, tracks within the MPA began most often in the mid-day, although AIS tracks that triggered the alarm most often began early and late in the day. At Caye Bokel, the radar and AIS tracks, including those that triggered the alarm, peaked in the morning. At both sites, the hours spent in the MPA typically peaked along with the percentage of tracks triggering the alarm.
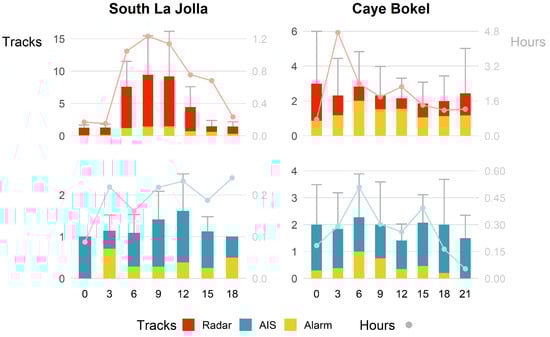
Figure 15.
Average daily tracks (with standard deviation) in the MPAs and average daily hours by the hour when first detected (grouped into 3-hour bins). Hours with zero tracks were ignored. The percent of tracks that triggered the site-specific alarm are shown in yellow. At South La Jolla, the alarm is triggered when a track has a speed less than 3 knots (1.5 m/s) and remains in the MPA for more than 5 min. At Caye Bokel, the alarm is triggered when a track has a speed less than 5 knots (2.6 m/s) and remains in the MPA for more than 10 min.
The highest concentration of radar tracks at South La Jolla was inside the MPA, while the highest concentration of AIS tracks was outside the southern boundary (Figure 16). At Caye Bokel, the radar tracks were concentrated in the MPA, including within the spawning aggregation site. There was a distinct pattern of AIS tracks just outside the eastern and southern boundaries.
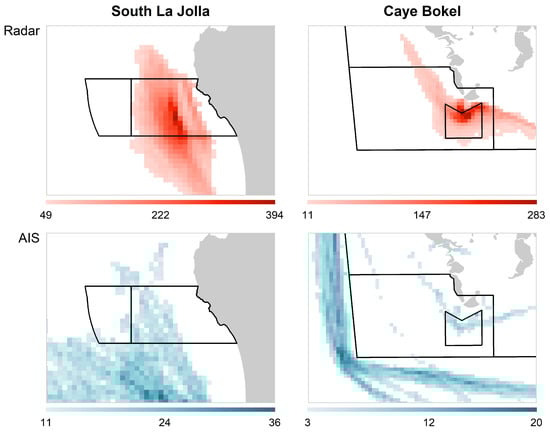
Figure 16.
Concentrated areas of all tracks across the study period. Only cells with track counts greater than the mean across all cells are shown. Black lines indicate boundaries of marine protected areas (MPAs).
4. Discussion
The results from the case study sites clearly demonstrate that a single source of data on vessel activity from a cooperative system (in this case, AIS) does not capture the majority of activity in these urban and remote MPAs. While these results are specific to the case study locations, information on non-cooperative vessel activity is especially relevant when small-scale vessels (likely not to be using AIS) are of particular interest to MPA management. For example, recreational fishing is common in the vicinity of the South La Jolla SMR [43], and these private vessels are not required to participate in AIS. In the Turneffe Atoll region, both small private tour boats and traditional fishing boats are active [91] and also are not required to participate in AIS.
Daily track counts and hours were highly variable at both sites over their respective study periods (Figure 13), resulting in a high standard deviation of the daily values (Table 1). While the case studies were intended to evaluate broad patterns of activity, more detailed analysis of track and image data could provide further detail on specific vessel types and activities and related temporal patterns (similar to [28]).
Activity patterns at the South La Jolla SMR were similar to the expected patterns of recreational activity: most tracks occurred on weekend days and during daylight hours. In California overall, the vast majority of citations are issued to recreational fishers compared to commercial [98], and, in the SMR, recreational fishing occurs more often than commercial [99]. While the analysis for this case study did not explicitly identify fishing activity, the concentration of radar-detected tracks inside the MPA (many likely to be recreational vessels) suggests that the system is detecting the established high rates of poaching in the SMR [89,100]. The study period was too short to capture changes in activity due to seasonality, although there was a steep decline in activity at the end of December 2022, which may have corresponded with the 1 January season closure of boat-based sport fishing for some local groundfish species [97]. Spiny lobster is an economically important fishery and a highly targeted species in the area [101], and both the commercial and recreational seasons were open for the full duration of the study period. It is important to note that all fishing is prohibited within the SMR even when fishing seasons are open.
In the Caye Bokel Conservation Area, the temporal differences in track counts and hours may be due to the seasonality of tourism. Vessels spent the most time in the MPA in May 2022 before the typical increase in rainfall began in June [91]. Private liveaboard scuba-diving trips operate in the area and were occasionally observed overnighting near Caye Bokel. While the time vessels spent in the MPA was generally lower after May, there were still peaks of track counts in June and September. Despite the typical decrease in tourism during this time, commercial and traditional fishing still occur, including during a popular Queen conch season, which is open until July 1st or until the conch quota has been met, and which reopens on 1 October [91]. Since radar-detected tracks were concentrated in the spawning aggregation site, the camera is valuable for helping managers identify specific vessels. While all fishing is prohibited within the site, dive boats and vessels from nearby resorts are often observed near the area, only some of which broadcast AIS data. With different types of users accessing Caye Bokel, multiple monitoring strategies are beneficial.
At both sites, the spatial distribution of radar-detected tracks did not match the distribution of AIS tracks (Figure 16). At the South La Jolla site, many vessels likely originate from Mission Bay, south of the MPA (Figure 11). The concentration of AIS tracks suggests that these vessels travel farther from shore, while radar-detected vessels remain closer to the coast. At Caye Bokel, radar tracks were similarly concentrated nearshore. The concentration of AIS tracks just beyond the MPA boundaries suggests most vessels broadcasting AIS purposefully avoid the area. These differences highlight the importance of utilizing radar to monitor small-scale, non-AIS vessels; looking at spatial patterns of AIS activity alone would mask the majority of activity, including within coastal MPAs.
Incorporating radar greatly expanded the dataset on vessel activity beyond AIS in these MPAs, but there are limitations to its use. Unlike cooperative systems, data collected by radar do not provide vessel or voyage information. Previous research and ongoing work by Global Fishing Watch and others uses AIS data to identify track features that indicate certain activities, such as commercial fishing [24,74,102]. Radar-detected track lines of recreational and small-scale fishing likely have different characteristics than larger-scale types of commercial fishing, but similar modeling approaches could be used to identify activities of interest (e.g., [103]). Image-processing techniques, such as object detection and classification, applied to images of radar-detected vessels, could also inform vessel identity. With the considerable number of images collected each day by the system (Table 1), integrating these strategies into the platform would help reduce the time required for manually reviewing track lines and images to identify radar-detected activity.
Both case studies showed that AIS and non-AIS vessels were active in the vicinity of MPAs. Therefore, radar can be complementary to cooperative vessel traffic systems in both urban and remote locations. Some vessels may intentionally disable their AIS transponder to evade detection when fishing illegally [25]. Vessels detected by non-cooperative systems, such as radar, could be compared with those broadcasting AIS, thus illuminating "dark" vessel activity (e.g., [66,104]). Future integration of vessel monitoring systems (VMS), commonly used to monitor commercial fisheries, into the M2 platform will support similar comparisons to data from that participatory system as well (e.g., [105,106]).
With ongoing development, it will be important to prioritize agnostic, generally applicable processes to maximize adoption by MPA managers and support adaptation into the future. Coastal areas will likely evolve with climate change, so systems and processes rigidly designed for unique locations and concerns may become ineffective [107]. The case studies presented here demonstrate how a coastal radar system can be used to document vessel activity in two different areas with different types of activity. This was accomplished by designing software to be used with different models of system hardware and defining simple parameters for identifying activities of interest.
The influence of human activity on coastal regions is substantial [108], and technologies for supporting management of small-scale fisheries in these areas have been called for in relation to many international goals [14]. The MPAs in the case studies presented here are relatively small compared to many that have been proposed and designated to meet global coverage targets [109] but are valuable for managing local fisheries. The localized remote sensing system described here is ideal for both targeted monitoring of small-scale vessel activity and integration with cooperative systems to ultimately provide a more comprehensive understanding of vessel traffic. Real-time access to data and the opportunity to summarize activity over time and space, demonstrated in the case studies, support active and adaptive MPA monitoring and enforcement in both urban and remote coastal areas.
5. Conclusions
The integrated radar system described in this paper is at the appropriate scale to meet the needs of local MPA managers. It provides persistent monitoring, uses common and accessible technologies, and tracks vessels within a range that matches the size of smaller MPAs. The case study results highlight how coastal radar systems can be sufficient for understanding both broad patterns in activities and fine-scale vessel behaviors in nearshore MPAs for which other non-cooperative systems may not be suitable at this time. The autonomous data collection provides a continuous record of vessel activity over space and time, and the purposeful similarity in data structure to AIS, an established source of vessel data for conservation-based assessments, also helps facilitate adoption and understanding. With approachable tools, technology can be effectively utilized to support management of MPAs and small-scale fisheries.
Author Contributions
Conceptualization, S.C., V.Z. and B.T.; methodology, V.Z. and S.C.; software, V.Z.; validation, L.G. and A.A.; formal analysis, S.C.; investigation, B.T. and V.Z.; resources, B.T., L.G. and A.A.; data curation, S.C. and V.Z.; writing—original draft preparation, S.C. and V.Z.; writing—review and editing, S.C., B.T., V.Z., L.G. and A.A.; visualization, S.C.; supervision, B.T. and V.Z.; project administration, B.T., L.G. and A.A. All authors have read and agreed to the published version of the manuscript.
Funding
This research received no external funding.
Data Availability Statement
The data presented in this study are available on request from the corresponding author. The data are not publicly available due to a case study site that was located at a private residence. Therefore, there are safety and ethical concerns related to openly sharing underlying data that could reveal the exact location. We confirm that all data will be made freely available to other researchers upon request.
Acknowledgments
The authors wish to acknowledge the staff at the Anthropocene Institute, WILDCOAST, and the Turneffe Atoll Sustainability Association (TASA) that have assisted with M2 overall and at the South La Jolla and Turneffe Atoll sites specifically. This work would not be possible without those that first identified and prepared the site locations, helped install hardware in the field, and maintain system functioning. We wish to specifically recognize Joe Cooper of WILDCOAST for overall project support and his wealth of local knowledge in southern California and the Chatten-Brown family. At Turneffe Atoll, thank you to all the TASA Conservation Officers for their daily sacrifice and commitment to protecting Belize’s natural wealth. The authors also wish to thank Global Conservation for their enduring support at these sites and others around the world.
Conflicts of Interest
The authors declare no conflict of interest.
References
- Convention on Biological Diversity. First Draft of the Post-2020 Global Biodiversity Framework CBD/WG2020/3/3. 2021. Available online: https://www.cbd.int/doc/c/abb5/591f/2e46096d3f0330b08ce87a45/wg2020-03-03-en.pdf (accessed on 13 April 2023).
- Maxwell, S.M.; Ban, N.C.; Morgan, L.E. Pragmatic approaches for effective management of pelagic marine protected areas. Endanger. Species Res. 2014, 26, 59–74. [Google Scholar] [CrossRef]
- Wilhelm, T.; Sheppard, C.R.C.; Sheppard, A.L.S.; Gaymer, C.F.; Parks, J.; Wagner, D.; Lewis, N. Large marine protected areas–advantages and challenges of going big. Aquat. Conserv. 2014, 24, 24–30. [Google Scholar] [CrossRef]
- Rowlands, G.; Brown, J.; Soule, B.; Boluda, P.T.; Rogers, A.D. Satellite surveillance of fishing vessel activity in the Ascension Island Exclusive Economic Zone and Marine Protected Area. Mar. Policy 2019, 101, 39–50. [Google Scholar] [CrossRef]
- White, T.D.; Ong, T.; Ferretti, F.; Block, B.A.; McCauley, D.J.; Micheli, F.; de Leo, G.A. Tracking the response of industrial fishing fleets to large marine protected areas in the Pacific Ocean. Conserv. Biol. 2020, 34, 1571–1578. [Google Scholar] [CrossRef]
- Albers, H.J.; Ashworth, M.F. Economics of marine protected areas: Assessing the literature for marine protected area network expansions. Annu. Rev. Resour. Econ. 2022, 14, 533–554. [Google Scholar] [CrossRef]
- Bayley, D.T.I.; Mogg, A.O.M.; Purvis, A.; Koldewey, H.J. Evaluating the efficacy of small-scale marine protected areas for preserving reef health: A case study applying emerging monitoring technology. Aquat. Conserv. 2019, 29, 2026–2044. [Google Scholar] [CrossRef]
- Mascia, M.B.; Claus, C.A.; Naidoo, R. Impacts of marine protected areas on fishing communities. Conserv. Biol. 2010, 24, 1424–1429. [Google Scholar] [CrossRef]
- Gill, D.A.; Mascia, M.B.; Ahmadia, G.N.; Glew, L.; Lester, S.E.; Barnes, M.; Craigie, I.; Darling, E.S.; Free, C.M.; Geldmann, J.; et al. Capacity shortfalls hinder the performance of marine protected areas globally. Nature 2017, 543, 665–669. [Google Scholar] [CrossRef]
- Appleton, M.R.; Courtiol, A.; Emerton, L.; Slade, J.L.; Tilker, A.; Warr, L.C.; Malvido, M.A.; Barborak, J.R.; de Bruin, L.; Chapple, R.; et al. Protected area personnel and ranger numbers are insufficient to deliver global expectations. Nat. Sustain. 2022, 5, 1100–1110. [Google Scholar] [CrossRef]
- Kanjir, U.; Greidanus, H.; Oštir, K. Vessel detection and classification from spaceborne optical images: A literature survey. Remote Sens. Environ. 2018, 207, 1–26. [Google Scholar] [CrossRef]
- Snapir, B.; Waine, T.W.; Biermann, L. Maritime vessel classification to monitor fisheries with SAR: Demonstration in the North Sea. Remote Sens. 2019, 11, 353. [Google Scholar] [CrossRef]
- Song, J.; Kim, D.; Kang, K. Automated procurement of training data for machine learning algorithm on ship detection using AIS information. Remote Sens. 2020, 12, 1443. [Google Scholar] [CrossRef]
- Morgera, E.; Ntona, M. Linking small-scale fisheries to international obligations on marine technology transfer. Mar. Policy 2018, 93, 295–306. [Google Scholar] [CrossRef]
- Marine Monitor: Solution for Situational Awareness of the Nearshore Marine Environment. Available online: https://m2marinemonitor.com/ (accessed on 18 April 2023).
- Robards, M.D.; Silber, G.K.; Adams, J.D.; Arroyo, J.; Lorenzini, D.; Schwehr, K.; Amos, J. Conservation science and policy applications of the marine vessel Automatic Identification System (AIS)—A review. Bull. Mar. Sci. 2016, 92, 75–103. [Google Scholar] [CrossRef]
- McCauley, D.J.; Woods, P.; Sullivan, B.; Bergman, B.; Jablonicky, C.; Roan, A.; Hirshfield, M.; Boerder, K.; Worm, B. Ending hide and seek at sea. Science 2016, 351, 1148–1150. [Google Scholar] [CrossRef]
- Dureuil, M.; Boerder, K.; Burnett, K.A.; Froese, R.; Worm, B. Elevated trawling inside protected areas undermines conservation outcomes in a global fishing hot spot. Science 2018, 362, 1403–1407. [Google Scholar] [CrossRef] [PubMed]
- Tassetti, A.N.; Ferrà, C.; Fabi, G. Rating the effectiveness of fishery-regulated areas with AIS data. Ocean Coast. Manag. 2019, 175, 90–97. [Google Scholar] [CrossRef]
- Perry, A.L.; Blanco, J.; García, S.; Fournier, N. Extensive use of habitat-damaging fishing gears inside habitat-protecting marine protected areas. Front. Mar. Sci. 2022, 9, 811926. [Google Scholar] [CrossRef]
- Iacarella, J.C.; Burke, L.; Davidson, I.C.; DiBacco, C.; Therriault, T.W.; Dunham, A. Unwanted networks: Vessel traffic heightens the risk of invasions in marine protected areas. Biol. Conserv. 2020, 245, 108553. [Google Scholar] [CrossRef]
- Boljat, H.U.; Grubišić, N.; Slišković, M. The impact of nautical activities on the environment—A systematic review of research. Sustainability 2021, 13, 10552. [Google Scholar] [CrossRef]
- Meijles, E.W.; Daams, M.N.; Ens, B.J.; Heslinga, J.H.; Sijtsma, F.J. Tracked to protect—Spatiotemporal dynamics of recreational boating in sensitive marine natural areas. Appl. Geogr. 2021, 130, 102441. [Google Scholar] [CrossRef]
- Kroodsma, D.A.; Mayorga, J.; Hochberg, T.; Miller, N.A.; Boerder, K.; Ferretti, F.; Wilson, A.; Bergman, B.; White, T.D.; Block, B.A.; et al. Tracking the global footprint of fisheries. Science 2018, 359, 904–908. [Google Scholar] [CrossRef] [PubMed]
- Welch, H.; Clavelle, T.; White, T.D.; Cimino, M.A.; Van Osdel, J.; Hochberg, T.; Kroodsma, D.; Hazen, E.L. Hot spots of unseen fishing vessels. Sci. Adv. 2022, 8, eabq2109. [Google Scholar] [CrossRef] [PubMed]
- Bunwaree, P. The illegality of fishing vessels ‘going dark’ and methods of deterrence. Int. Comp. Law Q. 2023, 72, 179–211. [Google Scholar] [CrossRef]
- Taconet, M.; Kroodsma, D.; Fernandes, J.A. Global Atlas of AIS-Based Fishing Activity—Challenges and Opportunities; Food and Agriculture Organization (FAO): Rome, Italy, 2019; Available online: https://agris.fao.org/agris-search/search.do?recordID=XF2020000847 (accessed on 14 April 2023).
- Cope, S.; Hines, E.; Bland, R.; Davis, J.D.; Tougher, B.; Zetterlind, V. Application of a new shore-based vessel traffic monitoring system within San Francisco Bay. Front. Mar. Sci. 2020, 7, 86. [Google Scholar] [CrossRef]
- Iacarella, J.C.; Burke, L.; Clyde, G.; Wicks, A.; Clavelle, T.; Dunham, A.; Rubidge, E.; Woods, P. Application of AIS- and flyover-based methods to monitor illegal and legal fishing in Canada’s Pacific marine conservation areas. Conserv. Sci. Pract. 2023, e12926. [Google Scholar] [CrossRef]
- O’Hara, P.D.; Serra-Sogas, N.; McWhinnie, L.; Pearce, K.; Le Baron, N.; O’Hagan, G.; Nesdoly, A.; Marques, T.; Canessa, R. Automated identification system for ships data as a proxy for marine vessel related stressors. Sci. Total Environ. 2023, 865, 160987. [Google Scholar] [CrossRef]
- Soldi, G.; Gaglione, D.; Forti, N.; Di Simone, A.; Daffin, F.C.; Bottini, G.; Quattrociocchi, D.; Millefiori, L.M.; Braca, P.; Carniel, S.; et al. Space-based global maritime surveillance. Part I: Satellite technologies. IEEE Aerosp. Electron. Syst. Mag. 2021, 36, 8–28. [Google Scholar] [CrossRef]
- Marino, A.; Sanjuan-Ferrer, M.J.; Hajnsek, I.; Ouchi, K. Ship detection with spectral analysis of synthetic aperture radar: A comparison of new and well-known algorithms. Remote Sens. 2015, 7, 5416–5439. [Google Scholar] [CrossRef]
- Stasolla, M.; Mallorqui, J.J.; Margarit, G.; Santamaria, C.; Walker, N. A comparative study of operational vessel detectors for maritime surveillance using satellite-borne synthetic aperture radar. IEEE J. Sel. Top. Appl. Earth Obs. Remote Sens. 2016, 9, 2687–2701. [Google Scholar] [CrossRef]
- Reggiannini, M.; Righi, M.; Tampucci, M.; Duca, A.L.; Bacciu, C.; Bedini, L.; D’Errico, A.; Di Paola, C.; Marchetti, A.; Martinelli, M.; et al. Remote sensing for maritime prompt monitoring. J. Mar. Sci. Eng. 2019, 7, 202. [Google Scholar] [CrossRef]
- Ruiz, J.; Caballero, I.; Navarro, G. Sensing the same fishing fleet with AIS and VIIRS: A seven-year assessment of squid jiggers in FAO major fishing area 41. Remote Sens. 2019, 12, 32. [Google Scholar] [CrossRef]
- Li, Y.; Song, L.; Zhao, S.; Zhao, D.; Wu, Y.; You, G.; Kong, A.; Xi, X.; Yu, Z. Nighttime fishing vessel observation in Bohai Sea based on VIIRS fishing vessel detection product (VBD). Fish. Res. 2023, 258, 106539. [Google Scholar] [CrossRef]
- Elvidge, C.D.; Zhizhin, M.; Baugh, K.; Hsu, F. Automatic boat identification system for VIIRS low light imaging data. Remote Sens. 2015, 7, 3020–3036. [Google Scholar] [CrossRef]
- Tsuda, M.E.; Miller, N.A.; Saito, R.; Park, J.; Oozeki, Y. Automated VIIRS boat detection based on machine learning and its application to monitoring fisheries in the East China Sea. Remote Sens. 2023, 15, 2911. [Google Scholar] [CrossRef]
- Yao, Y.; Jiang, Z.; Zhang, H.; Zhou, Y. On-board ship detection in micro-nano satellite based on deep learning and COTS component. Remote Sens. 2019, 11, 762. [Google Scholar] [CrossRef]
- Christopher, K. Port Security Management, 2nd ed.; CRC Press: Boca Raton, FL, USA, 2014. [Google Scholar] [CrossRef]
- Watson, G.J.; Murray, J.M.; Schaefer, M.; Bonner, A. Successful local marine conservation requires appropriate educational methods and adequate enforcement. Mar. Policy 2015, 52, 59–67. [Google Scholar] [CrossRef]
- Hartill, B.W.; Taylor, S.M.; Keller, K.; Weltersbach, M.S. Digital camera monitoring of recreational fishing effort: Applications and challenges. Fish Fish. 2020, 21, 204–215. [Google Scholar] [CrossRef]
- Parnell, P.E.; Dayton, P.K.; Fisher, R.A.; Loarie, C.C.; Darrow, R.D. Spatial patterns of fishing effort off San Diego: Implications for zonal management and ecosystem function. Ecol. Appl. 2010, 20, 2203–2222. [Google Scholar] [CrossRef]
- Keller, K.; Steffe, A.S.; Lowry, M.; Murphy, J.J.; Suthers, I.M. Monitoring boat-based recreational fishing effort at a nearshore artificial reef with a shore-based camera. Fish. Res. 2016, 181, 84–92. [Google Scholar] [CrossRef]
- Wood, G.; Lynch, T.P.; Devine, C.; Keller, K.; Figueira, W. High-resolution photo-mosaic time-series imagery for monitoring human use of an artificial reef. Ecol. Evol. 2016, 6, 6963–6968. [Google Scholar] [CrossRef]
- Lancaster, D.; Dearden, P.; Haggarty, D.R.; Volpe, J.P.; Ban, N.C. Effectiveness of shore-based remote camera monitoring for quantifying recreational fisher compliance in marine conservation areas. Aquat. Conserv. 2017, 27, 804–813. [Google Scholar] [CrossRef]
- Powers, S.P.; Anson, K. Estimating recreational effort in the Gulf of Mexico red snapper fishery using boat ramp Cameras: Reduction in federal season length does not proportionally reduce catch. N. Am. J. Fish. Manag. 2016, 36, 1156–1166. [Google Scholar] [CrossRef]
- Hartill, B.W.; Payne, G.W.; Rush, N.; Bian, R. Bridging the temporal gap: Continuous and cost-effective monitoring of dynamic recreational fisheries by web cameras and creel surveys. Fish. Res. 2016, 183, 488–497. [Google Scholar] [CrossRef]
- Wawrzyniak, N.; Hyla, T.; Popik, A. Vessel detection and tracking method based on video surveillance. Sensors 2019, 19, 5230. [Google Scholar] [CrossRef] [PubMed]
- Carić, H.; Cukrov, N.; Omanović, D. Nautical tourism in marine protected areas (MPAs): Evaluating an impact of copper emission from antifouling coating. Sustainability 2021, 13, 11897. [Google Scholar] [CrossRef]
- Harasti, D.; Davis, T.R.; Jordan, A.; Erskine, L.; Moltschaniwskyj, N. Illegal recreational fishing causes a decline in a fishery targeted species (Snapper: Chrysophrys auratus) within a remote no-take marine protected area. PLoS ONE 2019, 14, e0209926. [Google Scholar] [CrossRef]
- International Association of Marine Aids to Navigation and Lighthouse Authorities. IALA VTS Manual Ed. 8.2. International Association of Marine Aids to Navigation and Lighthouse Authorities. 2022. Available online: https://www.iala-aism.org/product/m0002/ (accessed on 10 June 2023).
- Xiao, Z.; Fu, X.; Zhang, L.; Goh, R.S.M. Traffic pattern mining and forecasting technologies in maritime traffic service networks: A comprehensive survey. IEEE Trans. Intell. Transp. Syst. 2019, 21, 1796–1825. [Google Scholar] [CrossRef]
- Xiao, Z.; Fu, X.; Zhao, L.; Zhang, L.; Teo, T.K.; Li, N.; Zhang, W.; Qin, Z. Next-generation vessel traffic services systems—From “passive” to “proactive”. IEEE Intell. Transp. Syst. Mag. 2022, 15, 363–377. [Google Scholar] [CrossRef]
- Li, J.; Yang, Y.; Li, X.; Sun, J.; Li, R. Knowledge-transfer-based bidirectional vessel monitoring system for remote and nearshore images. J. Mar. Sci. Eng. 2023, 11, 1068. [Google Scholar] [CrossRef]
- Dekker, R.; Bouma, H.; den Breejen, E.; van den Broek, B.; Hanckmann, P.; Hogervorst, M.; Mohamoud, A.; Schoemaker, R.; Sijs, J.; Tan, R.; et al. Maritime situation awareness capabilities from satellite and terrestrial sensor systems. In Proceedings of the Maritime Systems and Technology Conference and Exhibition, (MAST Europe), Gdansk, Poland, 4–6 June 2013. [Google Scholar]
- Khan, C.B.; Goetz, K.T.; Cubaynes, H.C.; Robinson, C.; Murnane, E.; Aldrich, T.; Sackett, M.; Clarke, P.J.; LaRue, M.A.; White, T.; et al. A biologist’s guide to the galaxy: Leveraging artificial intelligence and very high-resolution satellite imagery to monitor marine mammals from space. J. Mar. Sci. Eng. 2023, 11, 595. [Google Scholar] [CrossRef]
- Martellato, E.; Piccirillo, A.M.; Ferraioli, G.; Rotundi, A.; Della Corte, V.; Palumbo, P.; Alcaras, E.; Appolloni, L.; Aulicino, G.; Bertini, I.; et al. A new orbiting deployable system for small satellite observations for ecology and Earth observation. Remote Sens. 2022, 14, 2066. [Google Scholar] [CrossRef]
- Lin, Y.; Li, J.; Zhou, Z.; Luo, Q.; Wang, C.; Yan, X. Simulation analysis of the satellite coverage performance for identifying illegal fishing in target sea area. In Proceedings of the 2022 Global Reliability and Prognostics and Health Management (PHM-Yantai), Yantai, China, 13–16 October 2022. [Google Scholar] [CrossRef]
- Lin, B.; Huang, C. Comparison between ARPA radar and AIS characteristics for vessel traffic services. J. Mar. Sci. Technol. 2006, 14, 7. [Google Scholar] [CrossRef]
- Kazimierski, W.; Stateczny, A. Radar and Automatic Identification System track fusion in an electronic chart display and information system. J. Navig. 2015, 68, 1141–1154. [Google Scholar] [CrossRef]
- Zainuddin, S.; Pasya, I.; Rashid, N.E.; Zaiaami, N.; Maryam, A.; Abdullah, R.; Ali, M.S. Maritime radar: A review on techniques for small Vessel detection. Int. J. Electr. Electron. Syst. Res. 2019, 14, 30–45. [Google Scholar]
- López, J.J.; Mulero-Pázmány, M. Drones for conservation in protected areas: Present and future. Drones 2018, 3, 10. [Google Scholar] [CrossRef]
- Provost, E.J.; Butcher, P.A.; Coleman, M.A.; Kelaher, B.P. Assessing the viability of small aerial drones to quantify recreational fishers. Fish. Manag. Ecol. 2020, 27, 615–621. [Google Scholar] [CrossRef]
- Molina-Molina, J.C.; Salhaoui, M.; Guerrero-González, A.; Arioua, M. Autonomous marine robot based on AI recognition for permanent surveillance in marine protected areas. Sensors 2021, 21, 2664. [Google Scholar] [CrossRef] [PubMed]
- Kurekin, A.A.; Loveday, B.R.; Clements, O.; Quartly, G.D.; Miller, P.I.; Wiafe, G.; Agyekum, K.A. Operational monitoring of illegal fishing in Ghana through exploitation of satellite Earth observation and AIS data. Remote Sens. 2019, 11, 293. [Google Scholar] [CrossRef]
- Park, J.; Lee, J.; Seto, K.; Hochberg, T.; Wong, B.A.; Miller, N.A.; Takasaki, K.; Kubota, H.; Oozeki, Y.; Doshi, S.; et al. Illuminating dark fishing fleets in North Korea. Sci. Adv. 2020, 6, eabb1197. [Google Scholar] [CrossRef] [PubMed]
- TimeZero Coastal Monitoring. Available online: https://www.coastalmonitoring.com/ (accessed on 18 April 2023).
- French, A.P. How far away is the horizon? Am. J. Phys. 1982, 50, 795–799. [Google Scholar] [CrossRef]
- Bole, A.G.; Wall, A.D.; Norris, A. Radar and ARPA Manual: Radar, AIS, and Target Tracking for Marine Radar Users, 3rd ed.; Butterworth-Heinemann: Oxford, UK, 2014; ISBN 978-0080977522. [Google Scholar]
- Nobeltec TimeZero User Guide; TIMEZERO, 2023. Available online: https://userguide.mytimezero.com/tz-coastal-monitoring (accessed on 18 April 2023).
- Furuno Software Development Kit. Available online: https://www.furunousa.com/en/sdk (accessed on 18 April 2023).
- Lee, J.; South, A.B.; Jennings, S. Developing reliable, repeatable, and accessible methods to provide high resolution estimates of fishing-effort distributions from vessel monitoring system (VMS) data. ICES J. Mar. Sci. 2010, 67, 1260–1271. [Google Scholar] [CrossRef]
- de Souza, E.N.; Boerder, K.; Matwin, S.; Worm, B. Improving fishing pattern detection from satellite AIS using data mining and machine learning. PLoS ONE 2016, 11, e0158248. [Google Scholar] [CrossRef]
- Huang, H.; Hong, F.; Liu, J.; Liu, C.; Feng, Y.; Guo, Z. FVID: Fishing vessel type identification based on VMS trajectories. J. Ocean Univ. China 2018, 18, 403–412. [Google Scholar] [CrossRef]
- Cope, S.; Zetterlind, V.; Tougher, B. Integrating marine radar in a multi-sensor platform for remote, unsupervised vessel tracking in the nearshore environment. In Proceedings of the Global Oceans 2020: Singapore—U.S. Gulf Coast, Biloxi, MS, USA, 5–20 October 2020; pp. 1–5. [Google Scholar] [CrossRef]
- Cope, S.; Tougher, B.; Morten, J.; Pukini, C.; Zetterlind, V. Coastal radar as a tool for continuous and fine-scale monitoring of vessel activities of interest in the vicinity of marine protected areas. PLoS ONE 2022, 17, e0269490. [Google Scholar] [CrossRef] [PubMed]
- Jianmin, Z.; Jie, W. Intelligent vessel dynamics video monitoring system based on AIS data. In Proceedings of the 2009 IEEE International Conference on Systems, Man and Cybernetics, San Antonio, TX, USA, 11–14 October 2009. [Google Scholar] [CrossRef]
- Yoshihara, K.; Yamamoto, S.; Hashimoto, T. Real-time tracking of offshore vessel using pan-tilt camera for keeping a lookout. Mar. Eng. 2018, 53, 429–434. [Google Scholar] [CrossRef]
- Loomans, M.J.H.; de With, P.H.N.; Wijnhoven, R.G.J. Robust automatic ship tracking in harbours using active cameras. In Proceedings of the 2013 IEEE International Conference on Image Processing, Melbourne, Australia, 15–18 September 2013. [Google Scholar] [CrossRef]
- Helgesen, H.H.; Leira, F.S.; Fossen, T.I.; Johansen, T.A. Tracking of ocean surface objects from unmanned aerial vehicles with a pan/tilt unit using a thermal camera. J. Intell. Robot. Syst. 2018, 91, 775–793. [Google Scholar] [CrossRef]
- Sabirin, H.; Bäse, G. Video surveillance of today: Compressed domain object detection, ONVIF web services based system component communication and standardized data storage and export using VSAF—A walkthrough. In Video Surveillance; Lin, W., Ed.; Intech: London, UK, 2011; pp. 37–54. ISBN 978-953-307-436-8. [Google Scholar]
- Nguyen, K.Q.; Winger, P.D. Artificial light in commercial industrialized fishing applications: A review. Rev. Fish. Sci. Aquac. 2018, 27, 106–126. [Google Scholar] [CrossRef]
- International Telecommunication Union. Recommendation M.1371-5 Technical Characteristics for an Automatic Identification System Using Time Division Multiple Access in the VHF Maritime Mobile Frequency Band; International Telecommunication Union: Geneva, Switzerland, 2014; Available online: https://www.itu.int/rec/R-REC-M.1371-5-201402-I/en (accessed on 10 June 2023).
- Todd, P.A.; Heery, E.C.; Loke, L.H.L.; Thurstan, R.H.; Kotze, D.J.; Swan, C. Towards an urban marine ecology: Characterizing the drivers, patterns and processes of marine ecosystems in coastal cities. Oikos 2019, 128, 1215–1242. [Google Scholar] [CrossRef]
- Weekers, D.P.; Zahnow, R.; Mazerolle, L. Conservation criminology: Modelling offender target selection for illegal fishing in marine protected areas. Br. J. Criminol. 2019, 59, 1455–1477. [Google Scholar] [CrossRef]
- Nickols, K.J.; White, J.W.; Malone, D.; Carr, M.H.; Starr, R.M.; Baskett, M.L.; Hastings, A.; Botsford, L.W. Setting ecological expectations for adaptive management of marine protected areas. J. Appl. Ecol. 2019, 56, 2376–2385. [Google Scholar] [CrossRef]
- Albers, H.J.; Preonas, L.; Capitán, T.; Robinson, E.J.Z.; Madrigal-Ballestero, R. Optimal siting, sizing, and enforcement of marine protected areas. Environ. Resour. Econ. 2020, 77, 229–269. [Google Scholar] [CrossRef]
- California Department of Fish and Wildlife. California’s Marine Protected Area Network Decadal Management Review; California Department of Fish and Wildlife: Sacramento, CA, USA, 2022. Available online: https://wildlife.ca.gov/Conservation/Marine/MPAs/Management/Decadal-Review (accessed on 16 April 2023).
- California Department of Fish and Wildlife. MPA Outreach Materials; California Department of Fish and Wildlife: Sacramento, CA, USA, 2016. Available online: https://wildlife.ca.gov/Conservation/Marine/MPAs/Outreach-Materials (accessed on 16 April 2023).
- Belize Fisheries Department. Turneffe Atoll Marine Reserve Management Plan; Belize Fisheries Department: Belize City, Belize, 2011; Available online: http://www.turneffeatollmarinereserve.org/reserve-management (accessed on 16 April 2023).
- Rader, D.; Requena, N.; Wade, B.; Burden, M. Combining rights-based management with science-based marine protected area networks to sustain fisheries against climate impacts in Belize. In Adaptive Management of Fisheries in Response to Climate Change; FAO Fisheries and Aquaculture Technical Paper No., 667, Bahri, T., Vasconcellos, M., Welch, D.J., Johnson, J., Perry, R.I., Ma, X., Sharma, R., Eds.; Food and Agriculture Organization (FAO): Rome, Italy, 2021; pp. 115–126. ISBN 978-92-5-133890-2. [Google Scholar]
- Belize Fisheries Department. Statutory Instrument No. 111 of 2012 Fisheries (Turneffe Atoll Marine Reserve) Regulations; Belize Fisheries Department: Belize City, Belize, 2012. Available online: http://www.turneffeatollmarinereserve.org/reserve-management (accessed on 16 April 2023).
- Belize Fisheries Department. Statutory Instrument No. 161 of 2003 Fisheries (Spawning Aggregation Site Reserves) Order; Belize Fisheries Department: Belize City, Belize, 2003. Available online: http://www.spagbelize.org/Legislation.aspx (accessed on 16 April 2023).
- Stelzenmüller, V.; Rogers, S.I.; Mills, C.M. Spatio-temporal patterns of fishing pressure on UK marine landscapes, and their implications for spatial planning and management. ICES J. Mar. Sci. 2008, 65, 1081–1091. [Google Scholar] [CrossRef]
- R: A Language and Environment for Statistical Computing. R Core Team: Vienna, Austria, 2022. Available online: https://www.R-project.org/ (accessed on 17 April 2023).
- California Department of Fish and Wildlife. Ocean Sport Fishing Regulations; California Department of Fish and Wildlife: Sacramento, CA, USA, 2022. Available online: https://wildlife.ca.gov/Fishing/Ocean/Regulations/Sport-Fishing (accessed on 17 April 2023).
- California Department of Fish and Wildlife. Law Enforcement Division Citation Summary 2011; California Department of Fish and Wildlife: Sacramento, CA, USA, 2011. Available online: https://nrm.dfg.ca.gov/FileHandler.ashx?DocumentID=86746&inline (accessed on 17 April 2023).
- Ford, T.; Burdick, H.; Barilotti, A.; House, P. Aerial Monitoring of Ocean Vessels in Southern California, March 2017–Annual Project Report; The Bay Foundation, LightHawk, Vantuna Research Group. 2017. Available online: http://www.santamonicabay.org/wp-content/uploads/2014/04/The-Bay-Foundation-Aerial-Monitoring-March-2017-Final.pdf (accessed on 17 April 2023).
- Kemsley, A.; Pukini, C. Marine Protected Area Watch and Marine Monitor (M2) RADAR technology: Case studies in anthropogenic use monitoring in California’s marine protected areas. In Proceedings of the OCEANS 2021: San Diego—Porto, San Diego, CA, USA, 20–23 September 2021; pp. 1–5. [Google Scholar] [CrossRef]
- Hovel, K.A.; Neilson, D.J.; Parnell, E. California Spiny Lobster (Panulirus interruptus), California South Coast MPA Baseline Study, 2012 to 2013; South Coast Lobster Research Group. 2015. Available online: https://data.ca.gov/dataset/california-spiny-lobster-panulirus-interruptus-california-south-coast-mpa-baseline-study-2-2013 (accessed on 17 April 2023).
- Guan, Y.; Zhang, J.; Zhang, X.; Li, Z.; Meng, J.; Liu, G.; Bao, M.; Cao, C. Identification of fishing vessel types and analysis of seasonal activities in the northern South China Sea based on AIS data: A case study of 2018. Remote Sens. 2021, 13, 1952. [Google Scholar] [CrossRef]
- Behivoke, F.; Etienne, M.; Guitton, J.; Randriatsara, R.M.; Ranaivoson, E.; Léopold, M. Estimating fishing effort in small-scale fisheries using GPS tracking data and random forests. Ecol. Indic. 2021, 123, 107321. [Google Scholar] [CrossRef]
- Roger, M.; Guida, R. Classification-aided SAR and AIS data fusion for space-based maritime surveillance. Remote Sens. 2020, 13, 104. [Google Scholar] [CrossRef]
- Hsu, F.; Elvidge, C.D.; Baugh, K.; Zhizhin, M.; Ghosh, T.; Kroodsma, D.; Susanto, A.; Budy, W.; Riyanto, M.; Nurzeha, R.; et al. Cross-matching VIIRS boat detections with vessel monitoring system tracks in Indonesia. Remote Sens. 2019, 11, 995. [Google Scholar] [CrossRef]
- Li, J.; Cai, Y.; Zhang, P.; Zhang, Q.; Jing, Z.; Wu, Q.; Qiu, Y.; Ma, S.; Chen, Z. Satellite observation of a newly developed light-fishing “hotspot” in the open South China Sea. Remote Sens. Environ. 2021, 256, 112312. [Google Scholar] [CrossRef]
- Toimil, A.; Losada, I.J.; Nicholls, R.J.; Dalrymple, R.A.; Stive, M.J.F. Addressing the challenges of climate change risks and adaptation in coastal areas: A review. Coast. Eng. 2020, 156, 103611. [Google Scholar] [CrossRef]
- Allan, H.; Levin, N.; Kark, S. Quantifying and mapping the human footprint across Earth’s coastal areas. Ocean Coast. Manag. 2023, 236, 106476. [Google Scholar] [CrossRef]
- Toonen, R.J.; Wilhelm, T.; Maxwell, S.M.; Wagner, D.; Bowen, B.W.; Sheppard, C.R.C.; Taei, S.M.; Teroroko, T.; Moffitt, R.; Gaymer, C.F.; et al. One size does not fit all: The emerging frontier in large-scale marine conservation. Mar. Pollut. Bull. 2013, 77, 7–10. [Google Scholar] [CrossRef] [PubMed]


Disclaimer/Publisher’s Note: The statements, opinions and data contained in all publications are solely those of the individual author(s) and contributor(s) and not of MDPI and/or the editor(s). MDPI and/or the editor(s) disclaim responsibility for any injury to people or property resulting from any ideas, methods, instructions or products referred to in the content. |
© 2023 by the authors. Licensee MDPI, Basel, Switzerland. This article is an open access article distributed under the terms and conditions of the Creative Commons Attribution (CC BY) license (https://creativecommons.org/licenses/by/4.0/).